
Forced Convection in Porous Medium Using Triply Periodical Minimum Surfaces


1
Department of Mechanical and Industrial Engineering, Toronto Metropolitan University, Toronto, ON M5B 2K3, Canada
2
Transport Cargo Systems, Tashkent State Transport University, Tashkent 100167, Uzbekistan
*
Author to whom correspondence should be addressed.
Fluids 2023, 8(12), 311; https://doi.org/10.3390/fluids8120311
Submission received: 3 November 2023
/
Revised: 22 November 2023
/
Accepted: 27 November 2023
/
Published: 29 November 2023
(This article belongs to the Special Issue Phase Change and Convective Heat Transfer)
Abstract
:Recent developments in the 3D printing of metals are attracting many researchers and engineers. Tailoring a porous structure using triply periodic minimum surfaces is becoming an excellent approach for cooling electronic equipment. The availability of metallic 3D printing encourages researchers to study cooling systems using porous media. In the present article, we designed a porous structure using a gyroid model produced using 3D printing. Porous aluminum has a 0.7, 0.8, and 0.9 porosity, respectively. The porous medium is tested experimentally using distilled fluid as the cooling liquid, while the structure is subject to bottom heating with a heat flux of 30,000 W/m2. A different inlet velocity from 0.05 m/s to 0.25 m/s is applied. On the numerical side, the porous medium is modeled as a porous structure, and only the Navier–Stokes equations and the energy equation were solved using the finite element technique. In addition, an excellent agreement between the experimental measurement and numerical calculation, an optimum porosity of 0.8 was obtained. The performance evaluation criterion led us to believe that pressure drop plays a significant role in heat enhancement for this type of gyroid structure. As the porosity increases, the boundary layer becomes more noticeable.
1. Introduction
Air-cooling heat sinks are widely used for the cooling of electronics. They are usually used for extended surface heat sinks such as single or multiple square, rectangular, and circular modules (rods) mounted on the heated surface [1] or fin array heat sinks attached to the heated surface. The heat from the chips flows through the thermal spreader and the thermal interface material into the heat sink, which is cooled by forced or free convection. Open-cell porous structures have recently been used for various applications. Metal foams are light porous types of material fabricated for different levels of permeability and porosity. It can be used for low-temperature applications such as electronic cooling and high-temperature applications such as the transpiration cooling of lean premixed combustors [1]. Bayomy [1] investigated the performance of aluminum foam heat sinks. The industry prepared metal foams for a particular specification of porosity and permeability. The foam had a uniform density distribution. From the numerical side, the Darcy Brinkman equation was used to study the model numerically [2]. Later, Welsford et al. [3] continued the work of Bayomy and investigated heat enhancement using a nanofluid. The experiment was compared with numerical data, and agreement was achieved. In all previous work, the researchers were limited to what was available in porous media in the market.
On the other hand, the triply periodic minimal surface technique (TPMS) is an old theory that allows researchers to design porous media by tailoring the type of cells and choosing the required porosity [4,5,6]. Different types of structures are developed. Amongst them, the most common ones are the Diamond and gyroid models. This approach became more valuable recently as 3D metal printing became available at a reasonable price. Thus, this technique allows the researcher to design a porous structure that is suitable for a particular application. From the numerical side, this structure is treated as a solid object; thus, only Navier–Stokes equations combined with the energy equation can be solved numerically.
Baobaid et al. [7] investigated numerically the importance of TPMS porous media in a free convection environment. To comprehend how well various TPMS structures, such as Diamond, gyroid, and Schwarz D, dissipate heat, these structures were analyzed. Several outcomes were found from the experiments. Three correlations were derived for the Nusselt number. The results revealed that TPMS-based heat sinks outperformed conventional heat sinks by 48–61%. This was due to the designed random perturbation of the flow. TPMS is shown to be a very promising structure for heat enhancement.
Modrek et al. [8] aimed to design the heat sink using topology optimization. Additionally, two innovative mapping methods, including averaging and gradient methods, were suggested to convert porous cellular structures into gyroid-based heat sinks. The experiments were conducted using the unit-cell homogenization method to calculate the effective thermal conductivity of gyroid-sheet and gyroid-solid structures. In addition, the heat transfer area’s impact on the optimized configurations’ thermal transport was investigated. The computational analysis compared the thermal transport in the optimized porous and gyroid-mapped heat sinks.
Additionally, the authors examined the mapped structures’ capacity to dissipate heat by calculating the maximum temperatures when subjected to an external heat source. The results showed that the optimized configurations obtained from the experiments exhibited complex topologies with deep pockets near the domain boundaries, making them unsuitable for practical commercial applications.
Yuan et al. [9] reviewed the mechanical properties, biocompatibility, and biodegradability of open-cellular structure designs for porous metal implants. Different additive manufacturing methods, such as selective laser sintering, selective laser melting, and electron beam melting, were investigated for suitability across various applications.
Another study was conducted by Castro et al. [10] regarding the use of TPMS gyroid scaffolds for bone tissue engineering. The authors included numerical calculations and experimental evaluations to determine the suitability of these scaffolds to support bone cell proliferation and tissue regeneration. The result showed the practical fabrication of TPMS scaffolds using high-accuracy 3D MultiJet printing. The authors also emphasized that to ensure optimal fabrication, the design process should provide enough pores to remove the support material utilized during the printing process, which can be difficult for small microstructures. The authors concluded that 3D MultiJet printing paired with numerical homogenization showed potential for generating TPMS and other porous structures for specific bone applications.
Wang et al. [11] focused on and optimized porous structures based on TPMS for effective heat dissipation in three-dimensional applications. This study suggests a novel way to model and optimize TPMS-based structures to improve their thermal efficiency. The authors provide a descriptive representation technique for TPMS structures for efficient design manipulation and optimization. Afterward, the authors used topology optimization approaches to improve the thermal conductive properties of TPMS-based porous structures, resulting in efficient heat dissipation. This innovative design surpasses typical heat sink designs, significantly improving thermal conduction efficiency and efficacy.
Rathore et al. [12,13] examined the flow behavior in porous structures using TPMS designs. This study investigated the hydrodynamics of the fluids flowing through these intricate porous geometries. The authors intend to know how different TPMS constructions affect fluid flow properties such as pressure drop, velocity distribution, and flow patterns. The authors conducted experiments using four distinct kinds of TPMS lattices as follows: Diamond, I-WP, Primitive, and gyroid, and three distinct approaches to the solid subdomain of the lattice structure. Overall, 12 different forms of porous media were produced when the solid subdomain of the lattice was computationally treated as a solid zone, fluid zone, and porous zone. Each of the 12 forms was examined for hydrodynamic behavior throughout the mass flow rates. The authors reached several outcomes from the experiments. The outcome of the current simulation demonstrates how the pressure gradient changes with mean velocity, which proves the presence of a cubic nonlinear regime after the Darcy regimes. This study investigated how TPMS-based porous geometries affect heat transfer processes because of thermal conductivity, temperature distribution, and heat loss.
Shi et al. [14] studied a TPMS-based technique for modeling porous scaffolds utilized in bionic bone tissue engineering is presented. Triply periodic minimal surface structures create porous scaffolds with beneficial qualities for cell adhesion and growth. This approach enables the fabrication of scaffolds with variable porosity and mechanical attributes.
Castro et al. [15] investigated the permeability versus design in TPMS scaffolds. They stated that the results indicate no apparent relationship between structural stiffness, permeability, and fluid flow distribution for the three models. The ideal scaffold design might not be found by choosing porosity based purely on the target organ (in this case, bone). As for the tissue and substrate material where cells are cultivated for differentiation and growth, scaffold design is critical. Compared with Schwartz P or gyroid, the investigated TPMS architecture Schwartz D seemed less suitable for bone tissue engineering applications. The authors concluded that future studies should consider various porosity levels and a wider variety of flow rates to improve and evaluate the available data, ultimately creating a mechanism for choosing scaffolds customized to specific bone tissue engineering requirements.
In the present paper, we developed a porous medium structure using triply periodic minimum surfaces and the gyroid model. With 3D printing, the structure was obtained and modeled numerically as a solid structure. The forced convection condition is applied experimentally and numerically with bottom heating to investigate the effectiveness of heat removal. Section 2 presents a detailed problem and description, followed by Section 3, which is allocated for the experimental measurement. Section 4 and Section 5 are allocated for the numerical approach. A comparison between the experimental measurement obtained and the numerical data computed is shown in Section 6. The results and discussion are in Section 7 for different cases, and the conclusion is in Section 8.
2. Problem Statement
Gyroid shapes that are porous and metallic are complex three-dimensional structures increasingly used in various engineering applications due to their unique properties, including a high strength-to-weight ratio, excellent thermal conductivity, and large surface area. Gyroids are highly effective as heat sinks, as their intricate network of interconnected channels provides a large surface area for dissipating heat. At the same time, their porous structure allows for enhanced fluid flow and efficient cooling. As a result, gyroid-based heat sinks have the potential to significantly improve the thermal management of electronic devices, power systems, and other high-heat applications.
In the present paper, we designed a porous medium model using the gyroids model. The model porosity equaled 0.7, 0.8, and 0.9, respectively. Porosity is the ratio of the volume of free space, which is occupied by the fluid divided by the total volume. Figure 1 presents the three models under investigation. The models were made from aluminum, and 3D printing was used to obtain the structural model. Figure 1a shows the model with a porosity of 0.7, which was used in the experimental setup. Figure 1b,c presents the cases where the porosity was 0.8 and 0.9 and were used for numerical modeling after ensuring the numerical model was well tested against the experiment. This model, as well as the experiment, are in a forced convection regime. Thus, the gravity effect is negligible.
An experimental setup (see Figure 2) was used to study heat enhancement using the model with a porosity of 0.7. The test section consisted of an inlet fluid chamber, a chamber containing the gyroids-shaped porous material, and an outlet fluid chamber. The experimental setup used in the data collection process was similar to the one used by Bayomy et al. [1]. The working fluid used within the system was distilled water. The gyroid porous material was designed to have a square base of 37.5 mm and a height of 12.7 mm. This sizing is consistent with the dimensions of an “Intel Core i7” processor.
Thermocouples were used to read and record the temperature distribution 1mm below the interface as well as the inlet and outlet temperatures of the fluid.
The system was assumed to have reached a steady state when the temperatures remained unchanged for approximately 3 min. Each was repeated three times to make sure it had accurate experimental results.
3. Experimental Measurement
As shown in Figure 2, the flow enters from the inlet, circulates through the porous structure, and exits from the outlet. The fluid removes heat from the porous block heated from below. The temperature at the outlet is measured, and the amount of heat released is determined. This study includes additional parameters related to the effectiveness of heat removal. Among them are the local and average Nusselt numbers, the Reynolds number, the friction factor, and the performance evaluation criterion (PEC).
Uncertainty Analysis
It is known that for each experiment, an error measurement exists, as well as uncertainties within the apparatus. The source of the error could be from the flowmeter and the thermocouple. Through calibration, the flowmeter error measurement is 0.44% (USGPM). The uncertainty of the thermocouples is 0.75% (°C). The local Nusselt number is given as follows:
and the Reynolds number is given by
The local heat transfer coefficients expressed in W/m2.C is given by
All the above parameters are evaluated experimentally, and uncertainty is applicable. For example, the uncertainty of the average Nusselt number can be obtained as follows:
The maximum value of the uncertainty of the local Nusselt number was 2.6%. Clearly, the uncertainties, like ΔTx and hx, vary at each data point. For each data point, the uncertainty calculation is [2]
Table 1 presents the physical properties of the distilled water used experimentally and numerically. All physical properties are assumed to be constant.
4. Finite Element Formulation
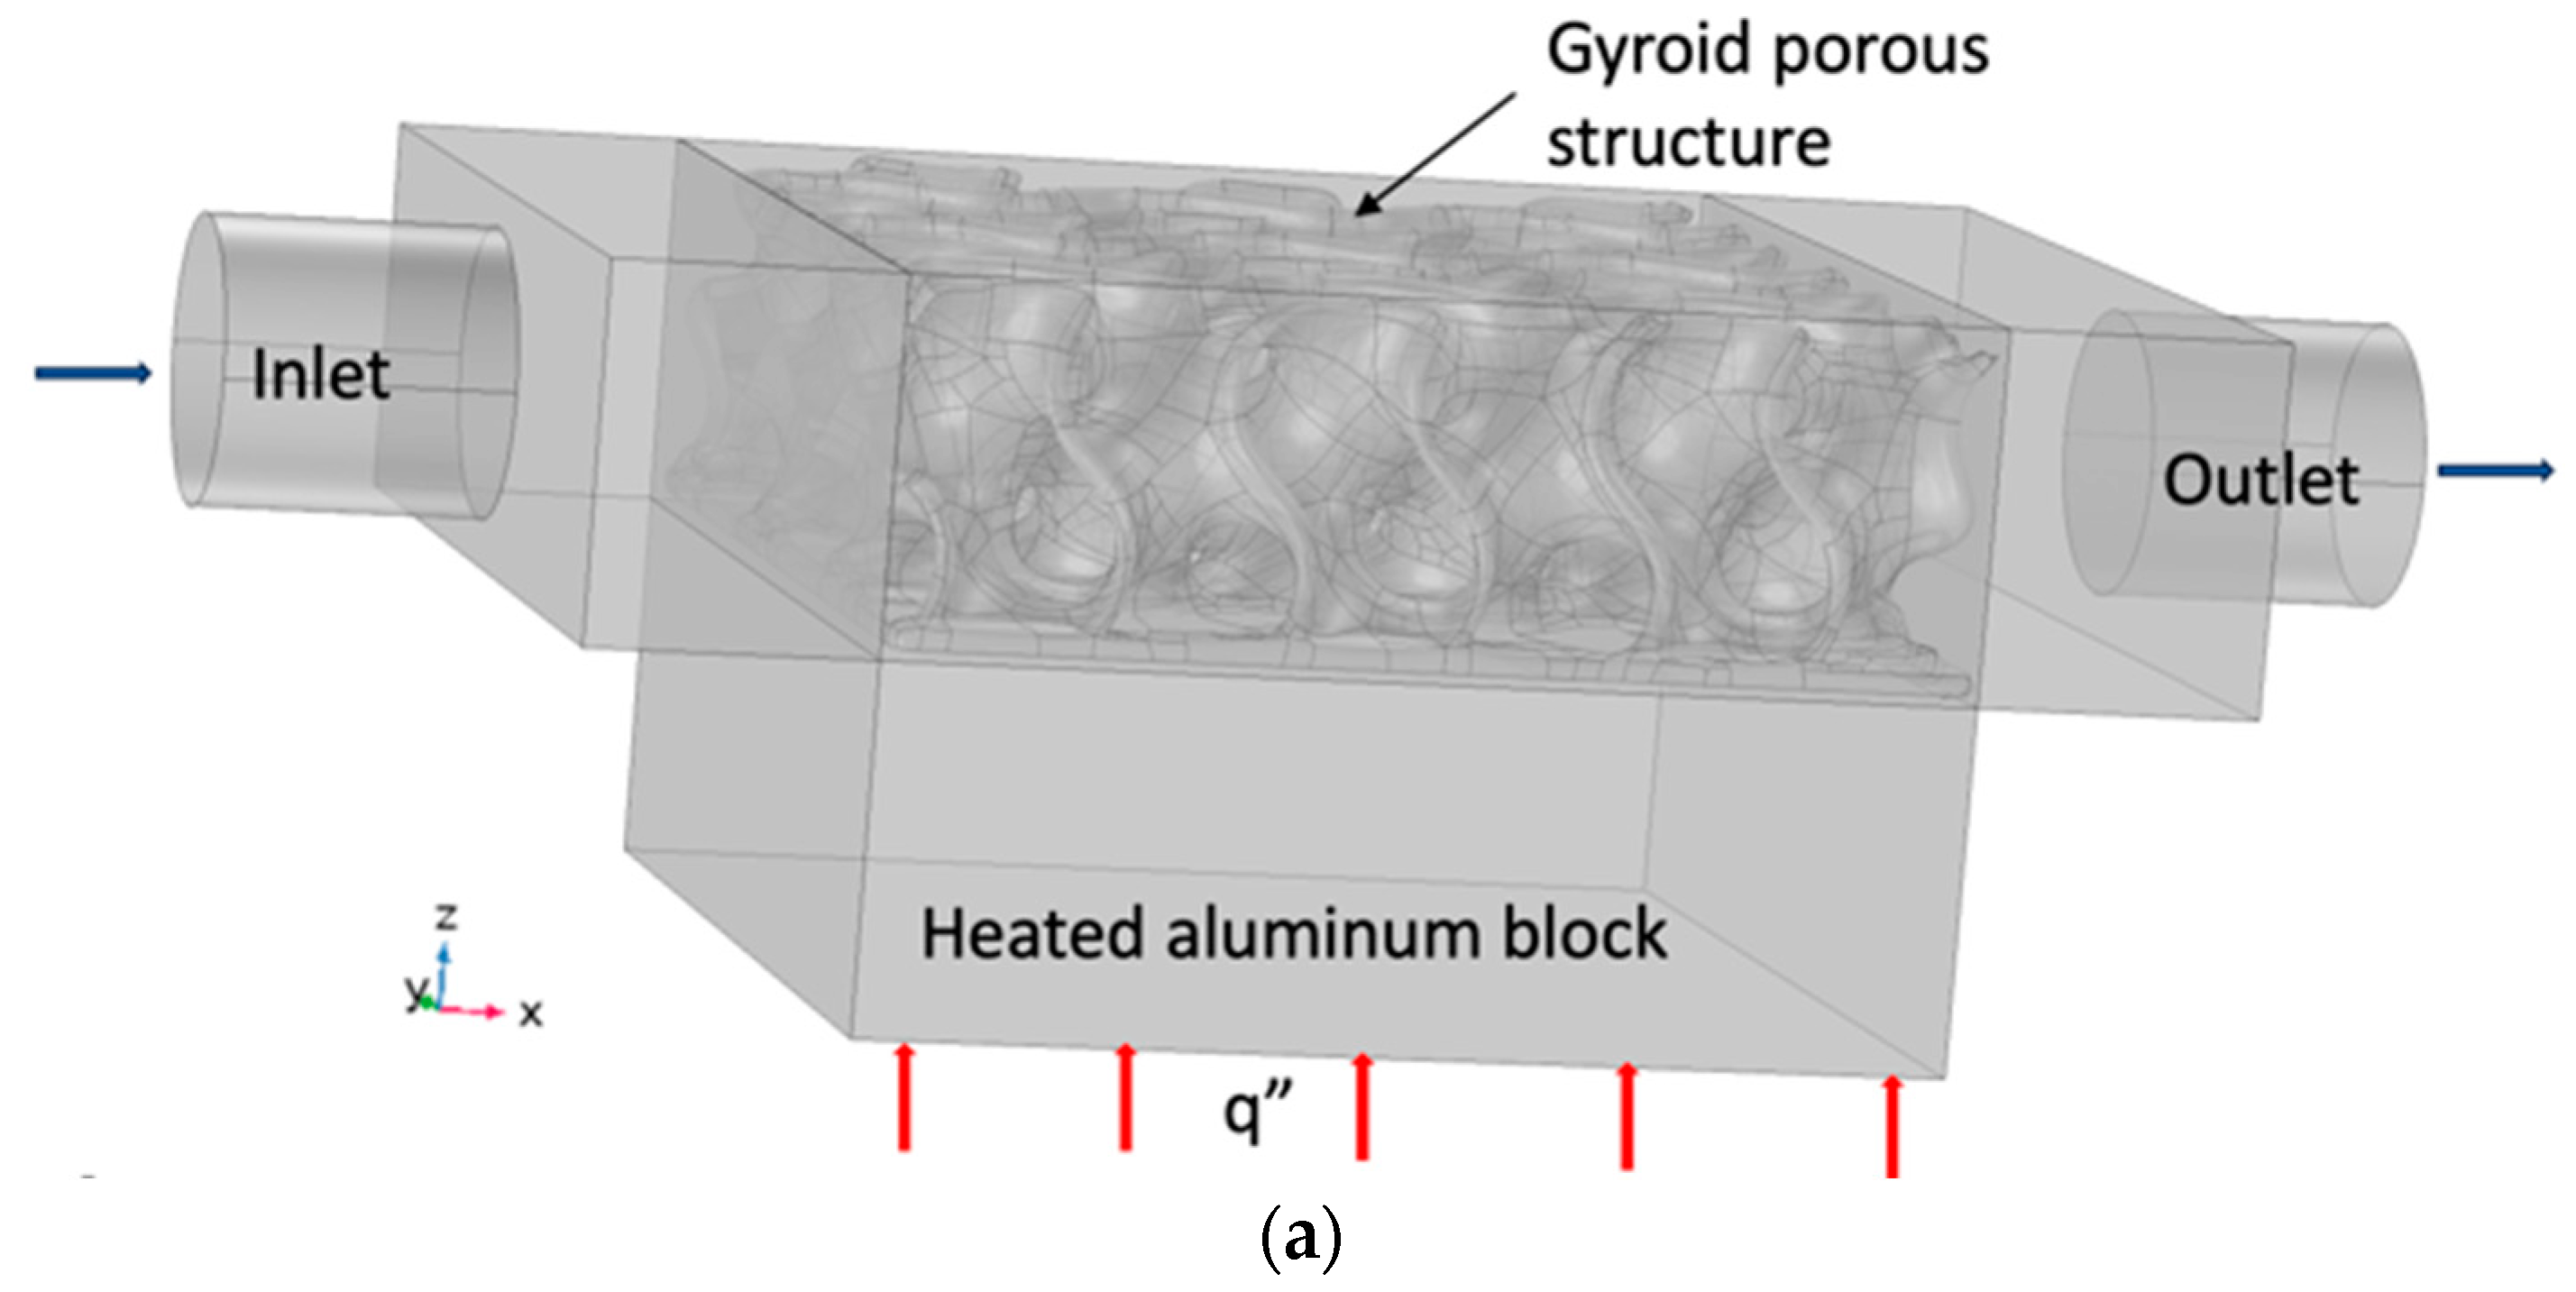
The finite element technique is used to solve the problem numerically. The flow is laminar, incompressible, and Newtonian. The inlet velocity is the indicator of the flow regime. The Reynolds number at the inlet is set below 2000, leading to velocities varying between 0.05 m/s and 0.25 m/s. The finite element model is shown in Figure 4a. It consists of the cylinder inlet, the test section, and the outlet cylinder. A solid aluminum block is located below the test section and is heated by applying a heat flux q”. The bottom aluminum block has a square base of 37.5 mm and a height of 12.7 mm. The porous structure is part of the test section, as shown in Figure 4a. Figure 4b shows the finite element model under study. The uniqueness of this study is modeling the porous structure as a solid; thus, there is no need to solve the Darcy–Brinkman formulation.
The set of equations used for this calculation are shown below.
4.1. Continuity Equation
4.2. Fluid Dynamics Formulation
The Navier–Stokes equation in the vector form is
4.3. Heat Transfer Formulation
The energy equation in the vector form is
The heat conduction formulation represented by Equation (9) is used for the solid part of the model.
4.4. Boundary Conditions
The following boundary conditions are applied.
- (i)
- At the inlet, the velocity u = uin equal to 0.05 m/s, 0.1 m/s, 0.15 m/s, 0.2 m/s and 0.25 m/s is applied.
- (ii)
- At the inlet, the temperature of the fluid enters the test section at T = Tin = 20 degrees Celsius.
- (iii)
- At the outlet, an open boundary is applied where the stresses are set equal to zero.
- (iv)
- The bottom surface of the Aluminum block is heated with a heat flux q” shown in red.
- (v)
- External surfaces are adiabatic, and for the flow, no-slip boundary conditions are applied.
4.5. Data Reduction
The Darcy friction factor, f, is defined as follows:
In Equation (10), the pressure difference is . The length is L and is equal to 37.5 mm. Finally, the performance evaluation criterion (PEC) is a non-dimensional term combining thermal and hydraulic effects. A different combination of the thermal and hydraulic effects has been proposed in the literature. Here, we adopted the ratio of the two terms, i.e., thermal and hydraulic effects. The performance evaluation criterion (PEC) is as follows:
The amount of heat (Q) absorbed by the fluid is defined as
5. Sensitivity Analysis and Convergence Criteria
Mesh sensitivity must be conducted to ensure the accuracy of the numerical results. Table 2 presents the different mesh adopted using the COMSOL software (Version 6, Comsol Inc., Burlington, MA, USA). Tetrahedral elements are used at the model’s edges, boundary, and core. Convergence criteria are applied when the residue for all variables is less than 10−6. Normal mesh was used in the current analysis.
Due to the complexity of the gyroid model, a different approach is made to solve the problem. The best solution procedure consists of first solving the fluid flow model, and when steady state and convergence are reached, the results are used as an initial guess to solve the fluid flow model again combined with the heat transfer formulation. This secures a very stable solution and accurate results.
6. Comparison with Experimental Data
The experiment is conducted at different flow rates by maintaining a constant heat flux. Distilled water is the circulating fluid in the test section. The heat flux applied is q” and is set equal to 38,000 W/m2. The reading of data is achieved when the measured temperature reaches a steady state. The experiment is repeated three times, and the average temperature is reported. The three velocities under consideration are uin equal to 0.08 m/s, 0.16 m/s, and 0.24 m/s. From the numerical side, the fluid formulation was solved in the first run, and the velocities were obtained independently from the heating process. The velocity was then used as an initial condition when the combined fluid flow and heat transfer formulations were computed.
The complexity of this flow was due to the circulation of the fluid within a thin solid structure representing the porous material with different internal channel widths. The gyroid design may have generated narrow channels or obstruction. Thus, there is a challenge in solving this model numerically. The porosity of the material, in this case, is 0.7.
Each measurement required three hours to reach a steady state before collecting data. In addition, each experiment was conducted three times, and an average value was reported. Figure 5 presents a comparison between the experimental and numerical data. The temperature distribution is shown in Figure 5a. As the velocity was set equal to 0.08 m/s, the temperature increased along the flow direction, and the maximum difference between the measured and numerical results was less than 1 °C. As the velocity increased, the temperature dropped due to an increase in the cooling process. As the flow increased further, similar discrepancies existed. The lower experimental temperature was presumed to be due to some heat lost to the surroundings. However, the authors believe that this comparison is acceptable, and the model is accurate enough to further study the thermohydraulic performance of the designed porous structure. Figure 5b shows the local Nusselt numbers as they are compared between experimental and numerical values. A very good agreement was obtained between the experimental and the numerical approaches.
7. Results and Discussion
Modeling the porous medium as a structure is a unique approach but very challenging. Converting the model from the “stl” format to any other form is straightforward. However, depending on the porous design, different elements may be narrow in many locations, leading to a failure in the accurate meshing process. Even securing refined mesh does not solve the problem. Some manual corrections are necessary for a better result, depending on the software used. The model with a porosity of 0.7 is investigated further numerically, and the thermohydraulic performance is studied. Furthermore, two additional models with two additional porosities of 0.8 and 0.9 were used, and a detailed comparison between the three models was conducted. Amongst the parameters under investigation were the Reynolds number, the average Nusselt number, the performance evaluation criterion, and finally, the amount of heat absorbed by the fluid.
7.1. Porous Structure with a Porosity of 0.7
After comparing the conducted experimental data and the numerical calculation for a porosity of 0.7, this model was investigated for two different applied heat fluxes of 30,000 W/m2 and 90,000 W/m2. Furthermore, a range of flow rates was used for each applied heat flux, translating to an inlet velocity of 0.05 m/s, 0.1 m/s, 0.15 m/s, 0.2 m/s, and 0.25 m/s, respectively. For each case, the friction coefficient was evaluated in addition to the parameter under investigation to assess the importance of such a structure. The pressure drop between the inlet and the outlet was also calculated for this. We estimated the friction coefficient by calculating the pressure drop between the inlet and outlet using Equation (10).
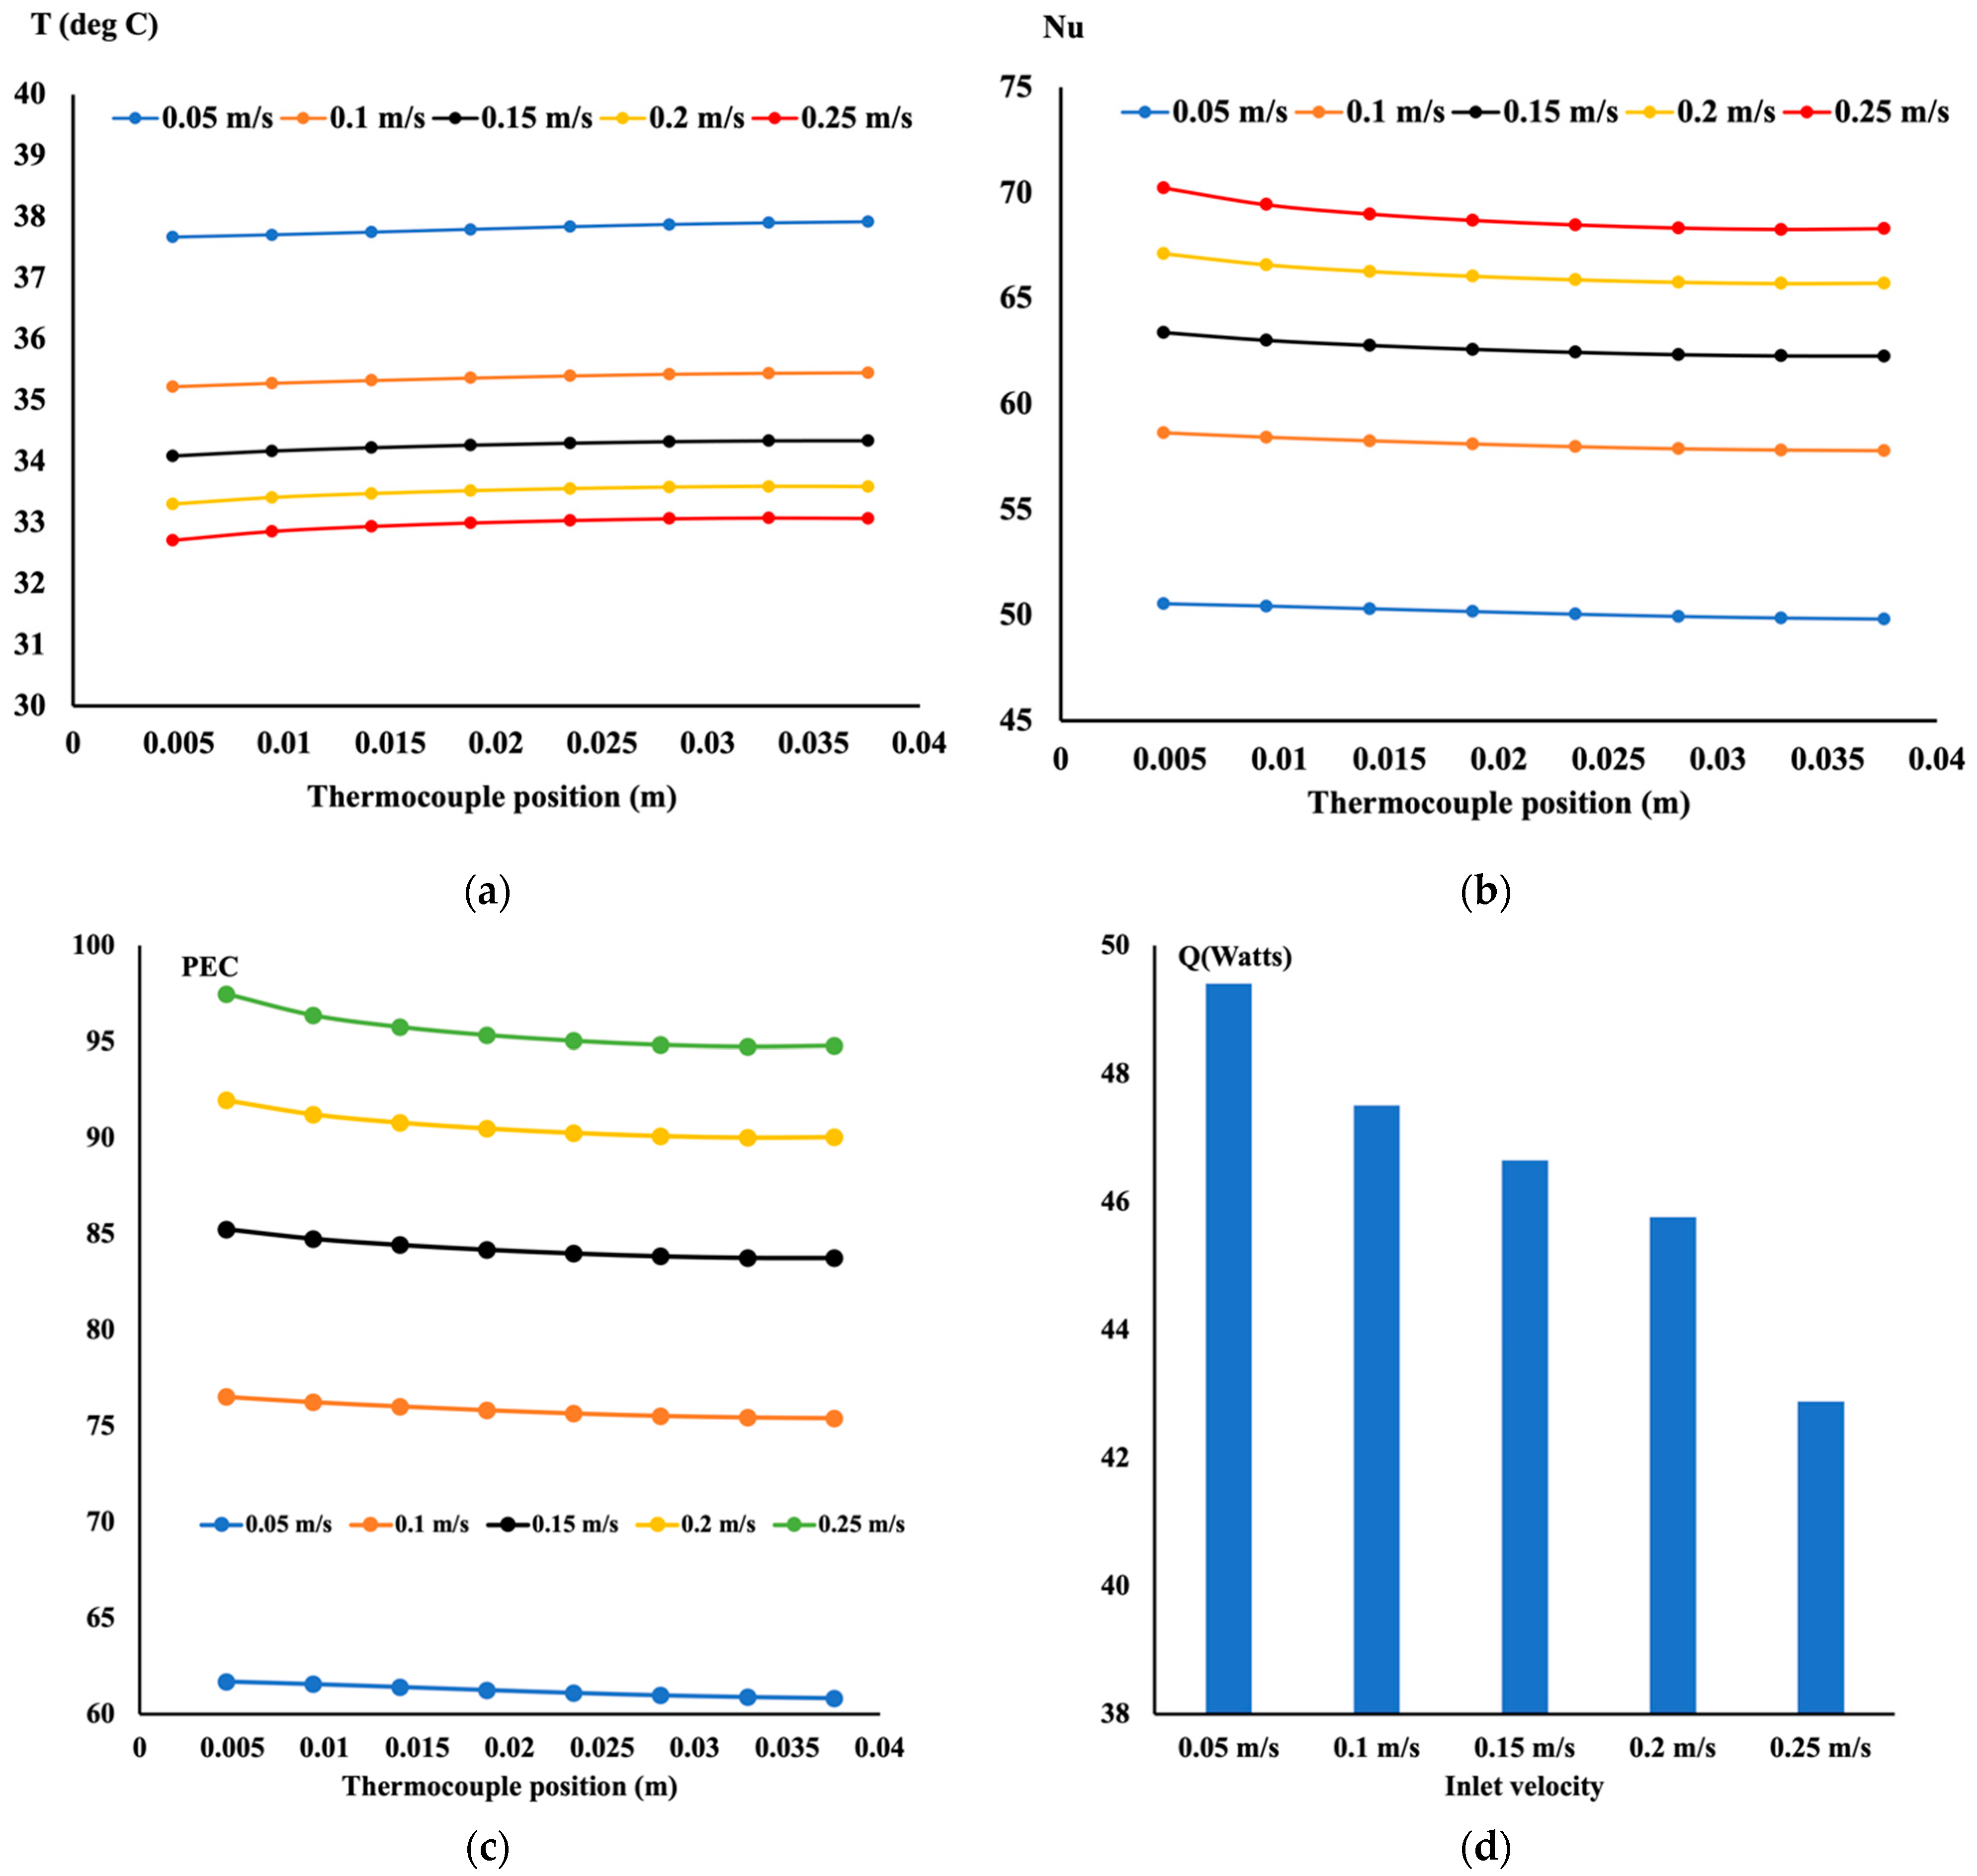
Figure 6 presents the temperature (T), the local Nusselt number (Nu), the performance evaluation criteria (PEC), and the amount of heat absorbed by the water (Q) when the porosity was set equal to 0.7. In Figure 6a, the temperature distribution decreases as the inlet velocity increases. This led to more heat being released into the circulation of water. A large temperature gradient at the entrance is a good indicator of the development of the boundary layer. When it is fully developed, the temperature slope is reduced to zero. In addition, a higher flow velocity leads to lower temperatures. This is also evident in Figure 6b, where the Nusselt number slightly decreases at the entrance, and then a flat variation is detected. A greater Nusselt number magnitude is found at a higher inlet velocity. It is worth noting that the friction factor was evaluated for all cases and combined with the average Nusselt number to assess the performance evaluation criteria. Figure 6c shows the performance evaluation criterion (PEC) variation along the flow path. It is evident from this figure that the highest PEC is when the flow increases. Figure 6d shows the amount of diffused heat released into the water flow. The slower the flow, the more time is given to the heat to diffuse into the fluid. The difference between all cases of heat released is, at the most, 12%. One can observe from this figure that a porous medium is a practical material for cooling hot surfaces. The presence of this structure in the model allows for a higher friction coefficient and heat removal.
The model is repeated for a higher heat flux equal to 90,000 W/m2. Similar heat recovery and heat-absorbed profiles were obtained but at a larger scale. A comparison between the two extreme heating cases for the two extreme inlet velocities is shown in Figure 7. When the flow entered the test section at a velocity of 0.05 m/s (see Figure 7a), the performance evaluation criteria decreased along the flow linearly. This was due to a buildup of the boundary layer and the friction coefficient. The PEC also increases in magnitude with the applied heat flux. This is clear since the Nusselt number increased accordingly. This is noticeable at a high inlet velocity; the performance evaluation behavior has a nonlinear variation mainly due to the flow mixing. A parabolic profile is obtained, as shown in Figure 7b. The pressure drop is more significant at a high velocity, and the amount of heat removed is also high.
7.2. Porous Structure with a Porosity of 0.9
The model is repeated with a case where the porosity equals 0.9. It is essential to indicate that the structure of the porous changes as the porosity changes.
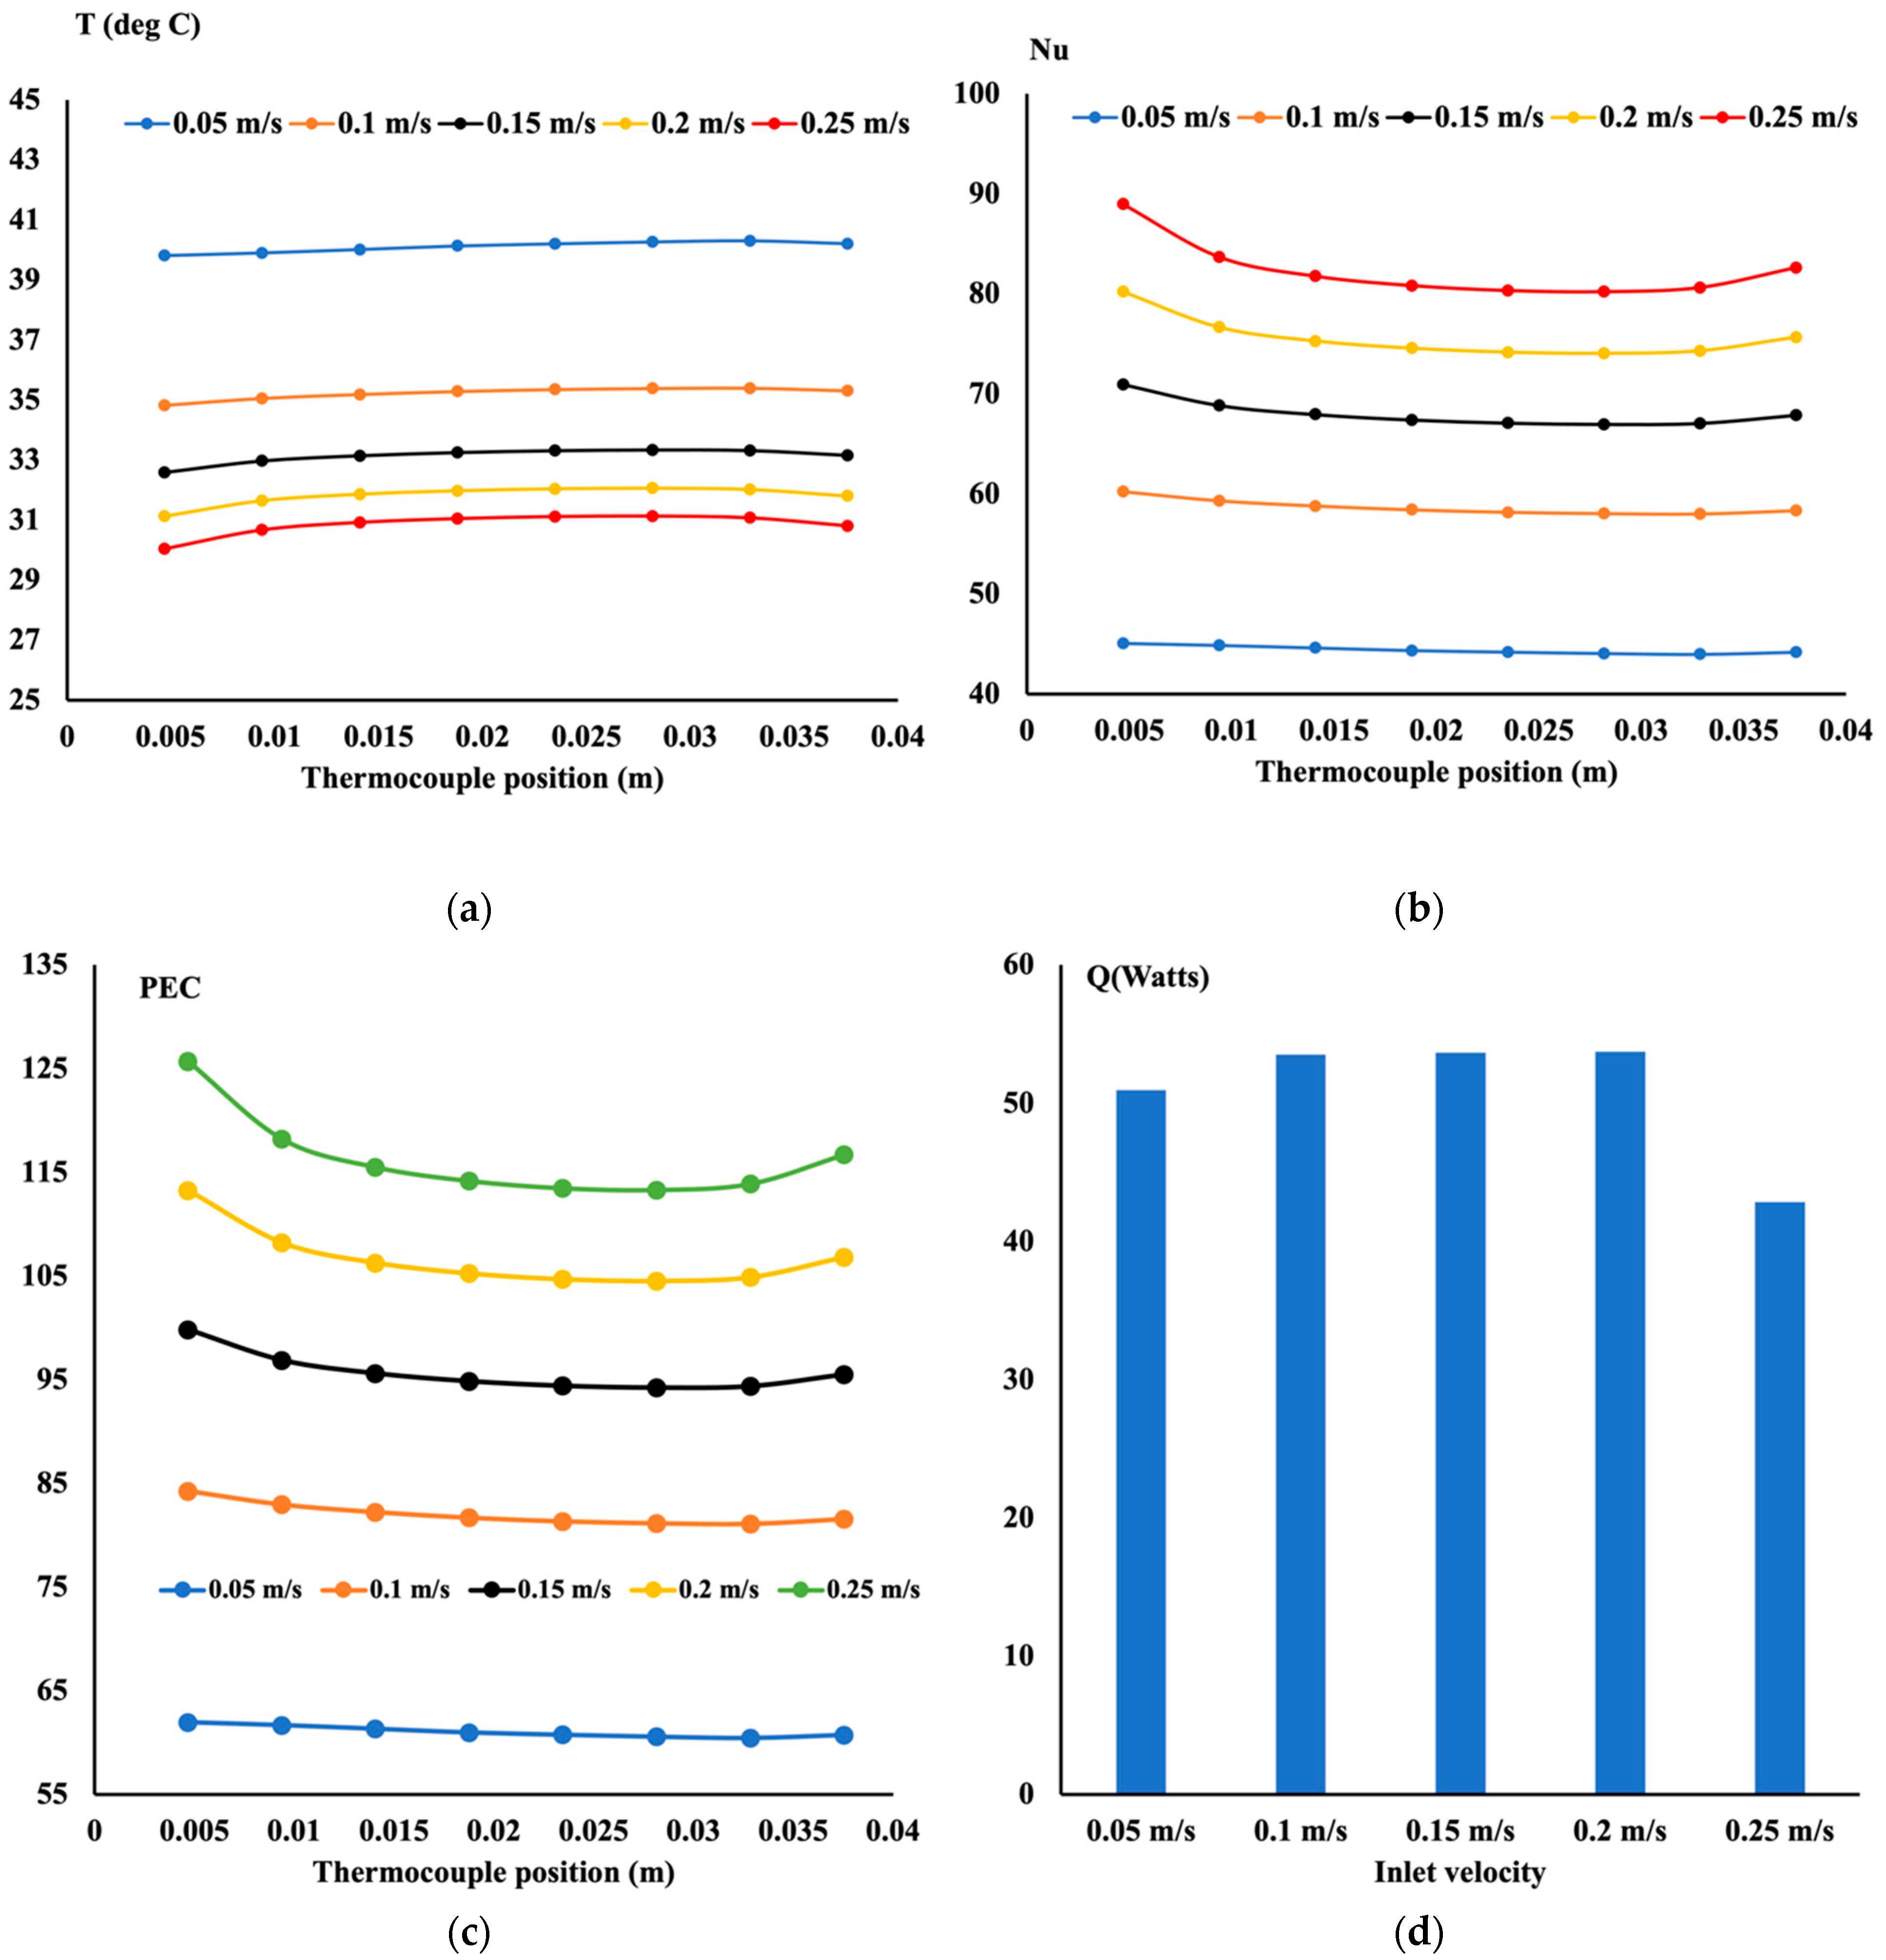
The structure pattern is the same, but as the porosity increases, the repetition of the opening is not similar, as shown in Figure 1. One can notice by examining Figure 8 that the boundary layer is more dominant in the flow structure. This observation was due to the large fluid volume circulating, contrary to the case where the porosity was equal to 0.7. Figure 8a shows the nonlinear temperature distribution, and a parabolic shape profile was observed as the flow rate increased, reaching 0.25 m/s. A lower porosity exhibits lower temperature distribution at a low inlet velocity of 0.05 m/s and, thus, a higher Nusselt number. However, as the inlet velocity increases and at an inlet of 0.25 m/s, the calculated temperature is lower than the case with low porosity. Thus, this led to a higher Nusselt number. The performance evaluation criteria are higher in all cases with high porosity. It is believed that a lower drop in pressure leads to a higher PEC. If one compares Figure 6d and Figure 8d, one may notice higher heat removal when the porosity increases. The heat removal varies nonlinearly with the inlet velocity as well.
7.3. Comparison between Different Porosities
This model was repeated for porosity equal to 0.8 in all previous cases. It is more beneficial to assess the performance of this type of porous media by comparing the three cases. The temperature distribution, the local Nusselt number, and the performance evaluation criteria are computed for low flow rates represented with an inlet velocity of 0.05 m/s and the highest one with an inlet velocity of 0.25 m/s. It is essential to remind the reader that with the TPMS technique, the solid structure varies as the opening of the flow to circulate also differs. By comparing the temperature distribution for all three levels of porosity shown in Figure 9a,d, the structure with a porosity of 0.8 exhibits a lower temperature distribution. This translates to a higher Nusselt number, as shown in Figure 9b,e. The structure with a porosity equal to 0.8 appears to provide an optimum design structure for the cooling of hot surfaces. This is also reflected with PEC, as shown in Figure 9c,e. What is interesting to notice from Figure 9c is that the performance evaluation criteria for a porosity of 0.7 and 0.9 are similar. This is contrary to the case where the inlet velocity is 0.25 m/s. However, for the two cases, the case of a porosity of 0.8 outperforms the other two cases.
7.4. Flow Profile in the Porous Structure
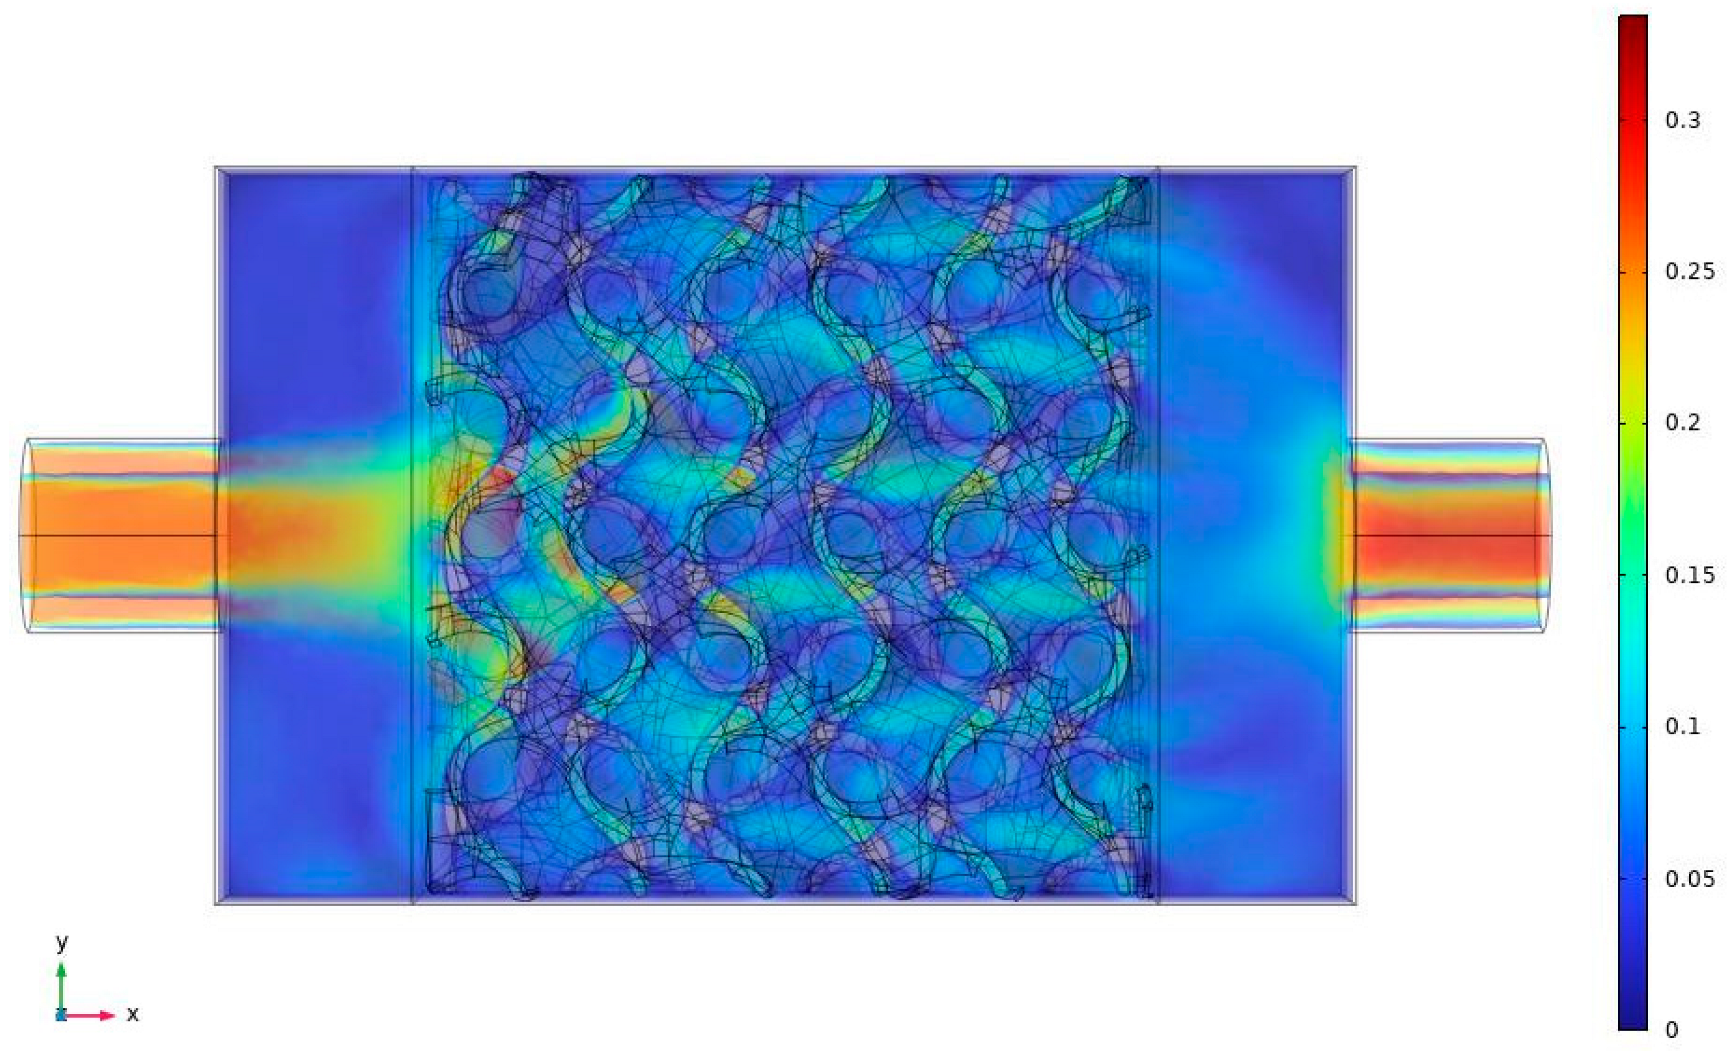
The complexity of the numerical simulation is due to the porous medium structure. As indicated earlier, some expansion and contraction channels exist within this structure. Therefore, the flow may accelerate or decelerate within the porous structure. Such a problem did not exist when metal foam, such as porous media, was used. To explain this complexity further, Figure 10 presents the flow circulation at the middle plane of the porous structure. As noticed for this case, the inlet velocity was equal to 0.25 m/s. However, if one examines the flow closely, one may see an increase in velocity within the structure to reach a magnitude higher than the inlet velocity. It is believed that, inside the complex structure, some reduction in this area can lead to a higher velocity.
If a cut is made in the middle of the structure, as shown in Figure 10 and Figure 11, it represents the velocity magnitude along the flow direction. A higher velocity magnitude near the structure’s entrance is shown clearly in Figure 11, with a velocity greater than 0.25 m/s. The zero velocity shown in Figure 11 is a solid wall with no flow.
As the flow progresses toward the outlet, the velocity magnitude is reduced. Also, it is essential to indicate that the inlet velocity is where the flow enters the cylinder. As it expands to the porous structure for a constant flow rate, the velocity is reduced in magnitude.
8. Conclusions
Porous media is a unique tool used for cooling surfaces. Forced convection through porous media proved very effective in cooling hot surfaces. Researchers have concentrated on cooling computer chips. Thus, the porous structure is small. Limited porous structures are used due to their availability in the industry. Three-dimensional printing is becoming a prevalent approach for producing innovative designs. The currently available hardware suggests that one can achieve the 3D printing of porous structures using metal materials. Triply periodic minimal surfaces, known as TPMS, can help the user design the porous structure based on their needs. Among the different models, this paper deals with the gyroid structure. This model was built and tested experimentally using a forced convection experiment with water as the cooling fluid. The numerical model used here is unique because only the Navier–Stokes equations and the energy equation were solved numerically by making the porous material a porous structure in the model. The following findings were observed.
- From a numerical point of view, the porous structure was included in the model using the TPMS approach. Thus, no porous equations were solved.
- The complexity of the numerical model was solved by computing the fluid formulation first and using the results as an initial condition for solving the coupled Navier–Stokes equations and the energy equation.
- The current structure and its non-uniformity showed that the flow inside the porous can accelerate and decelerate depending on the gyroid model used.
- The new numerical approach proved very accurate compared to measured experimental data.
- TPMS provides flexibility to the researcher to design any type of porous structure, depending on the application.
- For the gyroid scaffold case and for our current application, a porosity of 0.8 was found to be the optimum value for cooling small surfaces.
- It is important to perform evaluation criteria between a gyroid structure and a metal foam porous media structure with identical porosity and permeability.
Author Contributions
Conceptualization, M.Z.S. and H.R.; methodology, M.Z.S.; software, M.Z.S. and D.I.; validation, H.R., J.S. and M.Z.S.; formal analysis, M.Z.S.; investigation, H.R.; resources, M.Z.S.; data curation, M.Z.S.; writing—original draft preparation, M.Z.S. and D.I.; writing—review and editing, M.Z.S. All authors have read and agreed to the published version of the manuscript.
Funding
National Science and Engineering Research Canada (NSERC). Grant: RGPIN-2020-07021.
Data Availability Statement
Data are contained within the article.
Conflicts of Interest
The authors declare no conflict of interest.
Nomenclature
| L | Porous width (mm) | Fluid density | |
| T | Temperature in °K | µ | Fluid viscosity |
| Tin | Inlet temperature (°K) | Cp | Fluid specific heat |
| Ts | Surface Temperature (°K) | kf | Fluid conductivity |
| Nu | Local Nusselt number | Average Nusselt number | |
| uin | Inlet velocity (m/s) | q” | Heat flux applied to the Bottom of the aluminum Block (W/m2.K) |
| p | Pressure (N/m2) | hx | Local heat transfer coefficient (W/m2.K) |
| The pressure difference (N/m2) | PEC | Performance Evaluation Criterion | |
| D | Inlet cylinder diameter (m) | Re | Reynolds number |
| L | Porous length (mm) | Mass flow rate in kg/s | |
| Tout | Outlet Temperature (°K) |
References
- Bayomy, A.M. Electronic Cooling Using ERG Aluminum Foam Subjected to Steady/Pulsating Water and γ-Al2O3–Water Nanofluid Flows: Experimental and Numerical Approach. Ph.D. Thesis, Ryerson University, Toronto, ON, Canada, 2017. [Google Scholar]
- Bayomy, A.M.; Saghir, M.Z.; Yousefi, T. Electronic cooling using water flow in aluminum metal foam heat sink: Experimental and numerical approach. Int. J. Therm. Sci. 2016, 109, 182–200. [Google Scholar] [CrossRef]
- Welsford, C.; Thanapathy, P.; Bayomy, A.M.; Ren, M.; Saghir, M.Z. Heat enhancement using aluminum metal foam: Experimental and numerical approach. J. Porous Media 2020, 23, 249–266. [Google Scholar] [CrossRef]
- Al-Ketan, O.; Abu Al-Rub, R.K. Multifunctional mechanical metamaterials based on triply periodic minimal surface lattices. Adv. Eng. Mater. 2019, 21, 1900524. [Google Scholar] [CrossRef]
- Al-Ketan, O.; Rowshan, R.; Al-Rub, R.K.A. Topology-mechanical property relationship of 3D printed strut, skeletal, and sheet based periodic metallic cellular materials. Addit. Manuf. 2018, 19, 167–183. [Google Scholar] [CrossRef]
- Tang, W.; Zhou, H.; Zeng, Y.; Yan, M.; Jiang, C.; Yang, P.; Li, Q.; Li, Z.; Fu, J.; Huang, Y.; et al. Analysis on the convective heat transfer process and performance evaluation of Triply Periodic Minimal Surface (TPMS) based on Diamond, Gyroid and Iwp. Int. J. Heat Mass Transf. 2023, 201, 123642. [Google Scholar] [CrossRef]
- Baobaid, N.; Ali, M.I.; Khan, K.A.; Al-Rub, R.K.A. Fluid flow and heat transfer of porous TPMS architected heat sinks in free convection environment. Case Stud. Therm. Eng. 2022, 33, 101944. [Google Scholar] [CrossRef]
- Modrek, M.; Viswanath, A.; Khan, K.A.; Ali, M.I.H.; Al-Rub, R.K.A. An optimization case study to design additively manufacturable porous heat sinks based on triply periodic minimal surface (TPMS) lattices. Case Stud. Therm. Eng. 2022, 36, 102161. [Google Scholar] [CrossRef]
- Yuan, L.; Ding, S.; Wen, C. Additive manufacturing technology for porous metal implant applications and triple minimal surface structures: A review. Bioact. Mater. 2019, 4, 56–70. [Google Scholar] [CrossRef] [PubMed]
- Castro, A.P.G.; Ruben, R.B.; Gonçalves, S.B.; Pinheiro, J.; Guedes, J.M.; Fernandes, P.R. Numerical and experimental evaluation of TPMS Gyroid scaffolds for bone tissue engineering. Comput. Methods Biomech. Biomed. Eng. 2019, 22, 567–573. [Google Scholar] [CrossRef] [PubMed]
- Wang, S.; Jiang, Y.; Hu, J.; Fan, X.; Luo, Z.; Liu, Y.; Liu, L. Efficient representation and optimization of TPMS-based porous structures for 3D heat dissipation. Comput.-Aided Des. 2022, 142, 103123. [Google Scholar] [CrossRef]
- Rathore, S.S.; Mehta, B.; Kumar, P.; Asfer, M. Flow Characterization in Triply Periodic Minimal Surface (TPMS)-Based Porous Geometries: Part 1—Hydrodynamics. Transp. Porous Media 2023, 146, 669–701. [Google Scholar] [CrossRef]
- Rathore, S.S.; Mehta, B.; Kumar, P.; Asfer, M. Flow Characterization in Triply-Periodic-Minimal-Surface (TPMS) based Porous Geometries: Part 2—Heat Transfer. Transp. Porous Media 2023. [Google Scholar] [CrossRef]
- Shi, J.; Zhu, L.; Li, L.; Li, Z.; Yang, J.; Wang, X. A TPMS-based method for modeling porous scaffolds for bionic bone tissue engineering. Sci. Rep. 2018, 8, 7395. [Google Scholar] [CrossRef] [PubMed]
- Castro, A.P.G.; Pires, T.; Santos, J.E.; Gouveia, B.P.; Fernandes, P.R. Permeability versus design in TPMS scaffolds. Materials 2019, 12, 1313. [Google Scholar] [CrossRef] [PubMed]
Figure 1.
Gyroids-shaped model developed for three different porosities. (a) Porosity = 0.7, (b) Porosity = 0.8, (c) Porosity = 0.9.
Figure 1.
Gyroids-shaped model developed for three different porosities. (a) Porosity = 0.7, (b) Porosity = 0.8, (c) Porosity = 0.9.


Figure 2.
The experimental setup.

Figure 3.
The test section and the gyroid model. (a) Gyroid in the test section, (b) Gyroid model for numerical modelling.
Figure 3.
The test section and the gyroid model. (a) Gyroid in the test section, (b) Gyroid model for numerical modelling.

Figure 4.
Finite element model. (a) Physical model, (b) Mesh model.


Figure 5.
Comparison between experimental and numerical results. (a) Temperature distribution, (b) Nusselt number distribution.
Figure 5.
Comparison between experimental and numerical results. (a) Temperature distribution, (b) Nusselt number distribution.

Figure 6.
Thermohydraulic performance of the model (porosity = 0.7, q” = 30,000 W/m2). (a) Temperature distribution, (b) Local Nusselt number distribution, (c) Performance evaluation criteria, (d) Heat absorbed by the fluid.
Figure 6.
Thermohydraulic performance of the model (porosity = 0.7, q” = 30,000 W/m2). (a) Temperature distribution, (b) Local Nusselt number distribution, (c) Performance evaluation criteria, (d) Heat absorbed by the fluid.

Figure 7.
PEC variation as a function of the applied heat flux and inlet velocity. (a) Inlet velocity = 0.05 m/s, (b) Inlet velocity = 0.25 m/s.
Figure 7.
PEC variation as a function of the applied heat flux and inlet velocity. (a) Inlet velocity = 0.05 m/s, (b) Inlet velocity = 0.25 m/s.

Figure 8.
Thermohydraulic performance of the model (porosity = 0.9, q” = 30,000 W/m2). (a) Temperature distribution, (b) Local Nusselt number distribution, (c) Performance evaluation criteria, (d) Heat absorbed by the fluid.
Figure 8.
Thermohydraulic performance of the model (porosity = 0.9, q” = 30,000 W/m2). (a) Temperature distribution, (b) Local Nusselt number distribution, (c) Performance evaluation criteria, (d) Heat absorbed by the fluid.

Figure 9.
Comparison between different porosities. (a) Temperature distribution for inlet velocity = 0.05 m/s, (b) Local Nusselt number variation for inlet velocity = 0.05 m/s, (c) Performance evaluation criteria variation for inlet velocity = 0.05 m/s (d) Temperature distribution for inlet velocity = 0.25 m/s, (e) Local Nusselt number variation for inlet velocity = 0.25 m/s, (f) Performance evaluation criteria variation for inlet velocity = 0.25 m/s.

Figure 10.
X–Y plane velocity distribution in the middle of the porous material. (porosity = 0.7).

Figure 11.
Variation in the velocity magnitude at the middle of the porous structure.


Table 1.
Physical properties of the fluid used [1].
Table 1.
Physical properties of the fluid used [1].
| Fluid | (kg/m3) | (kg/m.s) | Cp (J/kg.K) | K (W/m.K) |
|---|---|---|---|---|
| Distilled Water | 998.2 | 0.001001 | 4128 | 0.631 |
Table 2.
Mesh sensitivity analysis.
| Mesh Level | Total Number of Elements | Average Nusselt Nu |
|---|---|---|
| Coarser | 532,291 | 61 |
| Coarse | 1,136,575 | 63 |
| Normal | 1,338,201 | 62.9 |
| Fine | 1,806,353 | 62.87 |
Disclaimer/Publisher’s Note: The statements, opinions and data contained in all publications are solely those of the individual author(s) and contributor(s) and not of MDPI and/or the editor(s). MDPI and/or the editor(s) disclaim responsibility for any injury to people or property resulting from any ideas, methods, instructions or products referred to in the content. |
© 2023 by the authors. Licensee MDPI, Basel, Switzerland. This article is an open access article distributed under the terms and conditions of the Creative Commons Attribution (CC BY) license (https://creativecommons.org/licenses/by/4.0/).
Share and Cite
MDPI and ACS Style
Saghir, M.Z.; So, J.; Rasheed, H.; Ilesaliev, D. Forced Convection in Porous Medium Using Triply Periodical Minimum Surfaces. Fluids 2023, 8, 311. https://doi.org/10.3390/fluids8120311
AMA Style
Saghir MZ, So J, Rasheed H, Ilesaliev D. Forced Convection in Porous Medium Using Triply Periodical Minimum Surfaces. Fluids. 2023; 8(12):311. https://doi.org/10.3390/fluids8120311
Chicago/Turabian StyleSaghir, Mohamad Ziad, Jordan So, Heba Rasheed, and Dauren Ilesaliev. 2023. "Forced Convection in Porous Medium Using Triply Periodical Minimum Surfaces" Fluids 8, no. 12: 311. https://doi.org/10.3390/fluids8120311