Article

Nanobubble Collapse Induced Erosion near Flexible and Rigid Boundaries: A Molecular Dynamics Study

1
Institute of Ship Technology, Ocean Engineering and Transport Systems, University of Duisburg-Essen, 47057 Duisburg, Germany
2
Advanced Simulation and Computing Laboratory (ASCL), Mechanical Engineering Department, Imam Khomeini International University, Qazvin P.O. Box 341489-6818, Iran
*
Author to whom correspondence should be addressed.
These authors contributed equally to this work.
Fluids 2023, 8(5), 154; https://doi.org/10.3390/fluids8050154
Submission received: 17 April 2023 / Revised: 6 May 2023 / Accepted: 11 May 2023 / Published: 14 May 2023
(This article belongs to the Special Issue Bubble Dynamics)

Abstract

:
In this work, we performed molecular dynamics simulations to study the dynamics of a shock wave-induced single nanobubble collapsing near one flexible and two rigid boundaries. The flexible boundary consisted of polyethylene, and the rigid boundaries were made of aluminum and iron. The shock waves impinging on the nanobubble inside a molecular system were generated using a momentum mirror approach. For two relative wall distances, we studied the dynamics of the shock-induced single nanobubble and its collapse near the flexible and the rigid boundaries. The atomic velocity contours surrounding the single nanobubble and the collapse-induced damage on the boundaries were analyzed. We obtained this collapse-induced damage from ten collapsing nanobubbles. Results showed that the relative wall distance affected the single nanobubble’s collapse dynamics near the boundaries. A generated nanojet was directed on the surfaces during the collapse process. From the collapse-induced damage point of view, the depth damage of the polyethylene, iron, and aluminum boundaries for the relative wall distance of γ = 1.3 were 6.0, 0.47 and 0.63 nm, respectively. It was observed that the extensive collapse-induced damage occurred only on the polyethylene boundary.

1. Introduction

Cavitation is a phenomenon that usually occurs in ship and hydraulic machinery systems, in biochemical and biomedical and ultrasonic systems, and in various valves and injector nozzles, etc. Cavitation may cause mass loss, and it may damage the surface of immersed bodies of systems where cavitating flows or cavitation bubbles are generated. This cavitation-induced damage reduces the performance of such systems (Reisman et al. [1], Dular et al. [2], Patella et al. [3], Huang et al. [4], Kadivar et al. [5,6,7], Köksal et al. [8], Lin et al. [9], and Sadri and Kadivar [10]. The cavitation-induced damage is caused by the collapse of many tiny bubbles near a boundary. These tiny bubbles usually are of mesoscale, microscale, and nanoscale size. Previous research dealt mostly with the dynamics of a single cavitation bubble of mesoscale and microscale size near a boundary.
Lauterborn et al. [11], Philipp and Lauterborn [12] Tomita and Shima [13], Koch [14] and Kadivar et al. [15] studied the dynamics of a single cavitation bubble near a solid boundary. They numerically and experimentally investigated the single cavitation bubble and its destructive effects, such as erosion on the surface of the solid boundary. Their results demonstrated that a microjet forms during the collapse process of the single cavitation bubble near a solid surface. This microjet, impacting on the solid boundary, induces surface erosion after several successive bubble collapses. Furthermore, they found that a toroidal cavity structure forms after the first collapse, inducing more damage on the solid boundary. This toroidal cavity consists of several tiny bubbles that cause erosion after collapsing. Vogel and Lauterborn [16] studied the generation of acoustic transient laser-induced cavitation bubbles near solid boundaries. They found that a significant pressure impact is generated inside a single cavitation bubble during its first collapse. The impact on the solid surface reaches pressures up to 60 kbar. They indicated that a major part of the bubble collapse energy is converted to acoustic energy.
Tomita et al. [17] investigated the dynamics of a laser-induced cavitation bubble collapsing close to a curved solid surface. They showed that the collapse dynamics of the bubble and the direction of its collapse are influenced by the curvature of the solid surface. Lindau and Lauterborn [18], studying the dynamics of a single cavitation bubble near a solid boundary, found that a counterjet forms during the rebound process for certain stand-off distances between the bubble center and the solid boundary. Dular et al. [19], investigating the damage formed by the collapse of a single cavitation bubble near a solid surface, indicated that a macrojet forms due to the pressure gradient around the single cavitation bubble. Kadivar et al. [20], investigating the dynamics of a single cavitation bubble near a riblet structure, showed that the momentum of the microjet formed during the bubble collapse process is affected by the riblet structure. Their results revealed that the micro structured riblet mitigates the cavitation-induced erosion of the bubble collapsing on the solid boundary.
Phan et al. [21] studied the thermodynamic effects on the collapse process of a single cavitation bubble. They presented the dynamics of the bubble’s growth and demonstrated that its collapse process is influenced by thermodynamic effects. Huang et al. [22] investigated the acoustic waves induced by the oscillation and collapse of a single cavitation bubble. They found that rarefaction waves are generated during the bubble collapse stage due to the contraction of the single bubble. In addition, they showed that the velocity and pressure of the liquid field is increased after formation of the shock wave. Regarding simulations of a nanobubble, some of the previous studies were performed using a molecular dynamics (MD) simulation to investigate collapse dynamics of bubbles with a radius in the nanoscale range. Matsumoto et al. [23], dealing with a bubble collapsing in the Lennard-Jones liquid, investigated the variation of the surrounding pressure and temperature on the bubble’s volume during its collapse. A sharp temperature rise was observed as the bubble shrank after the uniform compression of the system.
Xiao et al. [24] found that the local temperature of the fluid inside the collapsing nanobubble increases up to five times the temperature of the bulk fluid. In addition to the simple fluids, the collapse of nanobubbles in complex fluids, including water, was investigated in some previous studies. Lugli et al. [25] studied the collapse of nanobubbles in water, indicating that the local water temperature may reach 4000 K. In addition, their results revealed that the nanobubble collapse time duration is in the range of 1 to 10 picoseconds. Ikemoto et al. [26] employed molecular dynamics simulations to study the conditions inside the bubble from an atomistic point of view, and they employed computational fluid dynamics to study the transfer of energy far away from the bubble. The bubble was formed by creating negative pressures in the simple Lennard-Jones system. Examining the Young-Laplace equation (the relationship between the pressure difference, the surface tension, and bubble radius) in water was among the studies performed by the molecular dynamics simulations of Matsumoto [27], Sekine et al. [28] and Liu et al. [29]. They studied the bubble dynamics without the presence of a shock wave. Vedadi et al. [30] studied the effect of shock waves on a bubble’s collapse and the associated formation of a nanojet by simulating the molecular dynamics and studying the relationship between the nanojet’s properties and the nanobubble’s radius. Schanz et al. [31] investigated molecular dynamics simulations of cavitation bubble collapse using molecular dynamics simulations, adopting a hard sphere model for the species inside the bubble. Moiseeva et al. [32] studied the MD simulations of surface nanobubbles on the liquid-solid interface, where the liquid phase consists of argon and dissolved neon. They also investigated the influence of gas concentration on the system behavior.
Zhan et al. [33] investigated the effect of a shock wave colliding with a nano/micro bubble using molecular dynamics simulations. They showed that the shock wave leads to the formation of a nano/micro jet, which damages adjacent solid boundaries. Furthermore, using molecular dynamics simulations, some researchers studied the effect of nanobubbles on lipid and amorphous silica. Nomura et al. [34] and Shekhar et al. [35] investigated the formation of a hemispherical pit on the surface of amorphous silica and the ionization of water, using reactive molecular dynamics simulations. By performing molecular dynamics simulations, Choubey et al. [36] investigated the molecular mechanism of poration in lipid bilayers due to shock-induced collapses of nanobubbles. Their results illustrated the impact of a water nanojet on the lipid bilayers for a nanobubble diameter equal to 40 nm. The coarse-grained molecular dynamic method was used to investigate the extent of damage to a lipid membrane by varying the position of the bubbles relative to each other on, (Santo and Berkowitz [37], Adhikari et al. [38] and Nan et al. [39]). It was shown that the induced shock wave cannot create holes or cavities in the absence of bubbles. The spatial distribution of the density and the timing diagram of the vertical pressure applied to the bubble were also discussed.
The effect of the shock wave velocity on the nanobubble and the deformation created on the membrane due to the nanobubble collapse was investigated by Sun et al. [40]. Their results showed that the water nanojets cause structural damages in the membrane. They indicated that the deformed bilayers are hemispherical and that water pores are generated when the shock velocities are sufficiently high. Becton et al. [41] studied the effects of nanobubble collapse on the cell membrane’s integrity. They showed that the cavitation nanobubble focuses the kinetic energy of the shock wave on a smaller area, inducing penetration at the edge of model cell. Wu and Adnan [42], carrying out molecular dynamics simulations, relied on the neural network of the brain to study the effect of a nanobubble collapsing on the membrane and its effect on its structure. They presented the influence of the size and location of nanobubbles. Hong et al. [43] performed molecular dynamics simulations to study the stability of nanobubbles in water. They showed that, for the nanobubbles with a certain radius to be stable, the interbubble distance should be smaller than the maximum interbubble distance. Relying on molecular dynamics simulations, Zhou et al. [44] investigated the exfoliation of the Mo S 2 layers induced by the collapse, and they validated their simulated results against experimental data. Their results revealed that the surface temperature reaches 3000 K, the pressure 20 GPa and the shear stress 10 GPa when the formed nanojet collides with Mo S 2 layers. Hu et al. [45] studied the effect of an electric field (0.2 V/nm) on the collapse of nanobubbles when forming a nanojet to create holes in a bio-membrane. Employing molecular dynamics simulations, Ghoohestani et al. [46] investigated the reactive-dynamic characteristic of a nanobubble collapse near a solid surface. They showed that the collision between a shock wave and a nanobubble leads to the collapse of the nanobubble, thereby forming a nanojet during the collapse process.
Summing up the literature review, we concluded that the dynamics of a single cavitation bubble near a solid boundary was mostly investigated at macro scales. In addition, there is no comprehensive study regarding the simulation of a nanobubble near a solid boundary, and most of these studies focused on the dynamics of the nanobubble near a membrane. Therefore, to fill this gap, we performed various numerical simulations to analyze the dynamics of a nanobubble near two different rigid boundaries, using molecular dynamics simulations. We simulated the dynamics of a single nanobubble near a flexible boundary and compared the dynamics of this nanobubble collapsing near two rigid boundaries. In addition, we analyzed the induced damage on the flexible and rigid boundaries. Section 2 presents the description of the dynamics of a single cavitation bubble near a flexible and a rigid boundary. Section 3 presents the numerical method of the molecular dynamics simulations. Section 4 shows the results of the nanobubble collapsing near a flexible and two rigid boundaries. Section 5 presents the conclusion of the present work.

2. Single Cavitation Bubble near Flexible and Rigid Boundaries

The molecular dynamics simulations of the cavitation nanobubble near a flexible surface and two different rigid surfaces was performed in this study in order to understand the mechanism of shock wave-induced nanobubble collapse and shock wave-induced erosion near the boundaries. The erosion formed on the boundaries may be due to a nanojet produced during the nanobubble collapse process. However, the shock wave itself cannot create a pit or erosion on a boundary in the absence of the nanobubble.
Figure 1a shows a schematic view of a single cavitation nanobubble near a solid boundary at a relative wall distance in a system after equilibration. In addition, Figure 1b,c show schematic views of the expected collapse dynamics of the single nanobubble near a rigid boundary made of Iron (Fe) and a flexible boundary made of Polyethylene (PE) and nanobubble collapse-induced erosion on the boundaries, respectively. In the left side of the system, a shock front can be seen in the system. The parameter d and w are the depth and width of the collapse-induced erosion area which can be formed on the boundary. The parameters R m a x and d represent the maximum nanobubble radius and the distance between the nanobubble center and the boundary. The erosion or damage formed on the flexible and rigid boundaries after the nanobubble collapse can be different. In other words, the depth and width of the damage which can be formed on the boundaries due to the multiple collapse of the nanobubble are different because of the various material properties of the boundaries and the intensity of the nanojet impact. The non-dimensional parameter γ is a relative wall distance and is defined as the ratio of the distance of the nanobubble center to the solid boundary and the maximum nanobubble radius as follows:
γ = s / R m a x

3. Numerical Method

For the numerical simulation, a molecular dynamics simulation was performed to study the nanoscale simulation of the single bubble dynamics near a flexible boundary and two rigid boundaries at different relative wall distances using LAMMPS [47]. The molecular dynamics simulation is a powerful tool for understanding the physics and chemistry governing nanoscale phenomena. For this aim, a system will be considered in the simulation which is a water box with dimensions of 36 × 18.5 × 16.5 nm containing about 0.4 × 10 6 to 1.0 × 10 6 water molecules. Then, by removing the water molecules from a special region, a solid boundary with a depth and height equivalent to the water box and a thickness of about 10 nm will be placed there. For the first simulation, the system equilibrates at a temperature of 300 K and a pressure of 1 atm. In the numerical simulations, the nanobubble was assumed to be initially spherical in fluid. The boundary conditions in all test cases are periodic in all directions. Then, a bubble is created by eliminating the water molecules with a radius of 5 nm. Considering that the gas inside the nanobubble can also be simulated, it is not necessary for the molecular dynamics study of the nanobubble, as it has been neglected in almost all previous MD studies. The reason for this is the small size of the nanobubble and the negligible effect of the presence of gas particles in the nanobubble in the nanojet creation and resulting damage on the surface. In the next step, at NVE, ensemble system particles will be then immediately given a high speed in the range of 10 km/s in the (−x) direction (0.1 ps). In this case, the left boundary condition in the x-direction is the wall/reflection so that the collision of system particles at high speed will cause a shock in the (+x) direction, see Figure 1a. Then, the generated shock wave can affect the nanobubble, which may collapse near the solid boundary. In all simulations, the boundary conditions in the y and z directions will be periodic. Temperature will also be calculated by averaging the atomic velocities utilizing equipartition theorem.
The simulation is first step performed in the NPT ensemble. Then, suddenly, a nanobubble is created in the NVE ensemble by deleting 100% of all the atoms of the considered sphere. Generally, there is a slight change in the density due to the nanobubble, which is negligible (less than 2%). Then, a shock is immediately created by accelerating the atoms in the −X direction (just about 2 ps) and then reflecting it at the left boundary. It should be mentioned that the volume change of the nanobubble until reaching the shock is insignificant (less than 3%). The considered ensemble during the shock wave is NVE. In order to investigate the effect of statistical uncertainties on our results, simulations were performed for different distributions of initial velocities. It was observed that the obtained results for the same input parameters but different initial conditions are very similar. Therefore, the results are reported based on one initial condition. The interatomic interactions in solid boundaries for Al and Fe (bbc) are described by Lennard-Jones potential as:
U ( r ) = 4 ε ( σ r ) 12 ( σ r ) 6
where r is interatomic distance between two atoms, ε is the energy parameter and σ is the distance parameter and for PE by REBO potential. The coefficients for Lennard-Jones potential are shown in Table 1. The mixing rule is used to calculate the coefficients of interaction between solid and water.

4. Results

In this section, we presented the dynamics of a nanobubble collapsing near the flexible surface polyethylene (PE) and near the rigid aluminum (Al) and iron (Fe) boundaries. Furthermore, the contours of velocity and pressure impacts of the nanobubble’s collapse dynamics near the three boundaries at two different relative wall distances are presented. Figure 2 shows the dynamics of a single nanobubble collapsing near the rigid iron boundary (Fe) at the relative wall distance γ = 1.8. White circles and blue vertical rectangles represent the nanobubble and the solid boundary in this figure, respectively. The snapshots show that the total collapse process time of the nanobubble took about 1.2 ps after the bubble attained its maximum radius. The formation of a nanojet inside the bubble expanding from left to right towards the solid surface is seen to have occurred between time steps t = 0.6 and t = 1.0 ps. The first collapse occurred at time t = 1.2 ps. Figure 3 shows the dynamics of a single nanobubble collapsing near the iron surface at the relative wall distance of γ = 1.3. As seen, the first collapse occurred at time t = 1.2 ps. The volume of the nanobubble near the iron surface in the collapse process at γ = 1.3 is slightly larger than the volume of the nanobubble near the iron surface at γ = 1.8. We deduced that the dynamics of the nanobubble collapse near the iron surface at the relative wall distances of γ = 1.3 and 1.8 were similar to each other. Furthermore, the first collapse also occurred at the time step of t = 1.2 ps for both relative wall distances.
Figure 4 and 
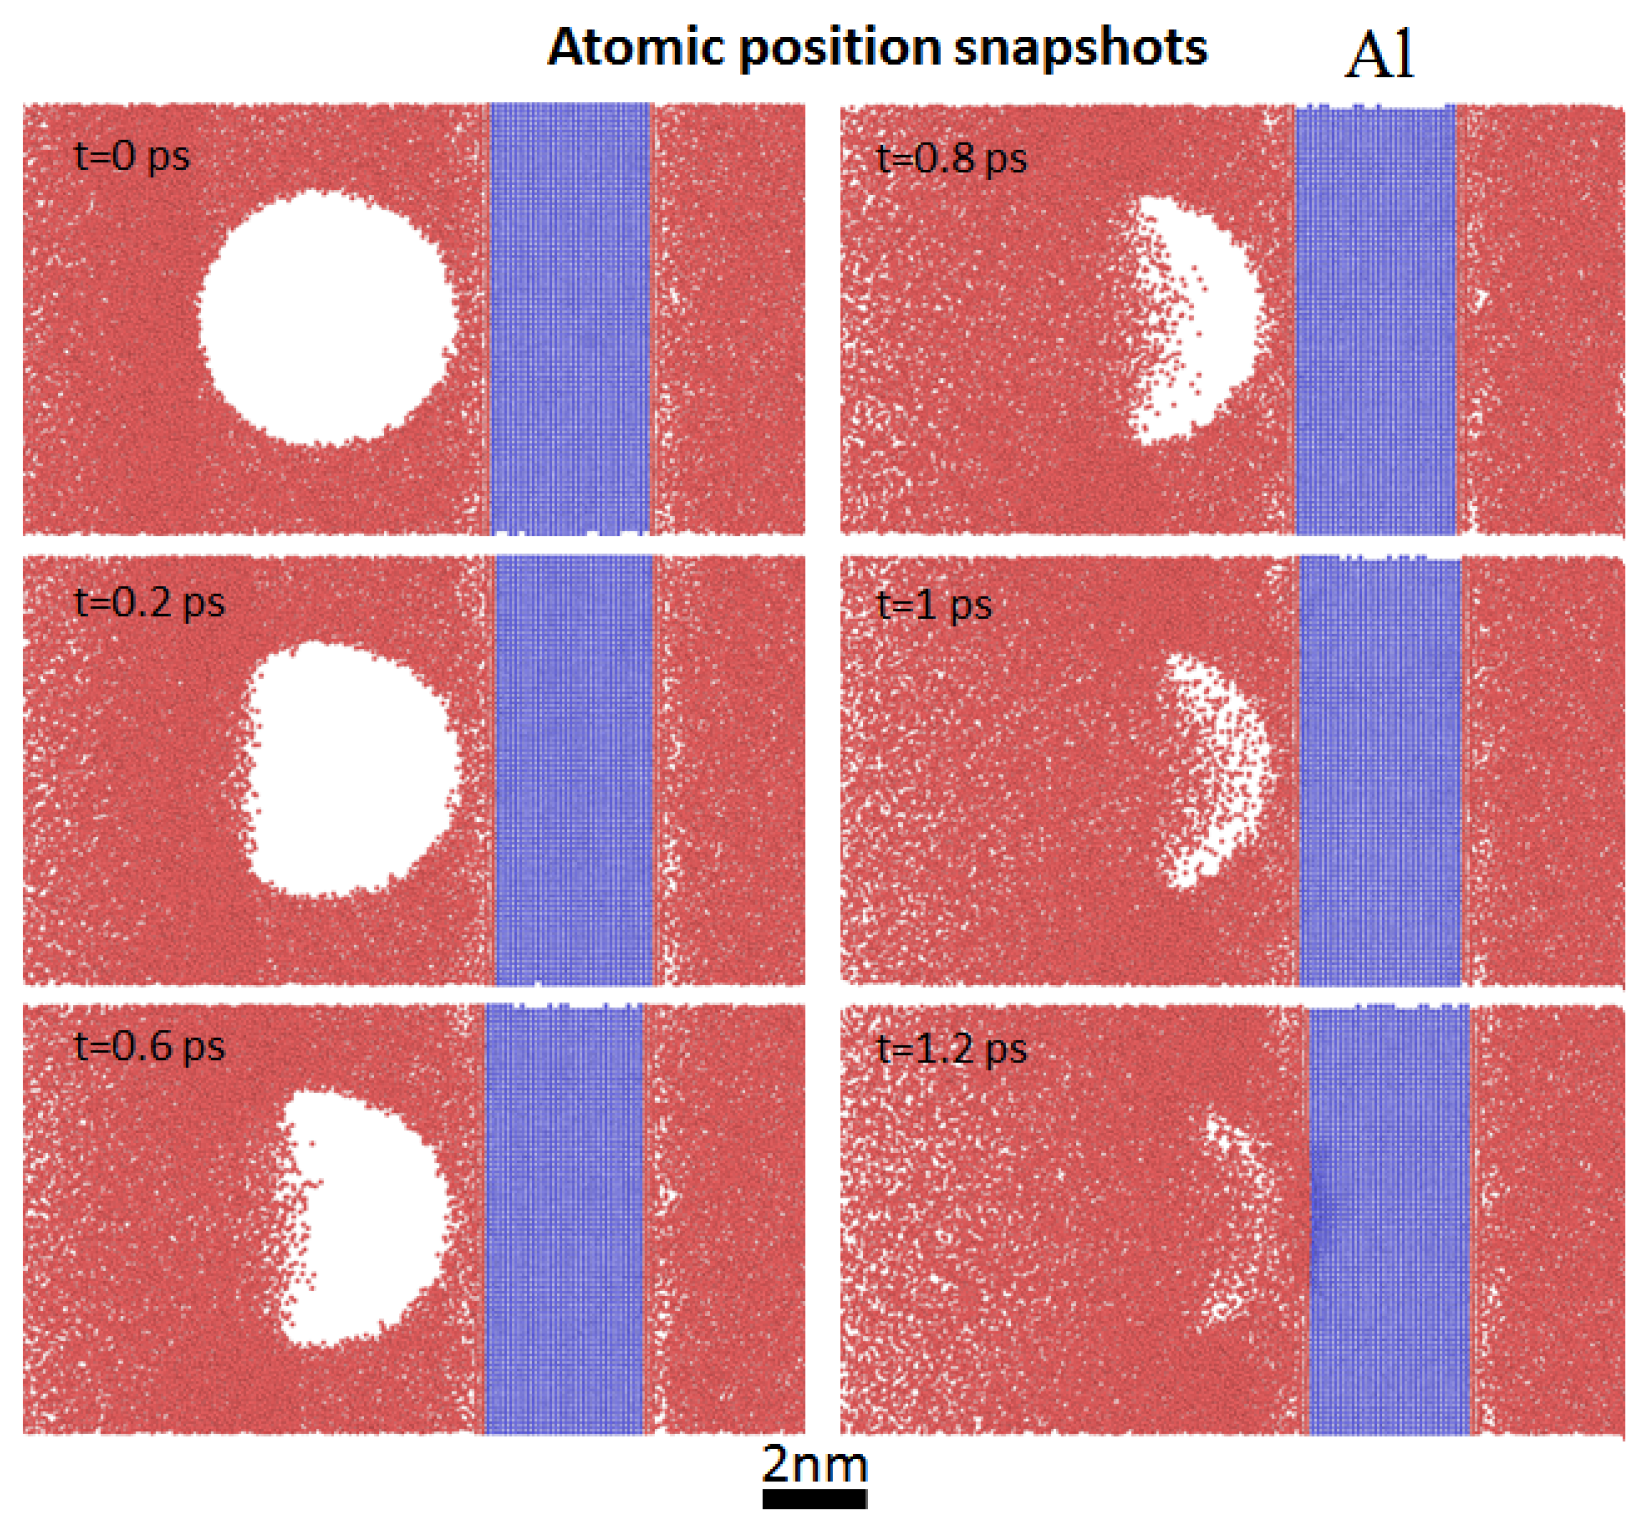
Figure 5 show the atomic position snapshots of the dynamics of a single nanobubble collapsing near the rigid aluminum boundary (Al) at the relative wall distances of γ = 1.8 and γ = 1.3, respectively. More snapshots of the atomic position of the dynamics of a single nanobubble collapsing are provided in Supplementary Materials. For both relative wall distances, the total collapse time of the nanobubble was about 1.2 ps after the nanobubble reached its maximum radius. For both relative wall distances, the generation of a nanojet at the upper interface of the nanobubble surface occurred between times t = 0.6 and 1.0 ps. These results revealed that the first nanobubble collapse occurred at time t = 1.2 ps for both cases. However, the nanobubble’s volume at the time the nanojet impacted on the surface at the relative wall distance of γ = 1.3 was greater than the nanobubble’s volume at the relative wall distance of γ = 1.8. We deduced that, at these same relative wall distances, collapse dynamics near the aluminum and the iron boundaries were similar to each other. In other words, changing the rigid boundary from aluminum to iron did not significantly affect the dynamics of the nanobubble collapsing at this relative wall distance.
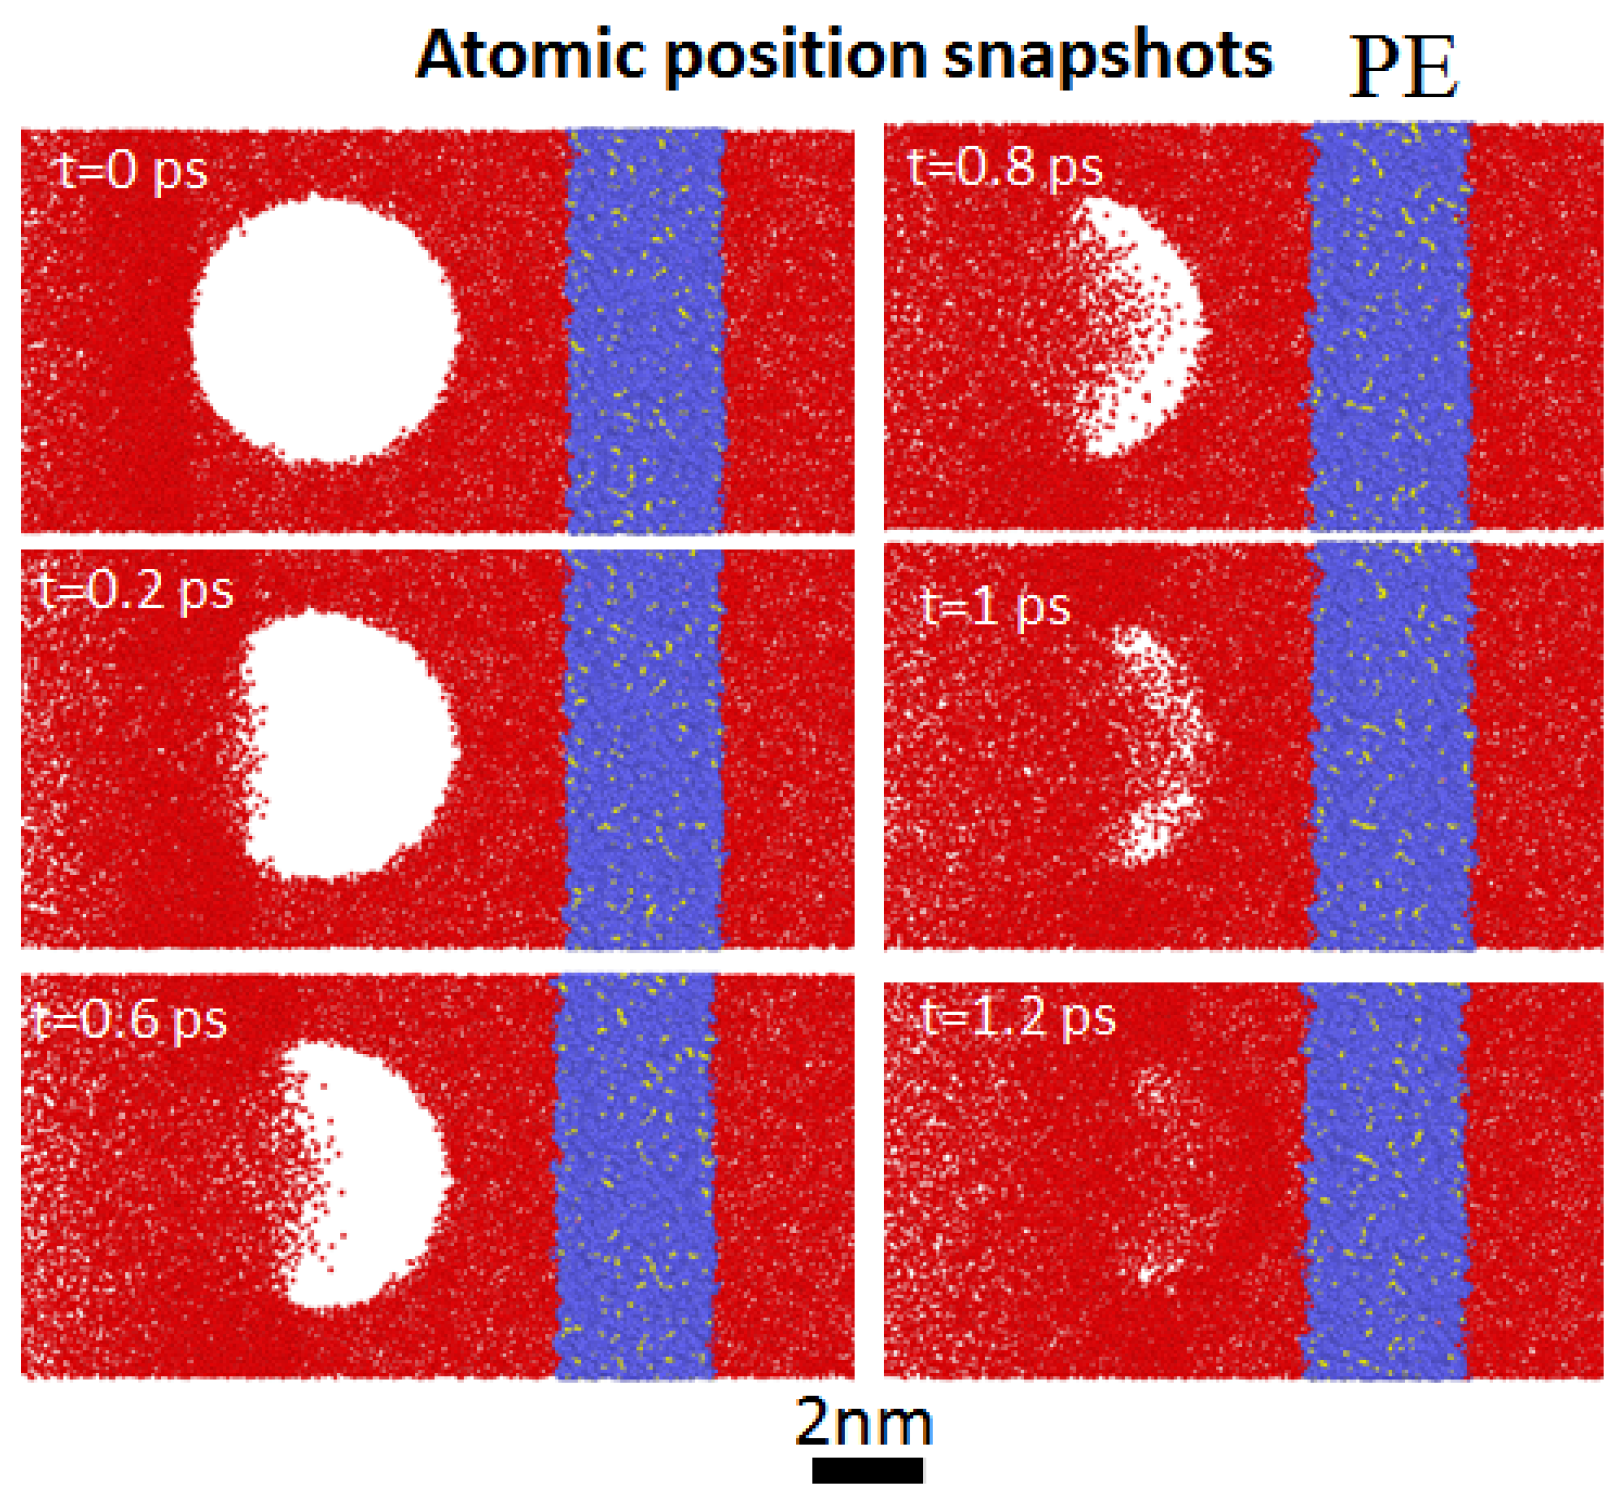
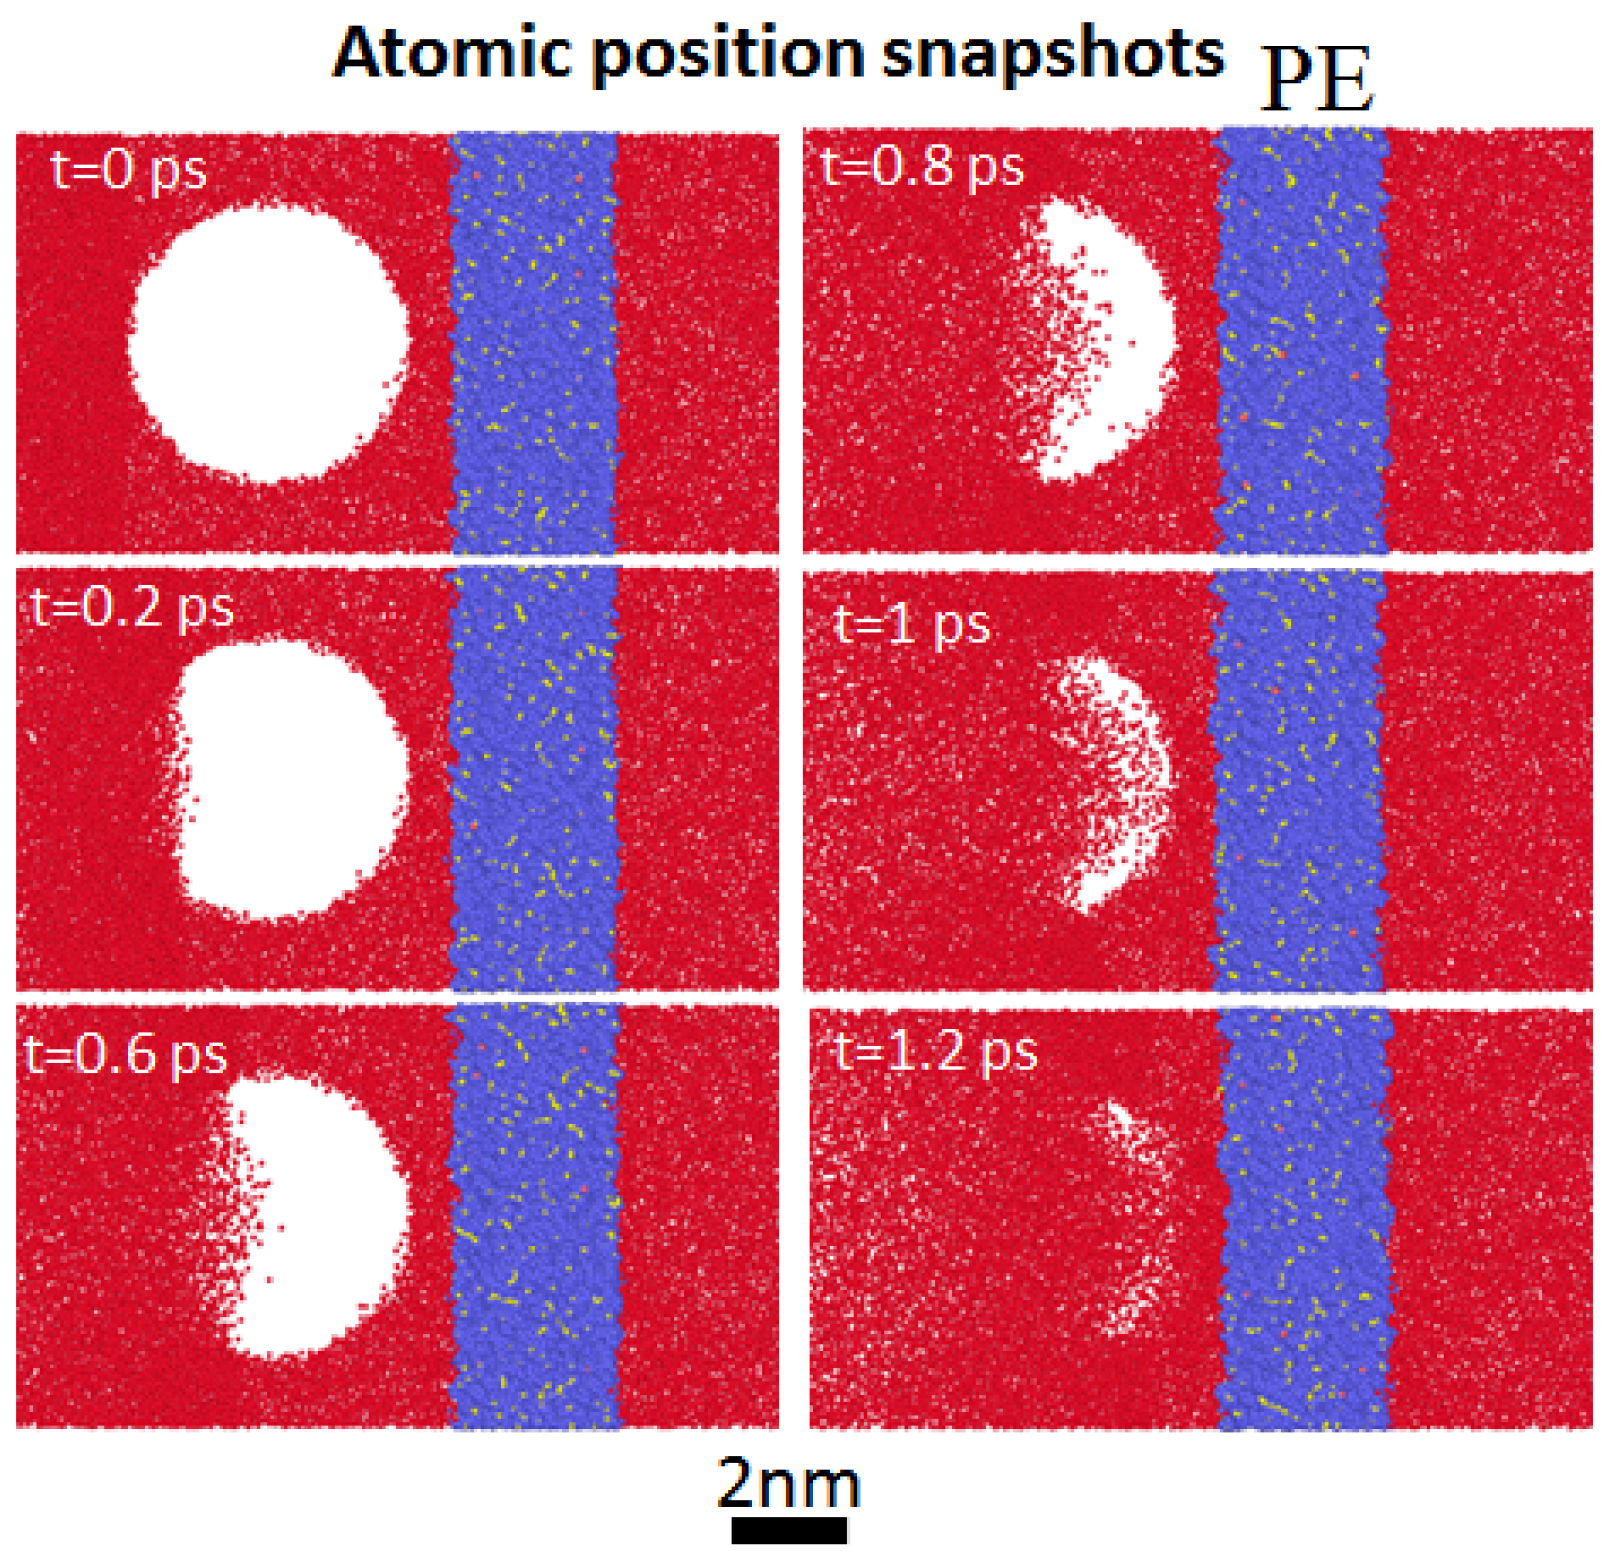
Figure 6 and Figure 7 show snapshots of the atomic position of the single nanobubble dynamics near the flexible polyethylene (PE) boundary collapsing at the relative wall distances of γ = 1.8 and 1.3, respectively. As seen, the first collapse occurred at time t = 1.2 ps for the bubble at both relative wall distances. The shapes of the nanobubble near the polyethylene (PE) surface during its collapse at both relative wall distances were similar; however, its volume was slightly greater at the relative wall distance of γ = 1.3 than at the relative wall distance of γ = 1.8. For the bubble at both relative wall distances, the propagating shock wave generated a liquid nanojet moving towards the polyethylene (PE) surface.
Figure 8 and 
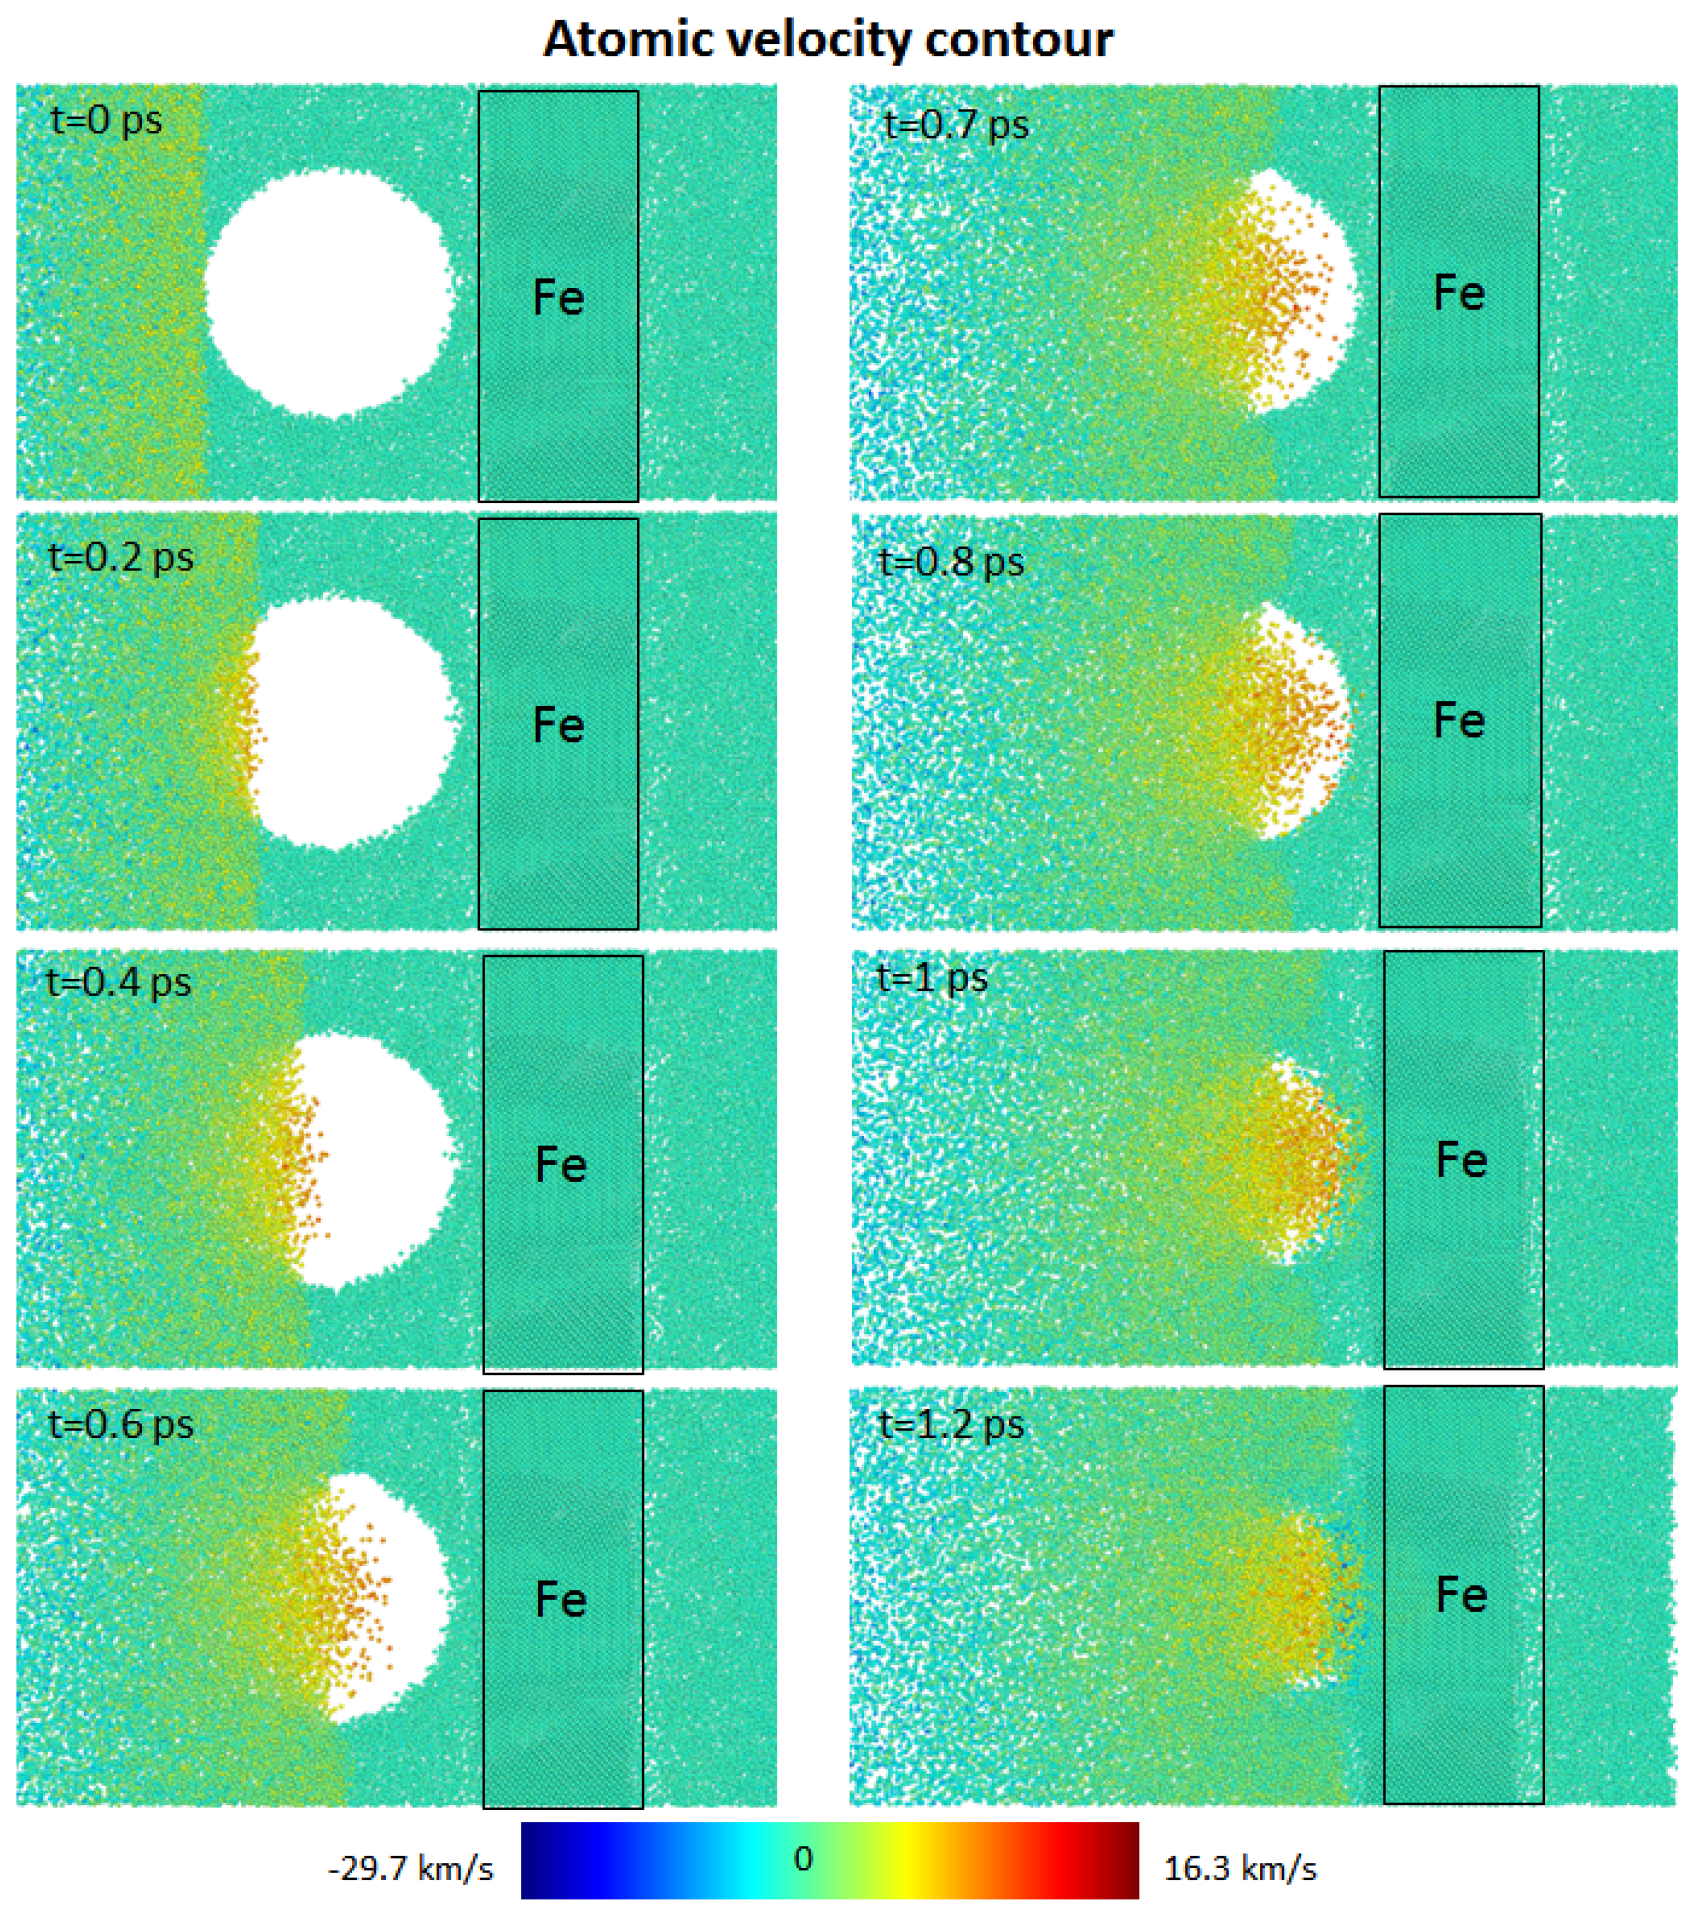
Figure 9 show the atomic velocity contour of the nanobubble collapse dynamics near the rigid iron boundary (Fe) at the relative wall distances of γ = 1.8 and 1.3, respectively. The maximum atomic velocity in the direction of the nanobubble’s center shows the nanojet moving towards the solid surface. As seen, the shock wave particles collided with the left side of the nanobubble surface and compressed the bubble’s volume as the shock wave propagated (Figure 8, t = 0 ps to 0.2 ps). As the shock wave reached the bubble’s center, the bubble’s volume decreased (Figure 8, t = 0.4 ps to 0.6 ps). As the shock particles reached the right surface of the nanobubble between times t = 0.7 ps and 1.0 ps, the bubble’s volume reached its lowest value. Finally, the nanobubble collapsed entirely at the final collapse stage, and the nanojet impacting on the solid boundary at t = 1.2 ps is shown in Figure 8.
Figure 10 and Figure 11 show the atomic velocity contour of the nanobubble’s dynamics collapsing near the rigid aluminum (Al) boundary at the relative wall distances of γ = 1.8 and 1.3, respectively. Near the aluminum boundary, the maximum atomic velocity was about 16 km/s for both relative wall distances. Based on the atomic velocity contour, the bubble’s collapse and the impact of the nanojet occurred at time t = 1.2 ps for both relative wall distances.
Figure 12 and Figure 13 show the atomic velocity contour of the nanobubble’s dynamics collapsing near the flexible polyethylene (PE) boundary at the relative wall distances of γ = 1.8 and 1.3, respectively. The maximum atomic velocity was about 16 km/s at γ = 1.8 and about 17 km/s at γ = 1.3. The bubble collapsed completely at time t = 1.2 ps for both relative wall distances. The nanojet impacting on the polyethylene surface occurred at t = 1.2 ps, as seen in Figure 12 and Figure 13. Figure 14 illustrates the nanobubble’s collapse-induced erosion on the rigid iron (Fe) boundary for the relative wall distances of γ = 1.3 and 1.8. For the relative wall distances of γ = 1.8, the depth and width of the collapse-induced damage on the rigid iron boundary were 0.35 nm and 6.4 nm, respectively. In other words, the width of the collapse-induced erosion on the iron surface was significantly larger than the depth of this erosion. However, for the relative wall distance of γ = 1.3, the depth and width of the collapse-induced damage on the iron surface were 0.47 nm and 6.4 nm, respectively. This meant that the effect of relative wall distance on the erosion width was not significant for the nanobubble collapsing near the iron boundary. At the relative wall distance of γ = 1.3, however, more damage occurred, as seen by the depth of the iron surface, compared to the nanobubble’s collapse damage at the relative wall distance of γ = 1.8.
Figure 15 illustrates the nanobubble’s collapse-induced erosion on the rigid aluminum (Al) boundary for the relative wall distances of γ = 1.3 and 1.8. We deduced that the depth and width of the erosion on the rigid aluminum boundary for the relative wall distances of γ = 1.8 were 0.5 and 11.8 nm, respectively. For the relative wall distance of γ = 1.3, the depth and width of the erosion were 0.63 and 7.0 nm, respectively. That is, the relative wall distance significantly affected the nanobubble’s collapse damage on the aluminum surface. However, for relative wall distance of γ = 1.3, the erosion width formed on the aluminum surface was smaller than the erosion width for the relative wall distance of γ = 1.8. This was likely due to the nanojet impact focusing on the central section of the aluminum surface for the relative wall distance of γ = 1.3.
Figure 16 illustrates the nanobubble’s collapse-induced erosion on the flexible polyethylene (PE) boundary for relative wall distances of γ = 1.3 and 1.8. Here, the depth and width of the damage for the relative wall distance of γ = 1.8 were 6.0 and 10 nm, respectively. However, for relative wall distance of γ = 1.3, the depth and width of the erosion were 6 and 12.0 nm, respectively. Thus, the depth damage of the polyethylene surface for the relative wall distance of γ = 1.3 was greater than this depth damage for the relative wall distance of γ = 1.8. As the width damage was 6 nm, it was impossible to calculate the depth damage. The width damage on the polyethylene surface for the relative wall distance of γ = 1.3 was slightly larger than the width of damage for the relative wall distance of γ = 1.8. In general, we deduced that the collapse-induced erosion on the polyethylene (PE) boundary was greater than the erosion on the rigid aluminum and iron boundaries. The 
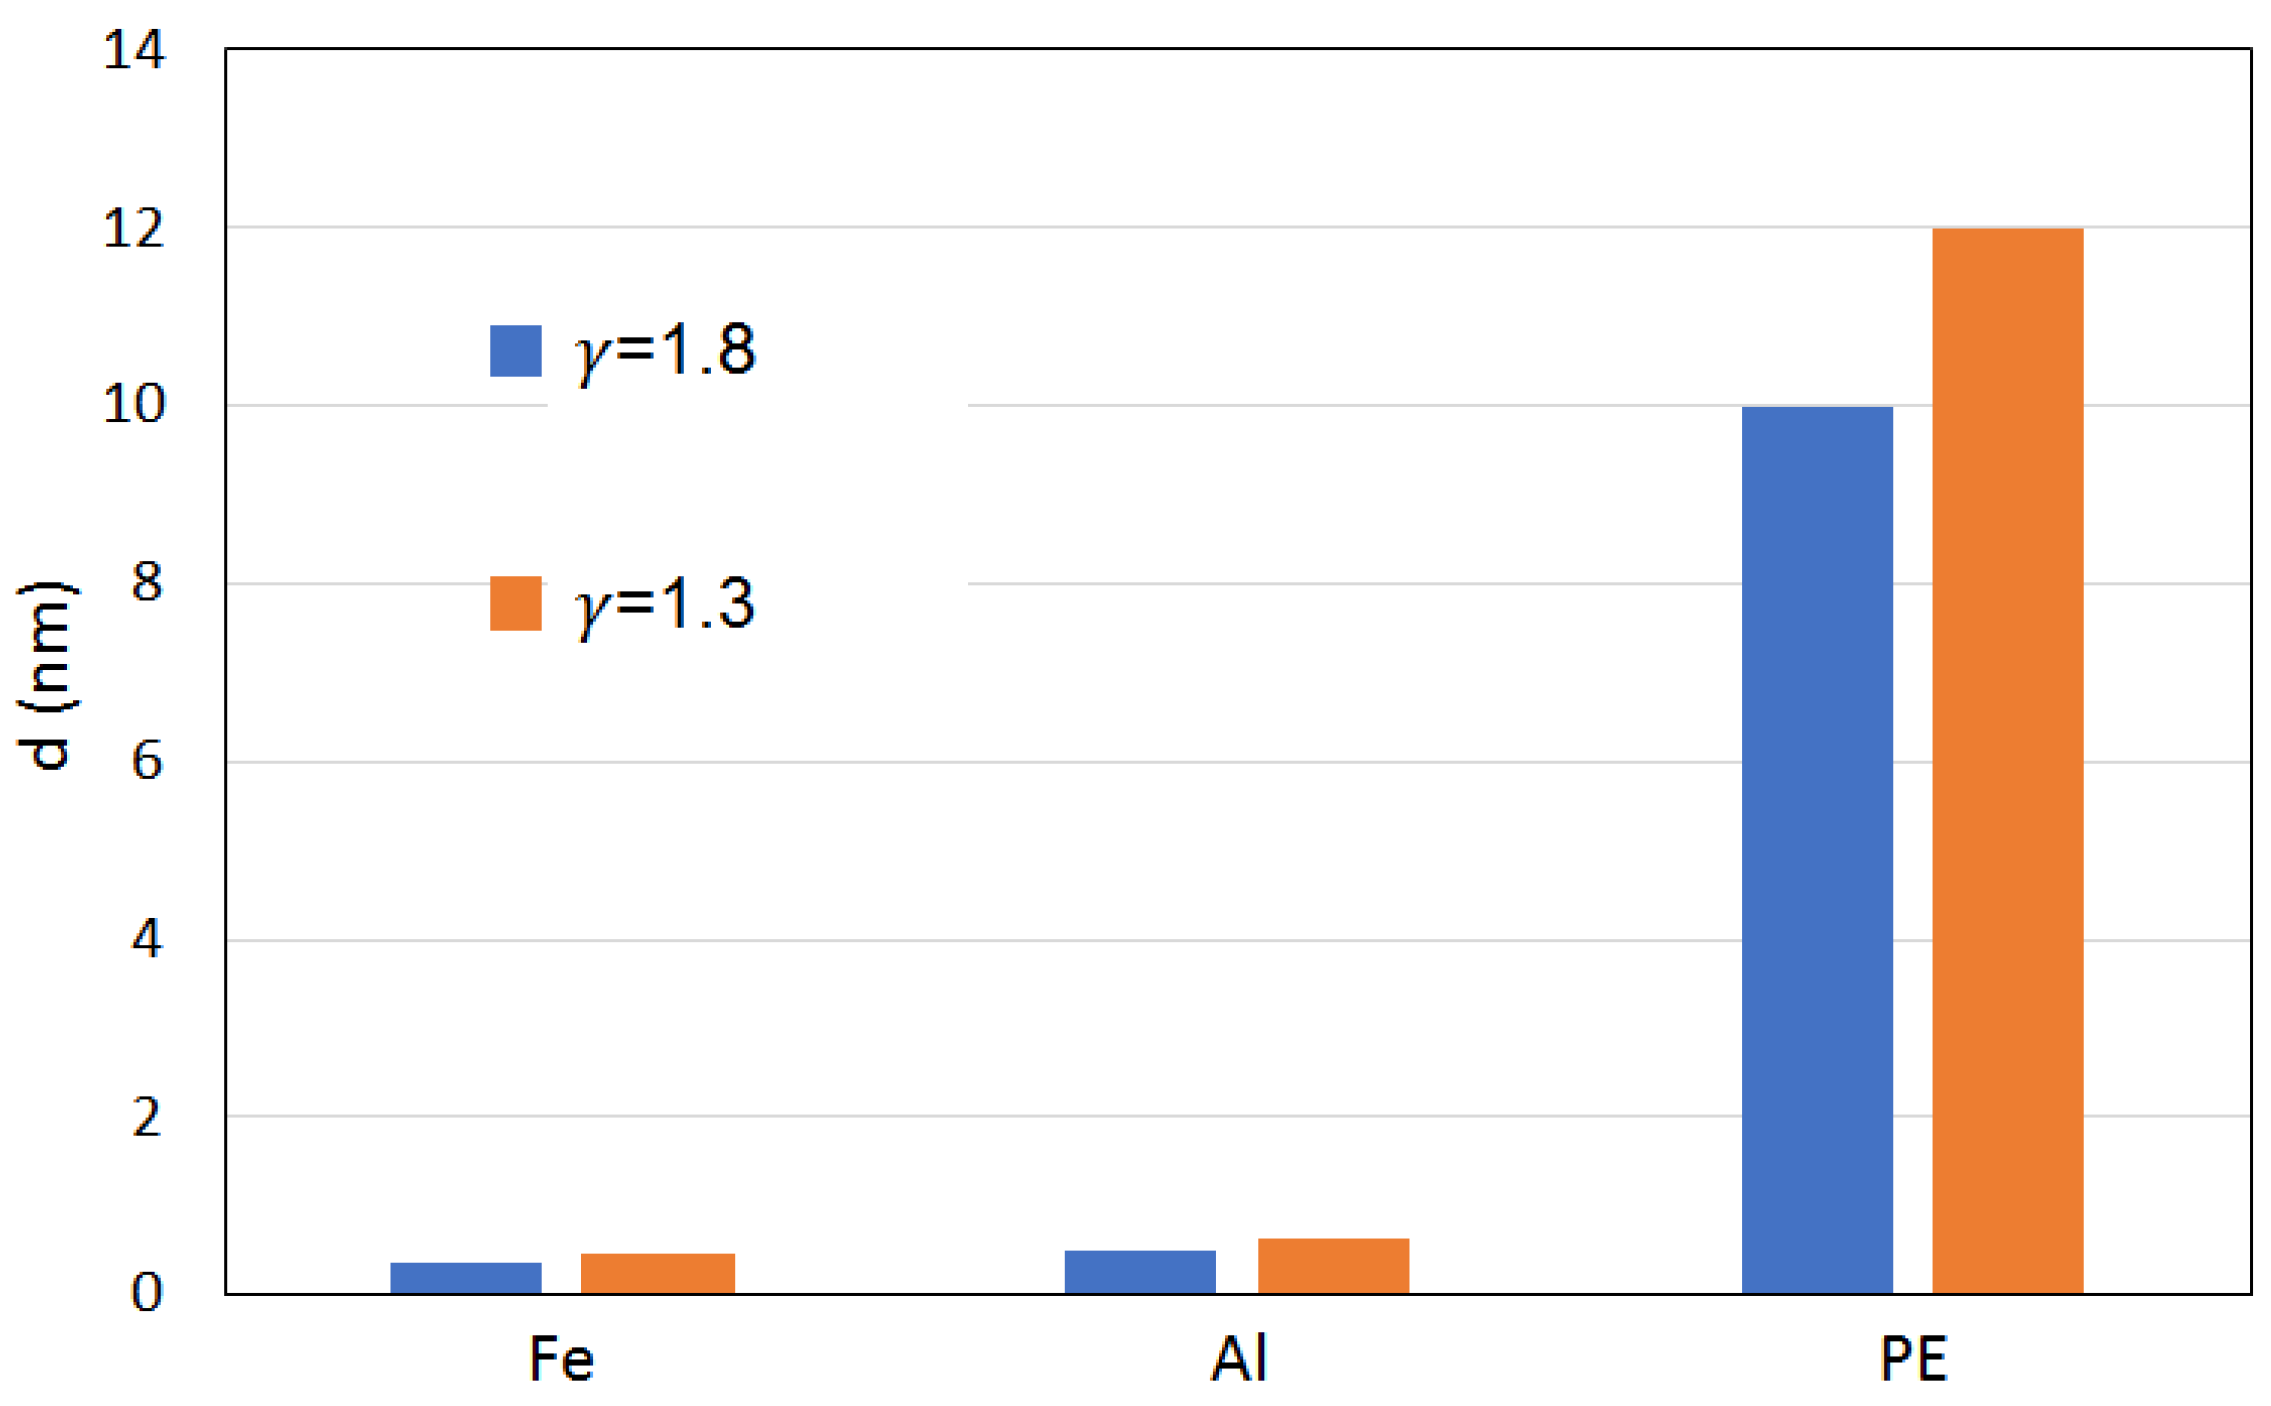
Figure 17 shows the summary of the nanobubble’s collapse-induced erosion on all three boundaries for relative wall distances of γ = 1.3 and 1.8.

5. Conclusions

Using a mirror wall method based on molecular dynamics simulations, the collapse dynamics of a shock wave-induced single nanobubble was investigated. The nanobubble collapse near a flexible polyethylene boundary and near a rigid aluminum boundary and a rigid iron boundary for two different relative wall distances were analyzed. A momentum mirror protocol inside a molecular system generated the shock wave impinging the nanobubble. The shrinkage and collapse of the nanobubble occurred due to the collision of the shock with the nanobubble’s surface. Results revealed that a liquid nanojet formed during the collapse stages of the single nanobubble collapsing near flexible and rigid boundaries. The impact of the nanojet on these boundaries was observed for both relative wall distances. The total time of the nanobubble collapsing near the two solid boundaries was similar to the total time of the nanobubble’s collapsing near the flexible boundary. In addition, the dynamics of the nanobubble’s collapse were similar for the nanobubble collapsing near the two rigid surfaces for the same relative wall distance. From the collapse-induced damage point of view, the depth damage of the polyethylene, iron, and aluminum boundaries for the relative wall distance of γ = 1.3 were 6.0, 0.47 and 0.63 nm, respectively. This meant that the depth of the collapse-induced damage for the nanobubble collapsing near the iron boundary was slightly lower than for the nanobubble collapsing near the aluminum boundary. However, the collapse-induced erosion on the polyethylene boundary was greater than that of the two rigid boundaries. In the future, we plan to study the dynamics of a nanobubble collapsing at lower relative wall distances to improve our understanding of the effects of relative wall distances on the collapse-induced damage at nanoscale.

Supplementary Materials

The following supporting information can be downloaded at: https://www.mdpi.com/article/10.3390/fluids8050154/s1, Figure S1: Atomic position snapshots of the collapse dynamics of a single nanobubble near Iron (Fe) at relative wall distance γ = 1.8; Figure S2: Atomic position snapshots of the collapse dynamics of a single nanobubble near Aluminum (Al) at relative wall distance γ = 1.8; Figure S3: Atomic position snapshots of the collapse dynamics of a single nanobubble near Polyethylene (PE) at relative wall distance γ = 1.8

Author Contributions

Conceptualization, E.K.; methodology, E.K.; validation, A.R. and E.K.; formal analysis, E.K. and A.R.; investigation, A.R.; resources, A.R. and E.K.; data curation, E.K. and A.R.; writing—original draft preparation, E.K.; writing—review and editing, E.K.; visualization, A.R.; supervision, E.K. and O.E.M.; project administration, E.K. All authors have read and agreed to the published version of the manuscript.

Funding

This research received no external funding.

Data Availability Statement

The data presented in this study are available in the article.

Conflicts of Interest

The authors declare no conflict of interest.

References

  1. Reisman, G.; Wang, Y.; Brennen, C. Observations of shock waves in cloud cavitation. J. Fluid Mech. 1998, 355, 255–283. [Google Scholar] [CrossRef]
  2. Dular, M.; Bachert, B.; Stoffel, B.; Sirok, B. Relationship between cavitation structures and cavitation damage. Wear 2004, 257, 1176–1184. [Google Scholar] [CrossRef]
  3. Patella, R.; Choffat, T.; Reboud, J.; Archer, A. Mass loss simulation in cavitation erosion: Fatigue criterion approach. Wear 2013, 300, 205–215. [Google Scholar] [CrossRef]
  4. Huang, B.; Zhao, Y.; Wang, G. Large eddy simulation of turbulent vortex-cavitation interactions in transient sheet/cloud cavitating flows. Comput. Fluids 2014, 92, 113–124. [Google Scholar] [CrossRef]
  5. Kadivar, E. Experimental and Numerical Investigations of Cavitation Control Using Cavitating-Bubble Generators. Ph.D. Thesis, University of Duisburg-Essen, Duisburg, Germany, 2020. [Google Scholar]
  6. Kadivar, E.; Ochiai, T.; Iga, Y.; Moctar, O. An experimental investigation of transient cavitation control on a hydrofoil using hemispherical vortex generators. J. Hydrodyn. 2020, 33, 1139–1147. [Google Scholar] [CrossRef]
  7. Kadivar, E.; Phan, T.; Park, W.; Moctar, O. Dynamics of a single cavitation bubble near a cylindrical rod. Phys. Fluids 2021, 33, 113315. [Google Scholar] [CrossRef]
  8. Koeksal, Ç.; Usta, O.; Aktas, B.; Atlar, M.; Korkut, E. Numerical prediction of cavitation erosion to investigate the effect of wake on marine propellers. Ocean Eng. 2021, 239, 109820. [Google Scholar] [CrossRef]
  9. Lin, Y.; Kadivar, E.; Moctar, O.; Neugebauer, J.; Schellin, T. Experimental investigation on the effect of fluid–structure interaction on unsteady cavitating flows around flexible and stiff hydrofoils. J. Phys. Fluids 2022, 34, 083308. [Google Scholar] [CrossRef]
  10. Sadri, M.; Kadivar, E. Numerical investigation of the cavitating flow and the cavitation-induced noise around one and two circular cylinders. Ocean. Eng. 2023, 277, 114178. [Google Scholar] [CrossRef]
  11. Lauterborn, W.; Bolle, H. Experimental investigations of cavitation-bubble collapse in the neighbourhood of a solid boundary. J. Fluid Mech. 1975, 72, 391–399. [Google Scholar] [CrossRef]
  12. Philipp, A.; Lauterborn, W. Cavitation erosion by single laser-produced bubbles. J. Fluid Mech. 1998, 361, 75–116. [Google Scholar] [CrossRef]
  13. Tomita, Y.; Shima, A. Mechanisms of impulsive pressure generation and damage pit formation by bubble collapse. J. Fluid Mech. 1986, 169, 535–564. [Google Scholar] [CrossRef]
  14. Koch, M. Laser Cavitation Bubbles at Objects: Merging Numerical and Experimental Methods; University of Goettingen: Göttingen, Germany, 2020. [Google Scholar]
  15. Kadivar, E.; Moctar, O.; Sagar, H. Experimental study of the influence of mesoscale surface structuring on single bubble dynamics. J. Ocean. Eng. 2022, 260, 111892. [Google Scholar] [CrossRef]
  16. Vogel, A.; Lauterborn, W. Acoustic transient generation by laser-produced cavitation bubbles near solid boundaries. J. Acoust. Soc. Am. 1988, 84, 719–731. [Google Scholar] [CrossRef]
  17. Tomita, Y.; Robinson, P.; Tong, R.; Blake, J. Growth and collapse of cavitation bubbles near a curved rigid boundary. J. Fluid Mech. 2002, 466, 259–283. [Google Scholar] [CrossRef]
  18. Lindau, O.; Lauterborn, W. Cinematographic observation of the collapse and rebound of a laser-produced cavitation bubble near a wall. J. Fluid Mech. 2003, 479, 327–348. [Google Scholar] [CrossRef]
  19. Dular, M.; Požar, T.; Zevnik, J.; Petkovšek, R. High speed observation of damage created by a collapse of a single cavitation bubble. Wear 2019, 418–419, 13–23. [Google Scholar] [CrossRef]
  20. Kadivar, E.; Moctar, O.; Skoda, R.; Löschner, U. Experimental study of the control of cavitation-induced erosion created by collapse of single bubbles using a micro structured riblet. Wear 2021, 486–487, 204087. [Google Scholar] [CrossRef]
  21. Phan, T.-H.; Kadivar, E.; Nguyen, V.-T.; el Moctar, O.; Park, W.-G. Thermodynamic effects on single cavitation bubble dynamics under various ambient temperature conditions. J. Phys. Fluids 2022, 34, 023318. [Google Scholar] [CrossRef]
  22. Huang, G.; Zhang, M.; Han, L.; Ma, X.; Huang, B. Physical investigation of acoustic waves induced by the oscillation and collapse of the single bubble. Ultrason. Sonochem. 2021, 72, 105440. [Google Scholar] [CrossRef]
  23. Matsumoto, M.; Miyamoto, K.; Ohguchi, K.; Kinjo, T. Molecular Dynamics Simulation of a Collapsing Bubble. Prog. Theor. Phys. Suppl. 2000, 138, 728. [Google Scholar] [CrossRef]
  24. Xiao, C.; Heyes, D.; Powles, J. The Collapsing Bubble in a Liquid by Molecular Dynamics Simulations. Mol. Phys. 2002, 100, 3451. [Google Scholar] [CrossRef]
  25. Lugli, F.; Höfinger, S.; Zerbetto, F. The Collapse of Nanobubbles in Water. J. Am. Chem. Soc. 2005, 127, 8020. [Google Scholar] [CrossRef] [PubMed]
  26. Ikemoto, N.; Kinouchi, S.; Matsumoto, M. MD-CFD hybrid simulation of a nanobubble. In Proceedings of the ASME Heat Transfer Summer Conference, HT2007-32647, Vancouver, BC, Canada, 8–12 July 2007; pp. 71–76. [Google Scholar]
  27. Matsumoto, M. Surface Tension and Stability of a Nanobubble in Water: Molecular Simulation. J. Fluid Sci. Technol. 2008, 3, 9220. [Google Scholar] [CrossRef]
  28. Sekine, M.; Yasuoka, K.; Kinjo, T.; Matsumoto, M. Liquid-Vapor nucleation simulation of Lennard-Jones fluid by Molecular Dynamics Method. Fluid Dyn. Res. 2008, 40, 597. [Google Scholar] [CrossRef]
  29. Liu, G.; Fu, Q.; Kang, J. Cavitation and negative pressure: A flexible water model molecular dynamics simulation. Int. J. Stat. Probab. 2019, 8, 172. [Google Scholar] [CrossRef]
  30. Vedadi, M.; Choubey, A.; Nomura, K.; Kalia, R.; Nakano, A.; Vashishta, P.; Duin, A. Structure and dynamics of shock-induced nanobubble collapse in water. Phys. Rev. Lett. 2010, 105, 014503. [Google Scholar] [CrossRef] [PubMed]
  31. Schanz, D.; Metten, B.; Kurz, T.; Lauterborn, W. Molecular dynamics simulations of cavitation bubble collapse and sonoluminescence. New J. Phys. 2012, 14, 113019. [Google Scholar] [CrossRef]
  32. Moiseeva, E.F.; Malyshev, V.L.; Marin, D.F.; Gumerov, N.A.; Akhatov, I.S. Molecular Dynamics Simulations of Nanobubbles Formation Near the Substrate in a Liquid With Dissolved Gas. In Proceedings of the ASME 2014 International Mechanical Engineering Congress and Exposition IMECE, Montreal, QC, Canada, 14–20 November 2014. [Google Scholar]
  33. Zhan, S.; Duan, H.; Pan, L.; Tu, J.; Jia, D.; Yang, T.; Li, J. Molecular dynamics simulation of shock-induced microscopic bubble collapse. Phys. Chem. Chem. Phys. 2021, 23, 8446–8455. [Google Scholar] [CrossRef]
  34. Nomura, K.; RKKalia, A.; Vashishta, P.; Duin, A. Mechanochemistry of shock-induced nanobubble collapse near silica in water. Appl. Phys. Lett. 2012, 101, 073108. [Google Scholar] [CrossRef]
  35. Shekhar, A.; Nomura, K.; Kalia, R.; Nakano, A.; Vashishta, P. Nanobubble collapse on a silica surface in water: Billion-Atom reactive molecular dynamics simulations. Phys. Rev. Lett. 2013, 111, 184503. [Google Scholar] [CrossRef] [PubMed]
  36. Choubey, A.; Vedadi, M.; Nomura, K.; Kalia, R.; Nakano, A.; Vashishta, P. Poration of lipid bilayers by shock-induced nanobubble collapse. Appl. Phys. Lett. 2011, 98, 023701. [Google Scholar] [CrossRef]
  37. Santo, K.; Berkowitz, M. shock wave-induced collapse of arrays of nanobubbles located next to a lipid membrane: Coarse-Grained computer simulations. J. Phys. Chem. B 2015, 119, 8879. [Google Scholar] [CrossRef] [PubMed]
  38. Adhikari, U.; Goliaei, A.; Berkowitz, M. Mechanism of membrane poration by shock wave-induced nanobubble collapse: A molecular dynamics study. J. Phys. Chem. B 2015, 119, 6225. [Google Scholar] [CrossRef]
  39. Nan, N.; Si, D.; Hu, G. Nanoscale cavitation in perforation of cellular membrane by shock-wave induced nanobubble collapse. J. Chem. Phys. 2018, 149, 074902. [Google Scholar] [CrossRef]
  40. Sun, D.; Lin, X.; Zhang, Z.; Gu, N. Impact of shock-induced lipid nanobubble collapse on a phospholipid membrane. J. Phys. Chem. C 2016, 120, 18803. [Google Scholar] [CrossRef]
  41. Becton, M.; Averett, R.; Wang, X. Effects of nanobubble collapse on cell membrane integrity. J. Micromech. Mol. Phys. 2017, 2, 1750008. [Google Scholar] [CrossRef]
  42. Wu, Y.; Adnan, A. Effect of shock-induced cavitation bubble collapse on the damage in the simulated perineuronal Net of the Brain. Sci. Rep. 2017, 7, 5323. [Google Scholar] [CrossRef]
  43. Hong, S.; Choe, S.; Jong, U.; Pak, M.; Yu, C. The maximum interbubble distance in relation to the radius of spherical stable nanobubble in liquid water: A molecular dynamics study. Fluid Phase Equilibria 2019, 487, 45–51. [Google Scholar] [CrossRef]
  44. Zhou, G.; Rajak, P.; Susarla, S.; Ajayan, P.; Kalia, R.; Nakano, A.; Vashishta, P. Molecular simulation of MoS2 exfoliation. Sci. Rep. 2018, 8, 16761. [Google Scholar] [CrossRef]
  45. Hu, Q.; Zhang, L.; Joshi, R. Numerical evaluations of membrane poration by shockwave induced multiple nanobubble collapse in presence of electric fields for transport through cells. AIP Adv. 2019, 9, 045006. [Google Scholar] [CrossRef]
  46. Ghoohestani, M.; Rezaee, S.; Kadivar, E.; Esmaeilbeig, M. Reactive-dynamic characteristic of a nanobubble collapse near a solid boundary using molecular dynamic simulation. Phys. Fluids 2023, 35, 022003. [Google Scholar] [CrossRef]
  47. Plimpton, S. Fast parallel algorithms for short-range molecular dynamics. J. Comput. Phys. 1995, 117, 1–19. [Google Scholar] [CrossRef]
Figure 1. (a) Schematic view of a single nanobubble near a solid boundary at a relative wall distance in a system after equilibration. (b) Schematic view of the collapse dynamics of a single nanobubble near a rigid boundary, (c) Schematic view of the collapse dynamics of a single nanobubble near a flexible boundary.
Fluids 08 00154 g001
Figure 2. Atomic position snapshots of the collapse dynamics of a single nanobubble near the rigid boundary Iron (Fe) using molecular dynamics simulations at relative wall distance γ = 1.8. The nanobubble radius is initially 5 nm.
Fluids 08 00154 g002
Figure 3. Atomic position snapshots of the collapse dynamics of a single nanobubble near the rigid boundary Iron (Fe) using molecular dynamics simulations at relative wall distance γ = 1.3. The nanobubble radius is initially 5 nm.
Fluids 08 00154 g003
Figure 4. Atomic position snapshots of the collapse dynamics of a single nanobubble near the rigid boundary Aluminum (Al) using molecular dynamics simulations at relative wall distance γ = 1.8.
Fluids 08 00154 g004
Figure 5. Atomic position snapshots of the collapse dynamics of a single nanobubble near the rigid boundary Aluminum (Al) using molecular dynamics simulations at relative wall distance γ = 1.3.
Fluids 08 00154 g005
Figure 6. Atomic position snapshots of the collapse dynamics of a single nanobubble near the flexible boundary Polyethylene (PE) using molecular dynamics simulations at relative wall distance γ = 1.8.
Fluids 08 00154 g006
Figure 7. Atomic position snapshots of the collapse dynamics of a single nanobubble near the flexible boundary Polyethylene (PE) using molecular dynamics simulations at relative wall distance γ = 1.3.
Fluids 08 00154 g007
Figure 8. Contour of atomic velocity in -x:[ 1 ¯ 00] direction of a single nanobubble collapse process near the rigid boundary Iron (Fe) using molecular dynamics simulations at relative wall distance γ = 1.8.
Fluids 08 00154 g008
Figure 9. Contour of atomic velocity in -x:[ 1 ¯ 00] direction of a single nanobubble collapse process near the rigid boundary Iron (Fe) using molecular dynamics simulations at relative wall distance γ = 1.3.
Fluids 08 00154 g009
Figure 10. Contour of atomic velocity in -x:[ 1 ¯ 00] direction of a single nanobubble collapse near the rigid boundary Aluminum (Al) using molecular dynamics simulations at relative wall distance γ = 1.8.
Fluids 08 00154 g010
Figure 11. Contour of atomic velocity in -x:[ 1 ¯ 00] direction of a single nanobubble collapse process near the rigid boundary Aluminum (Al) using molecular dynamics simulations at relative wall distance γ = 1.3.
Fluids 08 00154 g011
Figure 12. Contour of atomic velocity in -x:[ 1 ¯ 00] direction of a single nanobubble collapse process near the flexible boundary Polyethylene (PE) using molecular dynamics simulations at relative wall distance γ = 1.8.
Fluids 08 00154 g012
Figure 13. Contour of atomic velocity in -x:[ 1 ¯ 00] direction of a single nanobubble collapse process near the flexible boundary Polyethylene (PE) using molecular dynamics simulations at relative wall distance γ = 1.3.
Fluids 08 00154 g013
Figure 14. The erosion induced by the nanobubble collapse near the rigid boundary Iron (Fe) at relative wall distances γ = 1.3 and 1.8. The parameters d and w in the images are the depth and width of the collapse induced damage, respectively.
Fluids 08 00154 g014
Figure 15. The erosion induced by the nanobubble collapse near the rigid boundary Aluminum (Al) at relative wall distances γ = 1.3 and 1.8. The parameters d and w in the images are the depth and width of the collapse induced damage, respectively.
Fluids 08 00154 g015
Figure 16. The erosion induced by the nanobubble collapse near the flexible boundary Polyethylene (PE) at relative wall distances γ = 1.3 and 1.8. The parameters d and w in the images are the depth and width of the collapse-induced damage, respectively.
Fluids 08 00154 g016
Figure 17. Summary of the nanobubble’s collapse-induced erosion on all three boundaries for relative wall distances of γ = 1.3 and 1.8.
Fluids 08 00154 g017
Table 1. Lennard-Jones potential parameters for different interactions.
Interatomic Type ε (eV) σ (Å)
Al-Al0.42.720
Fe-Fe0.412.338
Al-water0.112.53
Fe-water0.112.72
water-water0.032.725
PE-water0.013.25
Disclaimer/Publisher’s Note: The statements, opinions and data contained in all publications are solely those of the individual author(s) and contributor(s) and not of MDPI and/or the editor(s). MDPI and/or the editor(s) disclaim responsibility for any injury to people or property resulting from any ideas, methods, instructions or products referred to in the content.

