

Dynamics of a Laser-Induced Cavitation Bubble near a Cone: An Experimental and Numerical Study
1
Electrical Engineering College, Guizhou University, Guiyang 550025, China
2
College of Mechanical and Transportation Engineering, China University of Petroleum-Beijing, Beijing 102249, China
3
Beijing Key Laboratory of Process Fluid Filtration and Separation, China University of Petroleum-Beijing, Beijing 102249, China
*
Author to whom correspondence should be addressed.
Fluids 2023, 8(8), 220; https://doi.org/10.3390/fluids8080220
Submission received: 7 July 2023
/
Revised: 24 July 2023
/
Accepted: 27 July 2023
/
Published: 29 July 2023
(This article belongs to the Special Issue Numerical Modeling and Experimental Studies of Two-Phase Flows)
Abstract
:A bubble’s motion is strongly influenced by the boundaries of tip structures, which correspond to the bubble’s size. In the present study, the dynamic behaviors of a cavitation bubble near a conical tip structure are investigated experimentally and numerically. A series of experiments were carried out to analyze the bubble’s shape at different relative cone distances quantitatively. Due to the crucial influence of the phase change on the cavitation bubble’s dynamics over multiple cycles, a compressible two-phase model taking into account the phase change and heat transfer implemented in OpenFOAM was employed in this study. The simulation results regarding the bubble’s radius and shape were validated with corresponding experimental photos, and a good agreement was achieved. The bubble’s primary physical features (e.g., shock waves, liquid jets, high-pressure zones) were well reproduced, which helps us understand the underlying mechanisms. Meanwhile, the latent damage was quantified by the pressure load at the cone apex. The effects of the relative distance γ and cone angle θ on the maximum temperature, pressure peaks, and bubble position are discussed and summarized. The results show that the pressure peaks during the bubble’s collapse increase with the decrease in γ. For a larger γ, the first minimum bubble radius increases while the maximum temperature decreases as θ increases; the pressure peak at the second final collapse is first less than that at the first final collapse and then much greater than that one. For a smaller γ, the pressure peaks at different θ values do not vary very much.
1. Introduction
Cavitation, the process of a tiny bubble’s formation, growth, and implosive transient collapse, is a critical physics problem that has drawn considerable attention since it is at the heart of many applications in industry, fluid machinery, biomass treatment, and other fields [1,2,3,4,5]. The transient energy released during the collapse of a cavitation bubble can induce potential damage to nearby surfaces [3,6]. Thus, studies of the cavitation collapsing process are beneficial for the further protection of structural surfaces from cavitating damage or a reduction in damage. Moreover, the presence of a structural surface changes the symmetry of the pressure field around the cavitation bubble, resulting in an unequal interface acceleration and thus inducing a high-speed microjet. In the literature, cavitation bubbles near different structures (e.g., a rigid flat surface [7,8], a rigid curved surface [9], a free surface [10], an ice surface [11], and an elastic surface [12]) have been intensively investigated, and many prominent features of cavitation bubbles have been revealed. However, these structures’ surfaces are not smooth enough, and many tips are exposed after the cavitation damage appears. In addition, artificially designed functional boundaries with grooves and tips are employed for the optimization or the extension of a fluid’s engineering applications [13]. The structural boundaries of the tip correspond to the bubble’s size with a strong influence on the bubble’s dynamics. In the present paper, the boundary of a fluid’s tip is considered to be cone-shaped. Thus, the bubble’s dynamic behaviors near a cone are investigated in depth experimentally and numerically.
Experiments of cavitation bubbles near boundaries of various shapes have been executed extensively to study their relevant dynamics [14,15,16,17,18]. Generally, a cavitation bubble near a planar rigid boundary forms a directed microjet flow towards the boundary, and its dynamical behaviors are closely related to the stand-off distance γ (defined as L/Rmax, where L is the distance from the bubble’s center to the rigid boundary and Rmax is the maximum bubble radius). A recent study by Saini et al. [19] has revealed that the dynamics of a bubble in contact with a rigid wall hinge on the effective contact angle in the instant before its collapse. They found that when the contact angle is less than 90°, the conventional jet directed towards the wall can be observed, whereas if the contact angle is greater than 90°, an annular re-entrant jet parallel to the boundary occurs. Simultaneously, some research has been conducted to investigate bubble dynamic behaviors near non-flat rigid boundaries. Tomita et al. [9] investigated bubbles near a variety of curvatures of a solid wall and found that the velocity of the jet and the duration of the flow were closely related to the deviation of the curvature. Moreover, the jet velocity increased as the shape of the wall changed from concave to convex. Požar et al. [20] studied the interaction between a nanosecond laser-induced cavitation bubble near a concave surface and observed that the concave wall could refocus the shock wave and then induce secondary cavitation. Ebrahim et al. [21] reported the dynamical features of the cavitation bubble near a rigid cylindrical rod and found that a mushroom-shaped bubble could be generated at a smaller relative distance, which may cause a lower jet impact load.
Moreover, Brujan et al. [22] investigated a bubble near a corner (two perpendicular walls) and showed that the jet angle was proportional to the ratio of the distance from the walls to the bubble. Furthermore, Tagawa and Peters [23] studied the dynamics of a bubble near a corner with different angles. They obtained the analytical solution for the jet direction by using the method of images. Li et al. [24] found that the jet deviated from the horizontal direction within a much shorter range when a bubble near two connected walls with an obtuse angle. Zhang et al. [25] investigated the dynamics of a bubble near a triangular prism array and observed that the bubble’s behaviors were strongly influenced by the relative positions of the bubble and the prisms, bubble size, and the distance from the bubble to the array.
On the other hand, numerical simulations are a well-known way to investigate bubble dynamics [26,27,28,29,30,31]. Based on the potential flow theory and boundary integral method (BIM), Wang et al. [32] simulated a bubble at a corner and found that the bubble migrated away from the near wall and the corner during its expansion and moved back toward them during its collapse. Moreover, a high-pressure region was formed during the late stages of its collapse. Trummler et al. [33] numerically studied the collapse of a bubble above rigid, notched walls and showed that the surface crevices had a significant influence on the collapse dynamics, jet formation, and wave dynamics. Shervani-Tabar and Rouhollahi [34] numerically investigated the effect of rigid concave walls on the motion of a bubble and found that the velocity of the liquid jet tends to increase with decreasing concavity. In addition, Li et al. [35] conducted numerical research on the collapsing behavior of a bubble near a solid conical wall and revealed the effect of the conical angles on the bubble’s shape, collapse time, and liquid jet. They found that the collapse time increased as the cone angle increased.
In the above-mentioned literature, although the dynamic behaviors of a single cavitation bubble near various non-flat rigid boundaries (e.g., a corner, curved surface, cylindrical rod, crevice, and triangular prism array) are investigated experimentally, studies of a bubble near a tip (e.g., cone) are reported less often. Moreover, Li et al. [35] investigated a bubble near a cone through a numerical simulation, but they only showed the dynamics of the cavitation bubble in the first cycle due to a limitation of the model. The relevant parameters during the bubble’s evolution (e.g., bubble position and shape, the temperature within the bubble, and the pressure load) have not yet been fully revealed. Thus, a profound analysis and investigation are imperative to reveal the underlying physical mechanisms.
In this study, experiments of a single laser-generated cavitation bubble near a cone are conducted and corresponding numerical simulations are performed. A pressure-based compressible model taking into account the mass and heat transfer developed in OpenFOAM is adopted in the current simulation. The numerical model has been validated in our previous works and employed for the simulation of a bubble near a solid wall [8,36]. The main aim of the current study is to examine the dynamics of the cavitation bubble in the nearby cone, which may be frequently encountered during the operation of hydraulic machinery. The following is a brief summary of the present paper. Section 2 describes the experimental methodology. In Section 3, a description of the governing flow equations and details about the numerical implementation are presented. The results from experiments and simulations under two different γ are shown in Section 4. Furthermore, the effects of γ and θ on the pressure load are further revealed in Section 5. Finally, the main conclusions are presented in Section 6.
2. Experimental Setup
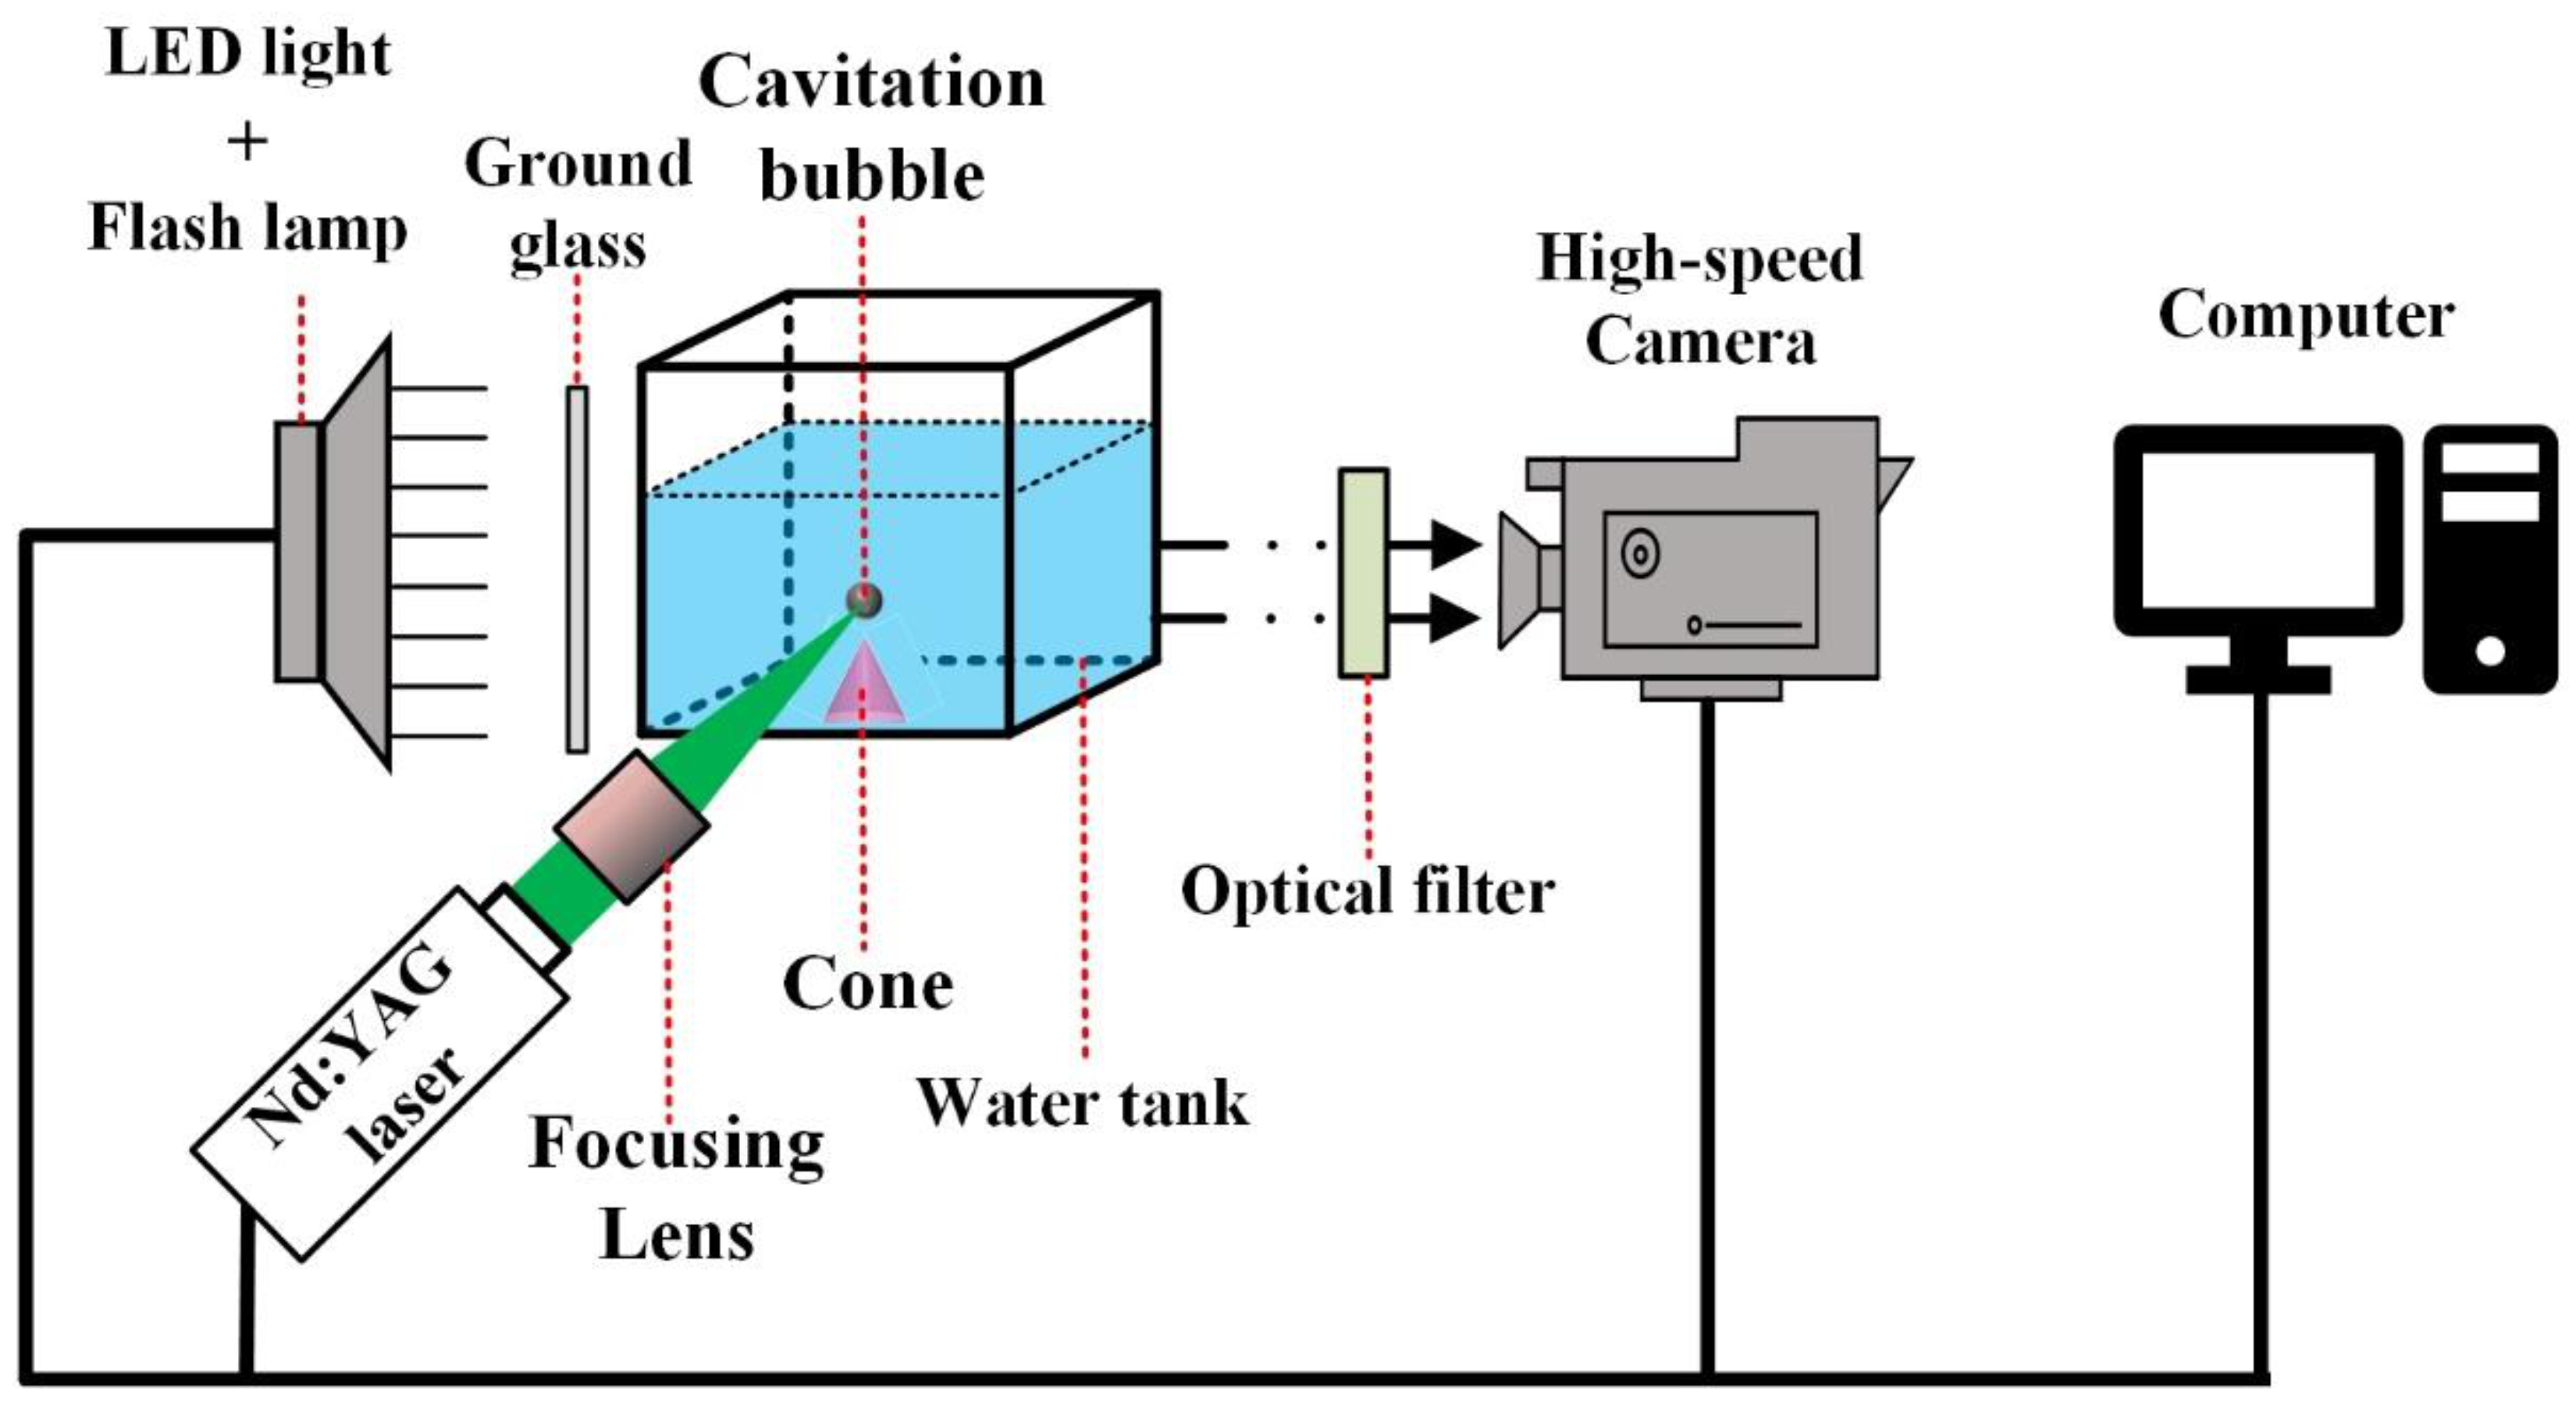
In this study, a series of experiments were carried out to investigate the dynamical behaviors of a cavitation bubble near a cone. A schematic description of the experimental setup for the investigation of the interactions between the laser-generated cavitation bubble and the cone is shown in Figure 1. In the present experimental system, the laser beam was generated by a pulsed Nd:YAG laser generator (Penny-100-SH) with a laser wavelength of 532 nm and pulse duration of 5.4 ns. The laser beam (laser energy: 10 mJ, the outlet bean diameter: 3 mm) was focused using the LMH-10X-532 focusing lens (focal length: 15 mm) inside a transparent water tank (size: 100 × 100 × 100 mm3) filled with distilled water to induce a single cavitation bubble. The distance from the bubble to the water tank wall was far greater than the maximum radius of the cavitation bubble (about 1 mm in this paper). Thus, the effect of the tank wall on the bubble dynamics could be safely ignored. An LED light was employed for all lighting. The complete process of the interaction between the cavitation bubble and the cone was recorded by a high-speed camera (Phantom v1212) with a sampling rate of 100,000 frames/s, which is fast enough to show the primary characteristics [13]. The resolution of the recorded photos was 256 × 256 pixels, and the experimental data were processed in batches by MATLAB 2019b software.
3. Numerical Method
3.1. Governing Equations
A compressible two-phase flow model with consideration of heat and mass transfer is adopted for the present simulation, and a brief description of the compressible model is presented in the following.
A set of governing flow equations describing the dynamics of fluids can be solved within the entire computational domain, including the mass conservation equation, momentum conservation equation, and energy conservation equation [8], written as follows:
where , U, T, K, g, H, and I are the total pressure, velocity, temperature, kinetic energy, gravity acceleration, height, and unit tensor, respectively; , ρ, Cp, , and are the volume fraction, density, heat capacity, dynamic viscosity, and thermal conductivity for both water and vapor; σ is the surface tension coefficient; κ is the surface curvature; and is mass transfer source term, with representing the condensation rate of the vapor and representing the vaporization rate of water.
In addition, is obtained by solving the phase change model. The Schnerr–Sauer phase change model considering the energy conservation equation [37] is employed and defined as follows:
where pv(T) is the saturation vapor pressure; Rb, , n(2.1 × 10¹¹/m3), and (2 × 10⁻⁶ m) are the radius, volume fraction, number, and diameter of cavitation nucleation site, respectively.
Furthermore, is solved by the volume of fluid (VOF) method widely used to capture the gas–liquid interface [38,39,40]. In the VOF method, the following transport equation, derived from the mass conservation equation for the water phase, is solved by the multidimensional universal limiter with the explicit solution solver [41,42].
where is the relative velocity [38], and the third term on the left side is an artificial compression term [43].
Finally, the above set of governing equations is closed by adding the equations of state (EOS) and the corresponding compressibility () for the vapor and water. The EOS and compressibility for vapor are expressed as follows:
where Rv is the gas constant.
Accordingly, the EOS and compressibility for water [44] are defined as follows:
where pc is the pressure constant with pc = 1944.61 MPa; Tc is the temperature constant with Tc = 3867 K; and Kc is liquid constant with Kc = 472.27 J/(kg·K).
3.2. Numerical Setup
Several essential parameters in the present study are shown in Figure 2. Here, R is the radius of the cavitation bubble. L is the distance from the bubble center to the cone apex. h is the height of the cone and r is the radius of the conical bottom. θ is the cone angle. Furthermore, a brass cone (density: 8500 kg/m3) with h = 14 mm and r = 7 mm (θ ≈ 53°) was used in the present experiment. To facilitate research, the relevant parameters are defined as follows:
where Rmax is the maximum bubble radius.
As shown in Figure 3a, an axisymmetric computational wedge domain of 50 mm × 60 mm is constructed to simulate the axisymmetric flow field problem, which is greater than 50 times the maximum bubble radius. The 5° wedge-shaped zone is adopted to save calculation time and achieve a reasonable computational cost. The structured mesh is implemented by ICEM CFD (ANSYS) with local refinement, as shown in Figure 3b. To guarantee consistent simulation results, a mesh sensitivity study was performed in our previous work [8]. Furthermore, a full mesh with 945,903 elements (the mesh size within the initial bubble is 3.3 μm) is subsequently applied in the current simulations. The no-slip boundary condition is employed for the right side and the bottom of the calculation zone. Because it is a stationary cone, the boundary condition for the cone is also set to be no-slip. In addition, the total pressure boundary condition is used for the top side of the region. The PIMPLE algorithm is applied to a couple of pressure and velocity. The first-order implicit Euler and the second-order Gaussian TVD schemes are employed to perform the time and spatial discretization, respectively. More detailed information for the numerical implementation (such as convergence criterion, Courant number, and time step selection) can be seen in our previous works [8,36]. Table 1 shows the values of physical properties used in this paper.
4. Experimental and Computational Results
4.1. Bubble Dynamics of Multiple Collapses with γ = 1.3
The bubble dynamics of multiple collapses near a cone with γ = 1.3 are investigated in our experiment and simulation. The distance between the bubble center and the cone apex L is 1.3 mm in the experiment. The maximum experimental radius Rmax,exp is 0.99 mm (γ = L/Rmax,exp = 1.3). For the numerical simulation, the initial parameters inside the bubble, i.e., the radius, pressure, and temperature, are set to be 40 MPa, 0.092 mm, and 593.15 K, respectively. For better comparison, the bubble radius (R) and physical time (t) are normalized by using the reference radius and time, i.e., R* = R/Rmax and t* = t/tosc, where tosc is the oscillation time from the initial moment to the first minimum radius.
Figure 4 presents the quantitative comparison of the bubble radius between the measured experimental data (black dot) and the simulation results (solid red line). As shown, the simulation results are in accordance with the measured data, including the first, second, and even third cycles. Meanwhile, the comparison of the bubble multi-period shape evolution is shown in Figure 5. Expressly, (a1)~(a14) denotes the experimental phenomenon, and (b1)~(b14) are the numerical prediction results. During the first bubble cycle ((al)~(a6)), the cone apex has little influence on the bubble dynamics since the distance from the cone apex to the bubble center is larger than the maximum bubble radius. Furthermore, the bubble also does not touch the cone apex during the second and third collapse, as shown in frames (a7)~(a14). Such a phenomenon is entirely different from the case of the single bubble near the solid wall with γ = 1.3 [7], in which the bubble is in contact with the wall during the second collapse.
In Figure 6, the pressure and velocity fields are shown for some typical moments to discuss the bubble dynamic behavior in detail. During the collapse, a locally high-pressure zone appears around the bubble, as shown in Figure 6a. Because the cone obstructs the flow, the pressure at the upper part of the bubble is slightly greater than that at the lower part of the bubble, resulting in a faster collapse of the upper surface of the bubble. Figure 6b shows that the liquid jet, driven by high pressure, enters the bubble from the upper surface. When the jet penetrates the bottom of the bubble, a strong impact such as the water hammer is formed, and a shock wave is emitted and propagated outwards. At the initial stage of the bubble re-expansion, a noticeable protrusion is generated on the lower part of the bubble due to the effect of the liquid micro-jet, as seen in Figure 6c. The protrusion continues to move towards the tip of the cone and impact it while the bubble further rebounds, as shown in Figure 6d. Figure 6e shows that the re-expansion bubble breaks into two parts of different volumes due to the velocity difference, in which the smaller one is close to the cone. Figure 6f,g show that the larger rebound bubble still collapses, while the smaller one eventually dissolves in the liquid. Finally, the remaining bubble collapses to its minimum radius (Figure 6h) and rebounds again (Figure 6i).
Figure 7 shows the time histories of the numerical results for the bubble radius, bubble centroid position, maximum temperature inside the bubble, and pressure at the apex of the cone. As seen, the maximum values of the temperature within the bubble and pressure at the apex of the cone always coincide with that for which the minimum volume is attained. More details on the source of the pressure peaks can be found in our previous work [8]. The sharp change in the bubble’s centroid position occurs at the bubble’s collapse stages.
4.2. Bubble Dynamics of Multiple Collapses with γ = 0.4
When γ is reduced to 0.4, the bubble dynamics and their intensities are more influenced by the conical structure. Figure 8 shows a comparison of the bubble shape frame by frame between the numerical predictions and the experimental phenomena. As observed in the experiment (frame (a1)), the bubble is initialized closer to the apex of the cone. Thus, the upper part of the cone is gradually swallowed by the expanding bubble (see frames (a2)~(a4)). Due to the substantial restriction of the cone, the bubble interface becomes unstable and relatively rough during the rebound stage (see frames a7~a11). Eventually, the bubble almost disappears into the liquid, as seen in frames (a13)~(a14). Overall, the numerical predictions are in good agreement with the observed experimental results.
The pressure (left half) and velocity (right half) fields during the bubble collapse and rebound stages are presented in Figure 9. During the first collapse, high pressure is locally formed above the bubble, and the downward liquid jet is driven into the bubble, as shown in Figure 9a. In Figure 9b, the bubble shrinks to its minimum volume, and the high pressure is generated near the cone apex due to the liquid jet continuing to impact the cone. During its rebound, the flow along the conical wall is formed due to the cone apex redirecting the liquid jet, causing the expanding bubble along the conical wall, as shown in Figure 9c. Figure 9d shows the maximum rebound bubble; the bubble bottom is in direct contact with the conical wall. In addition, the internal pressure is lower than that outside the bubble. Thus, the rebound bubble collapses again. Figure 9e shows a high-pressure zone occurring above the bubble, which is similar to the first collapse (see Figure 9a). Figure 9f shows the bubble contracts to the minimum size again.
Figure 10 shows the shock wave distributions expressed with a density gradient using the numerical Schlieren results [45]. (a) It presents the incident shock wave and (b) indicates the shock wave of the first bubble collapse and (c) the second bubble collapse. The outward propagation of shock waves will promote the generation of low-pressure regions, leading to abrupt changes in the liquid density [46]. As a result, some disturbances could be seen in the experiments [47,48]. If the pressure value is lower than the vapor saturation pressure value, a secondary cavitation disturbance appears [49].
Figure 11 shows the time histories of the bubble radius, bubble centroid position, maximum temperature, and pressure load at the apex of the cone with γ = 0.4. As shown, the maximum temperature and pressure are obtained when the bubble first shrinks to the minimum volume. Significantly, the maximum pressure peak at the cone apex reaches 20.3 MPa, which is much greater than that shown in Figure 7. This is because the maximum pressure peak for γ = 1.3 mainly comes from the first collapse shock wave, while that for γ = 0.4 is attributed to the superposition of the collapse shock wave and the liquid jet.
5. Further Discussions
5.1. The Effect of the Distance from the Bubble to the Cone Apex
As discussed above, the distance from the bubble to the cone, i.e., γ, strongly affects the bubble dynamics. Thus, to further investigate and analyze the tendencies of bubble dynamics, more numerical simulation cases with different γ values were carried out. Figure 12a shows the evolution of the bubble center position over time under different γ values. The red dotted line indicates the position of the cone apex. As seen, the dramatic change in the bubble center position always occurs in the final collapse stages, including the first and second collapses. When γ > 0.8, the position of the bubble in the first and second collapses is higher than that of the cone apex, meaning a water layer still exists between the bubble and the cone apex (see Figure 5(a6,a12)) and prevents the liquid micro-jet from directly impacting the cone. When 0.5 ≤ γ ≤ 0.8, it can be seen that the bubble center is above the cone apex in the first collapse but below the cone apex in the second collapse, indicating that the water layer gradually disappears during the second collapse and the bubble is in direct contact with the surface of the cone. When 0 < γ < 0.5, the bubble is very close to or even lower than the apex of the cone (see Figure 8(a6,a13)).
In addition, the evolution of the impact pressure on the cone apex over time under various γ values is shown in Figure 12b. As seen, the maximum pressure is achieved in the final stages of the bubble’s collapse. Furthermore, the bubble’s second collapse occurs earlier as γ decreases. In particular, the pressure peaks from the final collapse phase can be divided into three stages. In stage Ⅰ (γ > 0.8), the bubble remains away from the cone during its collapse, having a weak impact on the liquid jet. Thus, the pressure peaks mainly come from the collapse shock waves, as shown in Figure 13c,f, and their values are almost constant as γ decreases. Moreover, the pressure peak of the first bubble collapse is slightly larger than that of the second collapse. In stage Ⅱ (0.5 ≤ γ ≤ 0.8), the pressure peaks are larger than those in stage Ⅰ due to the small distance between the bubble and cone (see Figure 13b,c), and their values increase as γ decreases. Remarkably, the bubble puts pressure on the cone during its second collapse, as shown in Figure 13e, causing a violent impact. It can be seen that the pressure peak generated by the second collapse is comparable to that from the first. In stage Ⅲ (0 < γ < 0.5), the bubble clings to the cone apex during the first collapse, as shown in Figure 13a, leading to a more severe impact. Therefore, the pressure peak is much greater than those in stages Ⅰ and Ⅱ, and its value sharply increases with the decrease in γ. Furthermore, the pressure peak of the second bubble collapse cannot be ignored (see Figure 13d) and significantly different from the bubble’s behavior near the solid wall (for which no apparent rebound phenomenon is observed with a range of 0 < γ < 0.5 [8]).
5.2. The Effect of the Cone Angles (θ)
Figure 14 shows the schematic diagram of different θ values, which all have the same height (i.e., h = 14 mm). As shown in Figure 12b, the pressure peak is closely related to γ. In this section, a larger γ (γ = 1.3), indicating that the initial bubble stays away from the cone, is chosen to investigate the bubble dynamic features under different θ values. The influence of θ on the bubble center position is shown in Figure 15. Here, θ = 180° indicates the cone is a solid plane. As shown in the figure, the bubble gradually approaches the cone apex with the increase in θ, implying the effect of the cone is strengthened by the degree. To be specific, the bubble is still moving away from the cone in the first collapse but quickly approaches or even clings to the cone in the second collapse.
The pressure peaks on the cone apex from the first and second collapses under different θ values are shown in Figure 16. The pressure peak of the second bubble collapse (magenta dots) increases rapidly as θ increases, while the pressure peak from the first (olive green triangles) increases slowly. Particularly, when θ < 90°, the pressure peak of the second bubble collapse is slightly smaller than that of the first. Only a small part of the initial energy goes into the second collapse phase. Thus, the intensity of the shock wave generated by the second collapse is much smaller than that of the first collapse (see Figure 17a,c), causing a weak impact on the conical surface. When θ ≥ 90°, the bubble is close to or even attaches to the surface of the cone in the second collapse, resulting in a stronger impact on the cone due to the superposition of the liquid microjet and the collapse shock wave as shown in Figure 17b,d.
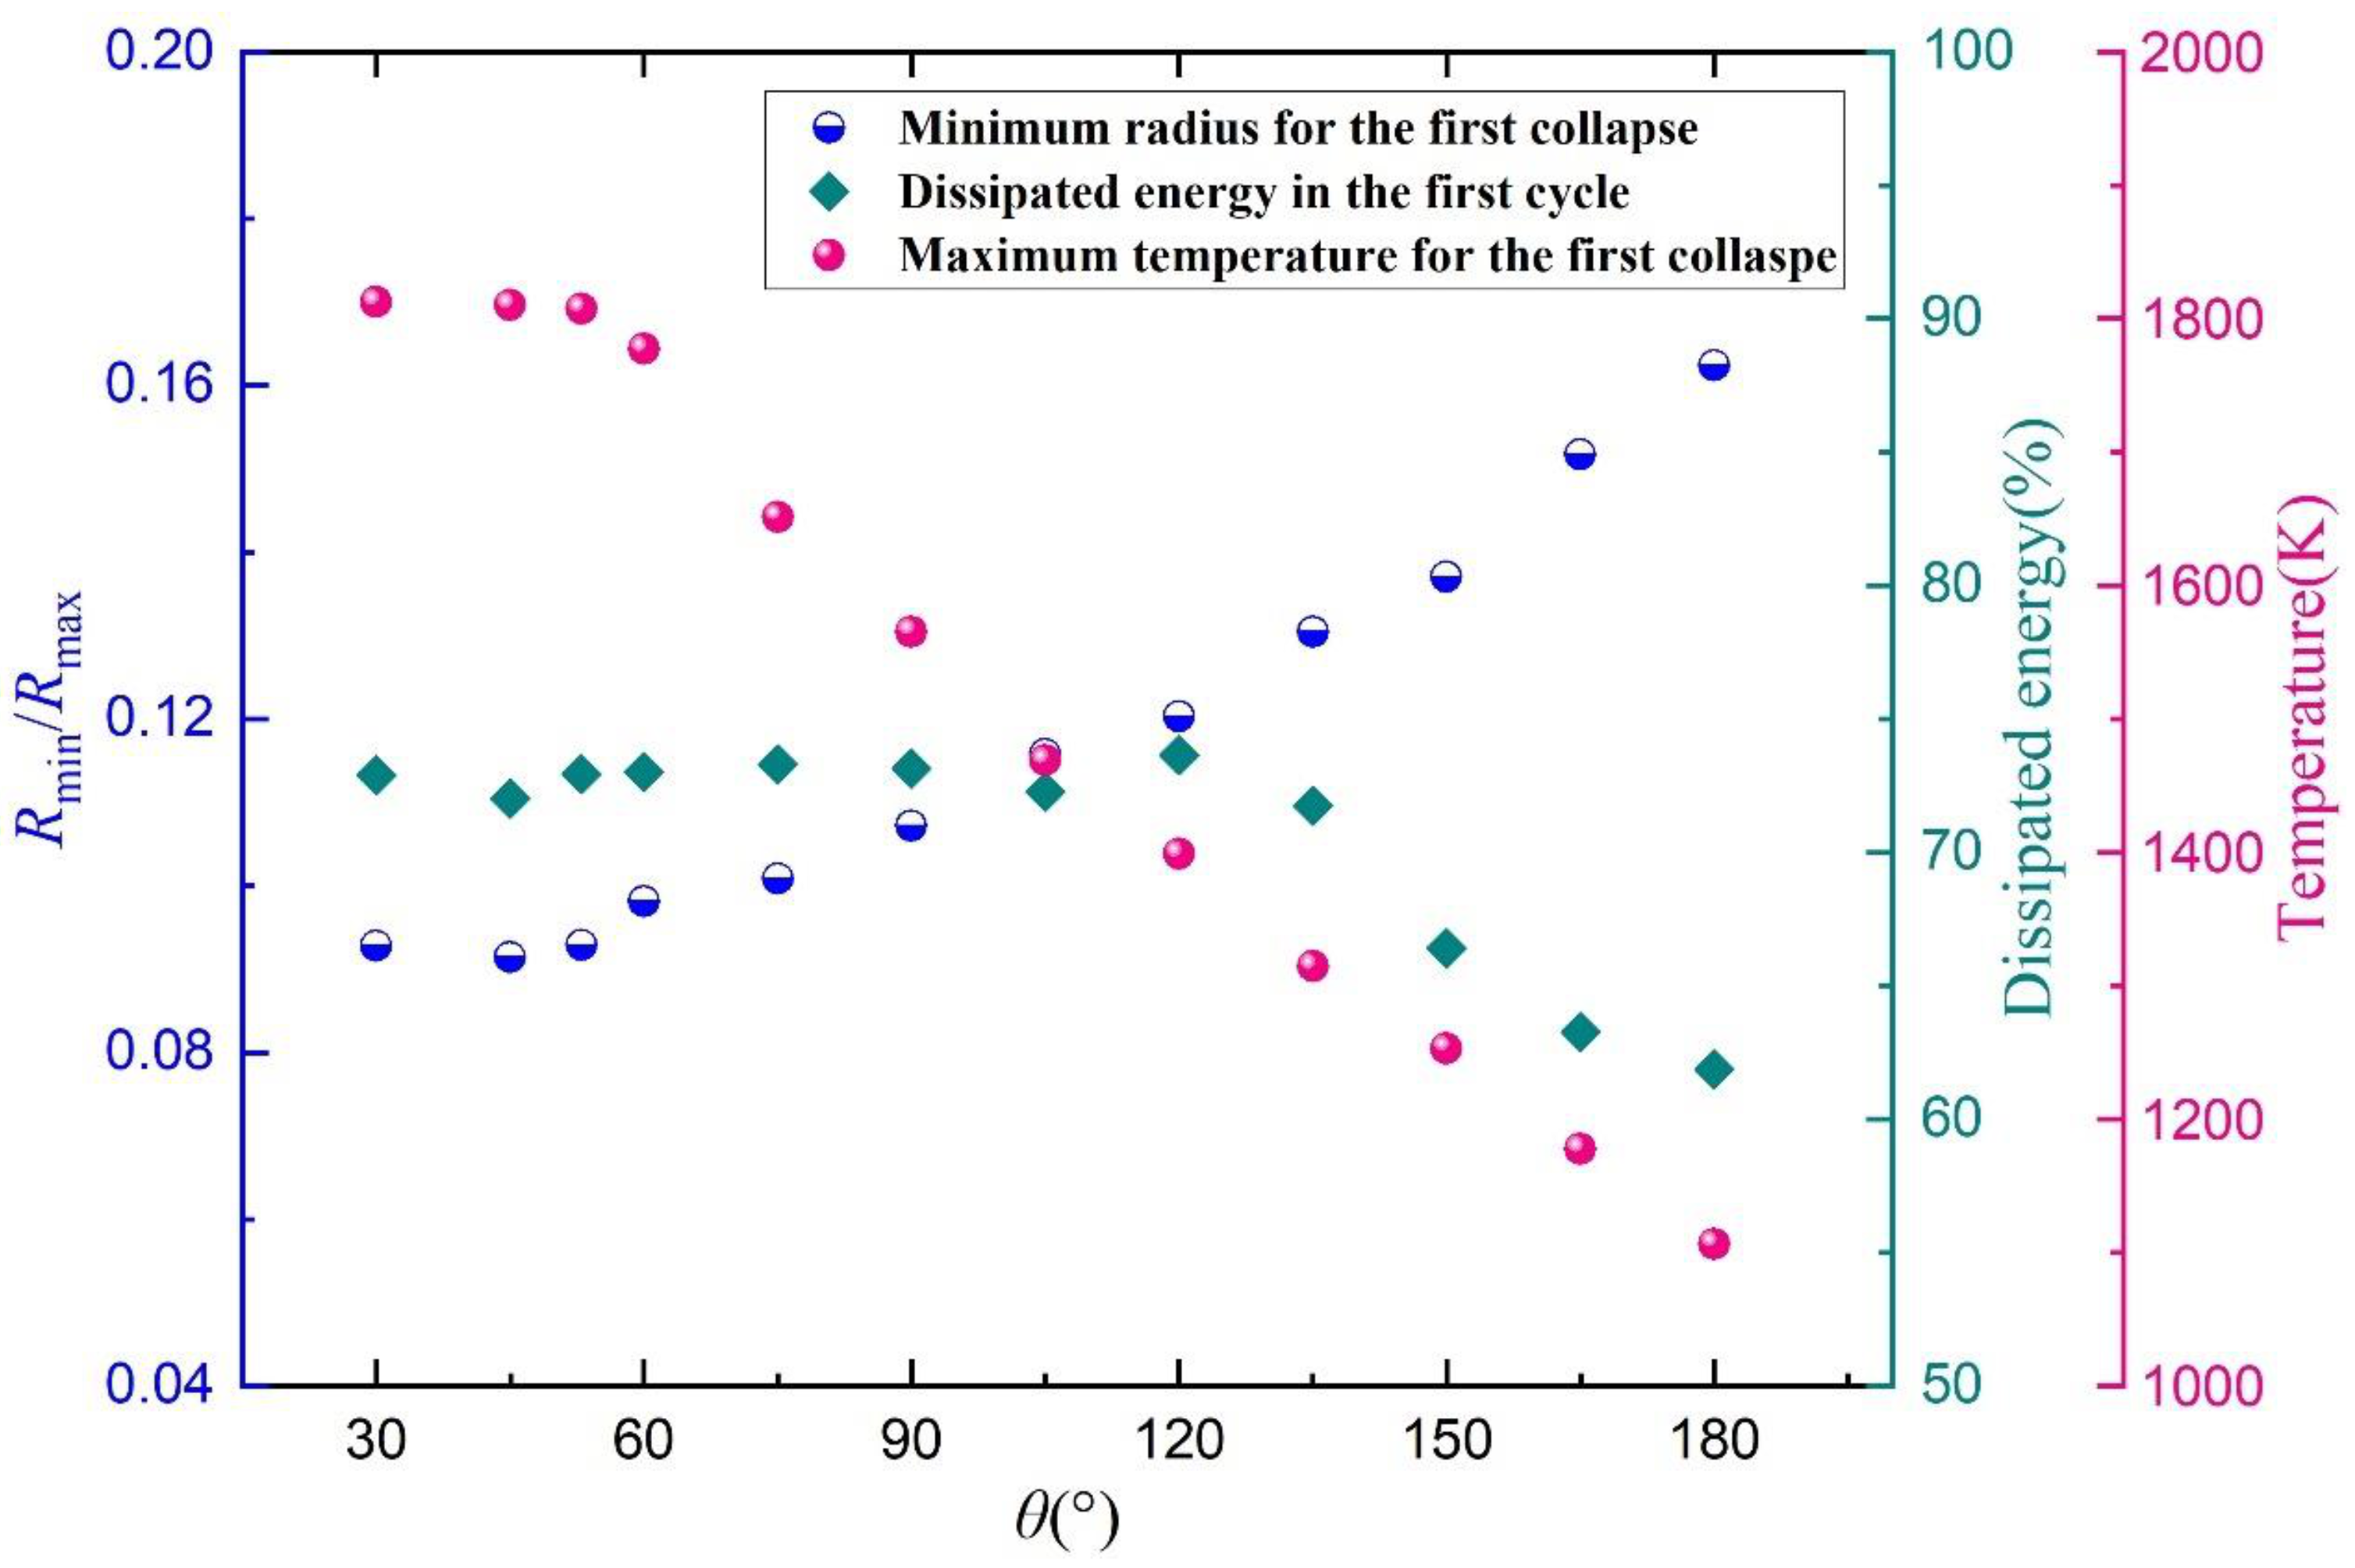
In addition, the effects of θ on the maximum temperature inside the bubble, the first minimum radius, and the dissipated energy during the first bubble collapse are shown in Figure 18. The dissipated energy in the bubble’s first cycle decreases with the increase in θ, indicating the retardation effect of the conical surface is strengthened. Thus, a larger minimum radius at the first collapse can be expected, as shown by the blue/white dots in Figure 18. In general, the temperature peak value within the bubble is approximately proportional to the minimum collapse radius. For a single bubble collapsing in a free field, the temperature can reach an extremely high value (about 22,000 K) since it can collapse to a much smaller radius (Rmin/Rmax ≈ 0.004) [36]. In this paper, the maximum temperature decreases as θ increases due to a larger minimum radius.
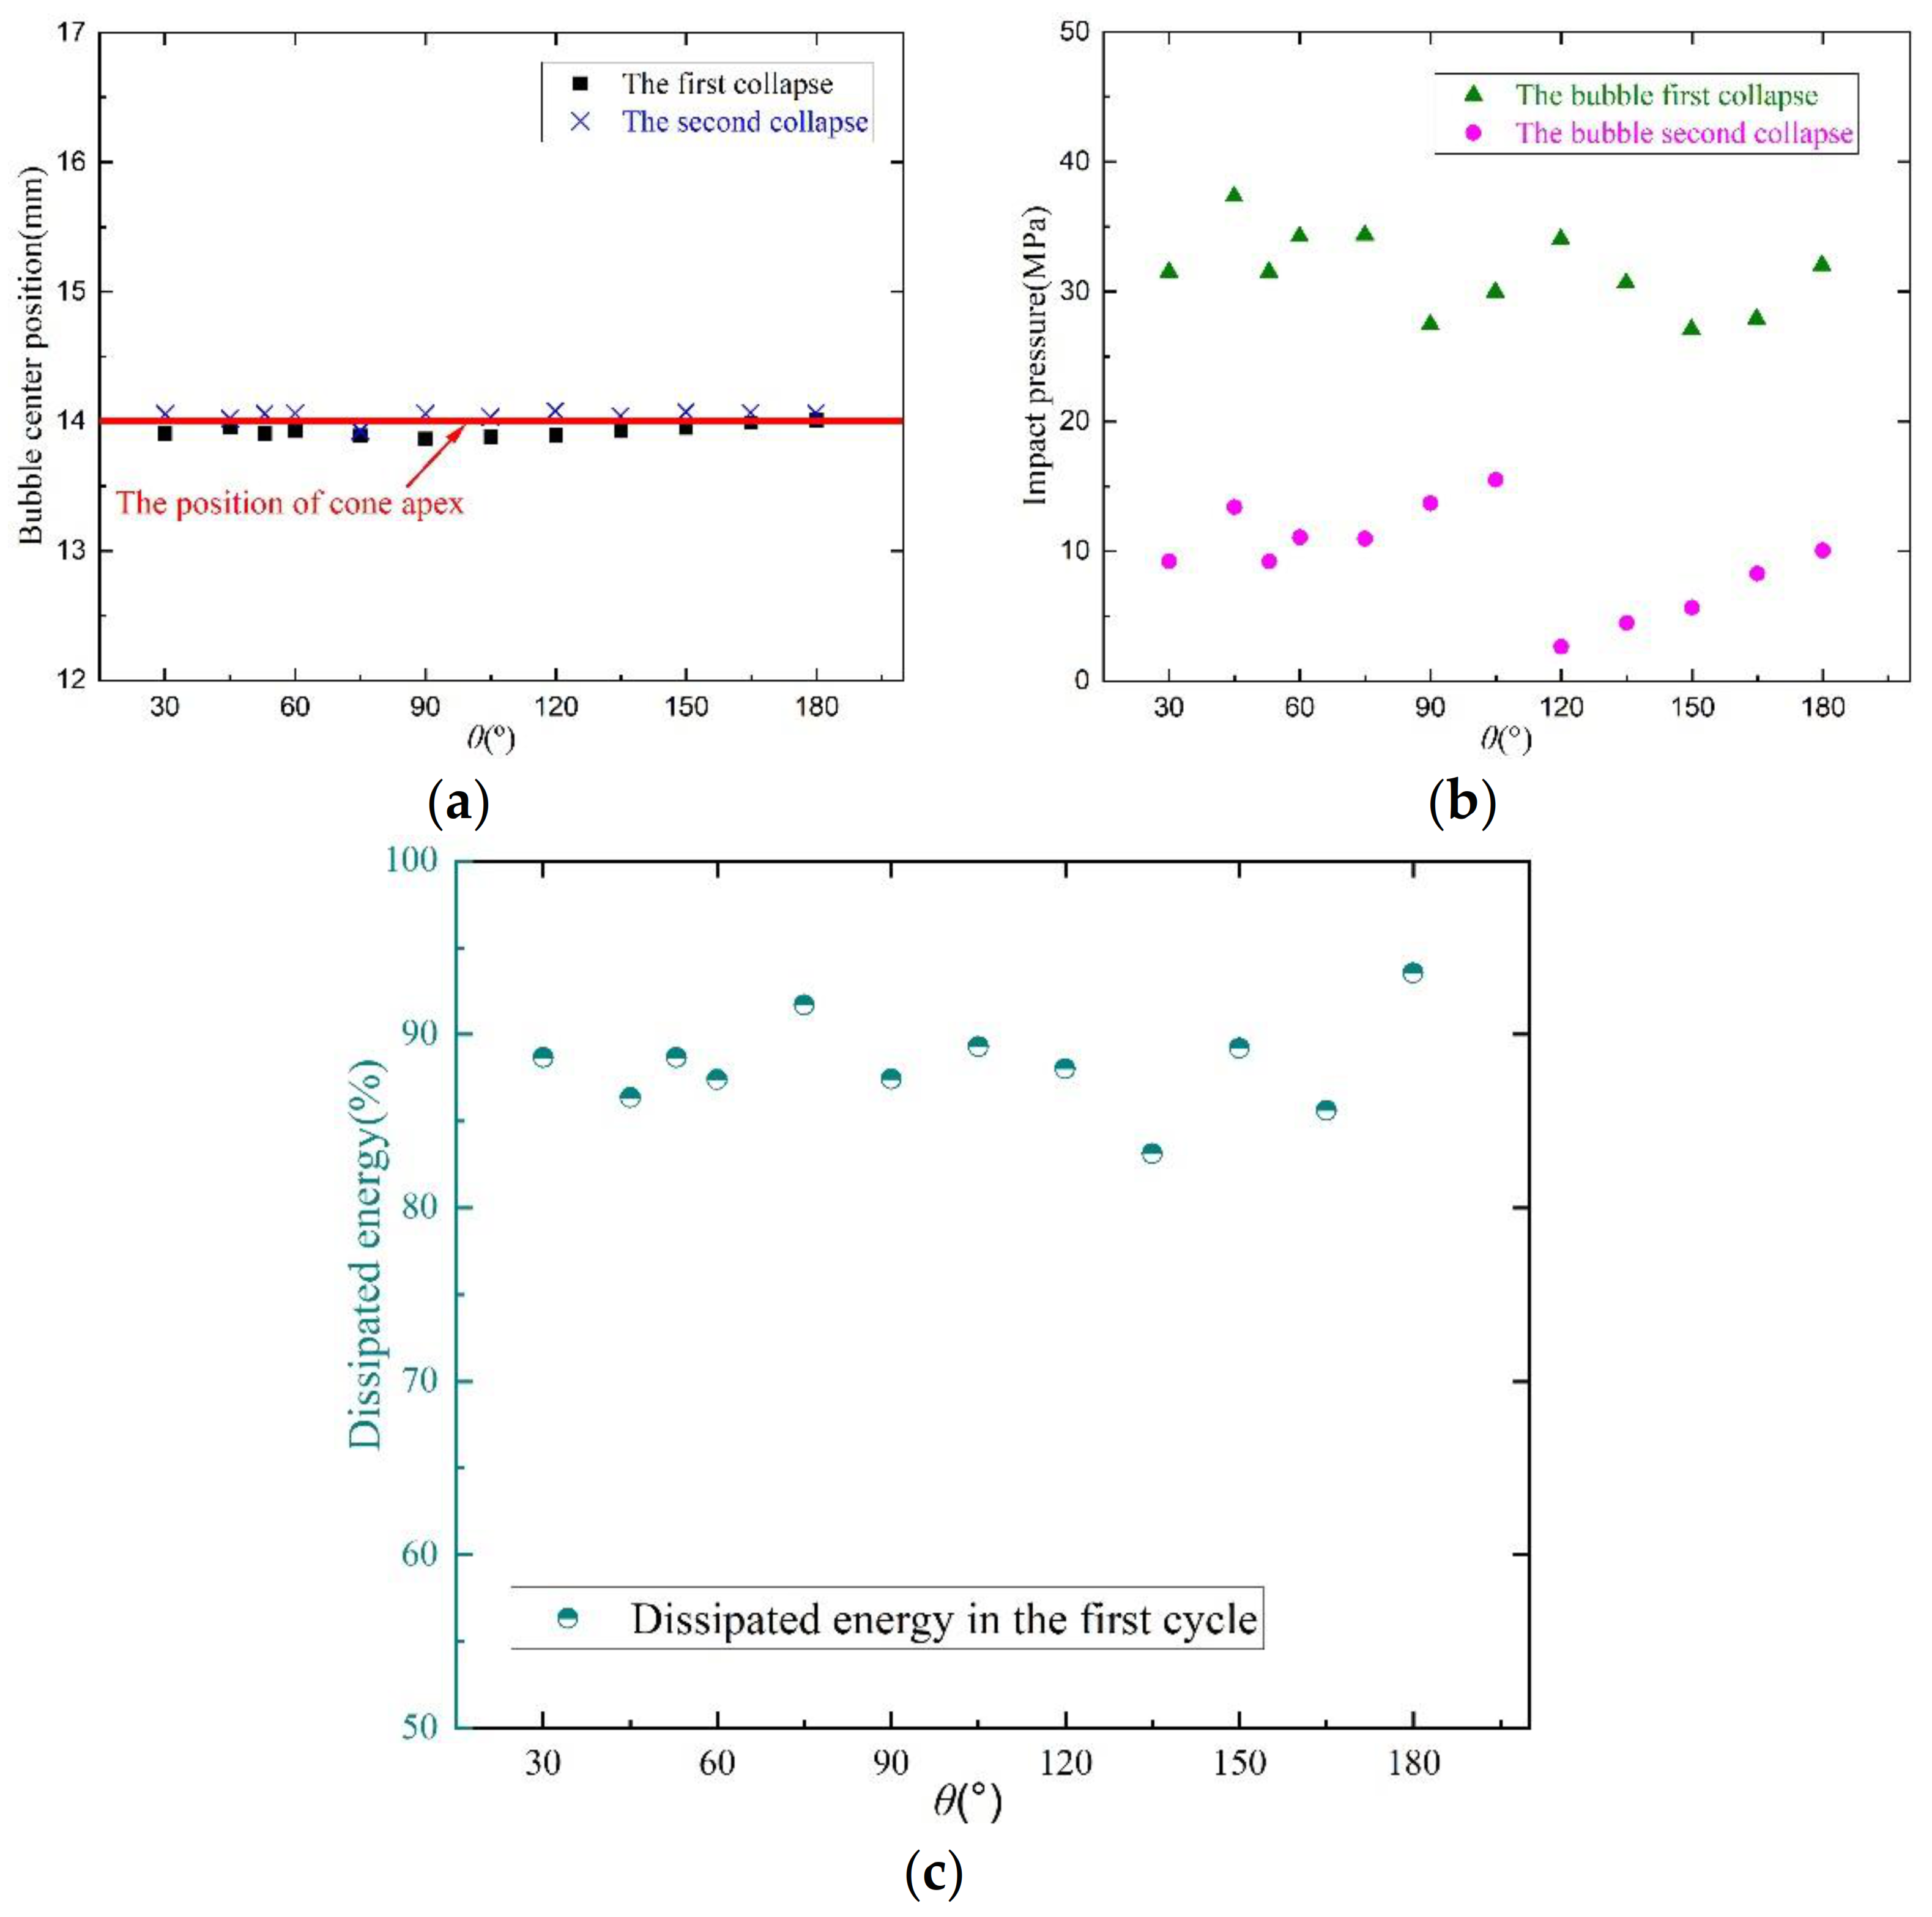
For a smaller γ (γ = 0.1), Figure 19 illustrates the variation in essential parameters (the bubble center position, pressure peaks, and dissipated energy) under various θ values. As shown in Figure 19a, the bubble center position in the first two final collapse stages touches the cone apex due to the smaller distance between the bubble and the cone. In addition, more than 80% of the initial bubble energy is lost in the first cycle, as shown in Figure 19c. In other words, only a tiny portion of the bubble energy enters into the rebound. Thus, a larger pressure peak for the first collapse can be seen, as shown in Figure 19b. Simultaneously, the pressure peaks at different θ values do not vary very much, implying that the influence of θ is not significant for a smaller γ.
6. Conclusions
The dynamics of a cavitation bubble near a rigid conical boundary are studied through a numerical simulation and experiments. A pulsed laser generator is used to generate a single cavitation bubble, and a high-speed camera with a sampling rate of 100,000 frames/s is employed to capture the motion behavior of the bubble. In addition, a compressible flow solver, with consideration of the phase change and thermodynamic effect, is adopted to perform the corresponding numerical simulations. The numerical results for the bubble radius and bubble shape are in good agreement with the related experimental data. The bubble’s primary physical features during the first two cycles are reproduced well based on our numerical model. Moreover, the physical implications in terms of the bubble shape, bubble radius, shock wave, pressure load, internal temperature, and dissipated energy during collapse are analyzed in detail to support the observed experimental phenomena. Generally, the peak values of the pressure and temperature occur almost at the moment of collapse once the bubble reaches its minimum volume. Finally, the effects of the relative distance γ and cone angle θ on the maximum temperature, bubble position, and pressure peaks are discussed. The main conclusions can be drawn as follows:
- The pressure peaks from the first and second collapse increase with the decrease in γ. Moreover, the rate of increase of the pressure peak from the first collapse is much greater than that from the second.
- For a larger γ, as θ increases, the first minimum bubble radius increases while the maximum temperature decreases. Additionally, the pressure peak of the second collapse is slightly smaller than that of the first one due to most of the bubble’s energy being lost in the first cycle when θ < 90°. The pressure peak at the second final collapse is much larger than that at the first because the bubble clings to the cone tip during the bubble’s second collapse when θ ≥ 90°.
- For a smaller γ, more energy is lost at the first collapse and the bubble always clings to the conical surface during the collapse. As a result, the pressure peak in the first final collapse is much greater than that in the second. The pressure peaks at different θ do not vary very much, and the influence of θ on the bubble’s behavior is negligible.
Author Contributions
Conceptualization, J.Y. and Y.Z.; methodology, J.Y.; software, D.G.; validation, J.Y., L.T. and X.D.; formal analysis, J.Y.; investigation, J.Y.; resources, Y.Z.; data curation, X.D.; writing—original draft preparation, J.Y.; writing—review and editing, Y.Z.; visualization, D.G.; supervision, L.T.; project administration, J.Y. and Y.Z.; funding acquisition, J.Y. and Y.Z. All authors have read and agreed to the published version of the manuscript.
Funding
The work was supported by the National Natural Science Foundation of China (Grant No. 52179094), the Guizhou Provincial Basic Research Program (Grant No. ZK [2023] General 069), the Guizhou Provincial Key Technology R&D Program (Grant No. 2022[18]), and Scientific Research Foundation for the Talent Introduction of Guizhou University (2022[14]).
Data Availability Statement
The data supporting the findings of this study are available from the author upon reasonable request.
Acknowledgments
The authors would like to acknowledge the support of the National Natural Science Foundation of China, the Guizhou Provincial Basic Research Progra, the Guizhou Provincial Key Technology R&D Program, and Scientific Research Foundation for the Talent Introduction of Guizhou University.
Conflicts of Interest
The authors declare no conflict of interest.
References
- Bhat, A.P.; Gogate, P.R. Cavitation-based pre-treatment of wastewater and waste sludge for improvement in the performance of biological processes: A review. J. Environ. Chem. Eng. 2021, 9, 104743. [Google Scholar] [CrossRef]
- Chudnovskii, V.M.; Yusupov, V.I.; Dydykin, A.V.; Nevozhai, V.I.; Kisilev, A.Y.; Zhukov, S.A.; Bagratashvili, V.N. Laser-induced boiling of biological liquids in medical technologies. Quantum Electron. 2017, 47, 361. [Google Scholar] [CrossRef]
- Brennen, C.E. Cavitation in medicine. Interface Focus 2015, 5, 20150022. [Google Scholar] [CrossRef] [PubMed] [Green Version]
- Prado, C.A.; Antunes, F.A.; Rocha, T.M.; Sánchez-Muoz, S.; Barbosa, F.G.; Terán-Hilares, R.; Cruz-Santos, M.M.; Arruda, G.L.; da Silva, S.S.; Santos, J.C. A review on recent developments in hydrodynamic cavitation and advanced oxidative processes for pretreatment of lignocellulosic materials. Bioresour. Technol. 2022, 345, 126458. [Google Scholar] [CrossRef] [PubMed]
- Wang, S.; Guo, Z.P.; Zhang, X.P.; Zhang, A.; Kang, J.W. On the mechanism of dendritic fragmentation by ultrasound induced cavitation. Ultrason. Sonochemistry 2019, 51, 160–165. [Google Scholar] [CrossRef]
- Xu, W.L.; Wang, Q.F.; Wei, W.R.; Luo, J. Effects of air bubble quantity on the reduction of cavitation erosion. Wear 2021, 482, 203937. [Google Scholar] [CrossRef]
- Philipp, A.; Lauterborn, W. Cavitation erosion by single laser-produced bubbles. J. Fluid Mech. 1998, 361, 75–116. [Google Scholar] [CrossRef]
- Yin, J.; Zhang, Y.; Zhu, J.; Lv, L.; Tian, L. An experimental and numerical study on the dynamical behaviors of the rebound cavitation bubble near the solid wall. Int. J. Heat Mass Transf. 2021, 177, 121525. [Google Scholar] [CrossRef]
- Tomita, Y.; Robinson, P.B.; Tong, R.P.; Black, J.R. Growth and collapse of cavitation bubbles near a curved rigid boundary. J. Fluid Mech. 2002, 466, 259–283. [Google Scholar] [CrossRef]
- Li, T.; Zhang, A.M.; Wang, S.P.; Liu, W.T. Bubble interactions and bursting behaviors near a free surface. Phys. Fluids 2019, 31, 042104. [Google Scholar]
- Cui, P.; Zhang, A.M.; Wang, S.P.; Khoo, B.C. Ice breaking by a collapsing bubble. J. Fluid Mech. 2018, 841, 287–309. [Google Scholar] [CrossRef]
- Brujan, E.A.; Nahen, K.; Schmidt, P.; Vogel, A. Dynamics of laser-induced cavitation bubbles near elastic boundaries: Influence of the elastic modulus. J. Fluid Mech. 2001, 433, 283–314. [Google Scholar] [CrossRef] [Green Version]
- Zhang, Y.; Qiu, X.; Zhang, X.Q.; Tang, N.N.; Zhang, Y.N. Collapsing dynamics of a laser-induced cavitation bubble near the edge of a rigid wall. Ultrason. Sonochemistry 2020, 67, 105157. [Google Scholar] [CrossRef] [PubMed]
- Chudnovskii, V.M.; Guzev, M.A.; Yusupov, V.I.; Fursenko, R.V.; Okajima, J. Study of methods for controlling direction and velocity of liquid jets formed during subcooled boiling. Int. J. Heat Mass Transf. 2021, 173, 121250. [Google Scholar] [CrossRef]
- Ren, Z.; Li, B.; Xu, P.; Wakata, Y.; Liu, J.; Sun, C.; Zuo, Z. Cavitation bubble dynamics in a funnel-shaped tube. Phys. Fluids 2022, 34, 093313. [Google Scholar] [CrossRef]
- Sun, Y.; Yao, Z.; Wen, H.; Zhong, Q.; Wang, F. Cavitation bubble collapse in a vicinity of a rigid wall with a gas entrapping hole. Phys. Fluids 2022, 34, 073314. [Google Scholar] [CrossRef]
- Wang, X.; Wu, G.; Zheng, X.; Du, X.; Zhang, Y. Theoretical investigation and experimental support for the cavitation bubble dynamics near a spherical particle based on Weiss theorem and Kelvin impulse. Ultrason. Sonochemistry 2022, 89, 106130. [Google Scholar] [CrossRef]
- Zeng, Q.; Gonzalez-Avila, S.R.; Ohl, C.-D. Splitting and jetting of cavitation bubbles in thin gaps. J. Fluid Mech. 2020, 896, A28. [Google Scholar] [CrossRef]
- Saini, M.; Tanne, E.; Arrigoni, M.; Zaleski, S.; Fuster, D. On the dynamics of a collapsing bubble in contact with a rigid wall. J. Fluid Mech. 2022, 948, A45. [Google Scholar] [CrossRef]
- Požar, T.; Agrež, V. Laser-induced cavitation bubbles and shock waves in water near a concave surface. Ultrason. Sonochemistry 2021, 73, 105456. [Google Scholar] [CrossRef]
- Kadivar, E.; Phan, T.H.; Park, W.G.; Moctar, O. Dynamics of a single cavitation bubble near a cylindrical rod. Phys. Fluids 2021, 33, 113315. [Google Scholar] [CrossRef]
- Brujan, E.A.; Noda, T.; Ishigami, A.; Ogasawara, T.; Takahira, H. Dynamics of laser-induced cavitation bubbles near two perpendicular rigid walls. J. Fluid Mech. 2018, 841, 28–49. [Google Scholar] [CrossRef]
- Tagawa, Y.; Peters, I.R. Bubble collapse and jet formation in corner geometries. Phys. Rev. Fluids 2018, 3, 081601. [Google Scholar] [CrossRef] [Green Version]
- Li, S.M.; Cui, P.; Zhang, S.; Liu, W.; Peng, Y. Experimental and numerical study on the bubble dynamics near two-connected walls with an obtuse angle. China Ocean. Eng. 2020, 34, 828–839. [Google Scholar] [CrossRef]
- Zhang, Y.; Li, S.; Zhang, Y.; Zhang, Y. Dynamics of the bubble near a triangular prism array. In Proceedings of the 10th International Symposium on Cavitation CAV, Baltimore, MA, USA, 14–16 May 2018. [Google Scholar]
- He, M.; Wang, S.P.; Ren, S.F.; Zhang, S. Numerical study of effects of stand-off distance and gravity on large scale bubbles near a breach. Appl. Ocean. Res. 2021, 117, 102946. [Google Scholar] [CrossRef]
- Morad, A.M.; Selima, E.S.; Abu-Nab, A.K. Thermophysical bubble dynamics in N-dimensional Al2O3/H2O nanofluid between two-phase turbulent flow. Case Stud. Therm. Eng. 2021, 28, 101527. [Google Scholar] [CrossRef]
- Morad, A.M.; Selima, E.S.; Abu-Nab, A.K. Bubbles interactions in fluidized granular medium for the van der Waals hydrodynamic regime. Eur. Phys. J. Plus 2021, 136, 306. [Google Scholar] [CrossRef]
- Park, S.-H.; Phan, T.-H.; Park, W.-G. Numerical investigation of laser-induced cavitation bubble dynamics near a rigid surface based on three-dimensional fully compressible model. Int. J. Heat Mass Transf. 2022, 191, 122853. [Google Scholar] [CrossRef]
- Zeng, Q.; An, H.; Ohl, C.-D. Wall shear stress from jetting cavitation bubbles: Influence of the stand-off distance and liquid viscosity. J. Fluid Mech. 2022, 932, A14. [Google Scholar] [CrossRef]
- Zhang, J. Effect of stand-off distance on “counterjet” and high impact pressure by a numerical study of laser-induced cavitation bubble near a wall. Int. J. Multiph. Flow 2021, 142, 103706. [Google Scholar] [CrossRef]
- Wang, Q.; Mahmud, M.; Cui, J.; Smith, W.R. Numerical investigation of bubble dynamics at a corner. Phys. Fluids 2020, 32, 053306. [Google Scholar]
- Trummler, T.; Bryngelson, S.H.; Schmidmayer, K.; Schmidt, S.J.; Colonious, T.; Adams, N.A. Near-surface dynamics of a gas bubble collapsing above a crevice. J. Fluid Mech. 2020, 899, A16. [Google Scholar] [CrossRef]
- Shervani-Tabar, M.; Rouhollahi, R. Numerical study on the effect of the concave rigid boundaries on the cavitation intensity. Sci. Iran. 2017, 24, 1958–1965. [Google Scholar] [CrossRef] [Green Version]
- Li, B.B.; Jia, W.; Zhang, H.C.; Lu, J. Investigation on the collapse behavior of a cavitation bubble near a conical rigid boundary. Shock. Waves 2014, 24, 317–324. [Google Scholar] [CrossRef]
- Yin, J.; Zhang, Y.; Zhu, J.; Zhang, Y.; Li, S. On the thermodynamic behaviors and interactions between bubble pairs: A numerical approach. Ultrason. Sonochemistry 2021, 70, 105297. [Google Scholar] [CrossRef] [PubMed]
- Zhu, J.; Chen, Y.; Zhao, D.; Zhang, X. Extension of the Schnerr–Sauer model for cryogenic cavitation. Eur. J. Mech.-B/Fluids 2015, 52, 1–10. [Google Scholar] [CrossRef]
- Koch, M.; Lechner, C.; Reuter, F.; Köhler, K.; Mettin, R.; Lauterborn, W. Numerical modeling of laser generated cavitation bubbles with the finite volume and volume of fluid method, using OpenFOAM. Comput. Fluids 2016, 126, 71–90. [Google Scholar] [CrossRef]
- Reese, H.; Schädel, R.; Reuter, F.; Ohl, C.D. Microscopic pumping of viscous liquids with single cavitation bubbles. J. Fluid Mech. 2022, 944, A17. [Google Scholar] [CrossRef]
- Yin, J.Y.; Zhang, Y.; Zhu, J.; Lv, L.; Li, S. Numerical investigation of the interactions between a laser-generated bubble and a particle near a solid wall. J. Hydrodyn. 2021, 33, 311–322. [Google Scholar] [CrossRef]
- Boris, J.P.; Book, D.L. Flux-corrected transport. I. SHASTA, a fluid transport algorithm that works. J. Comput. Phys. 1973, 11, 38–69. [Google Scholar] [CrossRef]
- Greenshields, C.J. OpenFOAM User Guide, Version 5.0; OpenFOAM Foundation Ltd.: London, UK, 2015; Volume 3, p. 47. [Google Scholar]
- Weller, H.G. A New Approach to VOF-Based Interface Capturing Methods for Incompressible and Compressible Flow; Report TR/HGW; OpenCFD Ltd.: Reading, UK, 2008; Volume 4, p. 35. [Google Scholar]
- Shin, B.; Iwata, Y.; Ikohagi, T. Numerical simulation of unsteady cavitating flows using a homogenous equilibrium model. Comput. Mech. 2003, 30, 388–395. [Google Scholar] [CrossRef]
- Settles, G.S. Schlieren and Shadowgraph Techniques: Visualizing Phenomena in Transparent Media; Springer Science & Business Media: Berlin/Heidelberg, Germany, 2001. [Google Scholar]
- Phan, T.-H.; Kadivar, E.; Nguyen, V.-T.; el Moctar, O.; Park, W.-G. Thermodynamic effects on single cavitation bubble dynamics under various ambient temperature conditions. Phys. Fluids 2022, 34, 023318. [Google Scholar] [CrossRef]
- Luo, J.; Xu, W.; Khoo, B.C. Stratification effect of air bubble on the shock wave from the collapse of cavitation bubble. J. Fluid Mech. 2021, 919, A16. [Google Scholar] [CrossRef]
- Supponen, O.; Obreschkow, D.; Farhat, M. Rebounds of deformed cavitation bubbles. Phys. Rev. Fluids 2018, 3, 103604. [Google Scholar] [CrossRef] [Green Version]
- Zhang, M.; Chang, Q.; Ma, X.; Wang, G.; Huang, B. Physical investigation of the counterjet dynamics during the bubble rebound. Ultrason. Sonochem. 2019, 58, 104706. [Google Scholar] [CrossRef] [PubMed]
Figure 1.
A schematic presentation of the experimental setup for the cavitation bubble–cone interactions.
Figure 1.
A schematic presentation of the experimental setup for the cavitation bubble–cone interactions.

Figure 2.
Definition of several essential parameters.

Figure 3.
(a) The axisymmetric computational domain; (b) the applied boundary conditions and mesh distribution.
Figure 3.
(a) The axisymmetric computational domain; (b) the applied boundary conditions and mesh distribution.
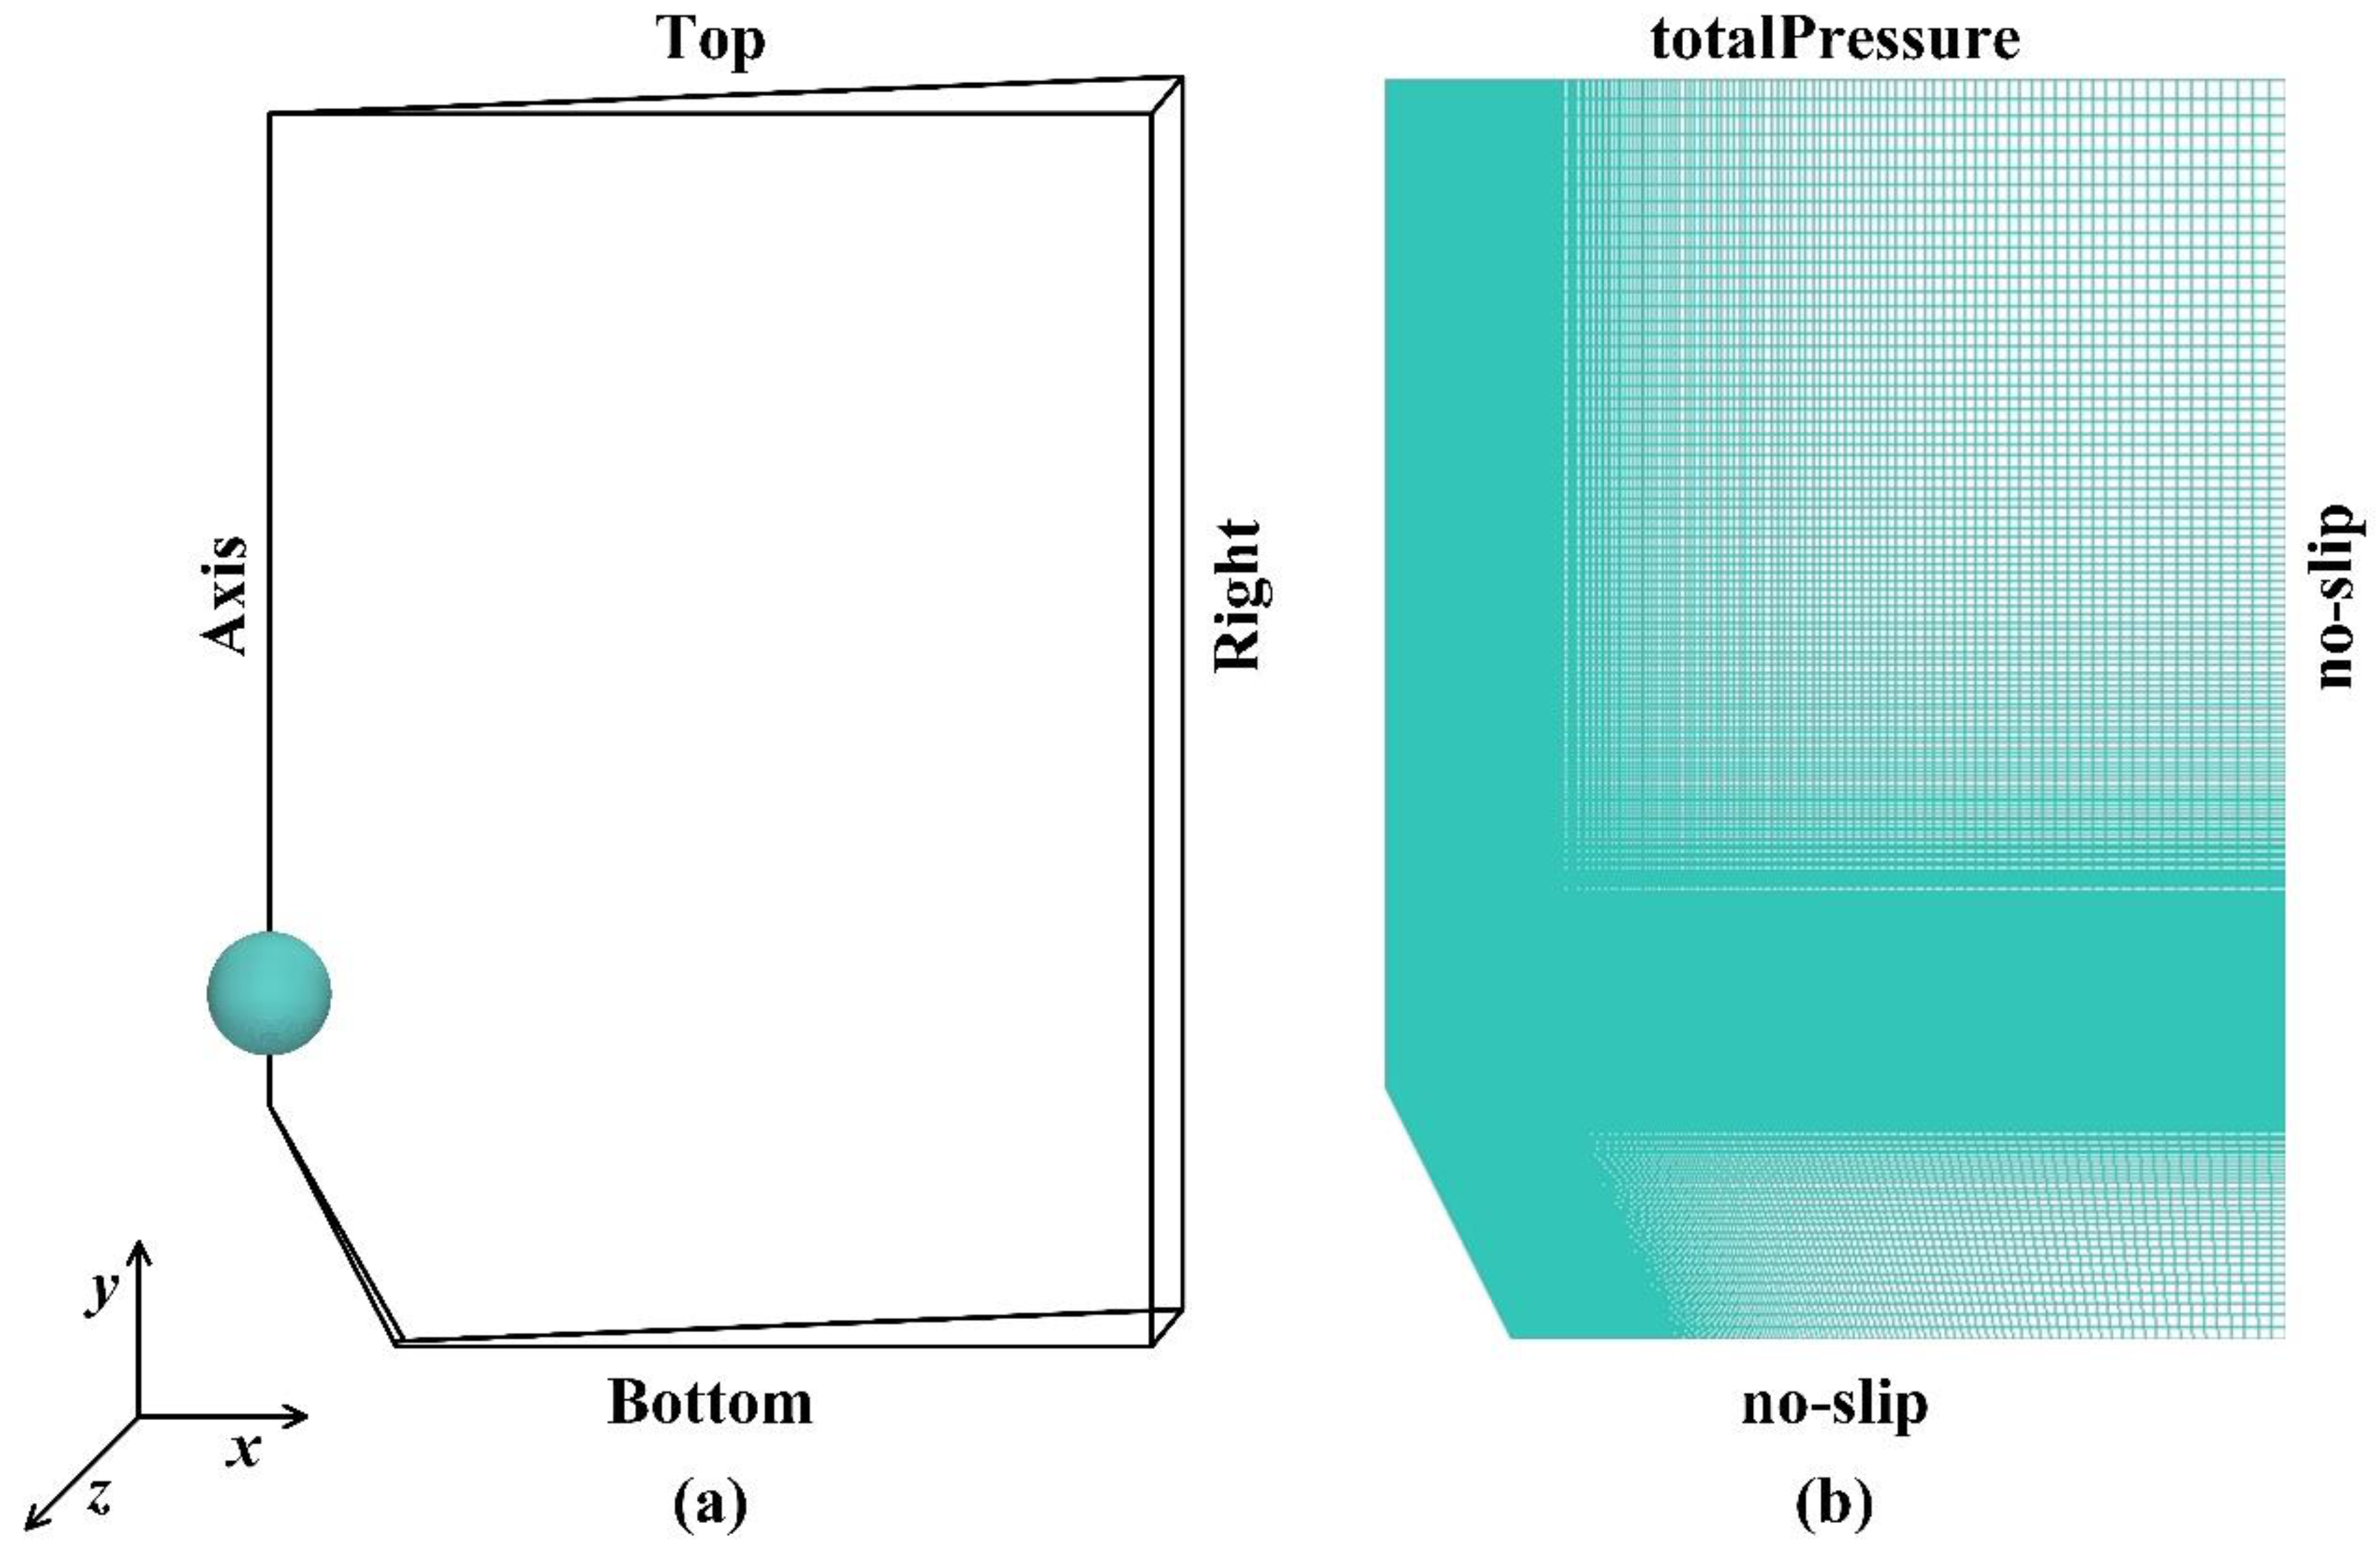
Figure 4.
Comparison of the bubble equivalent radius between simulation (solid red line) and experiment (block dot) with γ = 1.3.
Figure 4.
Comparison of the bubble equivalent radius between simulation (solid red line) and experiment (block dot) with γ = 1.3.

Figure 5.
The evolution of bubble shape with γ = 1.3. ((a1)~(a14)) for the experiments; ((b1)~(b14)) for the numerical results.
Figure 5.
The evolution of bubble shape with γ = 1.3. ((a1)~(a14)) for the experiments; ((b1)~(b14)) for the numerical results.
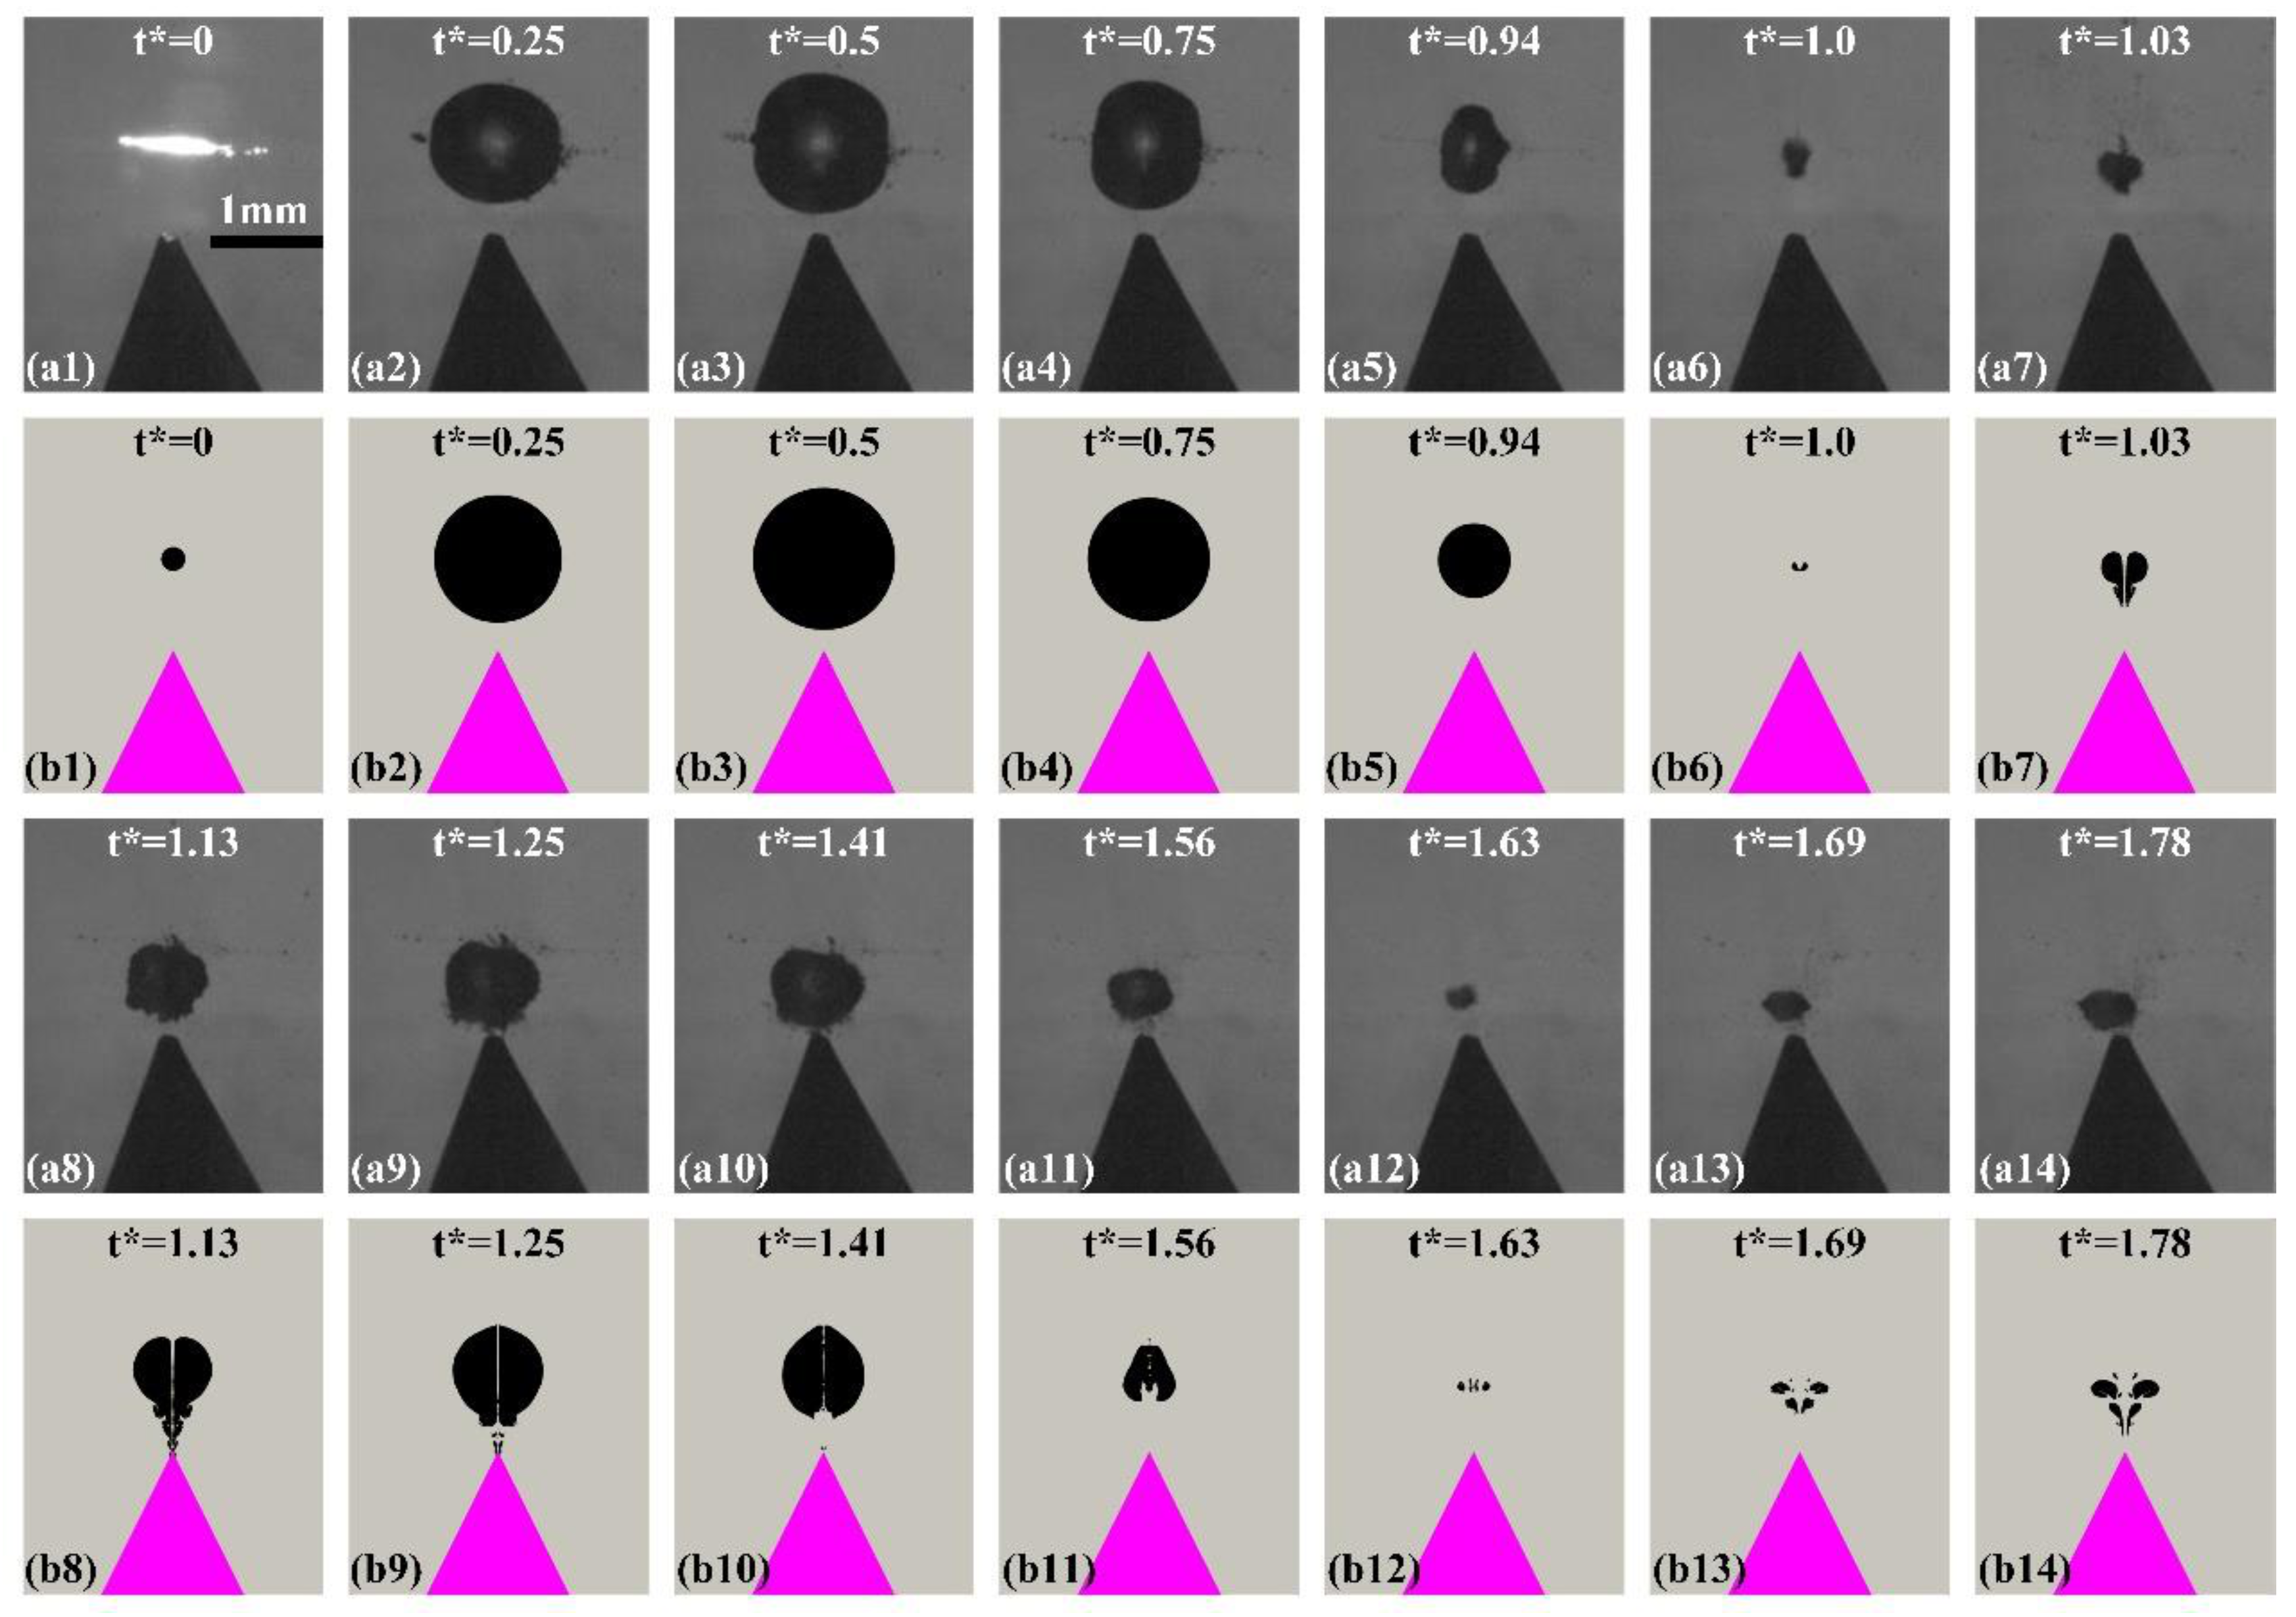
Figure 6.
Evolution of pressure (left half) and velocity (right half) fields with bubble shape (white line) at γ = 1.3. (a) t* = 0.974, (b) t* = 0.999, (c) t* = 1.033, (d) t* = 1.067, (e) t* = 1.248, (f) t* = 1.405, (g) t* = 1.562, (h) t* = 1.625, (i) t* = 1.689.
Figure 6.
Evolution of pressure (left half) and velocity (right half) fields with bubble shape (white line) at γ = 1.3. (a) t* = 0.974, (b) t* = 0.999, (c) t* = 1.033, (d) t* = 1.067, (e) t* = 1.248, (f) t* = 1.405, (g) t* = 1.562, (h) t* = 1.625, (i) t* = 1.689.

Figure 7.
Time histories of the bubble radius (solid black line), bubble centroid position (solid green line), the maximum temperature within the bubble (solid red line), and pressure at the apex of the cone (solid blue line) with γ = 1.3.
Figure 7.
Time histories of the bubble radius (solid black line), bubble centroid position (solid green line), the maximum temperature within the bubble (solid red line), and pressure at the apex of the cone (solid blue line) with γ = 1.3.
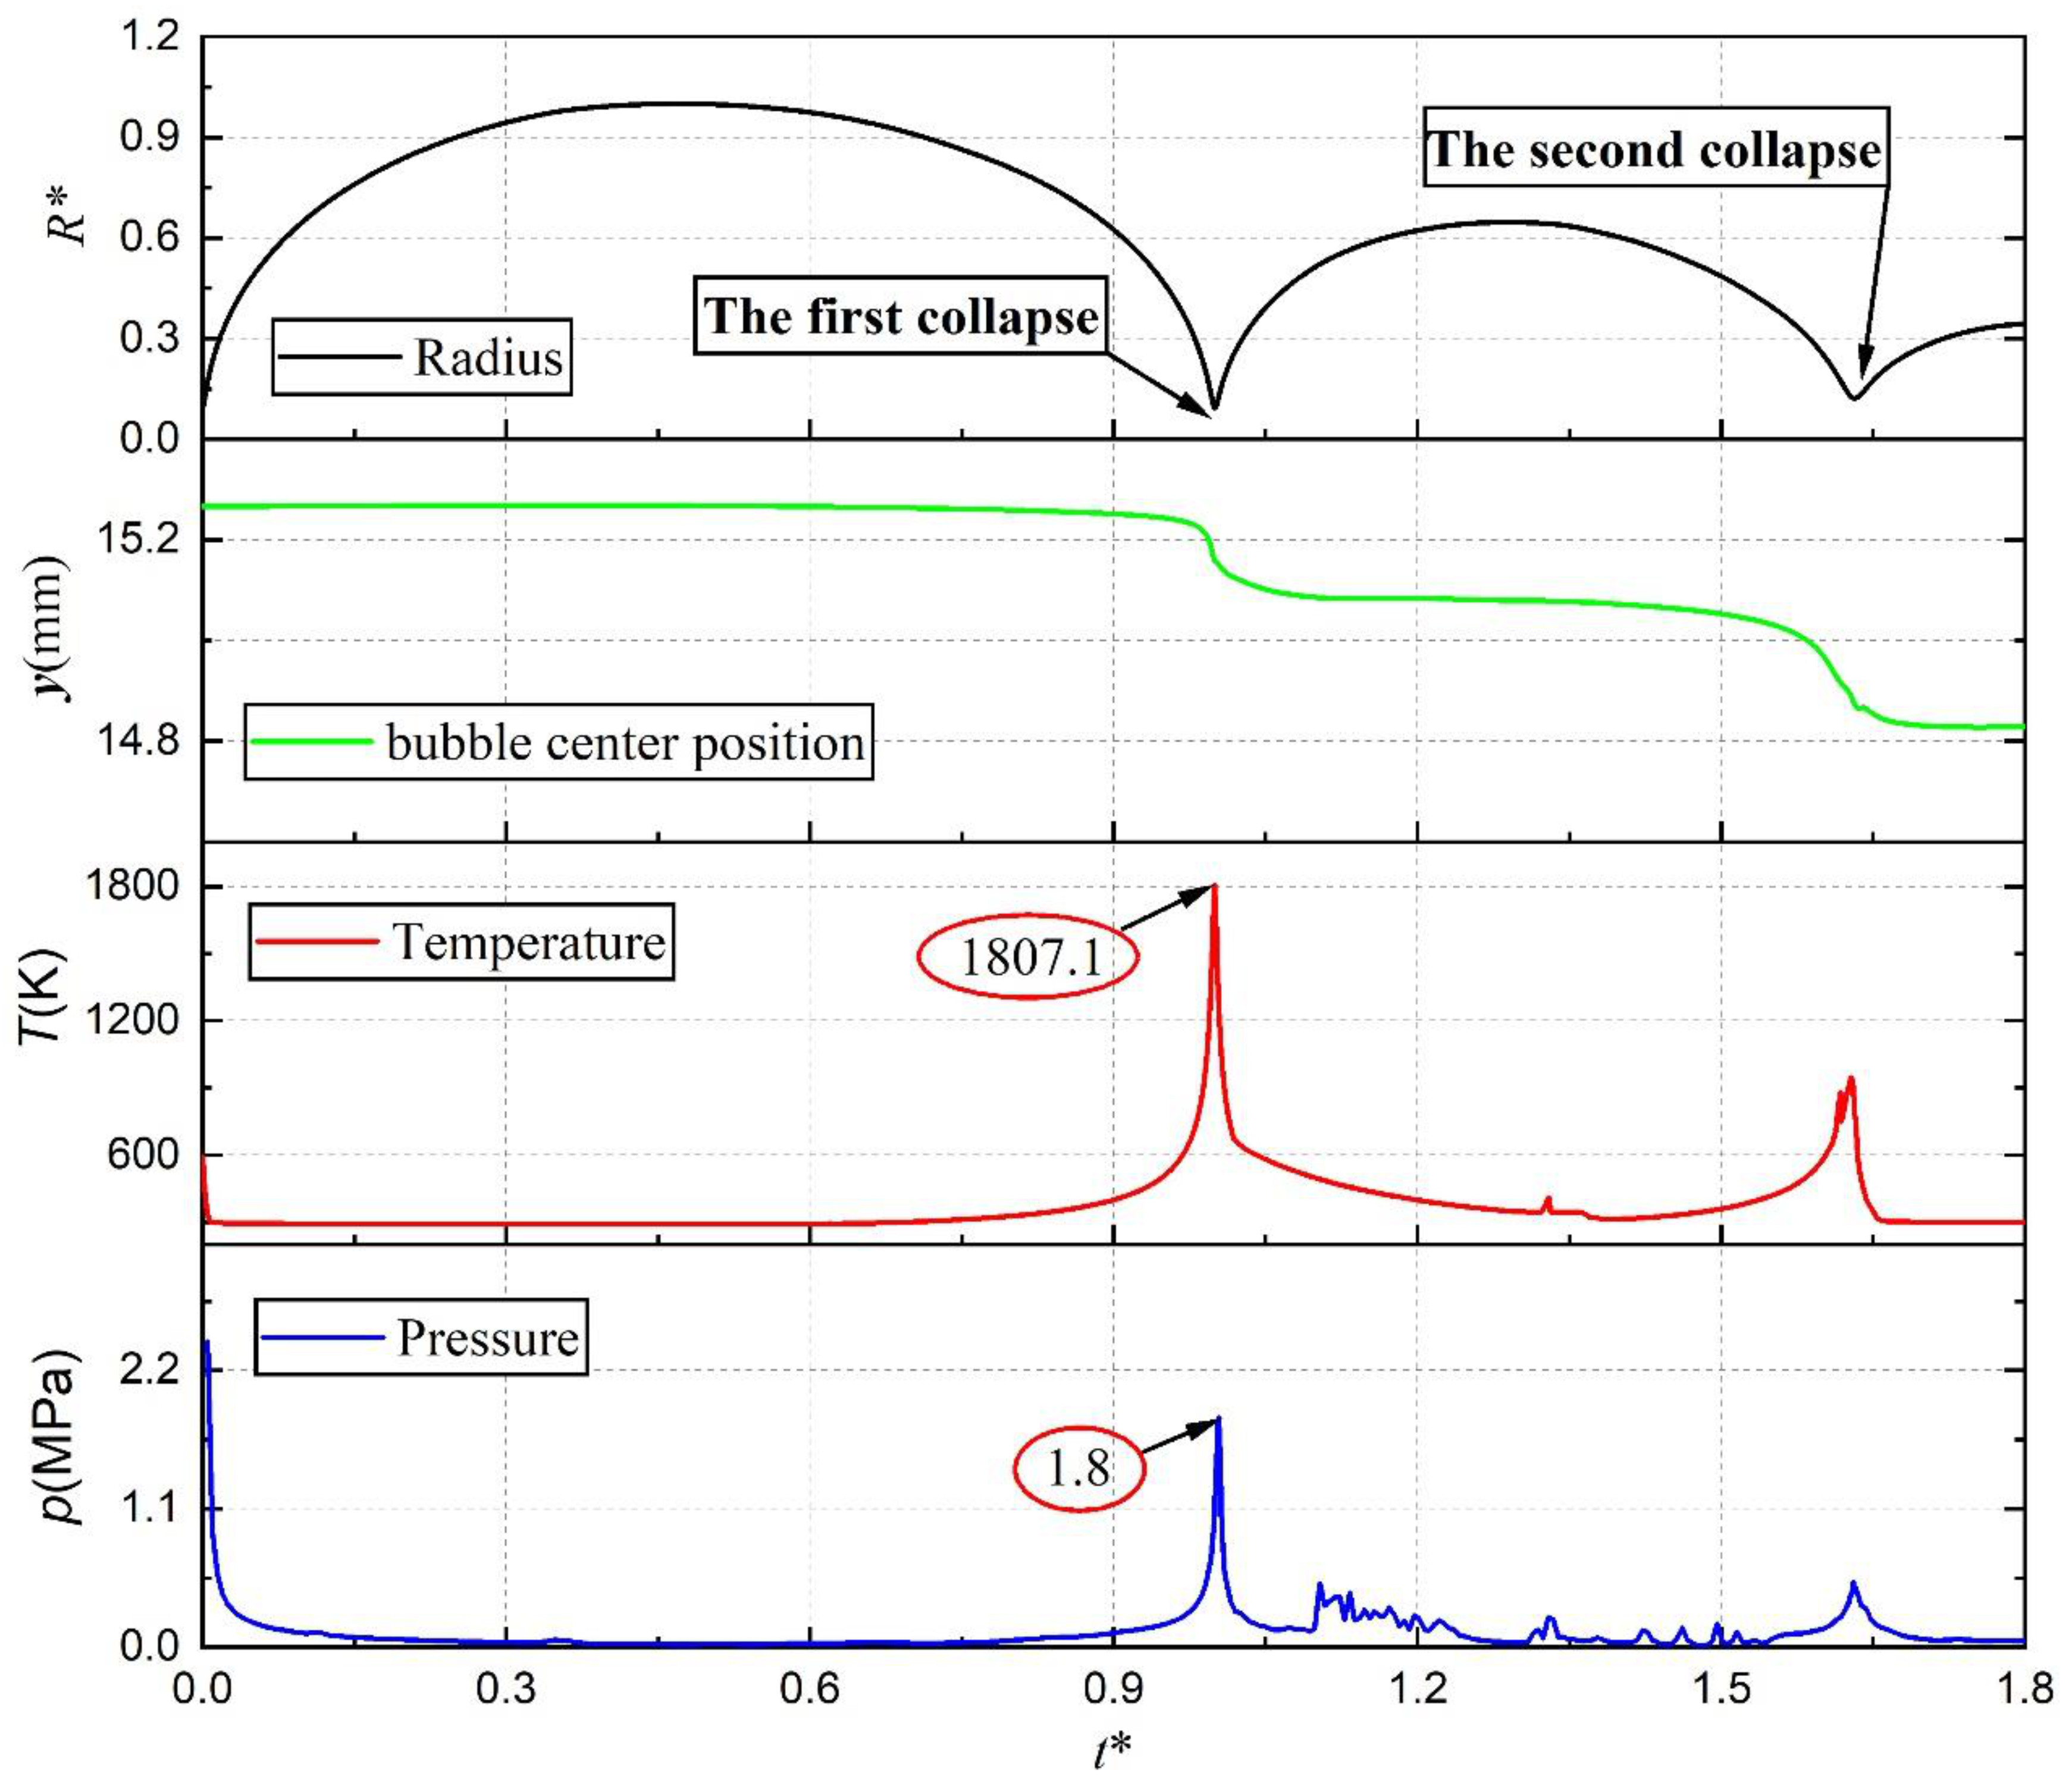
Figure 8.
The evolution of bubble shape with γ = 0.4. ((a1)~(a14)) for the experiments; ((b1)~(b14)) for the simulations.
Figure 8.
The evolution of bubble shape with γ = 0.4. ((a1)~(a14)) for the experiments; ((b1)~(b14)) for the simulations.

Figure 9.
Evolution of pressure (left half) and velocity (right half) fields with bubble shape (white line) at γ = 0.4. (a) t* = 0.993, (b) t* = 1.0, (c) t* = 1.016, (d) t* = 1.261, (e) t* = 1.412, (f) t* = 1.551.
Figure 9.
Evolution of pressure (left half) and velocity (right half) fields with bubble shape (white line) at γ = 0.4. (a) t* = 0.993, (b) t* = 1.0, (c) t* = 1.016, (d) t* = 1.261, (e) t* = 1.412, (f) t* = 1.551.
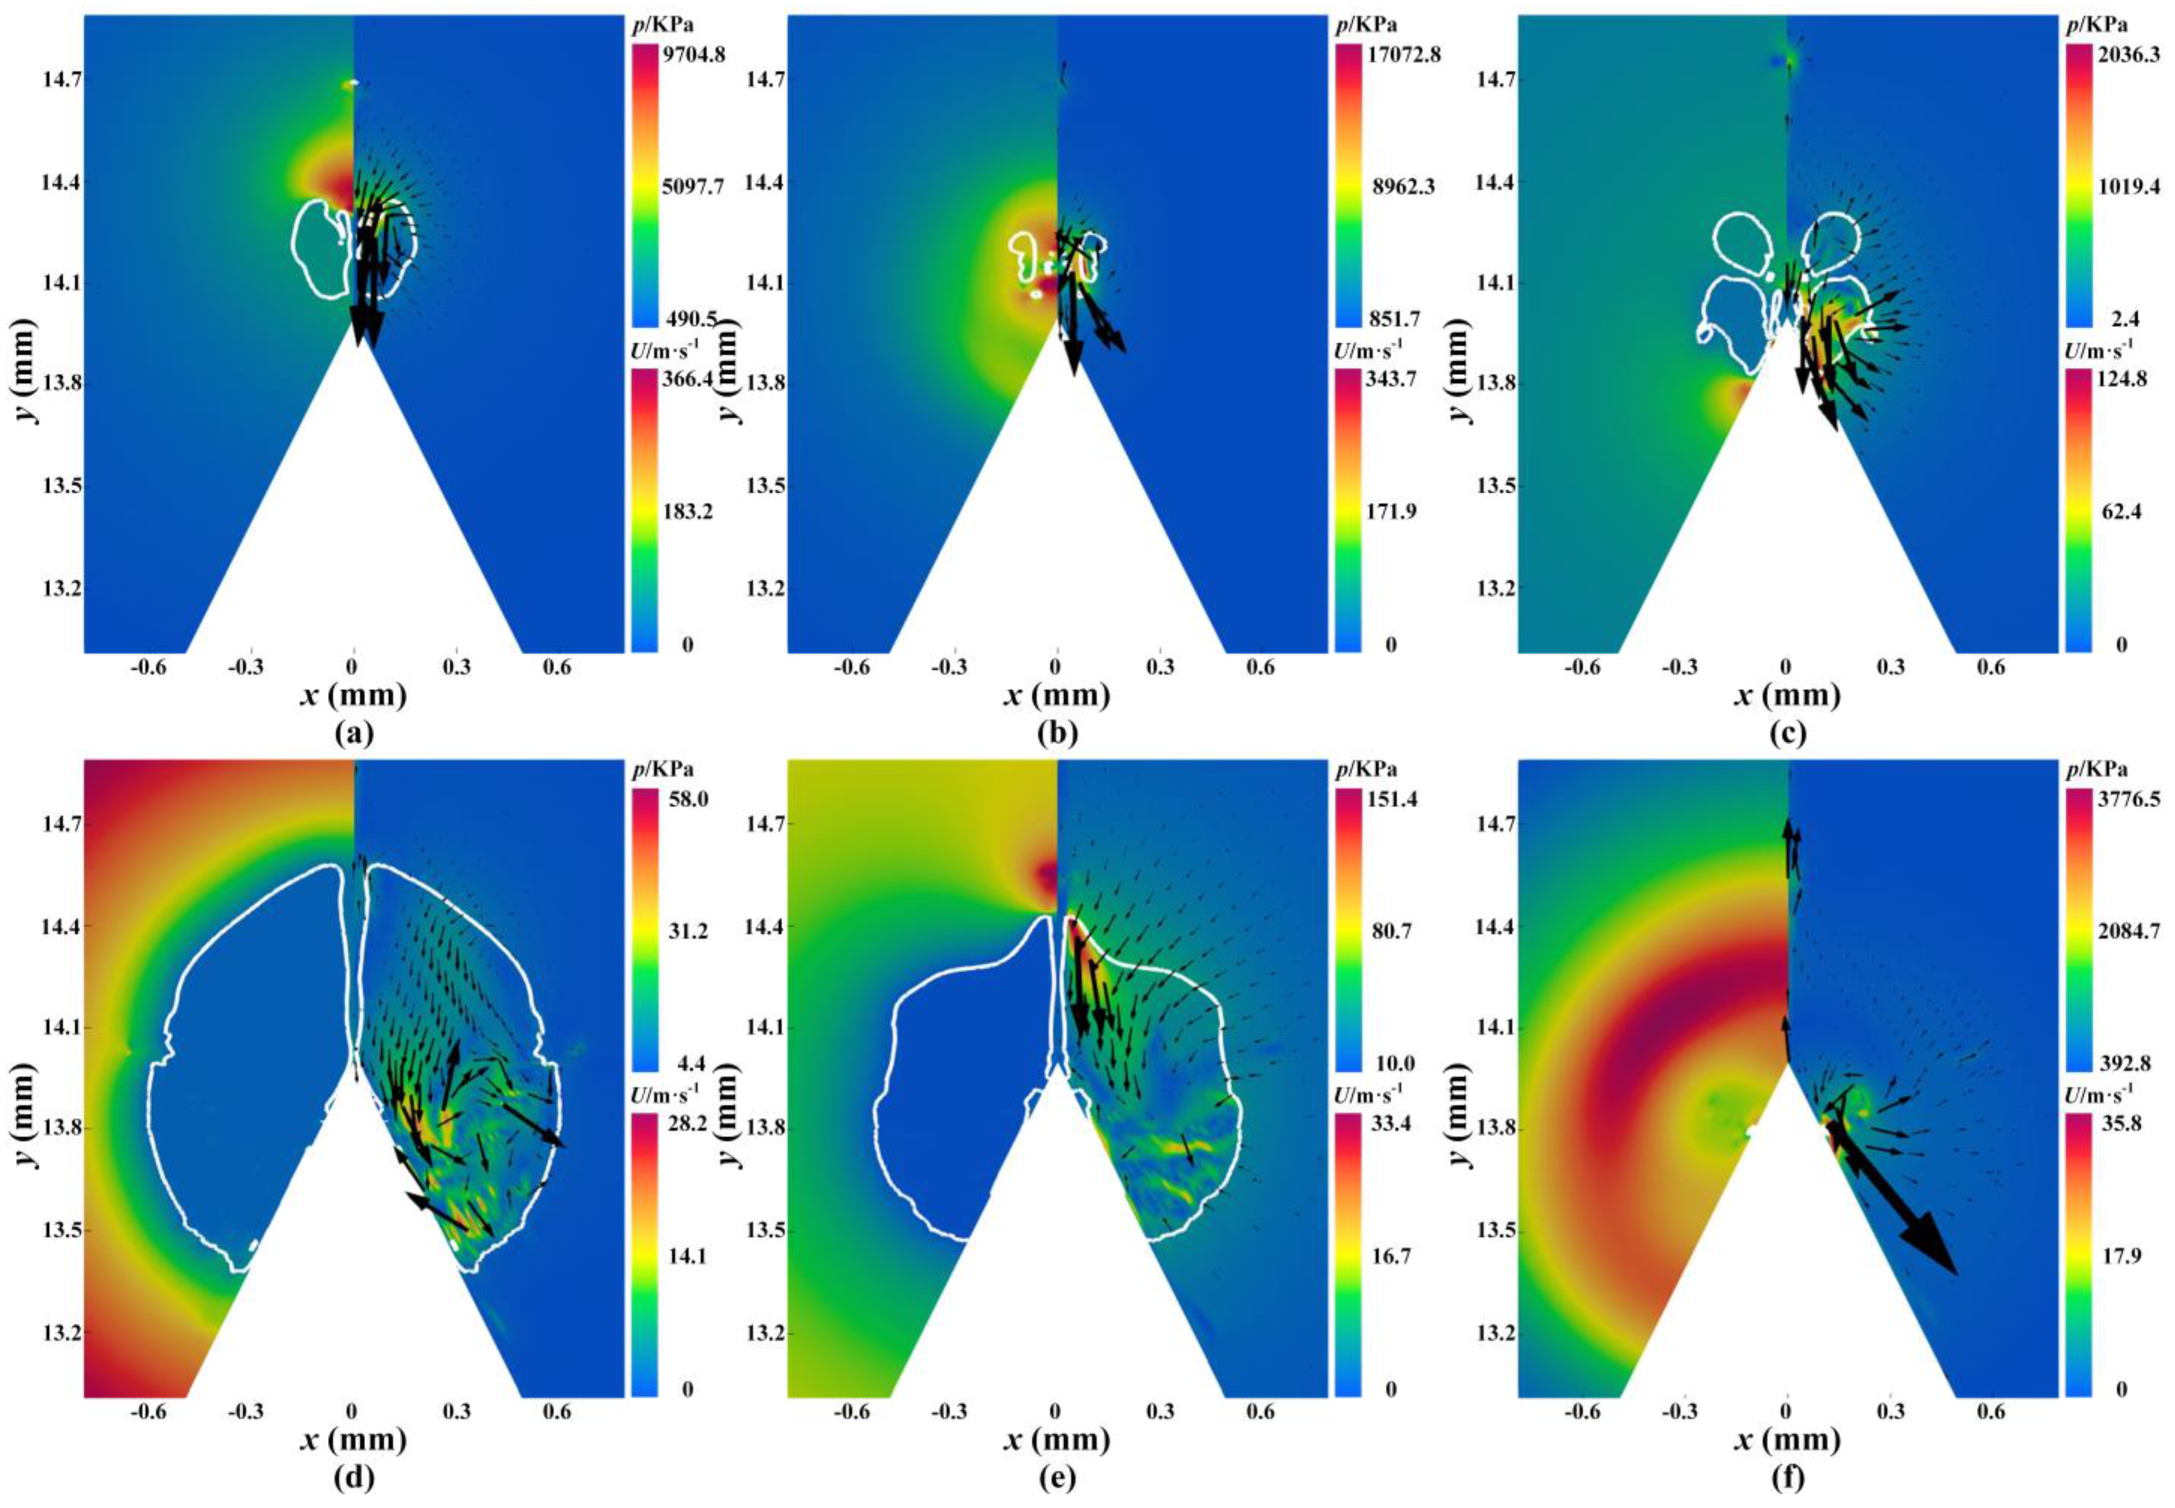
Figure 10.
Shock wave distribution with density gradient for (a) t* = 0.005, (b) t* = 1.0, (c) t* = 1.55 with γ = 0.4.
Figure 10.
Shock wave distribution with density gradient for (a) t* = 0.005, (b) t* = 1.0, (c) t* = 1.55 with γ = 0.4.
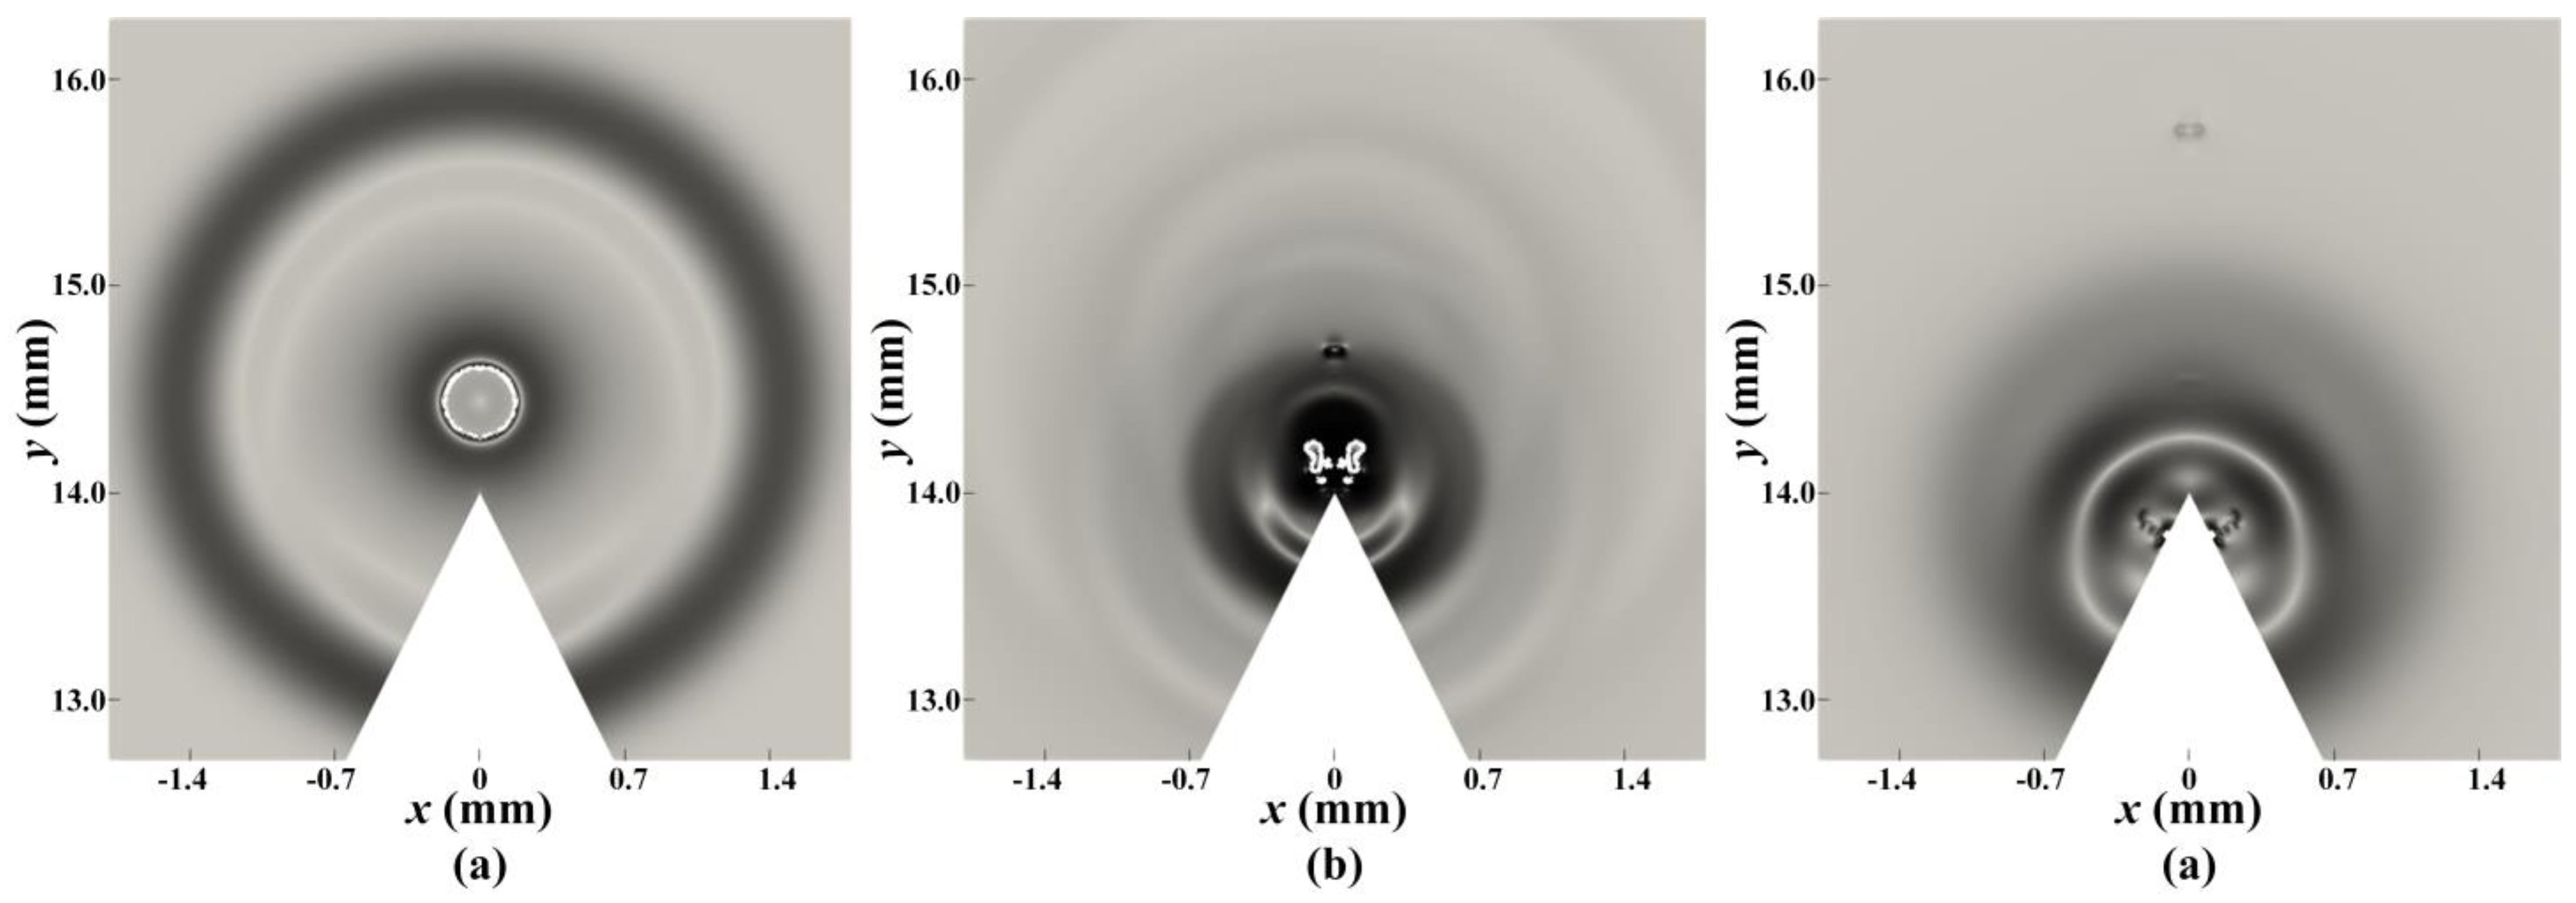
Figure 11.
Time histories of the bubble radius (solid black line), bubble centroid position (solid green line), the maximum temperature within the bubble (solid red line), and pressure at the apex of the cone (solid blue line) with γ = 0.4.
Figure 11.
Time histories of the bubble radius (solid black line), bubble centroid position (solid green line), the maximum temperature within the bubble (solid red line), and pressure at the apex of the cone (solid blue line) with γ = 0.4.
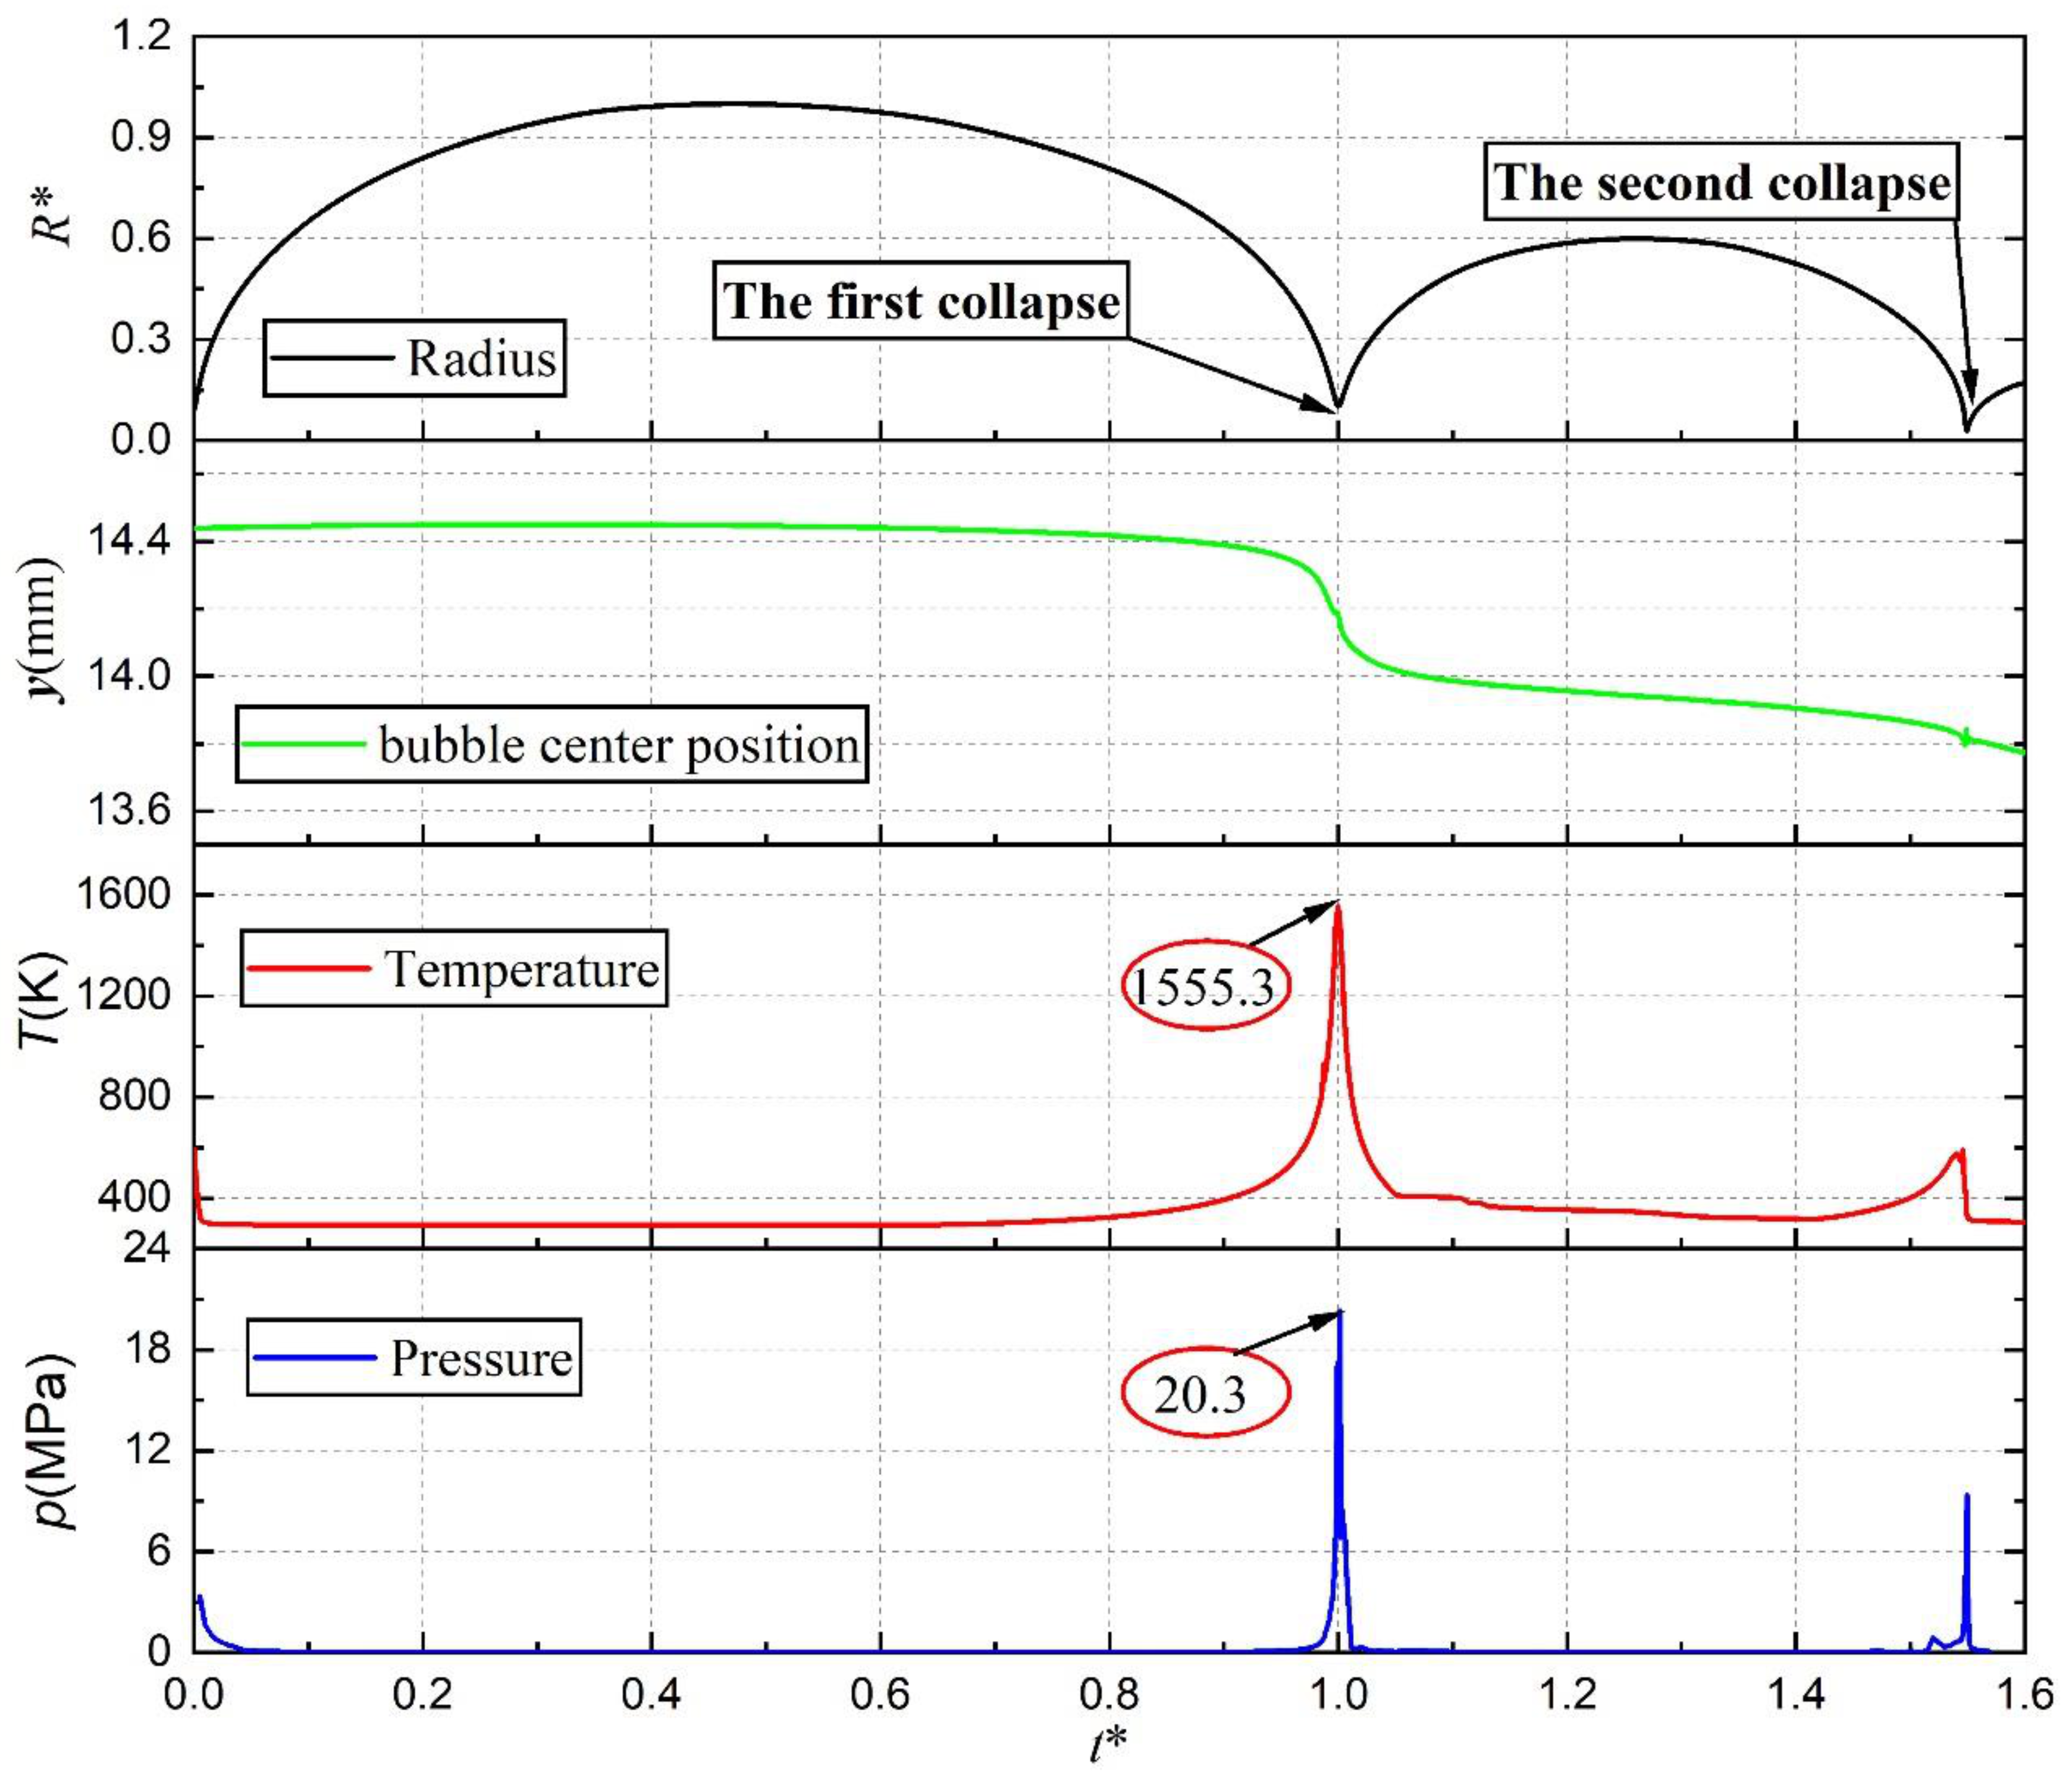
Figure 12.
Time history of the bubble centroid migration (a) and pressure on the cone apex (b) with various γ values.
Figure 12.
Time history of the bubble centroid migration (a) and pressure on the cone apex (b) with various γ values.


Figure 13.
Pressure fields at the end of the bubble collapse for each stage.
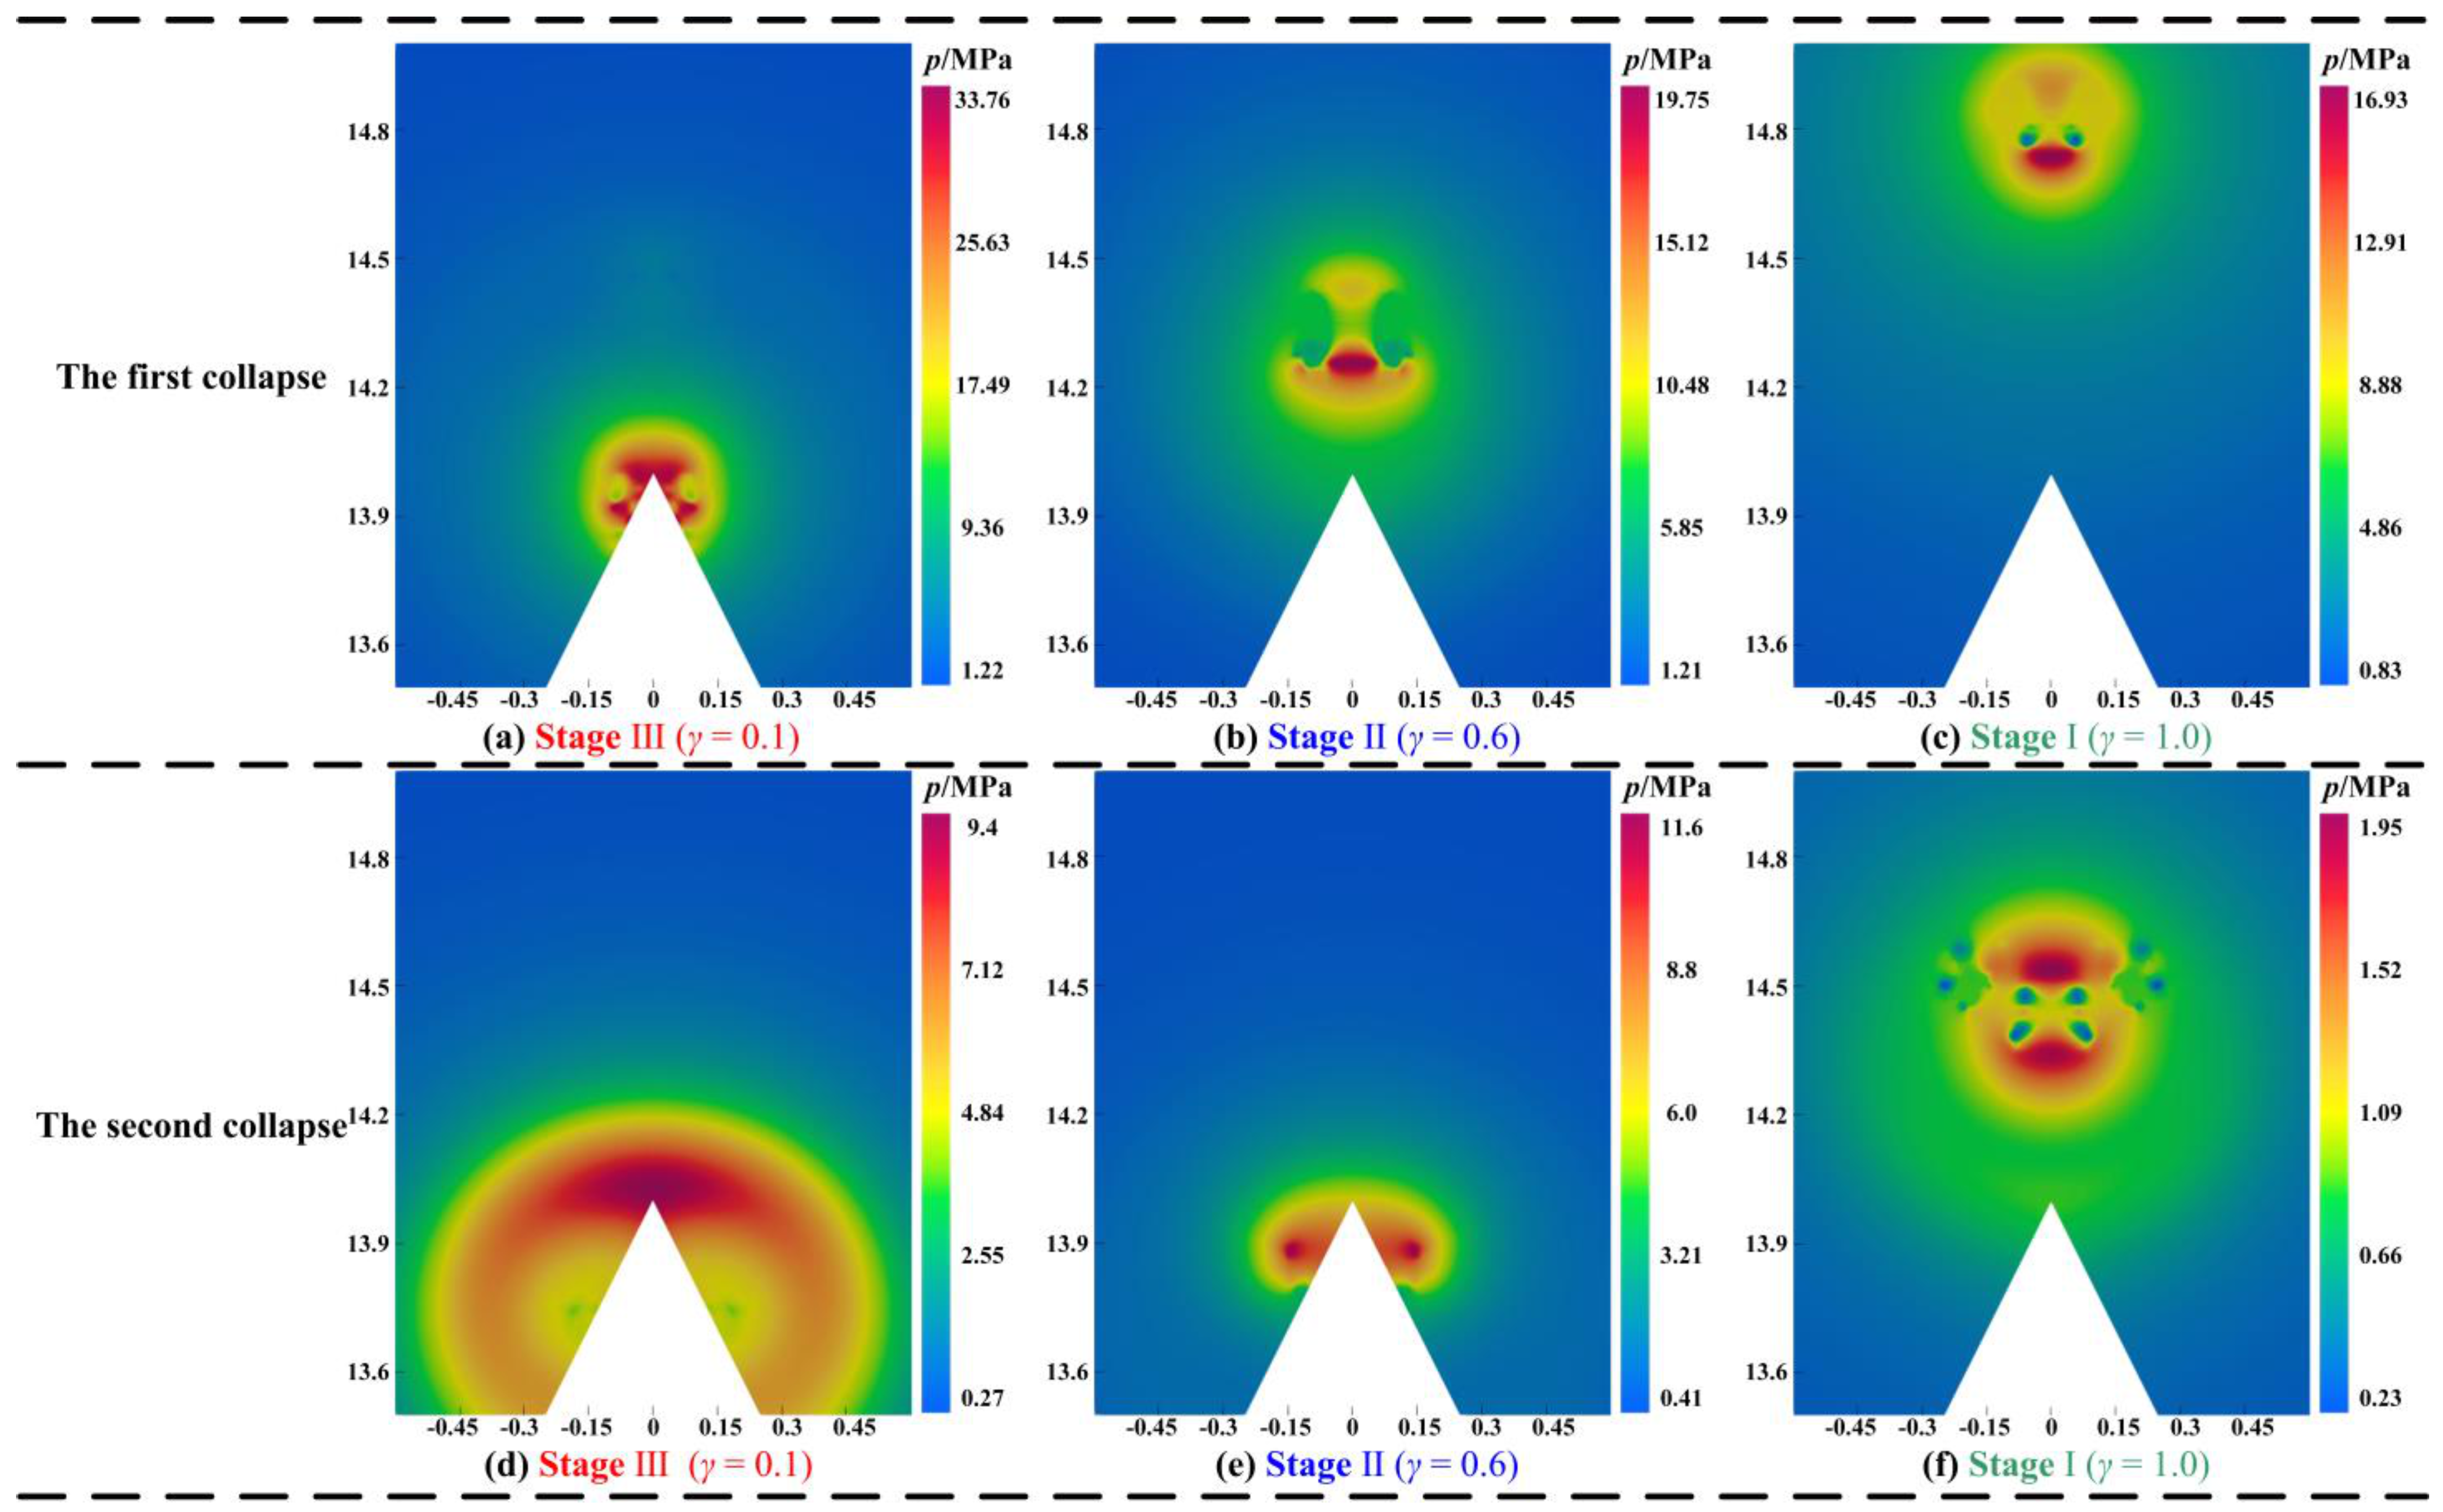
Figure 14.
Schematic diagram of different θ.
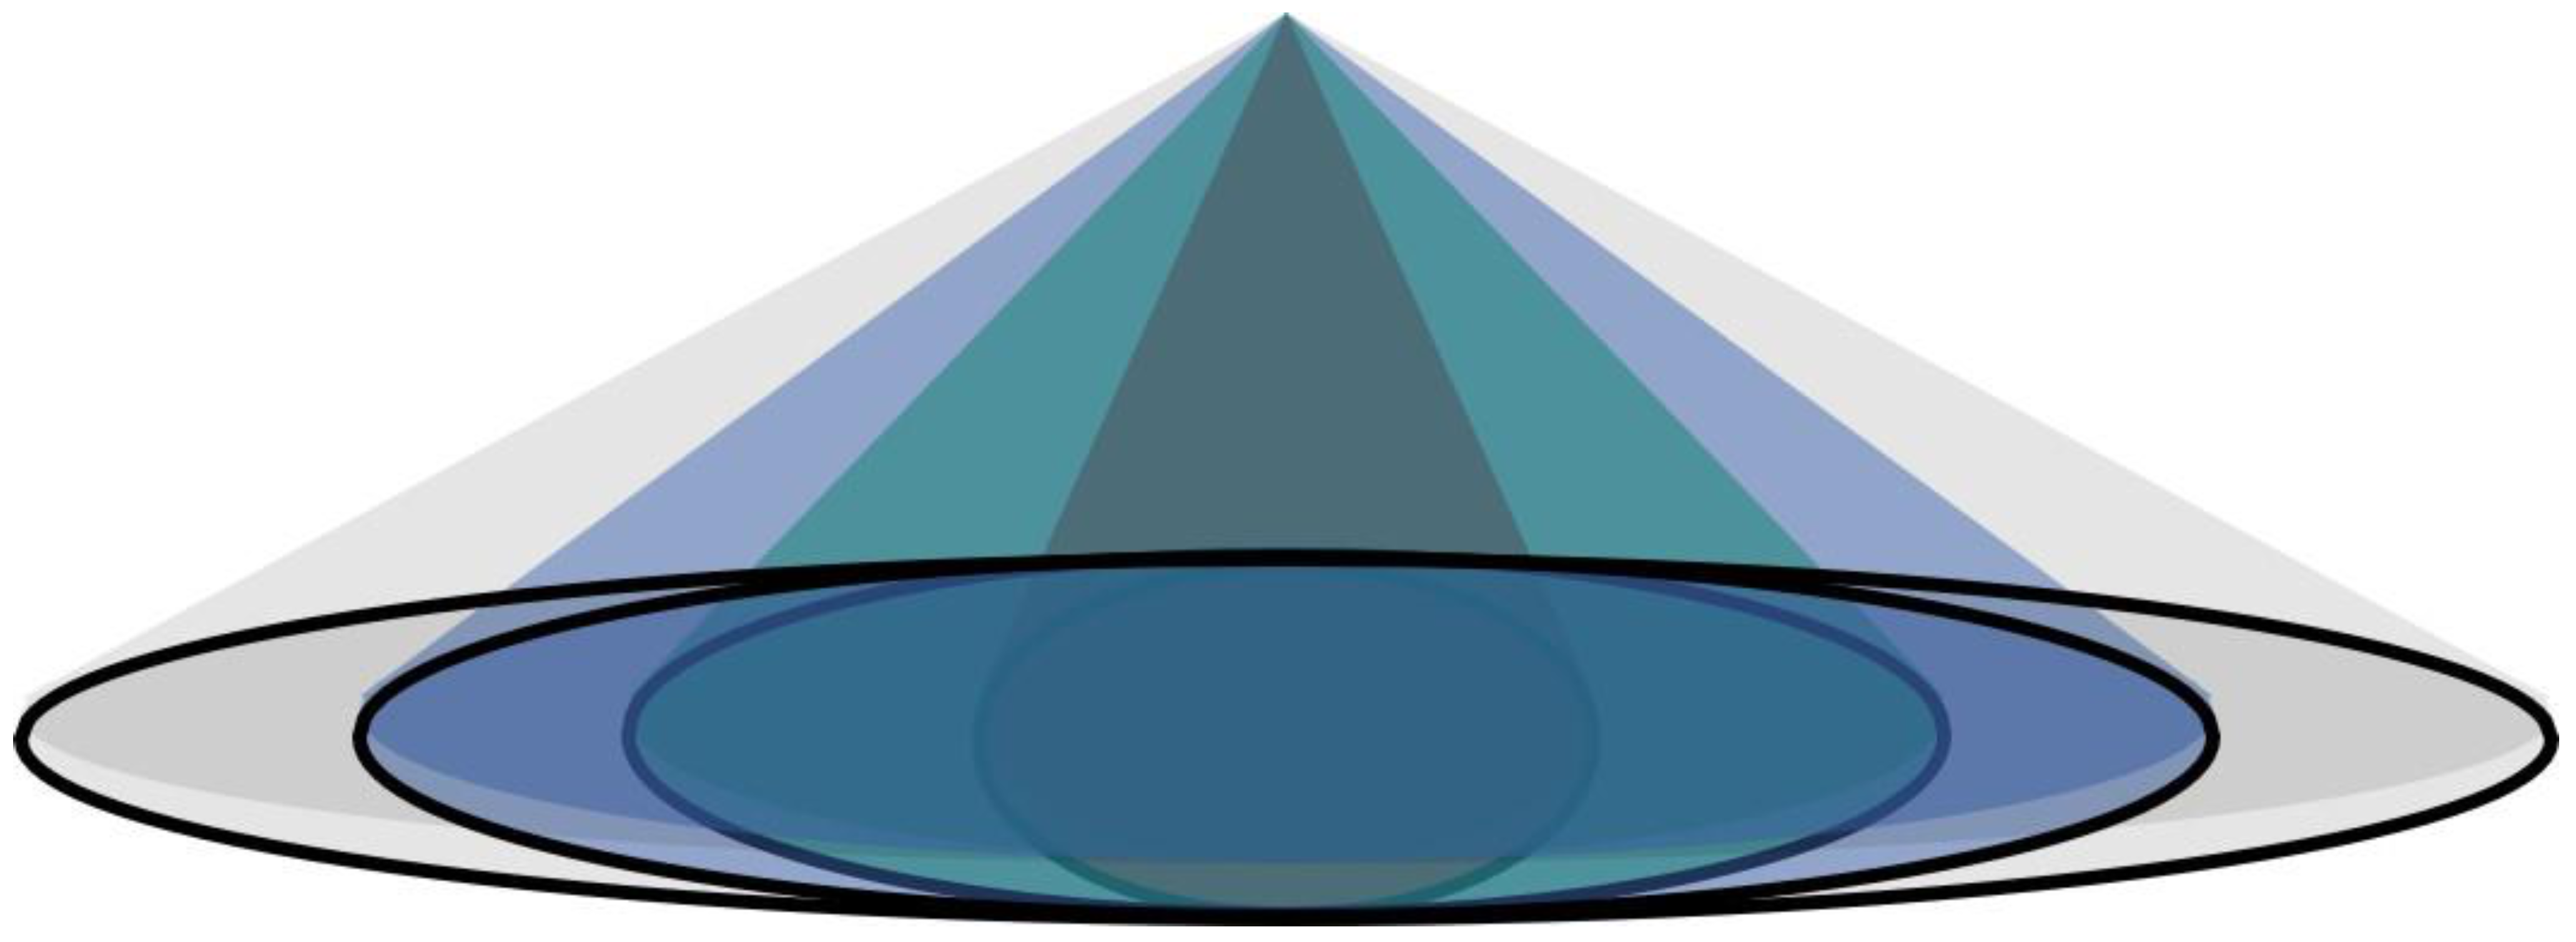
Figure 15.
Bubble center position in the final collapse stages at γ = 1.3 with various θ values.

Figure 16.
Pressure peaks on the cone apex in the final collapse stages at γ = 1.3 with various θ values.
Figure 16.
Pressure peaks on the cone apex in the final collapse stages at γ = 1.3 with various θ values.
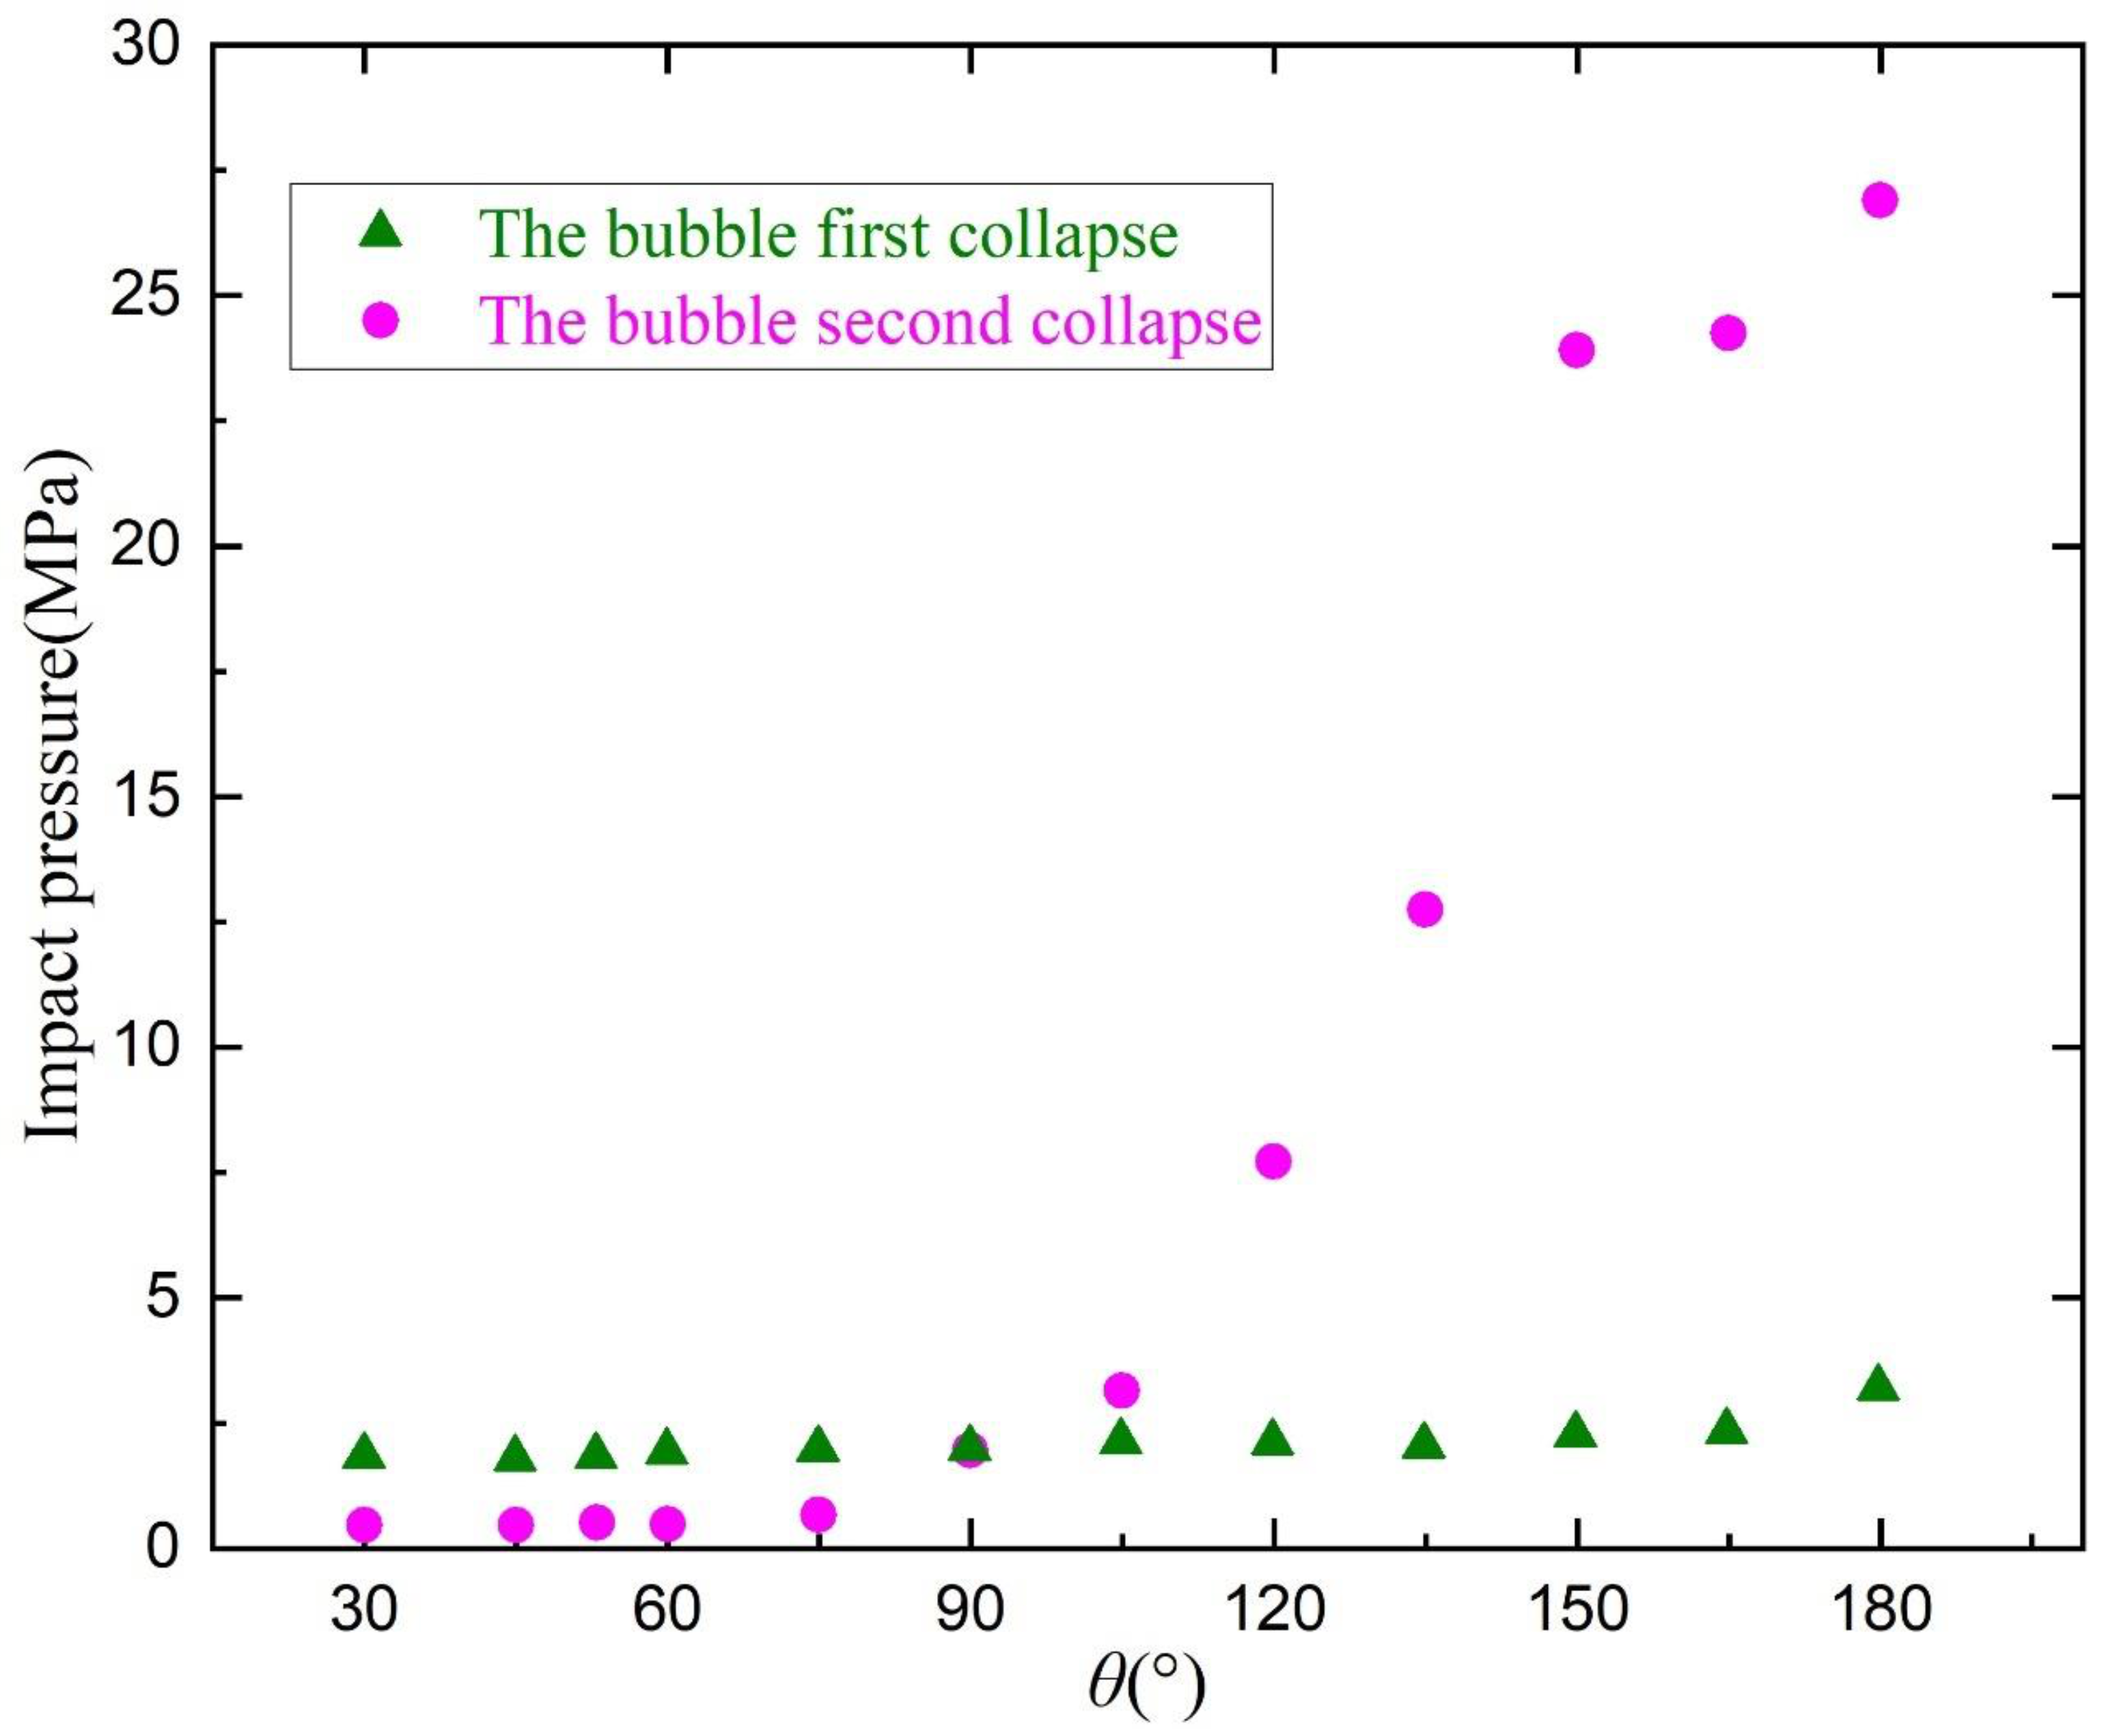
Figure 17.
The typical pressure fields in the final bubble collapse stage under different θ values. (a,c) are the first collapse and second collapse for θ = 75°, respectively; (b,d) are the first collapse and second collapse for θ = 150°, respectively.
Figure 17.
The typical pressure fields in the final bubble collapse stage under different θ values. (a,c) are the first collapse and second collapse for θ = 75°, respectively; (b,d) are the first collapse and second collapse for θ = 150°, respectively.
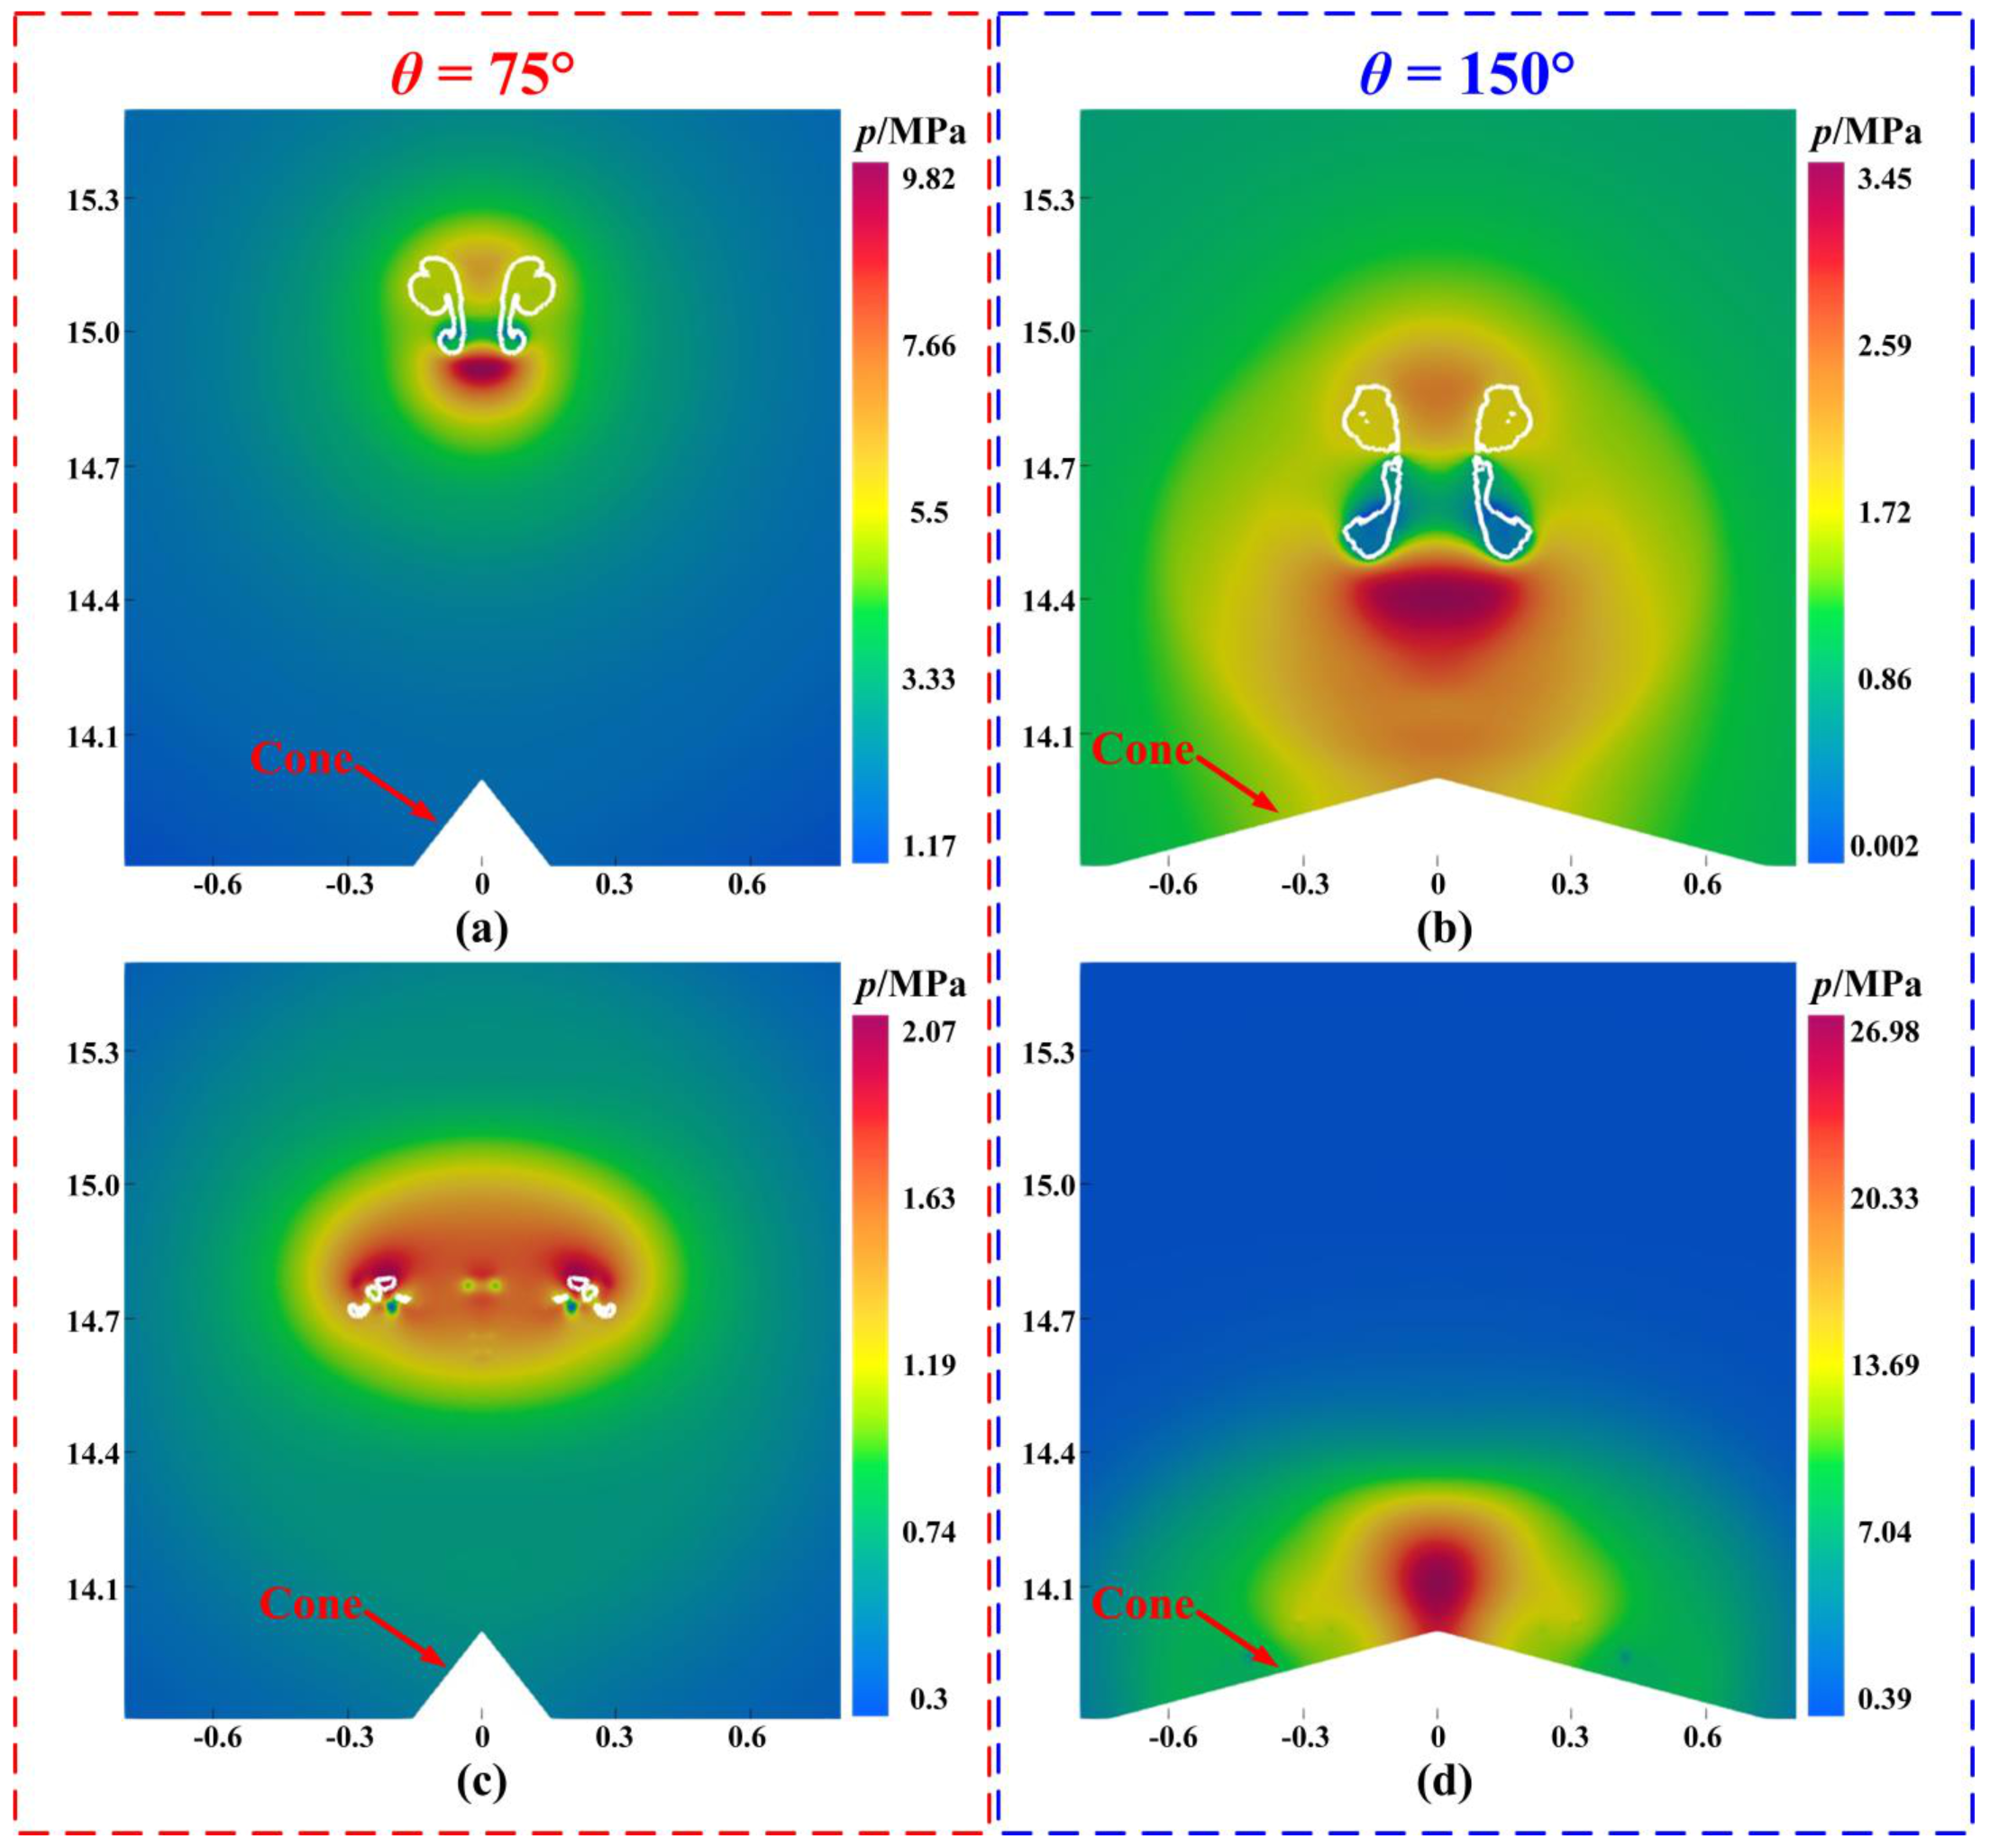
Figure 18.
Maximum temperature inside the bubble (pink dots), the first minimum radius (white/blue dots), and the dissipated energy in the bubble’s first cycle (dark cyan diamonds) at γ = 1.3 under various θ values.
Figure 18.
Maximum temperature inside the bubble (pink dots), the first minimum radius (white/blue dots), and the dissipated energy in the bubble’s first cycle (dark cyan diamonds) at γ = 1.3 under various θ values.

Figure 19.
Bubble center position (a), pressure peaks (b), and dissipated energy (c) at γ = 0.1 under various θ values.
Figure 19.
Bubble center position (a), pressure peaks (b), and dissipated energy (c) at γ = 0.1 under various θ values.

Table 1.
The initial values of liquid- and vapor-phase properties.
| ρ (kg/m3) | μ (Pa·s) | Cp (J/(kg·K)) | λ (W/(m·K)) | σ (N/m) | |
|---|---|---|---|---|---|
| Vapor | 0.0171 | 9.75 × 10⁻⁶ | 1862.6 | 0.02 | 0.07 |
| Water | 998.16 | 9.982 × 10⁻⁴ | 4180 | 0.677 |
Disclaimer/Publisher’s Note: The statements, opinions and data contained in all publications are solely those of the individual author(s) and contributor(s) and not of MDPI and/or the editor(s). MDPI and/or the editor(s) disclaim responsibility for any injury to people or property resulting from any ideas, methods, instructions or products referred to in the content. |
© 2023 by the authors. Licensee MDPI, Basel, Switzerland. This article is an open access article distributed under the terms and conditions of the Creative Commons Attribution (CC BY) license (https://creativecommons.org/licenses/by/4.0/).
Share and Cite
MDPI and ACS Style
Yin, J.; Zhang, Y.; Gong, D.; Tian, L.; Du, X. Dynamics of a Laser-Induced Cavitation Bubble near a Cone: An Experimental and Numerical Study. Fluids 2023, 8, 220. https://doi.org/10.3390/fluids8080220
AMA Style
Yin J, Zhang Y, Gong D, Tian L, Du X. Dynamics of a Laser-Induced Cavitation Bubble near a Cone: An Experimental and Numerical Study. Fluids. 2023; 8(8):220. https://doi.org/10.3390/fluids8080220
Chicago/Turabian StyleYin, Jianyong, Yongxue Zhang, Dehong Gong, Lei Tian, and Xianrong Du. 2023. "Dynamics of a Laser-Induced Cavitation Bubble near a Cone: An Experimental and Numerical Study" Fluids 8, no. 8: 220. https://doi.org/10.3390/fluids8080220