
Simulation and Experimental Activity for the Evaluation of the Filling Capability in External Gear Pumps

1
Casappa S.p.A., 43044 Lemignano di Collecchio, Italy
2
Department of Energy, Politecnico di Torino, 10129 Turin, Italy
*
Author to whom correspondence should be addressed.
Fluids 2023, 8(9), 251; https://doi.org/10.3390/fluids8090251
Submission received: 14 August 2023
/
Revised: 1 September 2023
/
Accepted: 12 September 2023
/
Published: 14 September 2023
(This article belongs to the Special Issue Selected Papers from the 2022 IEEE Global Fluid Power Society PhD Symposium (GFPS 2022))
Abstract
:Partial electrification of hydraulic circuits to achieve energy savings requires an increase in the angular speed of the positive displacement pumps, with the risk of incomplete filling. In this context, the paper focuses on developing a computational fluid dynamics (CFD) model using SimericsMP+ for two external gear pumps, namely helical and spur type gears. The objective of this study is the analysis of the phenomena occurring on the suction side under conditions of incomplete filling at high speeds. Both CFD models have been validated by conducting experimental tests for measuring the flow rate delivered at various inlet pressures and angular speeds. The experimental results confirm the model’s capability to accurately detect the operating conditions at which the delivered flow rate starts to decrease due to the partial filling of the inter-teeth chambers. Furthermore, this paper investigates the effects of certain geometrical modifications to the spur gear pump. Specifically, the influence of the gear’s width-to-diameter ratio is studied, revealing that a lower ratio leads to slightly better filling. Conversely, increasing the inlet port diameter results in no improvement. Based on this study, the modelling approach appears to be accurate enough to serve as design tool for optimizing pumps to improve their filling capability.
1. Introduction
A current trend in the field of hydraulic power units is the control of the flow rate through variable-speed electric prime movers, driving a fixed displacement pump [1]. In particular, electro-hydrostatic actuators (EHAs), initially developed for aeronautical applications, are mature enough to replace the centralized hydraulic circuit in many off-road vehicles [2]. For instance, in the field of earth-moving machines, many different layouts have been analyzed for achieving fuel saving [3], including the use of individual electro-hydraulic drives for the main actuators [4]. Other solutions involve the of use electro-hydraulic drives, but still maintaining a centralized hydraulic supply [5,6]. The main advantage of these new layouts is that contrary to traditional architectures [7,8] or their evolutions [9,10,11], the hydraulic valves in the main transmission line are partially or totally removed, since the flow rate, and therefore the speed of the actuators, is controlled by the angular velocity of the electric motor, instead of throttling the flow.
Gear pumps are one of the most suitable units for such applications [12]. Internal gear machines (crescent pumps) have the advantage that, at equal geometry to the driver gear, the kinematic flow ripple is almost an order of magnitude smaller than in an external gear pump [13]. Such a favorable characteristic leads to lower noise, although on this aspect some technical improvements can be implemented also in the external gear units [14]. However, external gear machines are most commonly used due to the higher maximum working pressure and the lower manufacturing cost [15]. In this context, the helical gear type is more promising, being quieter than the corresponding type with straight teeth (spur gear) [16].
Several studies have been conducted for developing simulation models of external gear pumps. Recent study topics have focused on the accurate evaluation of the mechanical–hydraulic efficiency [17,18], the gears’ micromotion [19], the proper design of the balance plates [20], a comparison between the 0D and 3D modelling approach [21], and a comparison between different 3D methodologies [22]. A new challenge is the use of fixed-displacement pumps in applications with variable-speed electric motors. Since this layout features one pump for each actuator, in multi-actuator systems the number of pumps increases with the need to keep their displacement as small as possible to limit the increment of weight. To take the concept to the extreme, some authors proposed the integration of an electric machine and a hydraulic pump in a single housing [23] or self-contained electro-hydraulic cylinders [24]. For this reason, the increment of the maximum operating velocity is required to compensate for the smaller displacement, with the risk of incomplete filling and cavitation [25]. The most evident effect of this phenomenon is saturation of the delivered flow rate, despite the increment in the angular speed. The phenomenon occurs when the pressure difference between the suction port and the rotating inter-teeth spaces is not enough to accelerate the fluid up to a proper velocity. The consequence is that the fluid does not have enough time to completely fill the inter-teeth volumes before they leave the suction side. Such a working condition leads to two main problems: a significant decrease in the volumetric efficiency and a huge increment in the pressure ripple due to the sudden back flow, when the partially filled inter-teeth chambers connect to the delivery volume. The latter problem is also responsible for an abnormal increase in noise. Moreover, the implosion of gaseous bubbles also generates erosion damage over time. The usual and most effective way of avoiding incomplete filling consists of boosting the pump, but such a solution is not always feasible or economically convenient. All these problems are well known in the aeronautical field, where the increment in the power-to-weight ratio requires the use of small displacement pumps, typically axial-piston type, but with extreme operating speeds [26].
In this context, it is particularly important to develop a simulation model able to predict the filling capability in high-speed conditions, so that it can be used for pump optimization. The phenomenon of incomplete filling can be reproduced even with a 0D or 1D simulation model [27]. Moreover, a model tuned on the experimental flow rate can correctly reproduce the characteristic huge pressure ripple generated by the intense backflow, when the partially filled chambers connect to the delivery volume. However, a lumped parameter model can capture the influence of a geometric parameter on the pressure drop in the suction side only in an approximate way. The quantitative evaluation of the operating condition limits for the onset of incomplete filling can only be achieved with a CFD model, since the real 3D geometry, such as the spatial orientation of the chambers and the shape of the suction duct, must be considered without simplifications.
Some studies performed with 2D and 3D CFD models, with the aim of analyzing the cavitation in the meshing region of external gear pumps, have been carried out [28,29,30]. As regards the influence of the geometric parameters on the filling capability, some studies have been conducted using SimericsMP+® for gerotor [31] and vane pumps [32]. It has been demonstrated that the model is able to evaluate the beneficial or detrimental influence of a specific geometric modification. The main analyzed parameters are the number of chambers, the radius, and the axial thickness of the rotors. More recently, the capability of the software to predict the suction pressure at which the incomplete filling begins has been demonstrated for a straight-teeth external gear pump [33].
Based on the best of our knowledge, no simulation studies on the incomplete filling of helical gear pumps are available in the open literature. Furthermore, a research gap still exists regarding the evaluation of the geometrical parameters that most influence the filling capability in any type of external gear pump. In this context, this study presents CFD models of high-speed gear pumps and their experimental validation. A helical gear pump is first analyzed, and the model is validated in different operating conditions to demonstrate its predictivity. Then, some geometrical parameters are modified, more specifically the use of straight teeth, the ratio thickness/diameter of the rotors at equal pump displacement, and the inlet pipe diameter. The promising results gathered suggest that the methodology could be used to study how to design a pump to improve its high-speed performance.
2. Component Description
The unit used for the analysis is a prototype of a helical gear pump made by Casappa SpA, shown in Figure 1. The pump is made to work with a recommended kinematic viscosity of the fluid of up to 100 mm2/s at a maximum pressure of almost 300 bar, to cover the typical flow requirements of the working hydraulics in construction and agricultural machines. The two gears are integral with the shaft and are housed in the pump casing. The shafts are supported by journal bearings mounted on the balance plates that are housed without interference in the pump casing, so that they are free to generate axial micromovement [34,35]. The aim of the balance plate is twofold: to compensate for the axial gaps and to manage the connection to the trapped volume in the meshing region. The former task is obtained by transferring the delivery pressure on the rear of the plates, so that the gears are clamped with a well-designed force that allows for a significant reduction in the lateral leakages without a detrimental increment in the friction. The latter function is realized by proper millings (silencing grooves) on the gear side of the plates, visible in Figure 1, to keep a connection between the trapped volume in the meshing region with the inlet and the delivery volumes, to avoid the buildup of positive or negative pressure peaks. The balance plates also feature peripheral channels to transfer the delivery pressure back into a number of inter-teeth volumes to modify, in a more favorable way, the radial force acting on the rotors [36].
In Figure 2, a frontal view of the rotors in a generic gear pump is shown to define the main geometric quantities; the clearances are magnified for ease of viewing. For confidentiality reasons, the parameters of the pump are not provided; furthermore, the geometry of the balance plate in Figure 1 and of the gears in Figure 2 has been changed with respect to the component being studied.
To verify the predictivity of the model, the straight-teeth configuration was also modeled and tested experimentally. Lastly, for the spur gear design, the effect of the different thickness-to-diameter ratio H/D (see Figure 1 and Figure 2), at equal displacement, and of the increase in the inlet port diameter, were assessed. A summary of the configurations is reported in Table 1.
3. Description of the Simulation Model
3.1. Model Structure
The model was developed at the Politecnico di Torino, with the SimericsMP+ 5.2 software. Starting from the surfaces of the fluid domain, different volumes were identified, as shown in Figure 3. The inlet and delivery ducts, including the peripheral channels and grooves on the balance plates, were kept fixed. The green volumes were left to rotate around the gear axes. Additionally, a cylindrical volume was added to simulate the upstream portion of the inlet pipe. The position of the inlet pressure measuring point is the same as on the test rig. For the selection of the distance of the inlet boundary condition from the measuring point, it was verified that a longer length of inlet pipe had no influence on the results, but only on the computational time.
Although the aim of this study is to correctly simulate the phenomena occurring at high speed in the suction side at low delivery pressure, a micro-shift in the gears within the manufacturing tolerances along the horizontal and vertical axes has been applied to obtain a more reasonable value on the fluid leakages. In particular, to consider the mean direction of the force acting on the rotors, the gear axes have been shifted towards the suction side and the distance between the axes has been reduced. Axial clearances have been disregarded in this analysis, since the gaps were compensated for by the presence of the balance plates. In fact, with this solution, the operating clearance between the side of the gears and the balance plate can be reduced up to a few microns [37], one order of magnitude lower than the tooth tip clearances. The simulation of the lateral leakage passageways would have generated a significant increment in the total number of cells, with a negligible effect on the calculated flow rate.
To ensure mesh continuity between the gears, a gap was intentionally maintained between the tooth flanks, where the contact points should exist (see Figure 2). However, since the study was performed at very low delivery pressure (about 10 bar) with respect to the maximum operating pressure, this additional leakage did not significantly affect the delivered flow rate of the pump.
The mesh of the rotating volumes was built with the external gear template that generated a structured hexahedral grid. While rotating, the number of cells in the radial direction remains unchanged and the mesh is compressed when a tooth belonging to the opposite gear enters the tooth space. The outermost layer of the cells is allowed to slide with respect to the housing and the grid of the opposite gear. The inlet and delivery volumes were meshed using a general mesh generator that created an unstructured Cartesian grid composed of cubic elements. The mesh was locally refined in the grooves and in the peripheral channels. Finally, the grid of the inlet duct was created with a specific mesh generator for cylindrical geometries. A 3D view of the mesh is shown in Figure 4.
For the simulation of aeration and cavitation, the transients for air release and dissolution may have an influence [38] and SimericsMP+ allows the consideration of these transients [39]. However, the uncertainty on the amount of total air and on the values of the time constants makes the use of the most detailed model questionable. As a result, the fluid model Equilibrium Dissolved Gas was selected instead. The total volume fraction of air used in the simulation was 6%. Such a percentage was selected because it proved to be a good starting value, although it was obtained from tunings on a different test rig [32]. No turbulence model was applied since previous studies on fluid power pumps demonstrated the negligible effects on the simulated results, with a variation lower than 1% on the delivered flow rate, due to the high viscosity of the hydraulic oils [31,33,40]. On the other hand, in the present pump, the Reynolds number calculated at the inlet port at 6000 rpm with the fluid used for the validation was about 2500. Considering that up to about 2300 the regime can be considered laminar [41], and that the turbulence regime is considered fully developed above 4000, it is reasonable that the effect of the turbulence model could be negligible.
The same fluid properties and model settings were used for all the simulations and pump layouts presented in this paper.
The software discretizes the governing equations with the finite volume method. More details can be found in [42]. In the present analysis, the first-order upwind interpolation scheme was used, while the SIMPLE-S method was employed for the pressure–velocity coupling. As boundary conditions, pressures were imposed at the two ports (Figure 3). Transient simulations were performed, and the moving average of the delivery flow rate calculated over a shaft revolution was monitored. The steady-state condition was considered reached when the difference between the mean flow rates calculated in two consecutive revolutions became lower than 1%. Starting from a new simulation, usually 3–4 revolutions are necessary to achieve the steady-state condition. However, a couple of revolutions might be enough if the proper initial conditions are set, namely the results from a previous simulation performed at a close operating point.
3.2. Model Optimization
As far as the total number of cells is concerned, it was found that an increase from 0.5 to 1.6 million resulted in a variation of less than 0.5% in the calculated flow rate. Hence, the total number of cells of around 1 million is usually sufficient for this type of analysis. Not having found a significant difference in the steady-state flow rate to justify the adoption of a certain number of elements rather than another, a comparison of the pressure in a chamber as the number of cells varies was made (Figure 5). From this figure it is evident how the two cases with 500,000 and 800,000 cells present a different trend on the pressure in the chamber compared to the others shown, and the case with 1 million cells represents the best trade-off.
To determine the residual and angular step for the best trade-off between the computational time and accuracy, the tests listed in Table 2 were performed. The residual drop defined in SimericsMP+ is the difference between the natural logarithm of the residual at the n-th iteration and the maximum residual at all previous iterations from 1 to n − 1. The volumetric efficiency is defined as the ratio between the calculated and theoretical flow rates. For confidentiality reasons, it is not possible to provide the speed and delivery pressure used in these tests.
The CPU time is expressed in hours per shaft revolution and was obtained on a workstation with a 2.90 GHz 24-core Intel Xeon Platinum 8268 processor. It can be observed that using a residual of 0.1 leads to a significant underestimation of the volumetric efficiency, while with a residual of 0.01 the reduction in the angular step does not result in any improvement to the flow rate, but it only increases the computational time. Therefore, the simulations were performed with an angular step of 1 degree and a residual drop of 0.01. With these settings convergence is usually achieved with 50–70 iterations.
The helical teeth type requires a higher number of layers axially in the rotor domain than the spur gear type. This increase is not necessary to improve the accuracy, but to avoid problems with the convergence. In fact, in order to accurately reproduce the helical shape, a sufficient number of cell layers must be present, otherwise an unrealistic stepped pressure distribution is obtained between the flanks in the gears. Based on these analyses, 720 cells in the circumferential direction, 11 in the radial, and 50 in the axial were set up for each rotor. It should be noted that in a straight-teeth pump, 12 cells in the axial direction are sufficient. Table 3 presents the details on the number of cells used in the helical profile pump model.
4. Test Rig Layout
The experimental tests were carried out at the Casappa SpA laboratory. The hydraulic layout of the test rig is presented in Figure 6, along with a photograph in Figure 7. Two Casappa MVP60 axial piston pumps are driven by a variable-speed electric motor. The pressure limiters for both pumps are used only as safety devices, as their settings are sufficiently high to ensure the units operate at maximum displacement during normal operating conditions.
The PU1 pump feeds a Casappa PHM 20 fixed-displacement external gear motor (MO), which drives the pump being tested. This solution allows for working at a speed greater than what the electric motor in the test rig can impose. The only resistance on the delivery port in the pump being tested is due to the filter and the flow meter F1. The pump labelled PU2, together with the preloaded check valve, is used to control the inlet pressure of the pump being tested. As the flow rate delivered by the pump PU2 remains always slightly higher than the flow rate drawn by the pump being tested, there is a continuous discharge of excess flow through the check valve, which enforces the cracking pressure upstream. By means of a manual restrictor R, the suction pressure can be reduced to the desired value, measured by the transducer P4. The details of the transducers are listed in Table 4. The tests were performed with an ISO VG46 oil at the temperature of 50 °C. The off-line oil conditioning system consists of an auxiliary pump that continuously recirculates the oil from the reservoir through a heat exchanger. For temperature regulation, a PLC-controlled thermostatic valve maintains the desired temperature with an accuracy of ±2 °C. The testing procedure consists of imposing an angular speed value and progressively decreasing the flow area of the variable restrictor R in incremental steps. For each value on the inlet pressure measured by the transducer P4, the flow rate was recorded.
5. Results and Discussion
5.1. Steady-State Characteristics
The results from the steady-state tests at three angular speeds are reported in Figure 8 for the helical gear pump. For confidentiality reasons, the experimental and simulated flow rate values are each normalized with respect to their respective maximum values, so that level 1 corresponds to the maximum flow rate condition, i.e., complete filling of the inter-teeth volumes. For the same reason, the absolute values on the inlet pressure are not provided, however the scales corresponding to the three tested velocities are the same.
It can be observed that, at low speed, for high inlet pressure values the delivered flow rate is almost insensitive to the flow area of the restrictor, while a noticeable reduction due to incomplete filling occurs at low pressure levels. Furthermore, it is evident that the inlet pressure at which the flow rate begins to decrease is incrementally increased as the pump speed increases. This behavior can be explained considering that, with equal pressure measured at the inlet port, the higher speed implies a higher energy expended by the fluid to enter the rotating chambers. The model can predict with good accuracy the critical suction pressure below which incomplete filling occurs. Moreover, the change in the slope visible at 4500 rpm and at 6000 rpm, before the most decisive drop, is correctly reproduced. In general, the shape of the simulated curve reproduces the experimental trend very well. Regarding the accuracy of the comparison, two aspects should be considered. As demonstrated in a previous study [33], the experimental data could be affected by a random variation in the oil aeration conditions that could slightly modify the point corresponding to the change in slope. Moreover, the simulated data are influenced by the choice of the percentage of total air, as shown in [31]. It is likely that a fine tuning of the percentage of air in the model could lead to a reduction of the error, however this procedure requires many weeks of calculation without leading to results of particular interest, because in this way the evaluation of the predictive capacity of the model is lost, if the result is forced regarding the experimental data.
5.2. Evolution of the Free Air Fraction
The Figure 9 provides a visual representation of the air release occurring in the meshing region on the suction side of the helical gear pump at operating point 1, indicated in Figure 8. The cut plot for the total gas volume fraction is taken in the midplane of the gears. Due to the rapid increase in volume, a massive gas phase build-up is observed in the chambers of both gears at 0 degrees.
At 6 degrees, the gas fraction inside the chamber formed between tooth “a” and “b” in the driver gear gradually decreases for the following reasons:
- The derivative of the chamber volume becomes zero as tooth “c” completely exits the space between “a” and “b”;
- The connection area between the chamber and the suction volume has become quite large, since the distance between the tips of tooth “b” and “c” has significantly increased;
- The chamber becomes favorably oriented in the direction of the incoming flow.
At 12 degrees the gaseous phase is only present behind the trailing flank of tooth “b”, while at 18 degrees the chamber is completely filled. Similarly, at 12 degrees, the chamber between tooth “c” and “d” in the driven gear is nearly empty due to the rapid volume increase and the small flow area. The oil enters the chamber starting from the lower radius (24 degrees), where the peripheral velocity is smaller, and also radially due to the advantageous orientation of the chamber in relation to the inlet jet. At 30 degrees the air fraction is located solely behind the tip of tooth “c”.
At operating point 1 the delivered flow rate is very close to its maximum value due to the high inlet pressure, which allows for the recovery of the missing oil volume in the inter-teeth spaces before it leaves the suction side. Consequently, the local formation of the gaseous phase in the meshing region does not significantly affect the overall pump performance. However, if the inlet pressure is further decreased, the chambers remain partially empty until they connect with the delivery volume. In Figure 10, the gas volume fraction is illustrated for the incomplete filling scenario (referred to as point 2 in Figure 8). When the chambers are isolated, the centrifugal force pushes the liquid phase outwards, causing the gas fraction to be confined in the innermost part of the gears.
In Figure 11, the pressure distribution is shown, with the actual values on the color scale omitted for confidentiality reasons. In regard to the suction volume, the meshing region and the area behind the trailing flank of the teeth exhibit the lowest pressure levels (indicated by dark blue), while an overpressure is observed in front of the leading flank. In regard to the isolated chambers, the pressure level remains low as the leakage at the tooth tip and the flow through the peripheral channels are insufficient to compensate for the missing oil volume. Consequently, when the chambers are directly connected to the delivery volume, they experience a sudden increase in pressure. This backflow is responsible for the characteristic high-pressure ripple and noise observed when incomplete filling conditions occur. Since the primary aim of the developed model is to evaluate incomplete filling, the entire delivery line has not been simulated to reduce the computational time. Hence, a reliable estimation of the pressure ripple cannot be provided. However, in reference [43], an increment in the pressure pulsation in a gear machine during the condition of incomplete filling can be appreciated.
5.3. Spur Gear Pump Type A
The findings from the standard spur gear pump (type A) are presented in Figure 12. Once again, the trend in the simulated data closely matches the experimental curves. Specifically, both the simulated and experimental tests indicate that at 3000 rpm the onset of incomplete filling begins with a small reduction in the flow rate, followed by a substantial and more pronounced reduction. At 4500 rpm, two different slopes are clearly visible. The error in the evaluation of the pressure at which incomplete filling begins is about 0.2 bar in the worst case (4500 rpm). Compared to the helical pump, the characteristic is flatter in the horizontal section, while there is no clear difference in the position of the section with the steepest slope. However, it is important to note that the casings in the two pumps are inevitably not identical, making a rigorous comparison between them challenging. However, what is crucial is that the behavior at 6000 rpm is accurately replicated for both pumps, while maintaining the same model settings, such as the aeration model and the amount of air considered.
5.4. Different Ratio Axial Width/Diameter for Spur Gear Types B and C
In pumps provided with rotors, the effect of the axial width and of the diameter on the filling capability has recently been studied. In [31], a study was performed on a gerotor pump. It was found that, at equal axial width, the filling was worsened by increasing the diameter, while at equal diameter, by increasing the axial width. A similar study with the same results was performed [32] on a vane pump. In both studies, the displacement of the pump was maintained as a constant by means of the modification of the eccentricity. Based on the outcomes of such analyses, it is interesting to analyze the combined effect of the diameter reduction and of the axial width increase, and vice versa. In fact, in external gear machines, the displacement increases both with the diameter and with the width of the rotors, therefore the same displacement can be obtained with different combinations of these two parameters.
Two new gearsets, named B and C, were designed and simulated. Type B has a lower external diameter with a higher axial thickness, and vice versa for type C. The superposition of the rotating fluid domains relative to type A, B, and C is reported in Figure 13. The maximum variation in the geometric parameters is limited by the physical constraints; however, an appreciable different aspect ratio was obtained between types B and C.
The constraints adopted for these alternative designs were:
- External gear diameter +/− 5%;
- Gear inter-axis +/− 5%;
- The same number of teeth;
- The same displacement.
To be consistent across the models, the silencing grooves on the thrust plates were modified, as well as the geometry of the inlet volume (Figure 14).
The modification of the external diameter and axial width of the gears also affects the shape of the inlet volume. In order to not generate any restrictions during the suction phase, the minimum flow area and the rotor–inlet interface area were monitored. The first one represents the maximum restriction the flow encounters in the inlet channel, while the second one is the interface area connecting each tooth space volume with the inlet volume. A visual representation of these two surfaces is depicted in Figure 15.
To ensure that the leakages did not influence the results, the radial clearance between the gears and the casing was maintained as a constant, as well as the micro-positioning of the rotors. Table 5 summarizes the main control variables (see also Figure 2).
The pumps were simulated at a constant inlet pressure and different speeds. For each rotational speed, a slight adjustment of the boundary conditions was necessary to maintain the monitoring point at a constant inlet pressure.
The results of the simulations are reported in Figure 16. From this figure, it is possible to observe a correlation between the volumetric efficiency and the gears’ axial width/external diameter ratio. To ensure that the results were not influenced by even the slightest variation in the displacement between the pumps, the comparison was made in terms of the volumetric efficiency.
It is evident that for all the speeds analyzed, the curves follow the same progression for the three configurations simulated, but type C with a higher diameter achieves a higher efficiency. The results here reported suggest that in the context of the designs explored for alternative gearing pairs, the lower axial thickness to be filled in type C is a more important beneficial aspect, despite the slightly higher peripheral speed of the tooth tips.
5.5. Increment in the Diameter of the Inlet Port for Spur Gear Type D
Another type of study concerned the influence of the inlet port diameter. It is well known that, in general, in a positive displacement pump an increase in the flow area between the inlet and the variable chambers, the latter in the specific case of a spur gear represented by the inter-teeth volumes, implies a reduction in the pressure drop and filling improvement. However, it is possible in some cases that the improvement could be negligible, or the effect could even be a worsening of the filling, as in the vane pump studied in [32], where the additional flow area generated a detrimental internal recirculation. In the case of a spur gear pump, another important aspect is the angular extension during which the inter-teeth chambers remain isolated. Such extension has an impact on the leakage flow through the tooth tips. In order to consider only the effect of the filling improvement without increasing the leakages, the inlet port was enlarged as much as possible without modifying the angular position according to which a chamber becomes isolated. The new configuration, called type D, was both manufactured and simulated. Figure 17 shows the grid for the new configuration contrasted with the original one. In addition to a significant increment in the inlet port size, the minimum flow area was also increased. The figure also shows the mesh refinement of the inlet volume in the region close to the rotors.
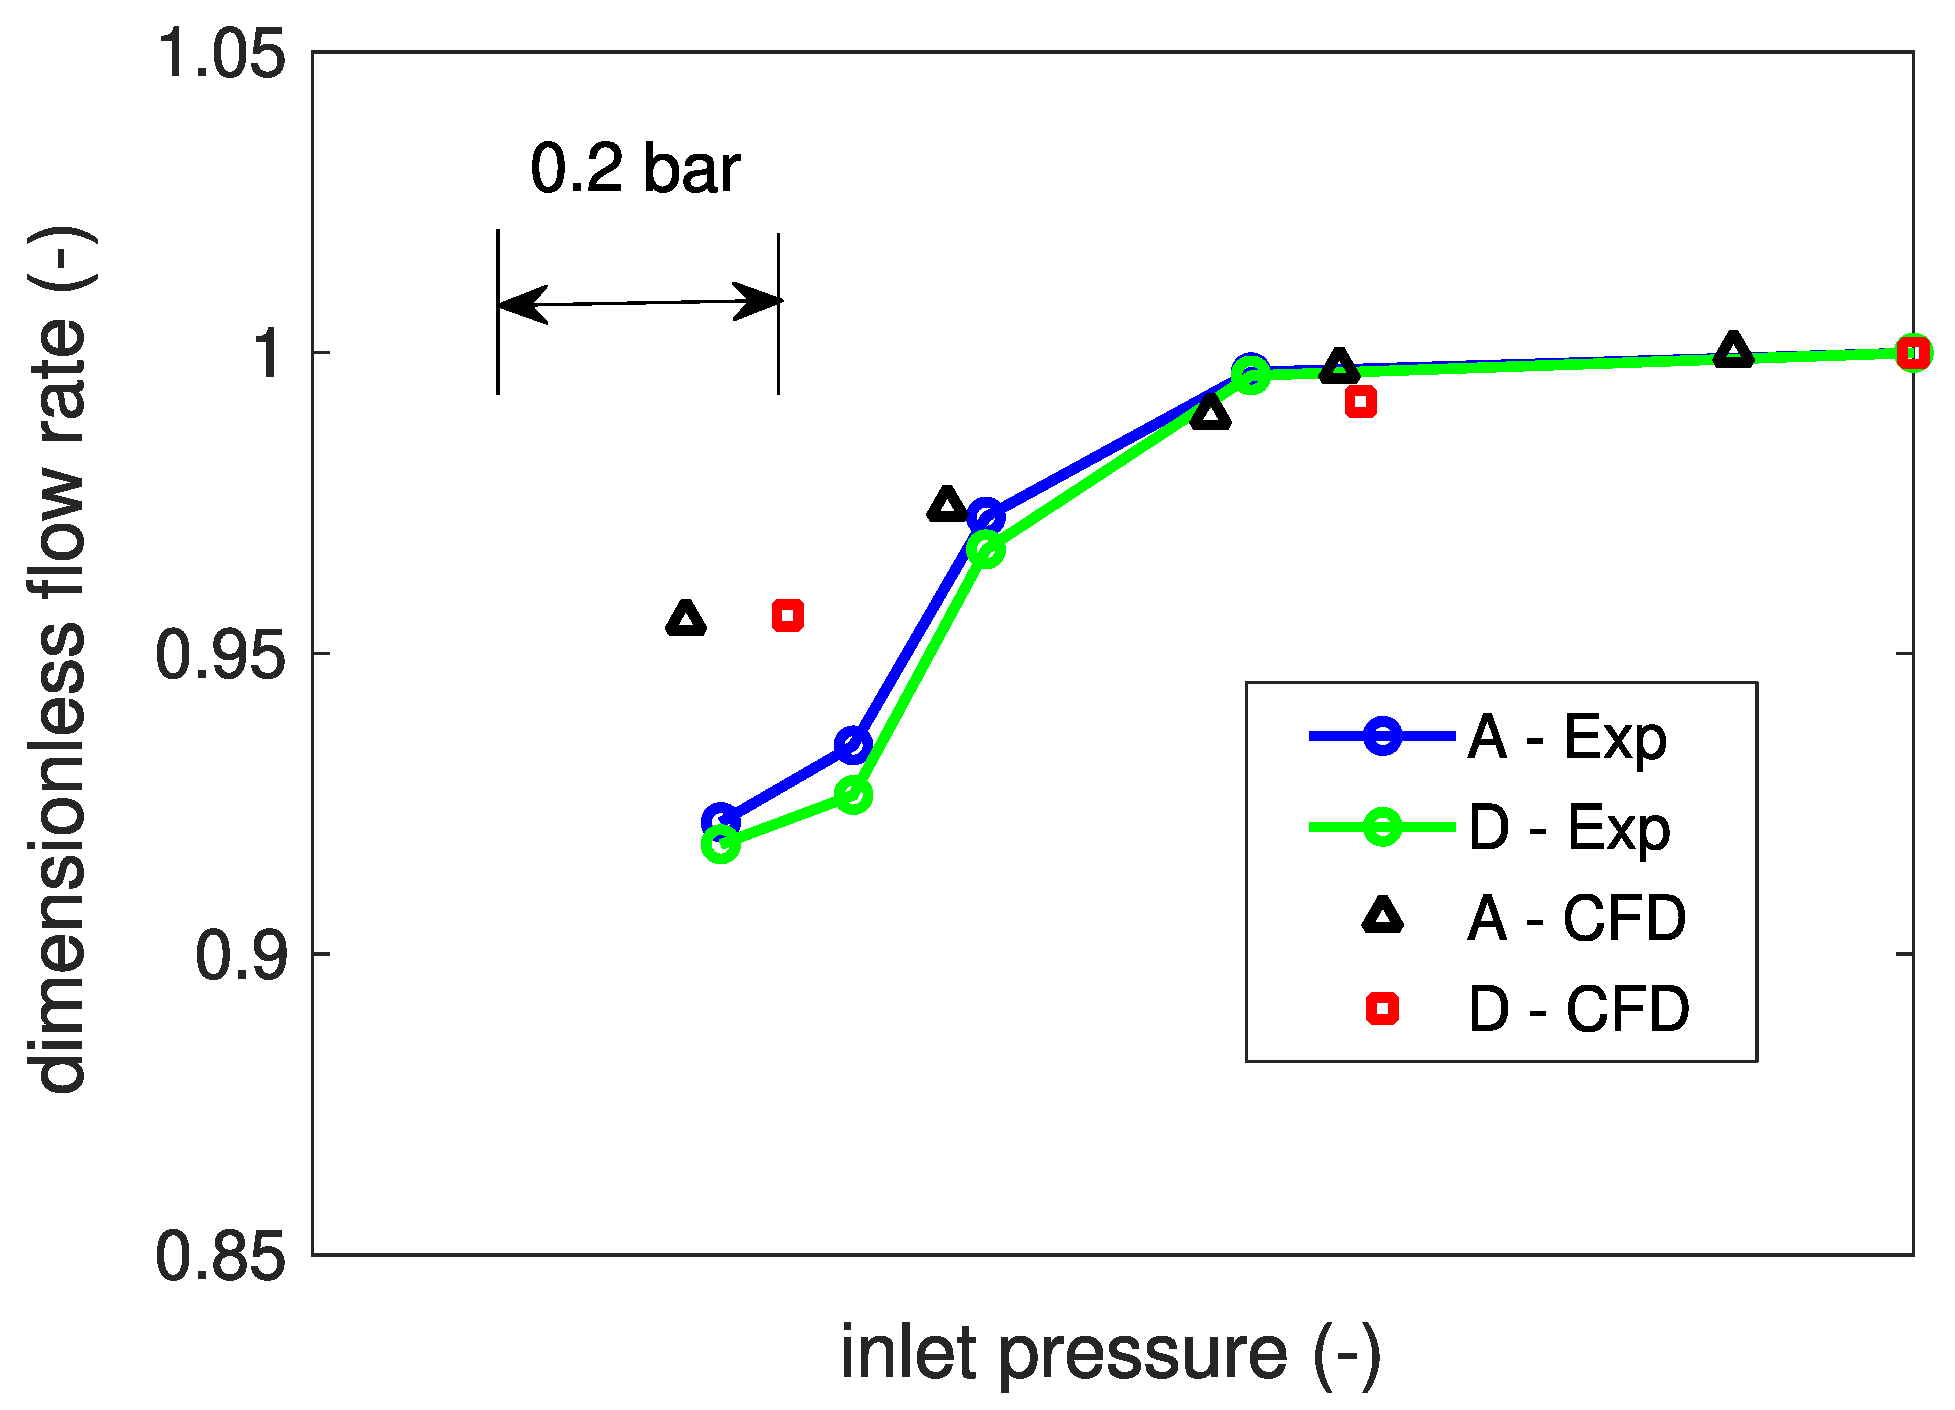
In Figure 18, the steady-state flow–pressure characteristic at 6000 rpm for the two different configurations is reported. Although the absolute value of the pressure is not reported for confidentiality reasons, the figure allows for quantifying the relative deviation between the curves. It is evident that a significant increment in the inlet port diameter is ineffective in improving the filling in this type of machine and the pump, from this point of view, is already optimized. It is worth noting that the CFD model provides consistent results, i.e., one could have come to the same conclusion relying only on the model without manufacturing the prototype. This is additional proof of the predictivity of the modelling approach.
6. Conclusions
The development of a fixed-displacement pump for direct connection to a variable-speed electric motor represents a challenge due to the risk of incomplete filling and cavitation. The proper geometry of the casing and of the gears must be optimized in order to minimize the pressure drops in the suction side. The evaluation of the effect on the filling from a geometric modification needs a model able to consider the real 3D shape of the volumes and their relative motion. In this paper, the reliability of the CFD model has been proved for both helical and spur gear pump prototypes. More specifically, the minimum suction pressure that still allows the complete filling of the chambers is estimated with good precision for the different prototypes. Additionally, it has been observed that the threshold suction pressure increases with the increase in speed. A significant difference between the helical and spur gear pump in terms of the suction pressure limit according to which the incomplete filling begins has not been found.
The different aspect ratio for the gears at equal pump displacement was analyzed. Higher efficiency was found by increasing the gear diameter; the better trend was confirmed for different angular speeds. The increment in the diameter of the suction port, at equal extension of the sealing region, did not lead to an appreciable improvement, and the outcomes from the models have been confirmed by the experimental tests. All the simulations were performed with the same fluid parameters.
Considering that an initial calibration phase is always required for any new model, the notable aspect of this study is that all the presented results were obtained using the same model configuration. The good agreement with the experimental measurements suggests that the predictive use of the model as a design tool can be trusted, even in scenarios involving incomplete filling.
Author Contributions
Conceptualization, M.R. (Massimo Rundo) and M.R. (Manuel Rigosi); Formal analysis, A.C. and S.B.; Methodology, A.C.; Software, A.C.; Supervision, M.R. (Massimo Rundo) and M.R. (Manuel Rigosi); Validation, A.C. and S.B.; Visualization, A.C. and M.R. (Massimo Rundo); Writing—original draft, M.R. (Massimo Rundo); Writing—review & editing, A.C., M.R. (Massimo Rundo), S.B. and M.R. (Manuel Rigosi). All authors have read and agreed to the published version of the manuscript.
Funding
This research received no external funding.
Institutional Review Board Statement
Not applicable.
Informed Consent Statement
Not applicable.
Data Availability Statement
For confidentiality reasons, data sharing is not applicable to this article.
Acknowledgments
The present work was performed within the framework of a research contract between the Dept. of Energy at the Politecnico di Torino and Casappa SpA. The authors acknowledge the permission to publish the present material.
Conflicts of Interest
The authors declare no conflict of interest.
References
- Ketelsen, S.; Padovani, D.; Andersen, T.O.; Ebbesen, M.K.; Schmidt, L. Classification and review of pump-controlled differential cylinder drives. Energies 2019, 12, 1293. [Google Scholar] [CrossRef]
- Qu, S.; Fassbender, D.; Vacca, A.; Busquets, E. A high-efficient solution for electro-hydraulic actuators with energy regeneration capability. Energy 2021, 216, 119291. [Google Scholar] [CrossRef]
- Bedotti, A.; Pastori, M.; Casoli, P. Modelling and energy comparison of system layouts for a hydraulic excavator. Energy Procedia 2018, 148, 26–33. [Google Scholar] [CrossRef]
- Casoli, P.; Scolari, F.; Minav, T.; Rundo, M. Comparative Energy Analysis of a Load Sensing System and a Zonal Hydraulics for a 9-Tonne Excavator. Actuators 2020, 9, 39. [Google Scholar] [CrossRef]
- Fresia, P.; Rundo, M.; Padovani, D.; Altare, G. Combined speed control and centralized power supply for hybrid energy-efficient mobile hydraulics. Autom. Constr. 2022, 140, 104337. [Google Scholar] [CrossRef]
- Padovani, D.; Ketelsen, S.; Schmidt, L. Downsizing the electric motors of energy-efficient self-contained electro-hydraulic systems by using hybrid technologies. In Proceedings of the BATH/ASME 2020 Symposium on Fluid Power and Motion Control, Virtual, Online, 9–11 September 2020. [Google Scholar] [CrossRef]
- Altare, G.; Padovani, D.; Nervegna, N. A Commercial Excavator: Analysis, Modelling and Simulation of the Hydraulic Circuit; SAE Technical Paper 2012-01-2040; SAE: Warrendale, PA, USA, 2012. [Google Scholar] [CrossRef]
- Altare, G.; Padovani, D.; Nervegna, N. A Close-up View of a Load Sensing “Hybrid” PDCV. Trans. Jpn. Fluid Power Syst. Soc. 2013, 44, 64–73. [Google Scholar] [CrossRef]
- Casoli, P.; Scolari, F.; Vescovini, C.M.; Mesturini, D.; Zannoni, F. Excavator hydraulic circuit solution to reduce dissipations and fuel consumption. In E3S Web of Conferences; EDP Sciences: Les Ulis, France, 2021; Volume 312. [Google Scholar] [CrossRef]
- Gaiola, A.; Zardin, B.; Casoli, P.; Borghi, M.; Mazzali, F.; Pintore, F.; Fiorati, S. The Hydraulic Power Generation and Transmission on Agricultural Tractors: Feasible architectures to reduce dissipation and fuel consumption-Part 2. In E3S Web of Conferences; EDP Sciences: Les Ulis, France, 2020; Volume 197. [Google Scholar] [CrossRef]
- Bedotti, A.; Campanini, F.; Pastori, M.; Riccò, L.; Casoli, P. Energy saving solutions for a hydraulic excavator. Energy Procedia 2017, 126, 1099–1106. [Google Scholar] [CrossRef]
- Sun, F.; Ji, H.; Yang, S.; Li, C. Numerical Investigation on Pairing Solutions of Non-Positive Displacement Pumps and Internal Gear Pump for High-Speed Design. Fluids 2023, 8, 178. [Google Scholar] [CrossRef]
- Rundo, M. Theoretical flow rate in crescent pumps. Simul. Model. Pract. Theory 2017, 71, 1–14. [Google Scholar] [CrossRef]
- Marinaro, G.; Frosina, E.; Senatore, A. A Numerical Analysis of an Innovative Flow Ripple Reduction Method for External Gear Pumps. Energies 2021, 14, 471. [Google Scholar] [CrossRef]
- Ivantysyn, J.; Ivantysynova, M. Hydrostatic Pumps and Motors; Akademia Books International: New Delhi, India, 2001. [Google Scholar]
- Ransegnola, T.; Zhao, X.; Vacca, A. A comparison of helical and spur external gear machines for fluid power applications: Design and optimization. Mech. Mach. Theory 2019, 142, 103604. [Google Scholar] [CrossRef]
- Zardin, B.; Natali, E.; Borghi, M. Evaluation of the Hydro—Mechanical Efficiency of External Gear Pumps. Energies 2019, 12, 2468. [Google Scholar] [CrossRef]
- Rituraj, R.; Vacca, A.; Rigosi, M. Modeling and validation of hydro-mechanical losses in pressure compensated external gear machines. Mech. Mach. Theory 2021, 161, 104310. [Google Scholar] [CrossRef]
- Zhao, X.; Vacca, A. Multi-domain simulation and dynamic analysis of the 3D loading and micromotion of continuous-contact helical gear pumps. Mech. Syst. Signal Process. 2022, 163, 108116. [Google Scholar] [CrossRef]
- Ransegnola, T.; Vacca, A. Virtual Design and Analysis of the Balancing Element of an External Gear Machine Considering Cavitation and Mixed Lubrication Effects. Int. J. Fluid Power 2023, 24, 77–98. [Google Scholar] [CrossRef]
- Mazzei, P.; Frosina, E.; Senatore, A. Helical Gear Pump: A Comparison between a Lumped Parameter and a Computational Fluid Dynamics-Based Approaches. Fluids 2023, 8, 193. [Google Scholar] [CrossRef]
- Orlandi, F.; Muzzioli, G.; Milani, M.; Paltrinieri, F.; Montorsi, L. Development of a Numerical Approach for the CFD Simulation of a Gear Pump under Actual Operating Conditions. Fluids 2023, 8, 244. [Google Scholar] [CrossRef]
- Qu, S.; Zappaterra, F.; Vacca, A.; Liu, Z.; Busquets, E. Experimental Verification of An Electro-Hydraulic Actuation System Driven by An Integrated Electro-Hydraulic Unit. Int. J. Fluid Power 2023, 24, 327–360. [Google Scholar] [CrossRef]
- Padovani, D.; Ketelsen, S.; Hagen, D.; Schmidt, L. A self-contained electro-hydraulic cylinder with passive load-holding capability. Energies 2019, 12, 292. [Google Scholar] [CrossRef]
- Paltrinieri, F.; Milani, M.; Montorsi, L. Testing the performance of an innovative high speed external gear pump as a reliable hydraulic power unit for automotive robotized transmissions. In AIP Conference Proceedings; AIP Publishing: Melville, NY, USA, 2019; Volume 2191. [Google Scholar] [CrossRef]
- Chao, Q.; Xu, Z.; Tao, J.; Liu, C.; Zhai, J. Cavitation in a high-speed aviation axial piston pump over a wide range of fluid temperatures. Proc. Inst. Mech. Eng. Part A J. Power Energy 2022, 236, 727–737. [Google Scholar] [CrossRef]
- Buono, D.; Cola, F.D.S.D.; Senatore, A.; Frosina, E.; Buccilli, G.; Harrison, J. Modelling Approach on a Gerotor Pump Working in Cavitation Conditions. Energy Procedia 2016, 101, 701–709. [Google Scholar] [CrossRef]
- Del Campo, D.; Castilla, R.; Raush, G.A.; Gamez Montero, P.J.; Codina, E. Numerical analysis of external gear pumps including cavitation. J. Fluids Eng. 2012, 134, 081105. [Google Scholar] [CrossRef]
- Frosina, E.; Senatore, A.; Rigosi, M. Study of a high-pressure external gear pump with a computational fluid dynamic modeling approach. Energies 2017, 10, 1113. [Google Scholar] [CrossRef]
- Mithun, M.-G.; Koukouvinis, P.; Karathanassis, I.K.; Gavaises, M. Numerical simulation of three-phase flow in an external gear pump using immersed boundary approach. Appl. Math. Model. 2019, 72, 682–699. [Google Scholar] [CrossRef]
- Altare, G.; Rundo, M. Computational Fluid Dynamics Analysis of Gerotor Lubricating Pumps at High-Speed: Geometric Features Influencing the Filling Capability. J. Fluids Eng. 2016, 138, 111101. [Google Scholar] [CrossRef]
- Rundo, M.; Altare, G.; Casoli, P. Simulation of the filling capability in vane pumps. Energies 2019, 12, 283. [Google Scholar] [CrossRef]
- Corvaglia, A.; Rundo, M.; Casoli, P.; Lettini, A. Evaluation of Tooth Space Pressure and Incomplete Filling in External Gear Pumps by Means of Three-Dimensional CFD Simulations. Energies 2021, 14, 342. [Google Scholar] [CrossRef]
- Borghi, M.; Zardin, B. Axial balance of external gear pumps and motors: Modelling and discussing the influence of elastohydrodynamic lubrication in the axial gap. In Proceedings of the ASME International Mechanical Engineering Congress and Exposition, Houston, TX, USA, 13–19 November 2015. [Google Scholar] [CrossRef]
- Torrent, M.; Gamez-Montero, P.J.; Codina, E. Motion Modelling of the Floating Bushing in an External Gear Pump Using Dimensional Analysis. Actuators 2023, 12, 338. [Google Scholar] [CrossRef]
- Vacca, A.; Guidetti, M. Modelling and experimental validation of external spur gear machines for fluid power applications. Simul. Model. Pract. Theory 2011, 19, 2007–2031. [Google Scholar] [CrossRef]
- Dhar, S.; Vacca, A.; Lettini, A. A novel fluid-structure-thermal interaction model for the analysis of the lateral lubricating gap flow in external gear machines. In Proceedings of the ASME/BATH 2013 Symposium on Fluid Power and Motion Control, Sarasota, FL, USA, 6–9 October 2013. [Google Scholar] [CrossRef]
- Rundo, M.; Squarcini, R.; Furno, F. Modelling of a Variable Displacement Lubricating Pump with Air Dissolution Dynamics. SAE Int. J. Engines 2018, 11, 111–126. [Google Scholar] [CrossRef]
- Stuppioni, U.; Suman, A.; Pinelli, M.; Blum, A. Computational fluid dynamics modeling of gaseous cavitation in lubricating vane pumps: An approach based on dimensional analysis. J. Fluids Eng. 2020, 142, 071206. [Google Scholar] [CrossRef]
- Rundo, M.; Altare, G. Lumped Parameter and Three-Dimensional Computational Fluid Dynamics Simulation of a Variable Displacement Vane Pump for Engine Lubrication. J. Fluids Eng. 2018, 140, 061101. [Google Scholar] [CrossRef]
- Schlichting, H.; Gersten, K. Onset of Turbulence (Stability Theory). In Boundary-Layer Theory; Springer: Berlin, Germany, 2016; pp. 415–416. [Google Scholar] [CrossRef]
- Ding, H.; Visser, F.C.; Jiang, Y.; Furmanczyk, M. Demonstration and validation of a 3D CFD simulation tool predicting pump performance and cavitation for industrial applications. J. Fluids Eng. 2011, 133, 011101. [Google Scholar] [CrossRef]
- Altare, G.; Rundo, M. Advances in simulation of gerotor pumps: An integrated approach. Proc. Inst. Mech. Eng. Part C J. Mech. Eng. Sci. 2017, 231, 1221–1236. [Google Scholar] [CrossRef]
Figure 1.
A 3D drawing of a helical gear pump (without the front cover), with two views of the balance plates.
Figure 1.
A 3D drawing of a helical gear pump (without the front cover), with two views of the balance plates.
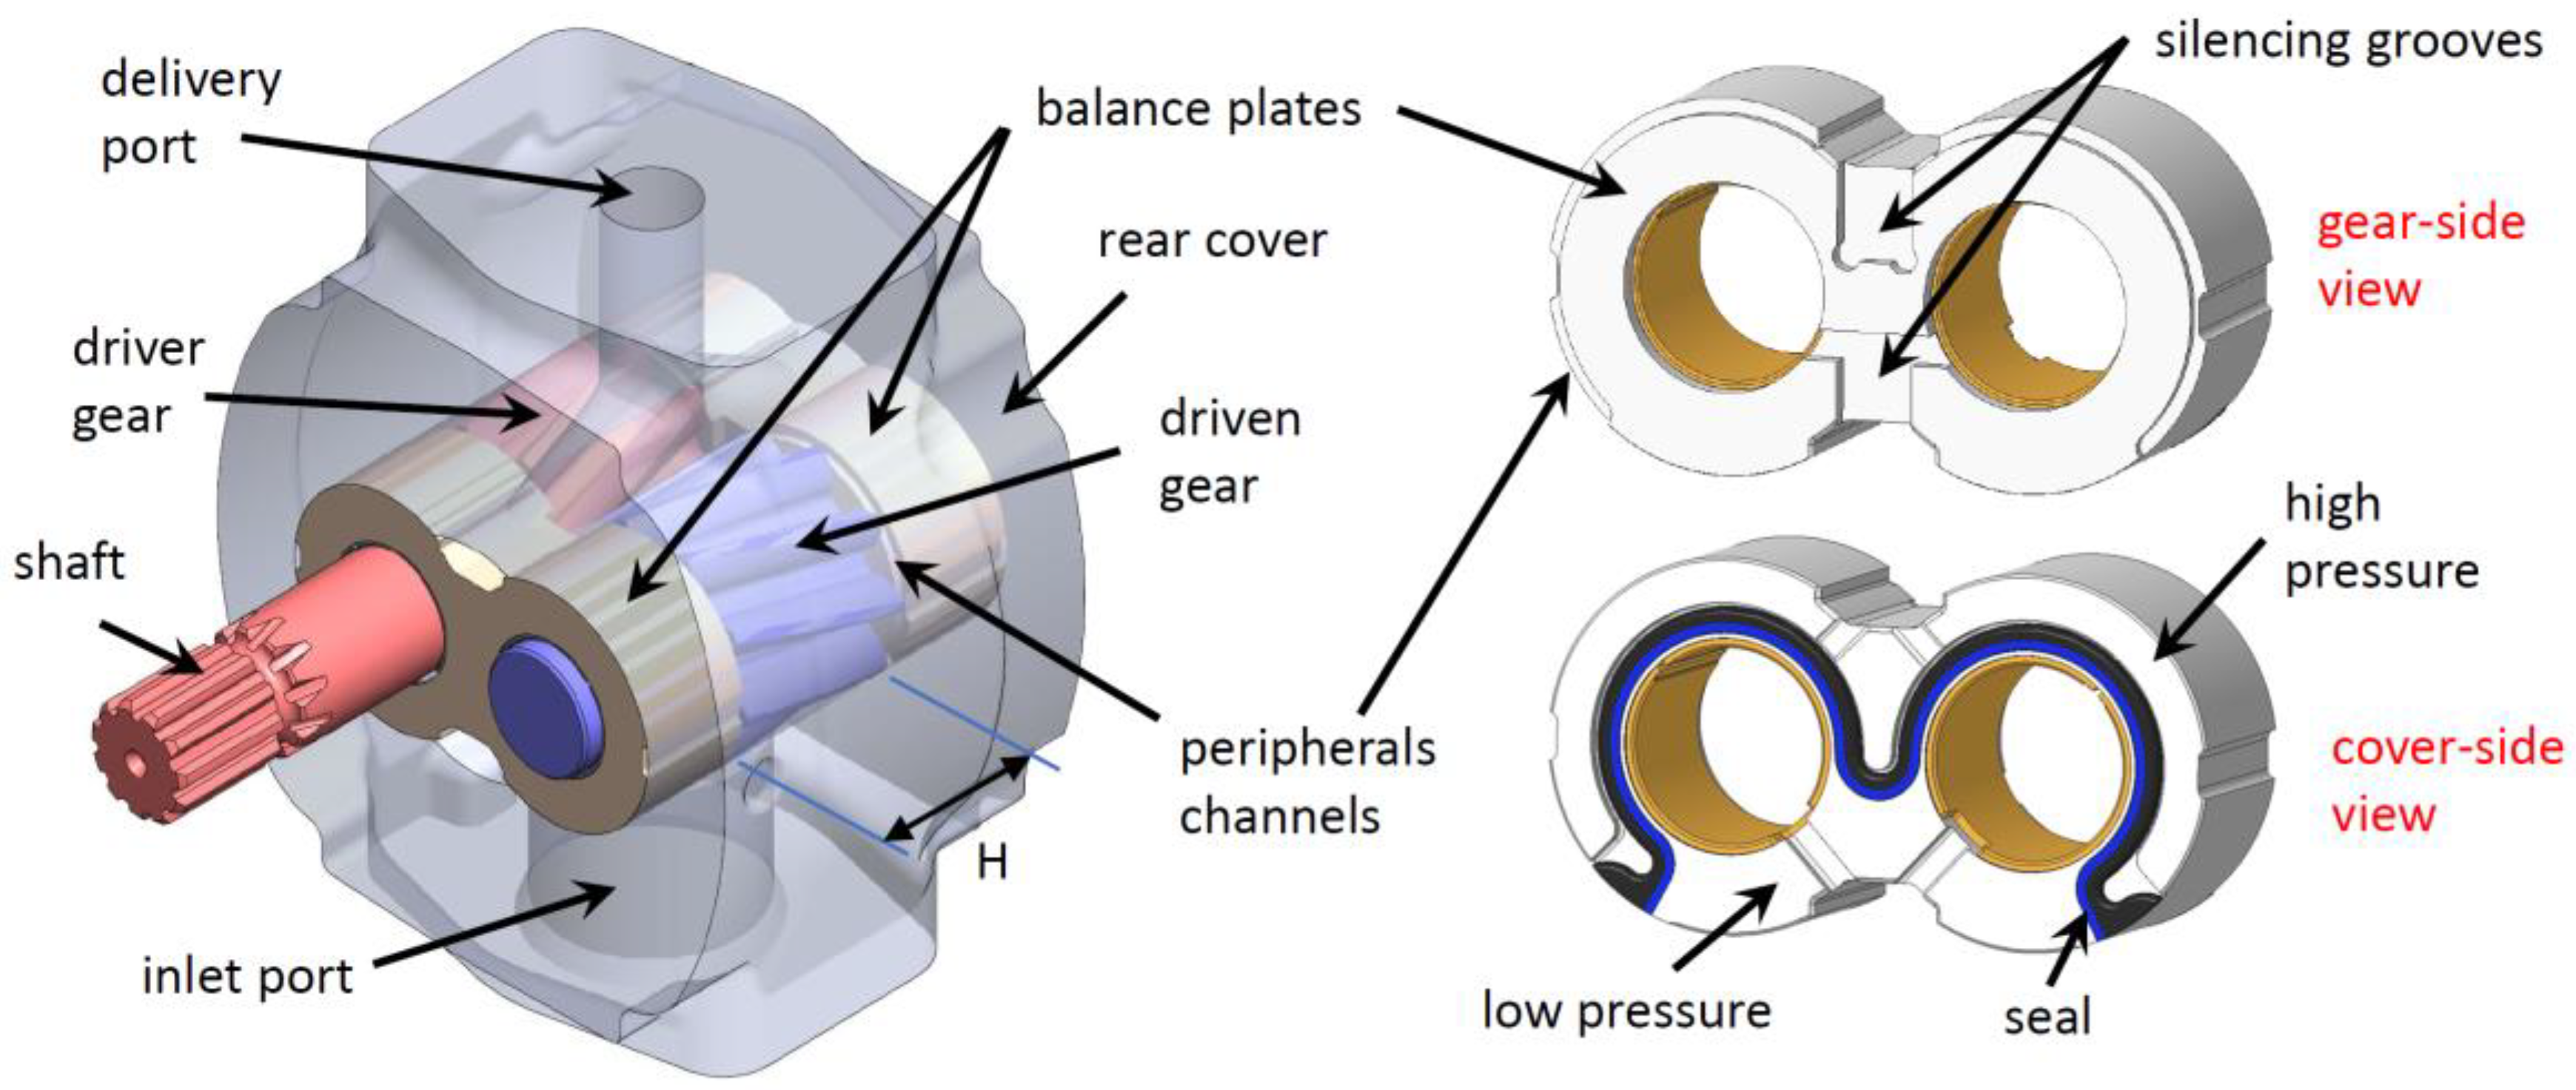
Figure 2.
Definition of the main geometric parameters of a gear pump (qualitative drawing).
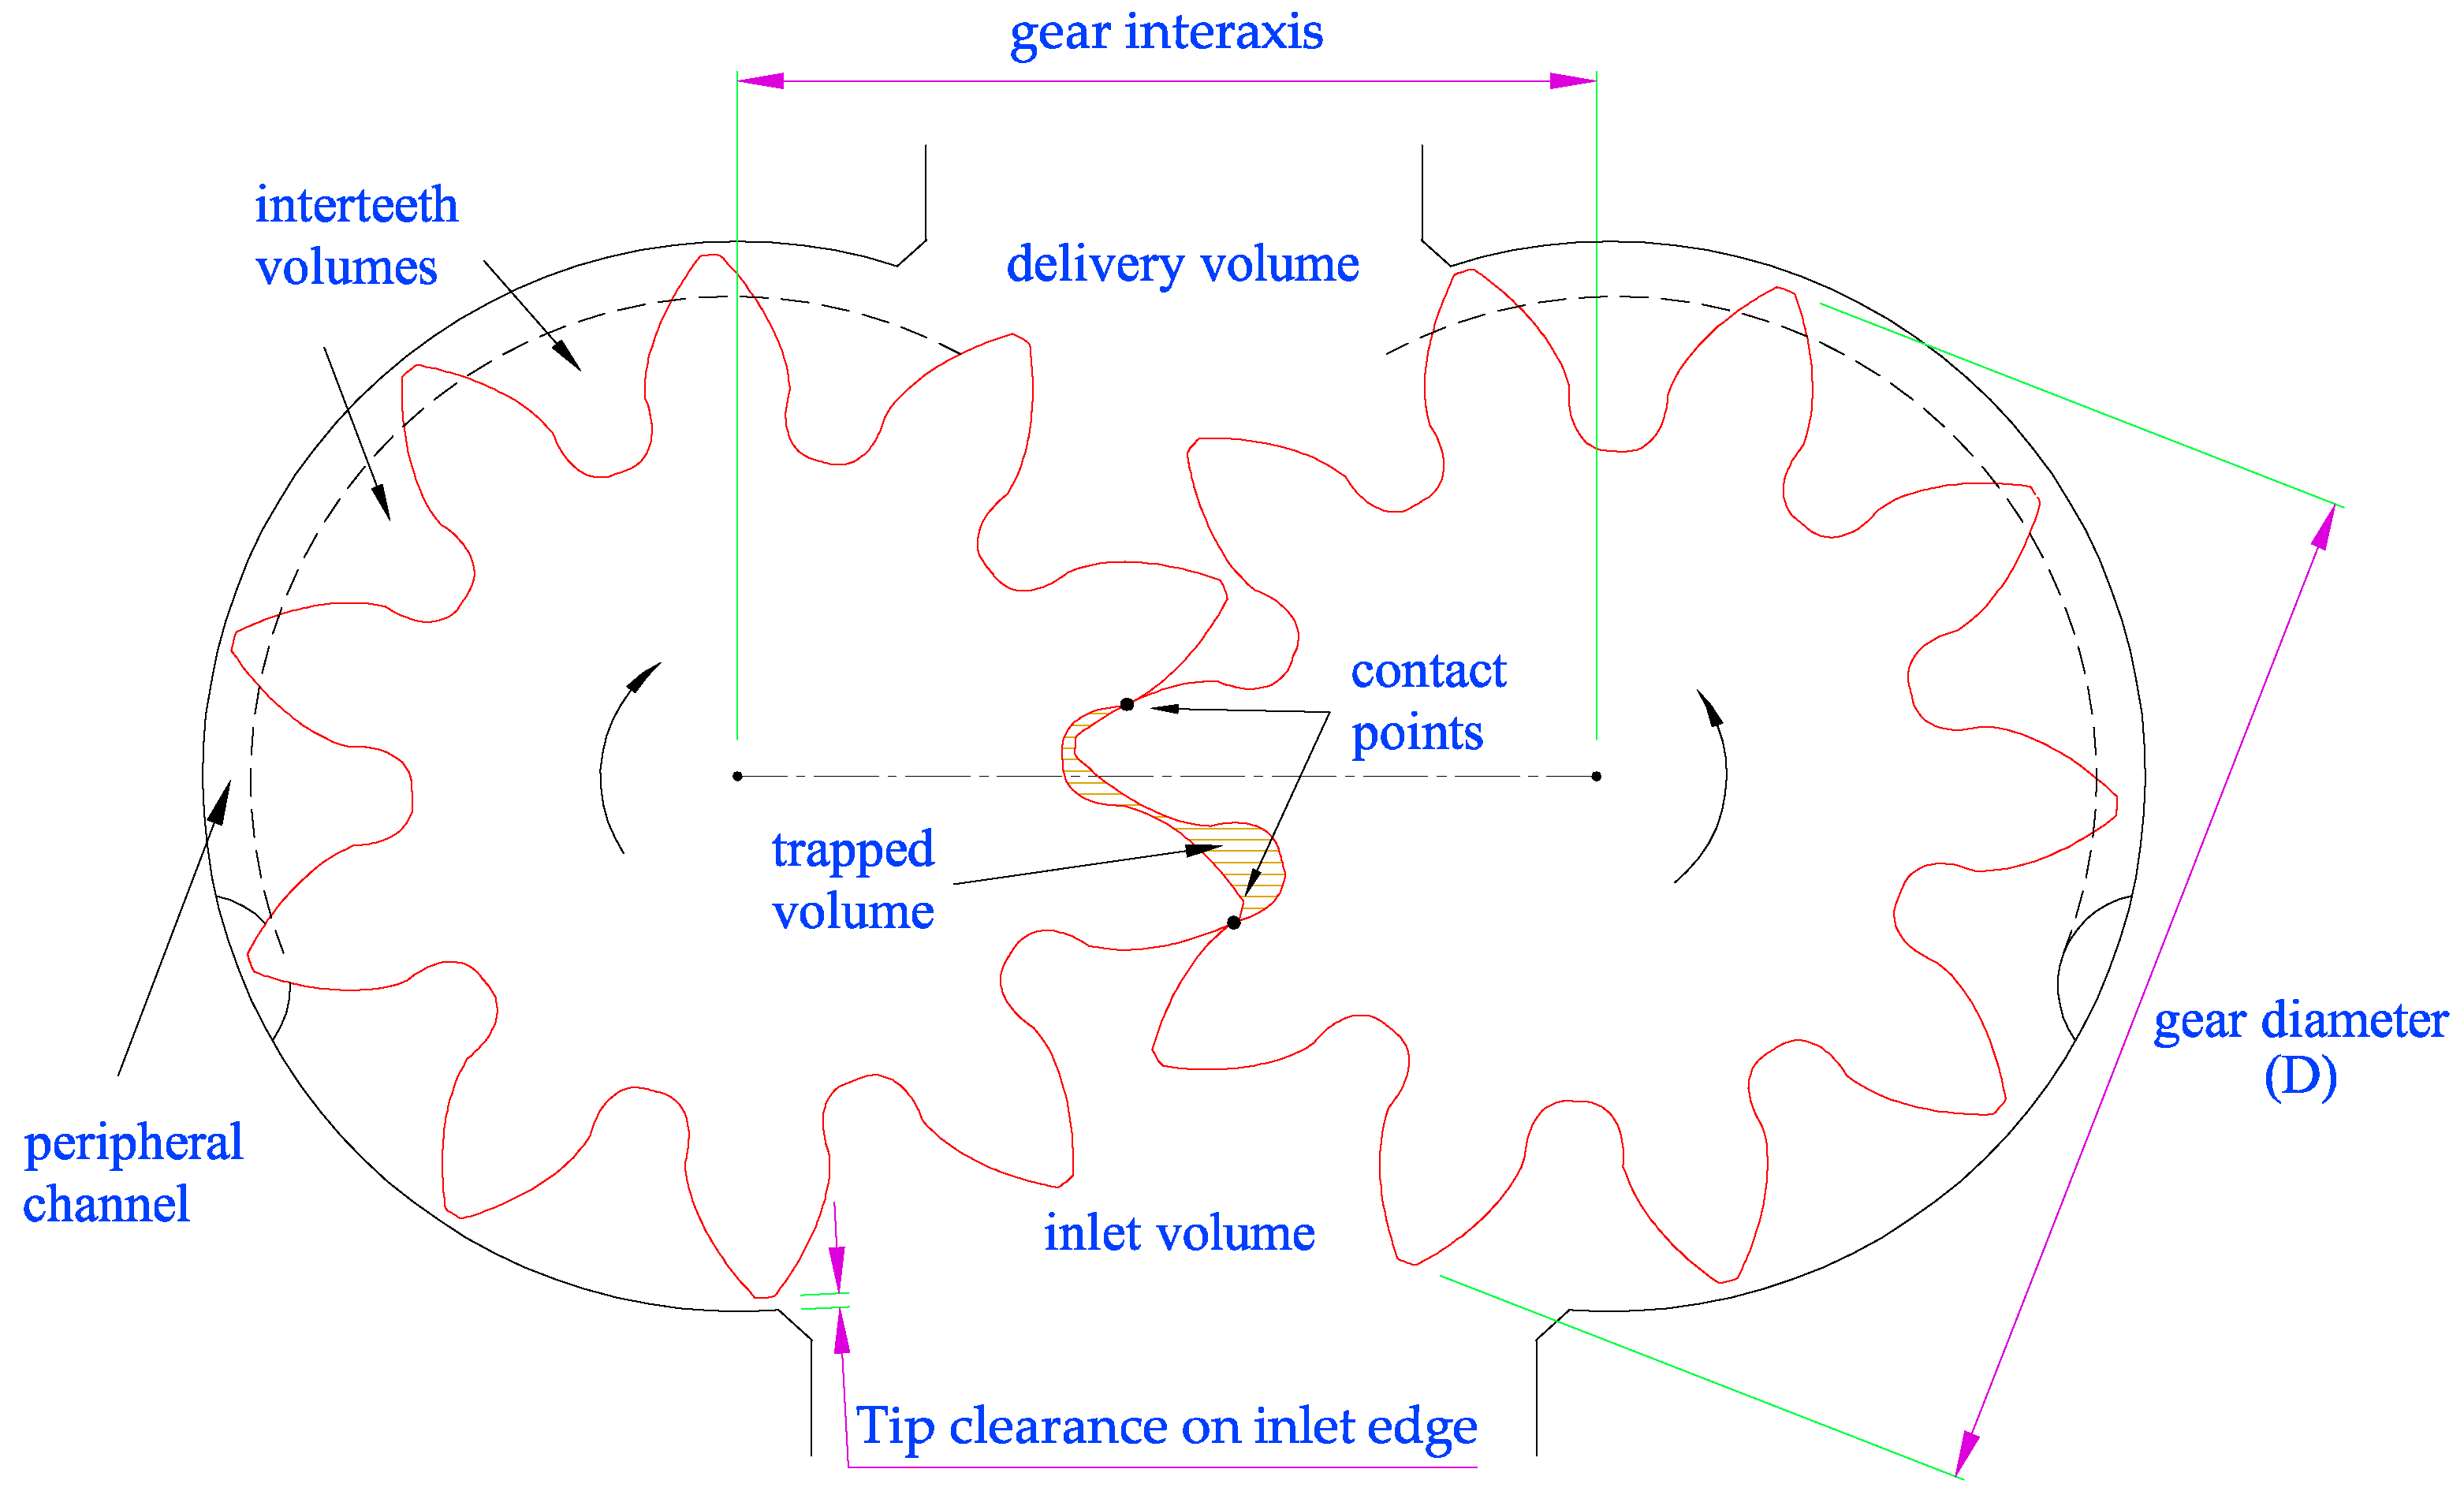
Figure 3.
Subdivision of the volumes and location of the inlet pressure transducer.

Figure 4.
View of the mesh of the variable volume chambers and of the inlet/outlet volumes.
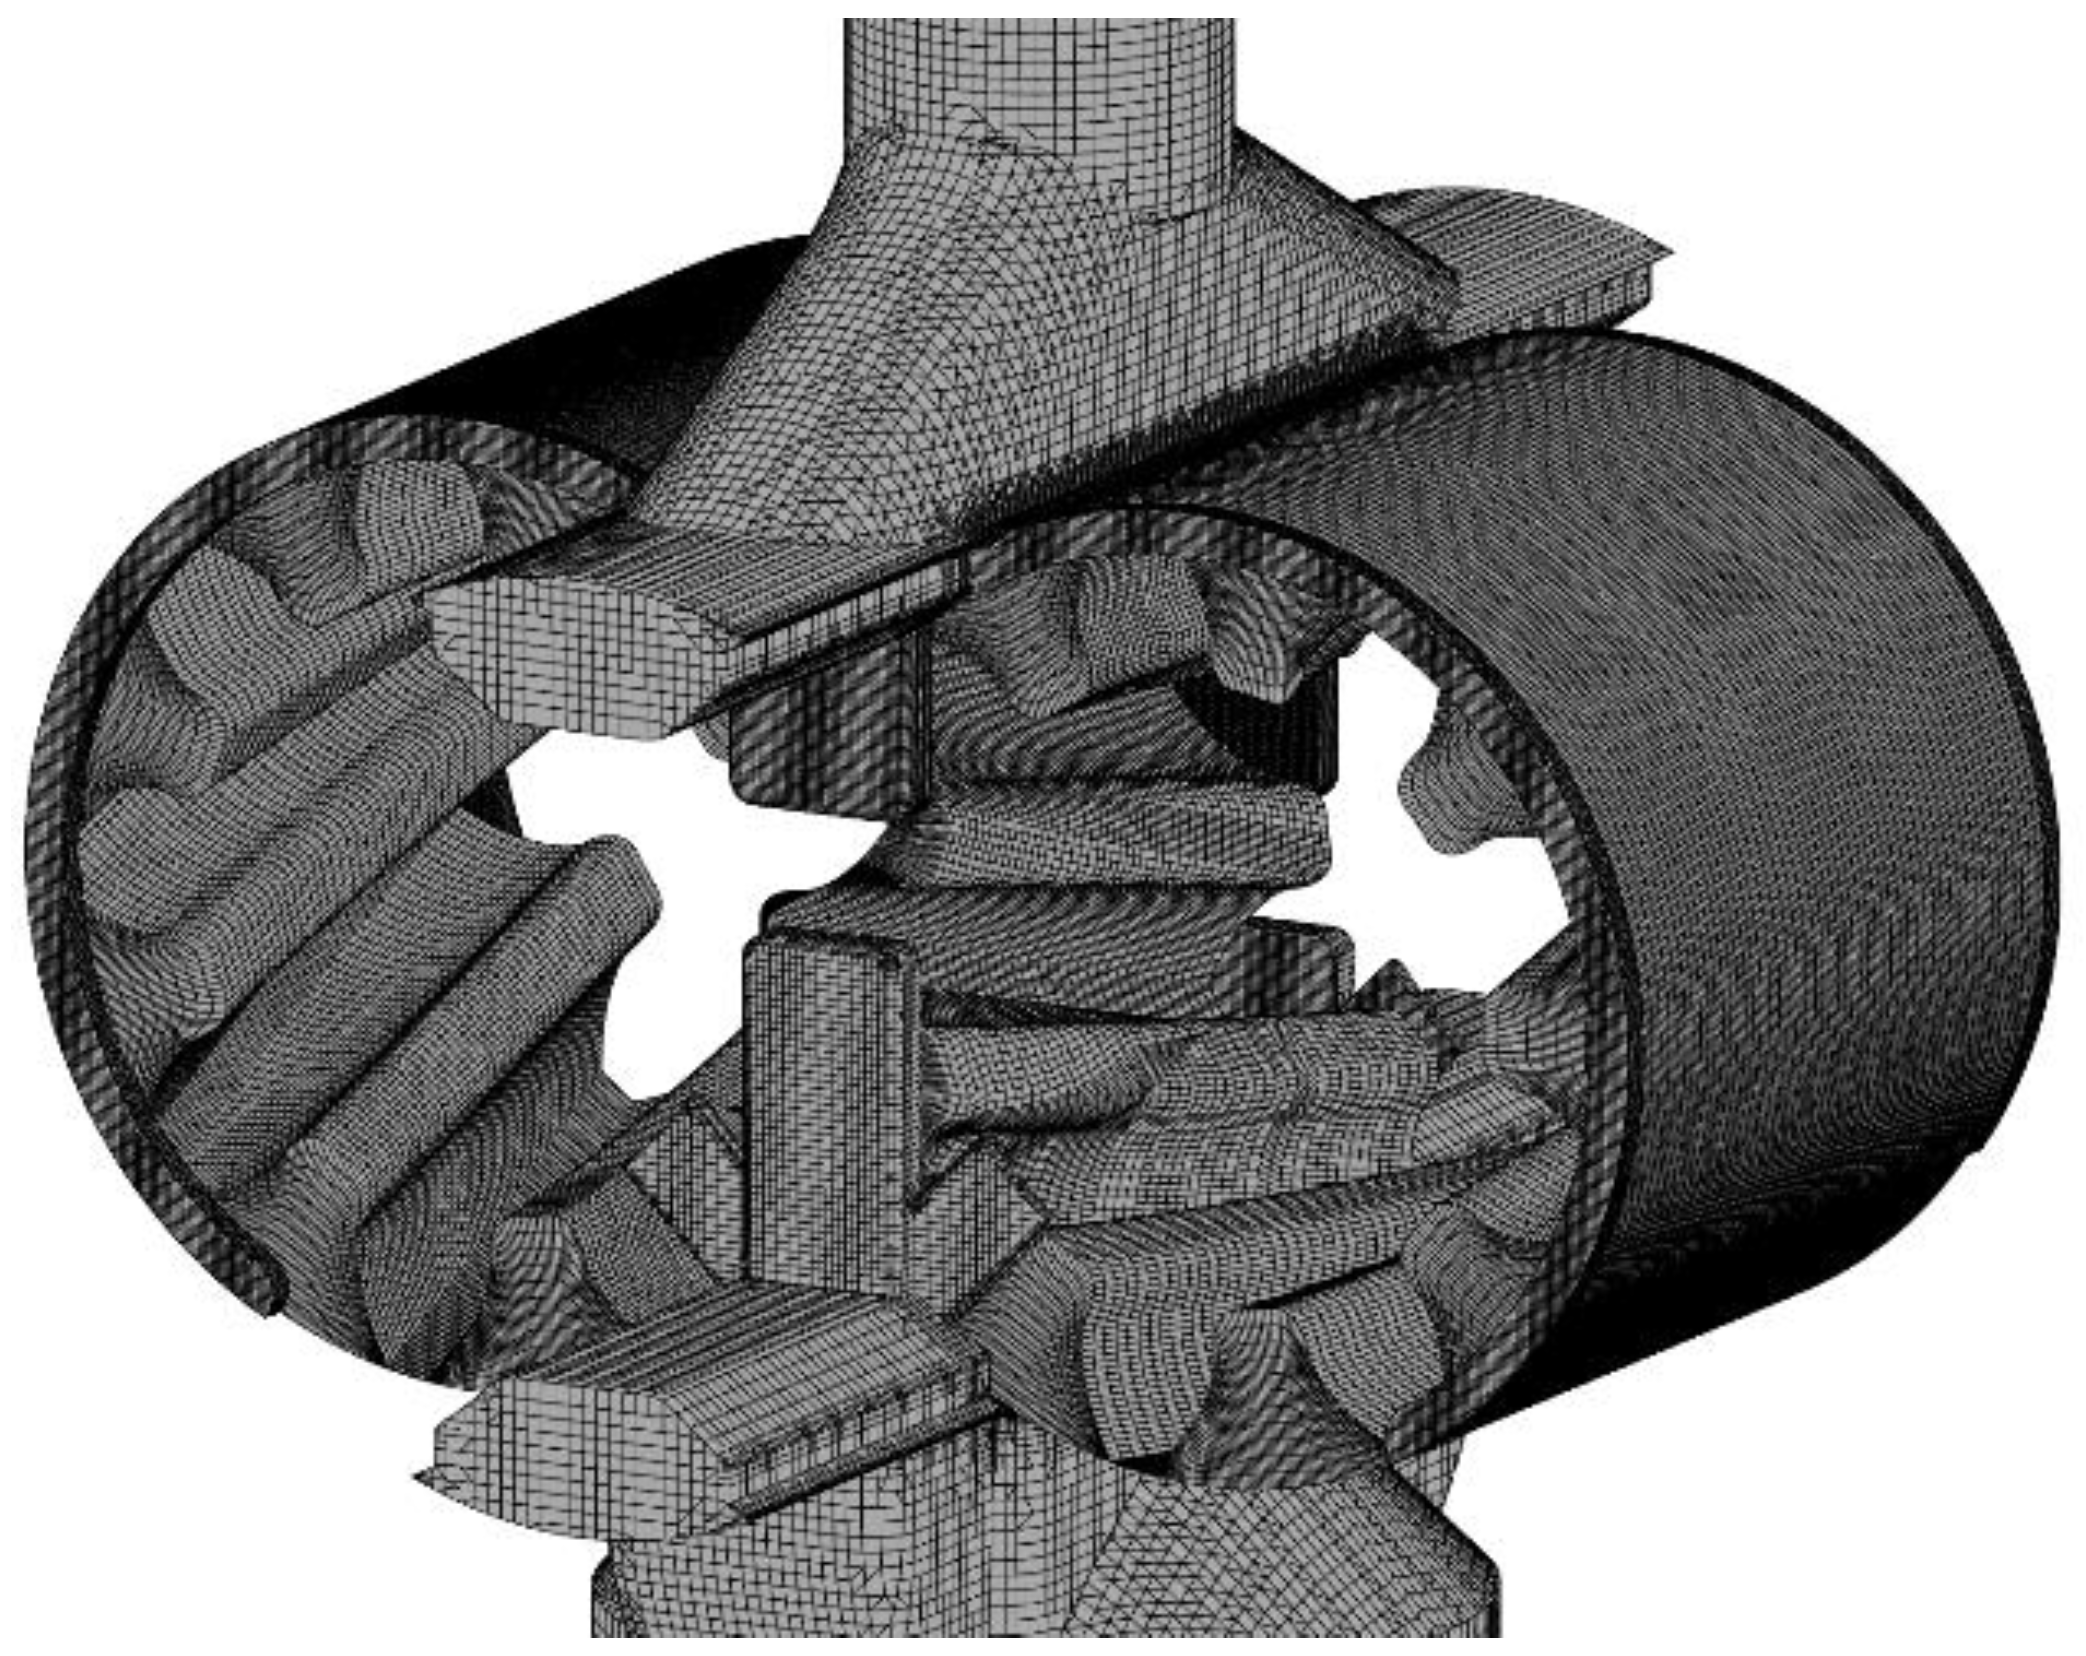
Figure 5.
Pressure in one of the inter-teeth volumes during the transition between the suction and delivery volumes.
Figure 5.
Pressure in one of the inter-teeth volumes during the transition between the suction and delivery volumes.
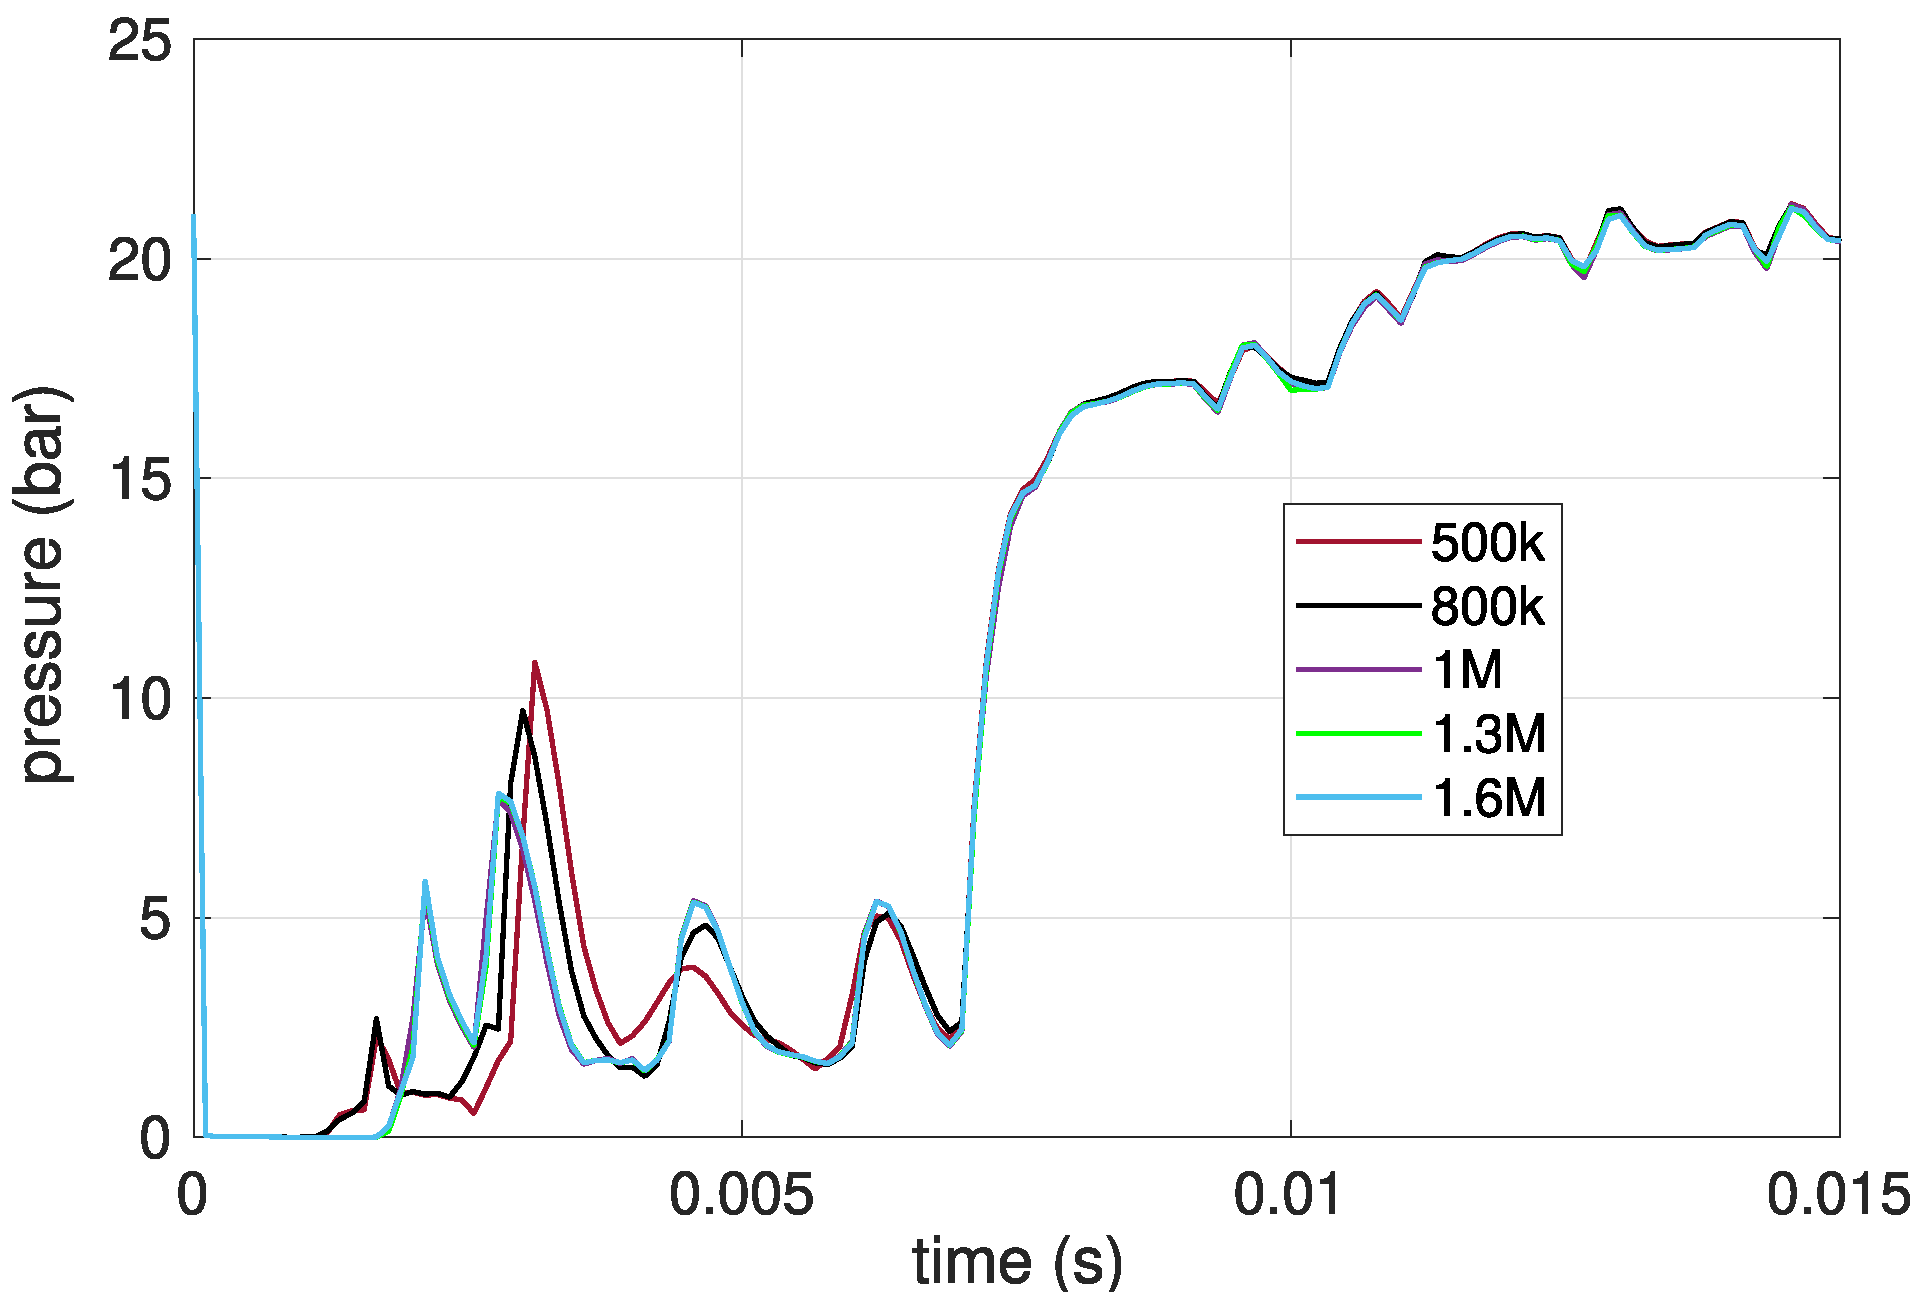
Figure 6.
Hydraulic scheme of the high-speed test rig.
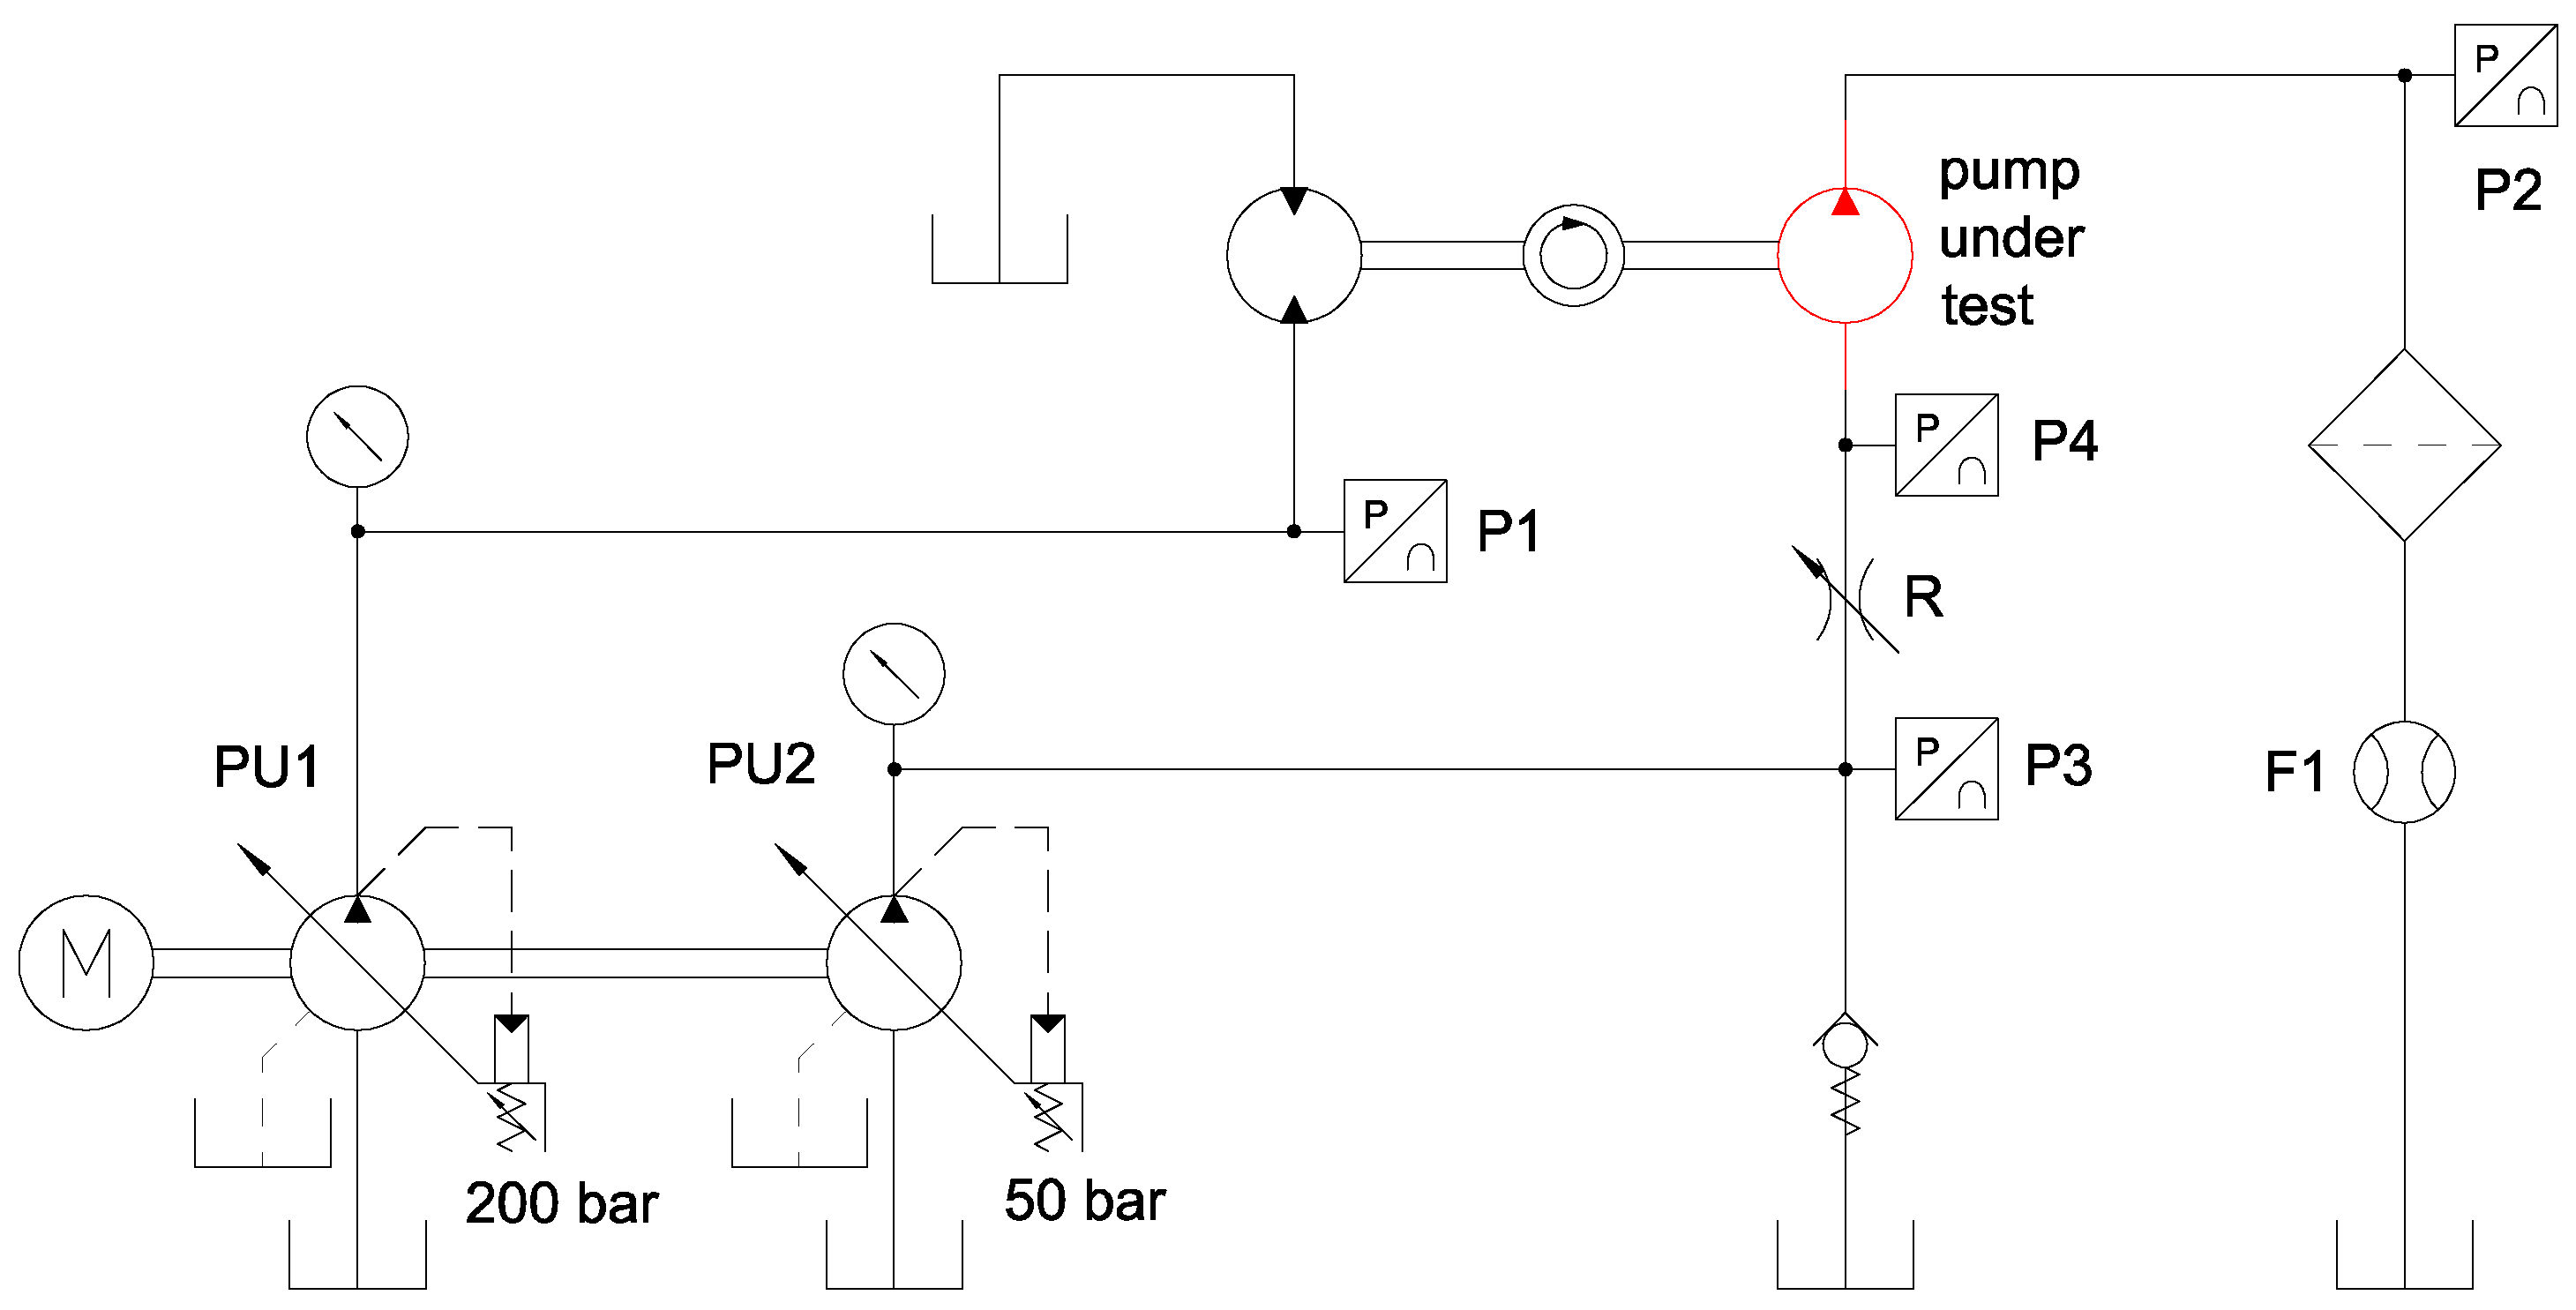
Figure 7.
Photo of the test rig.
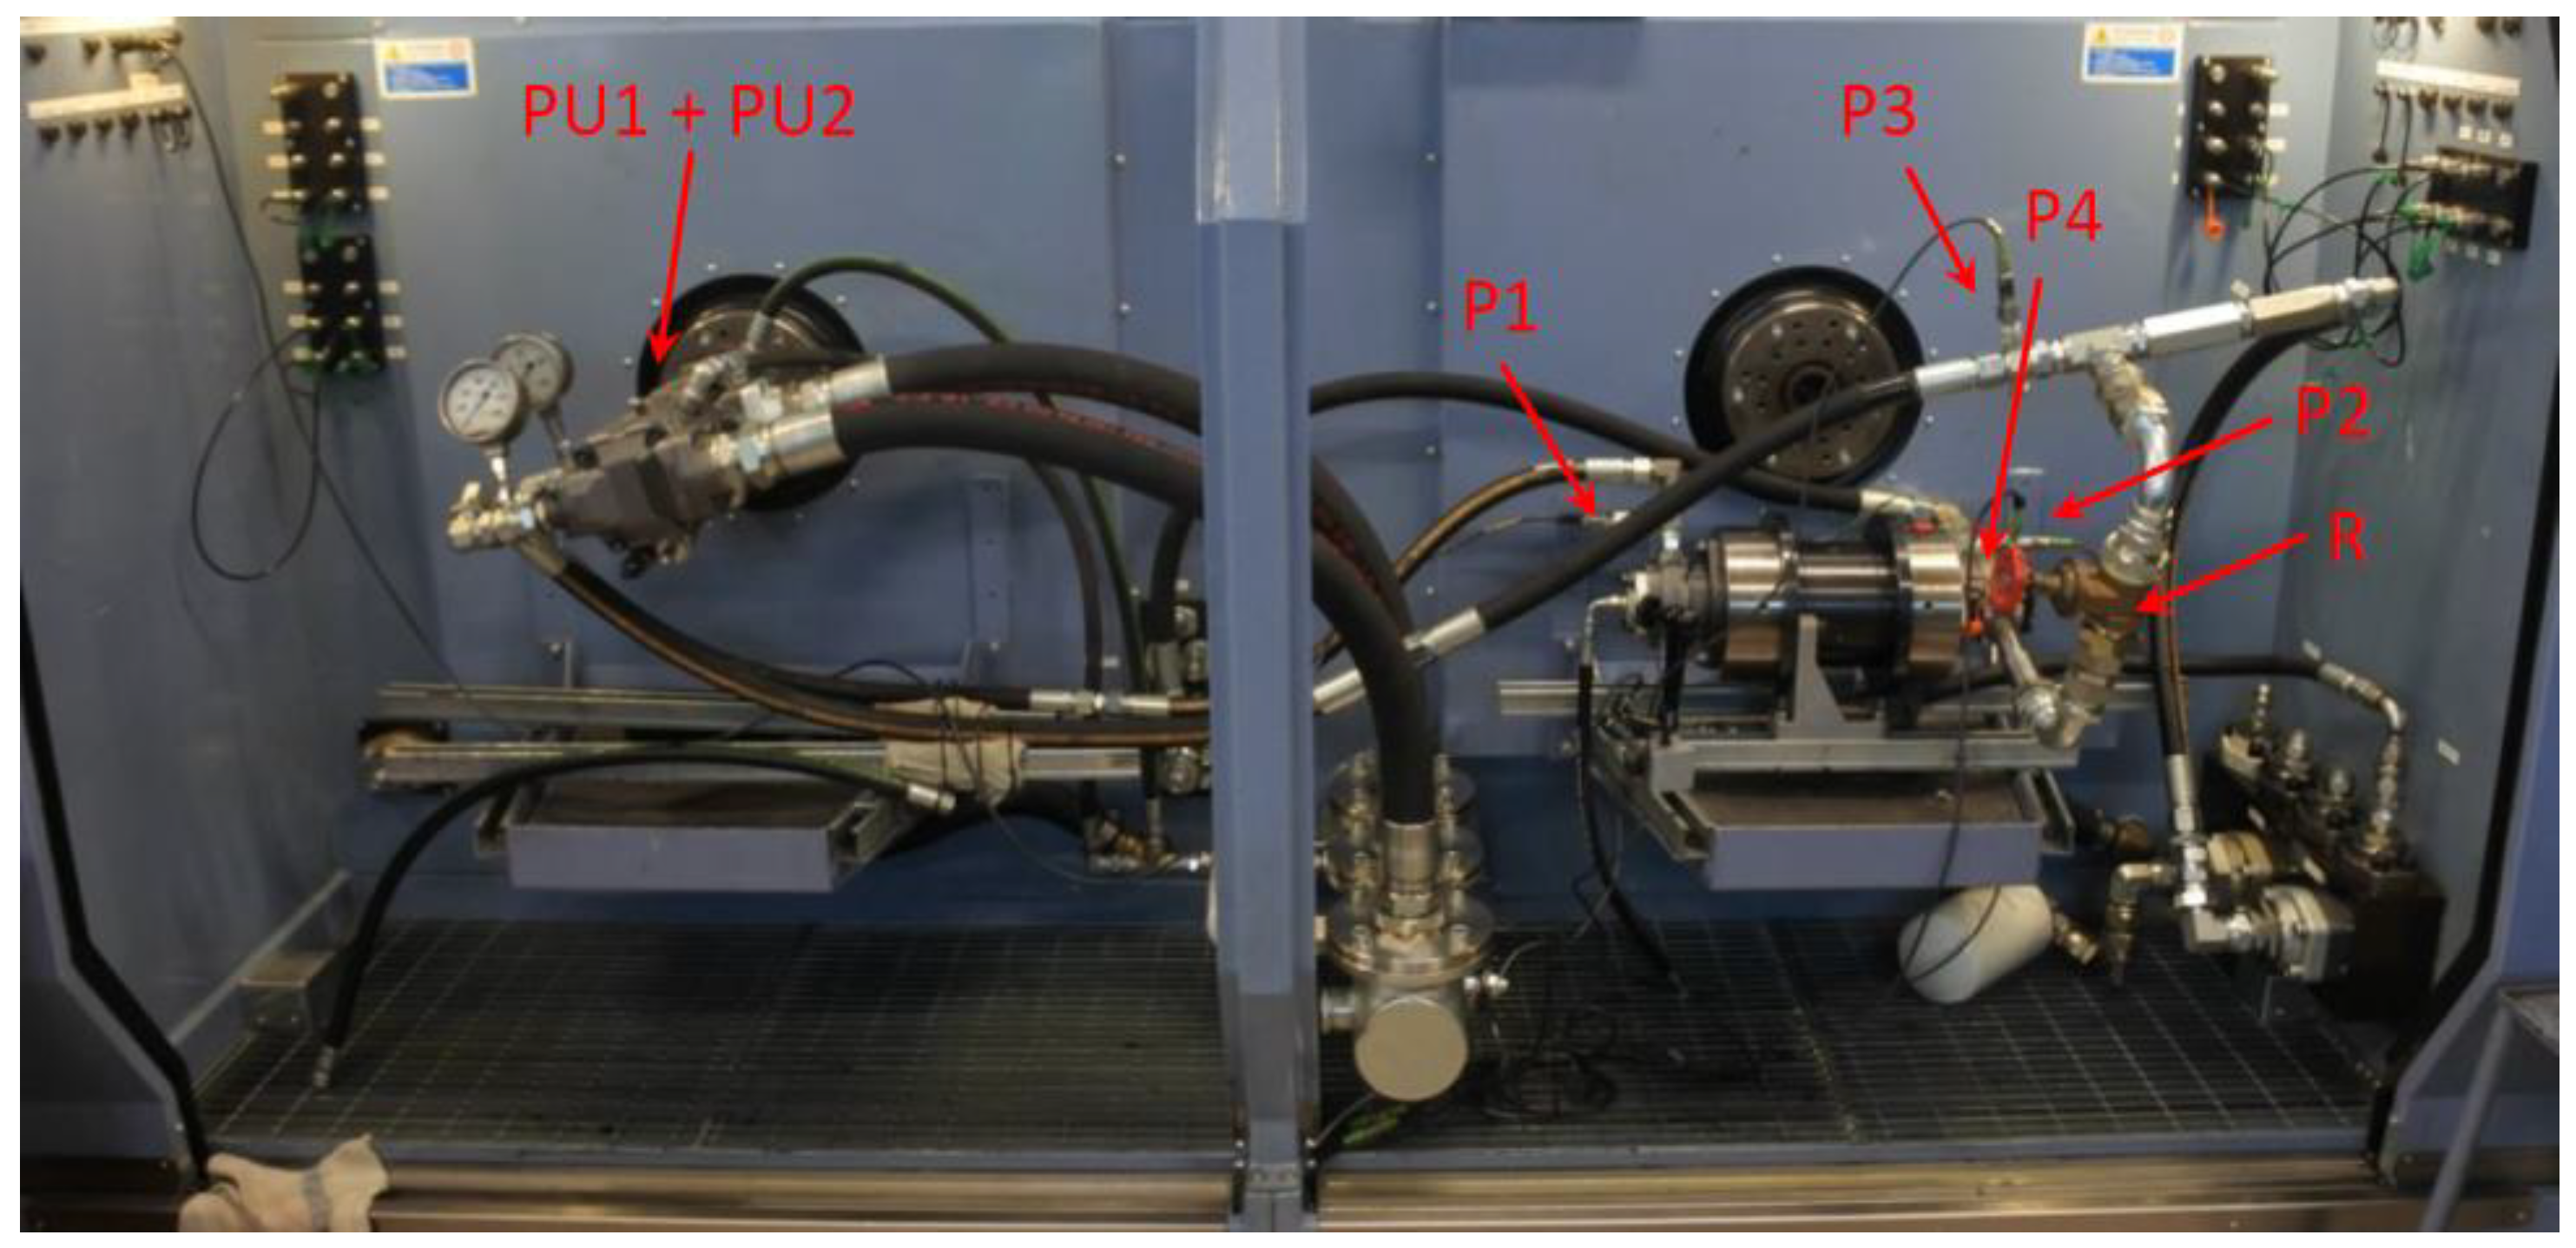
Figure 8.
Comparison between the experimental and simulated normalized delivery flow rate vs. the dimensionless absolute inlet pressure and three different shaft speeds for the helical gear pump.
Figure 8.
Comparison between the experimental and simulated normalized delivery flow rate vs. the dimensionless absolute inlet pressure and three different shaft speeds for the helical gear pump.

Figure 9.
Total gas volume fraction for 6 different angular positions of the gears at operating point 1 in Figure 8 (blue color indicates the liquid phase only).
Figure 9.
Total gas volume fraction for 6 different angular positions of the gears at operating point 1 in Figure 8 (blue color indicates the liquid phase only).
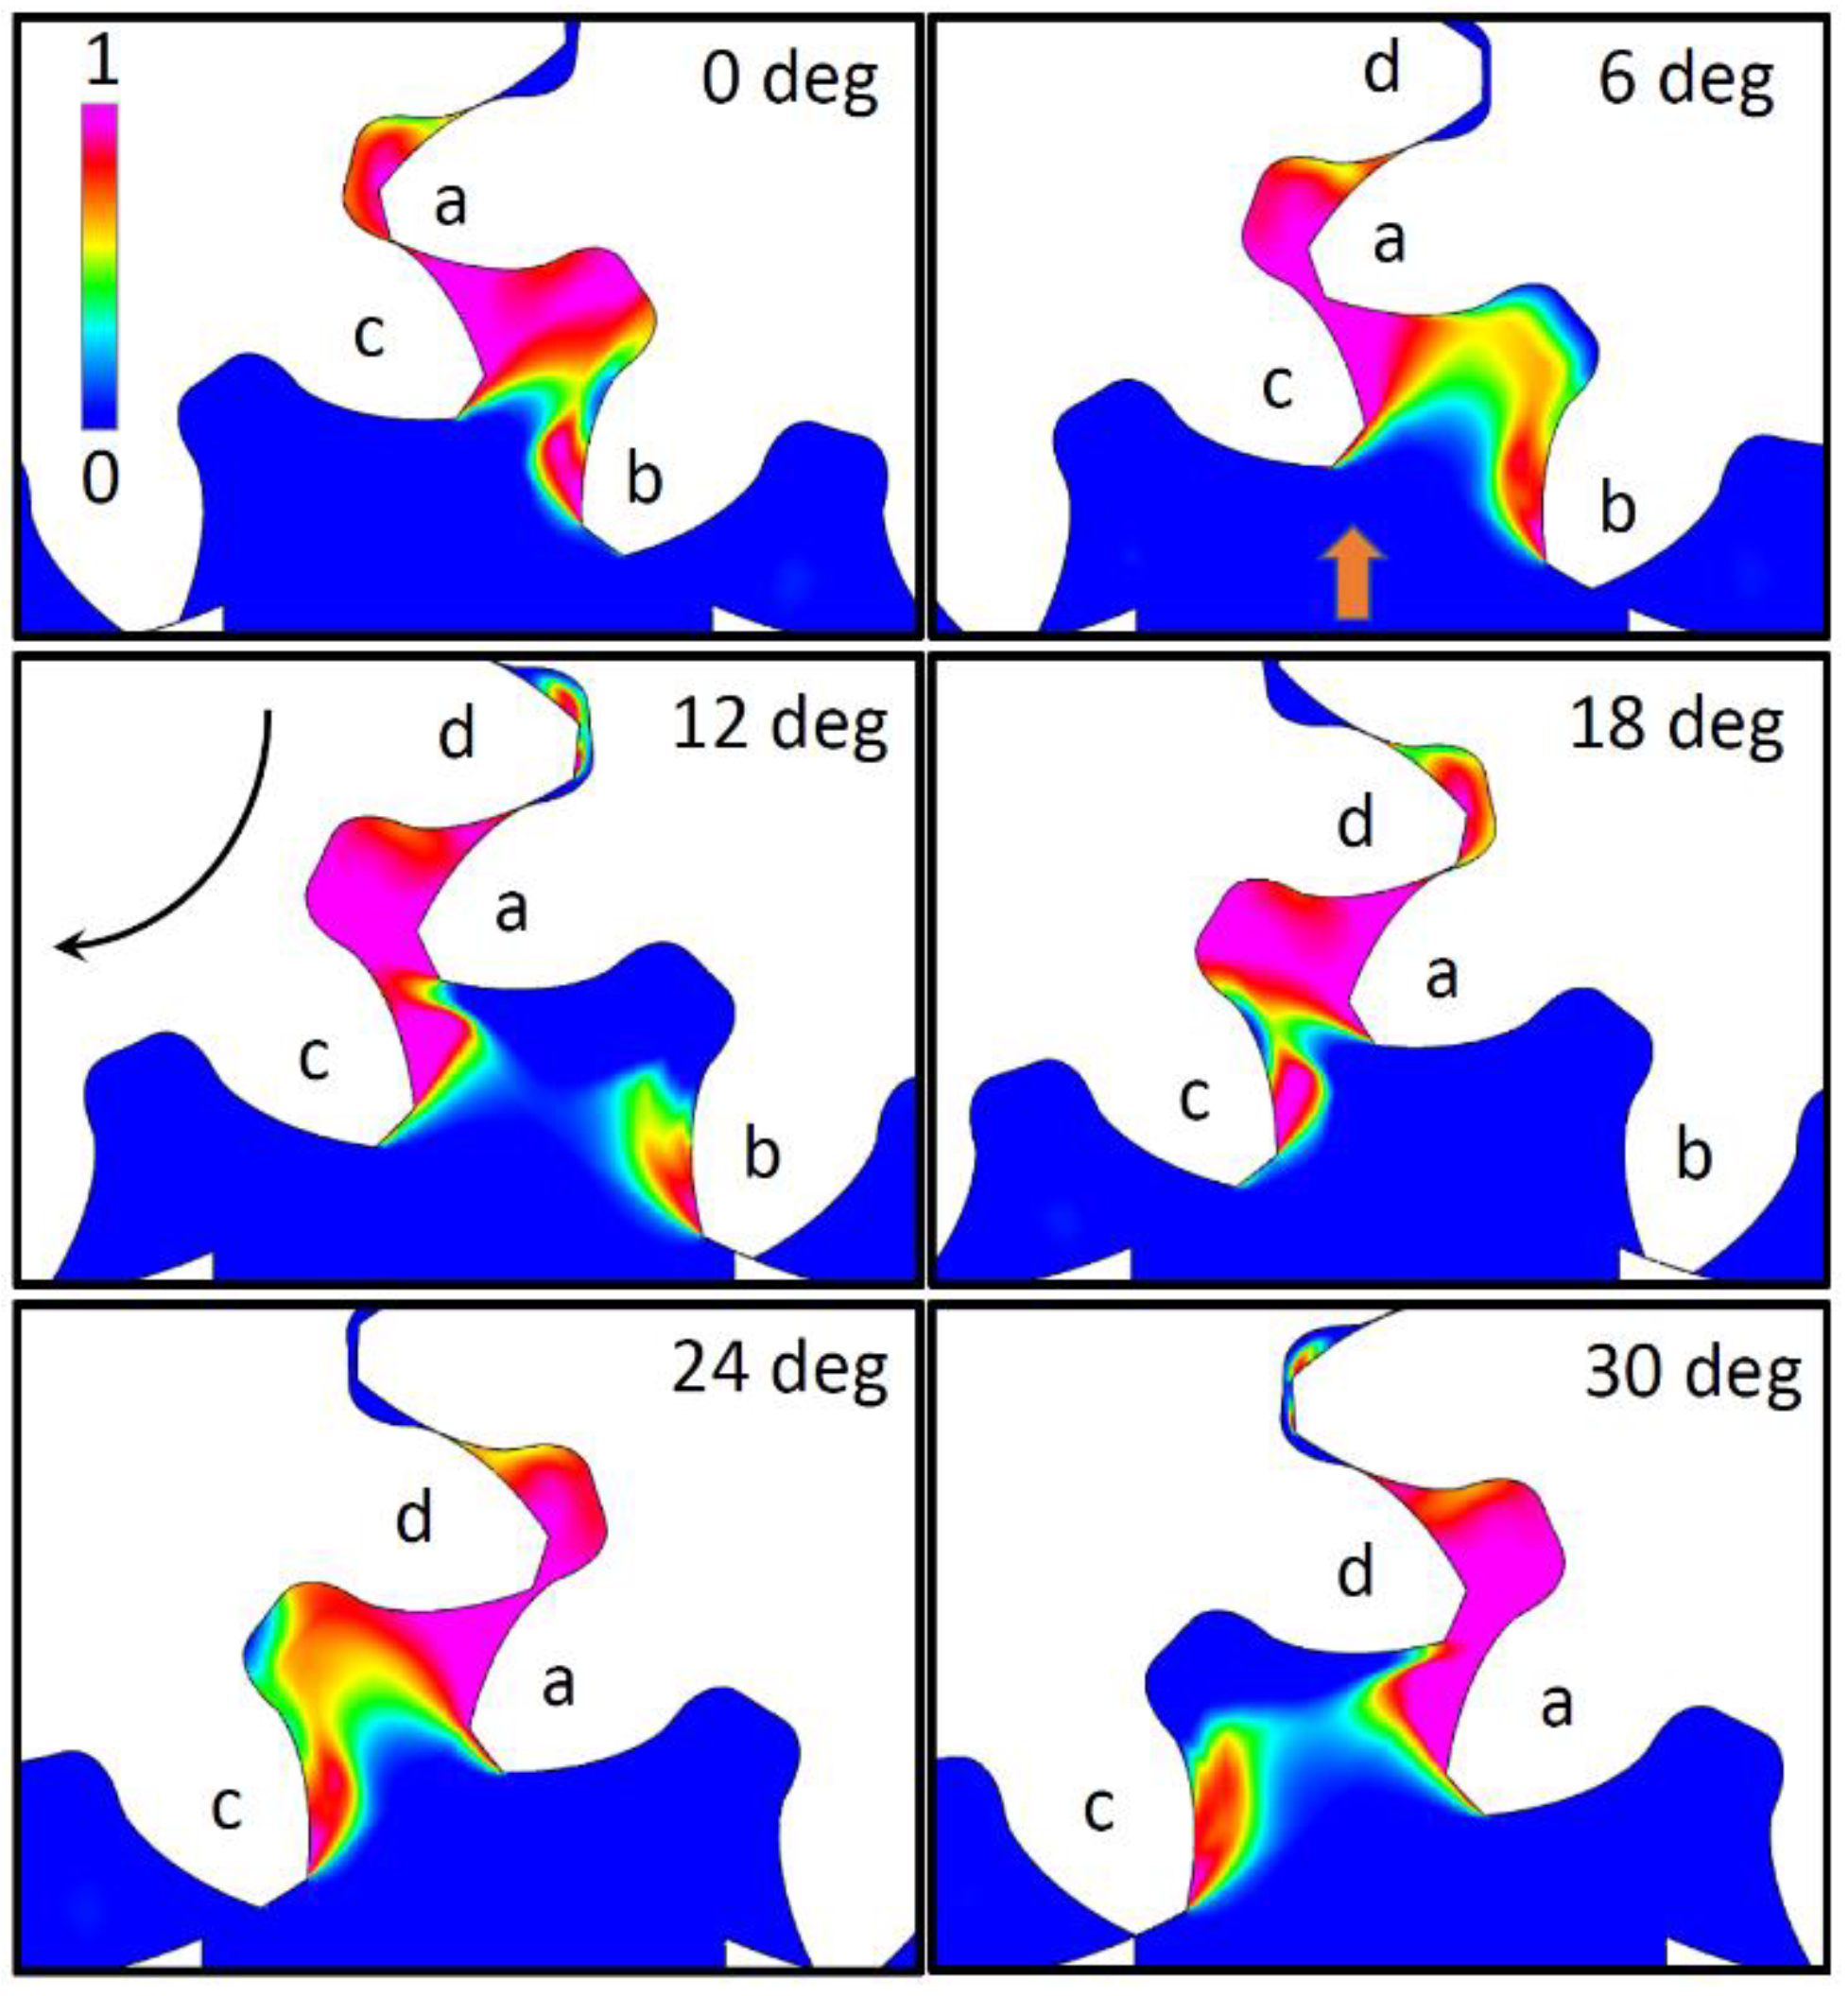
Figure 10.
Cut plot on the total gas volume fraction at operating point 2 in Figure 8.
Figure 10.
Cut plot on the total gas volume fraction at operating point 2 in Figure 8.
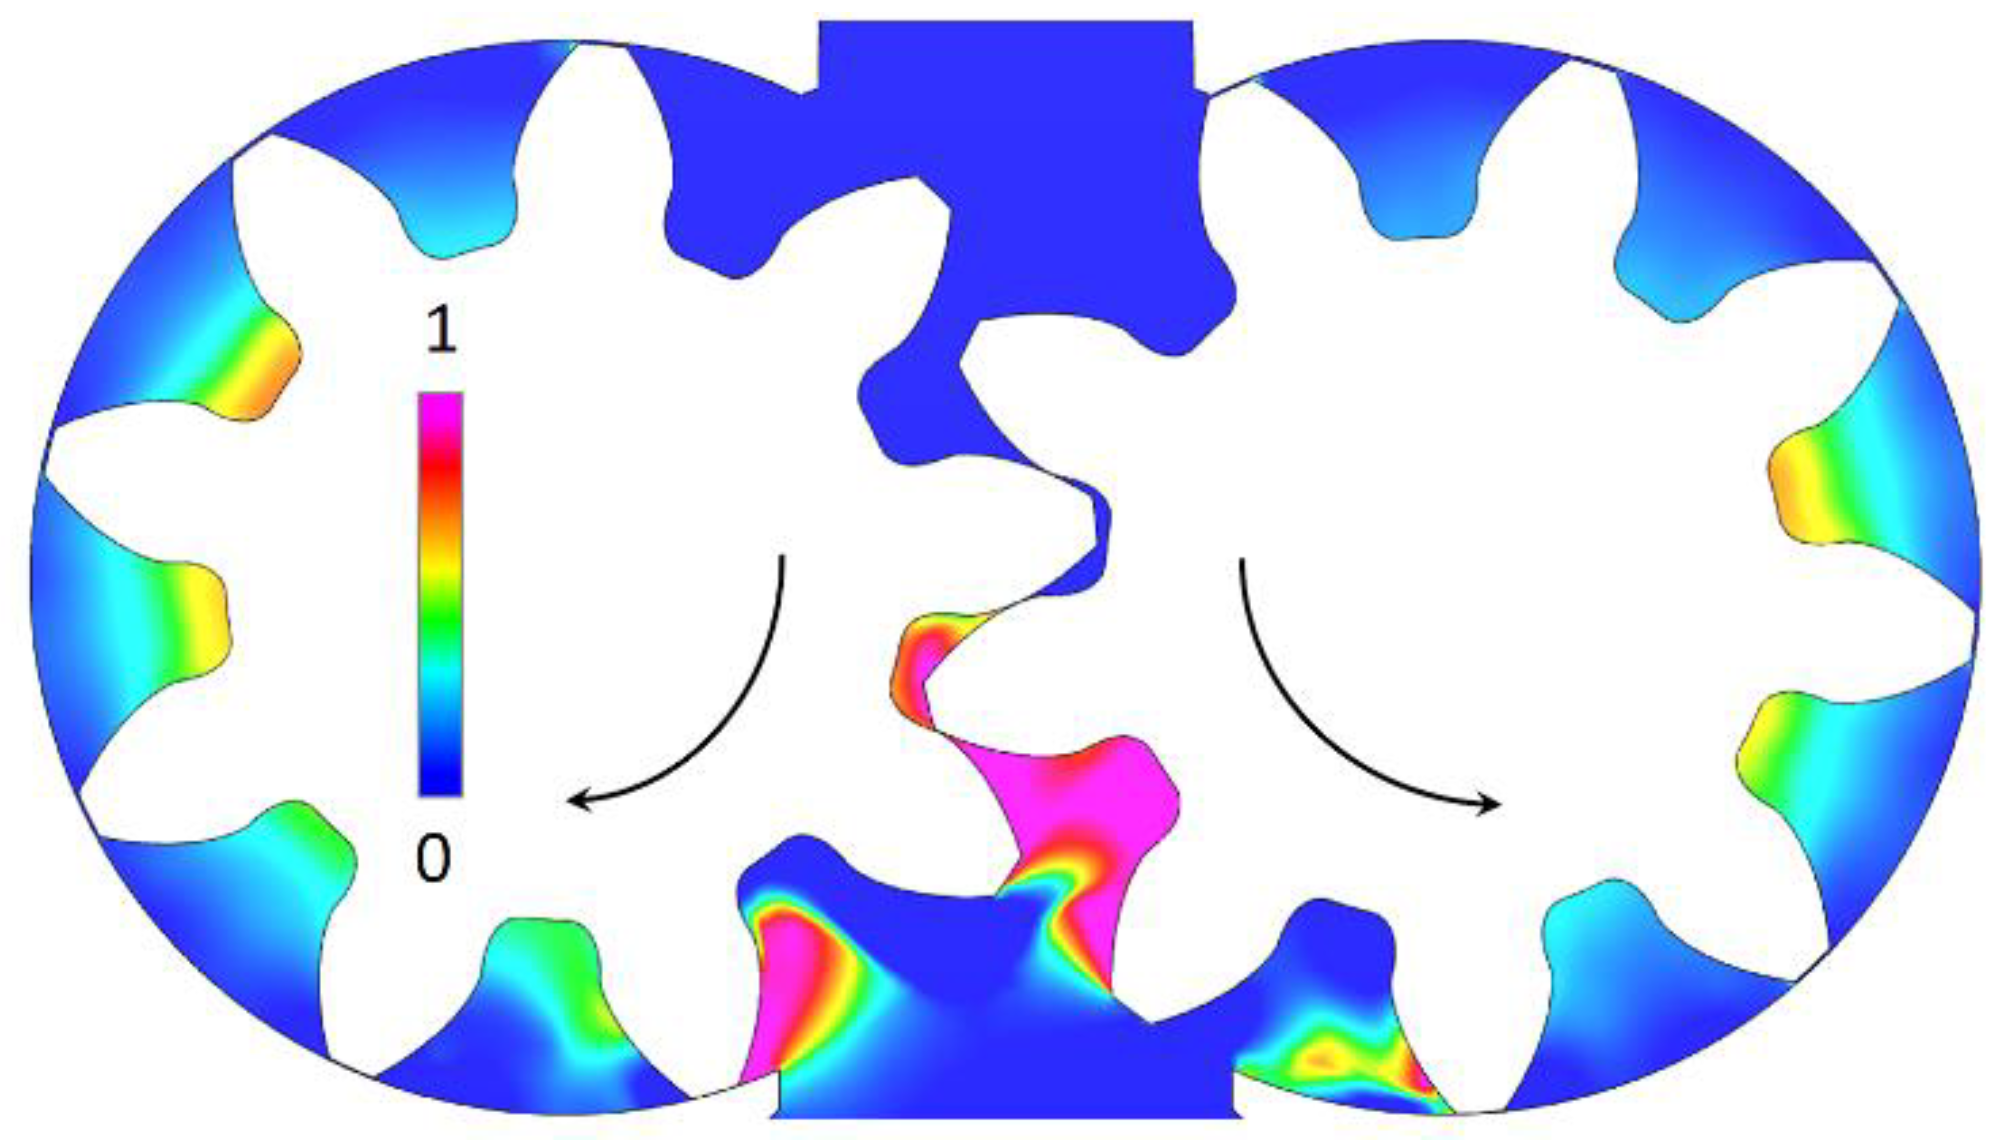
Figure 11.
Cut plot on the pressure field at operating point 2 in Figure 8.
Figure 11.
Cut plot on the pressure field at operating point 2 in Figure 8.
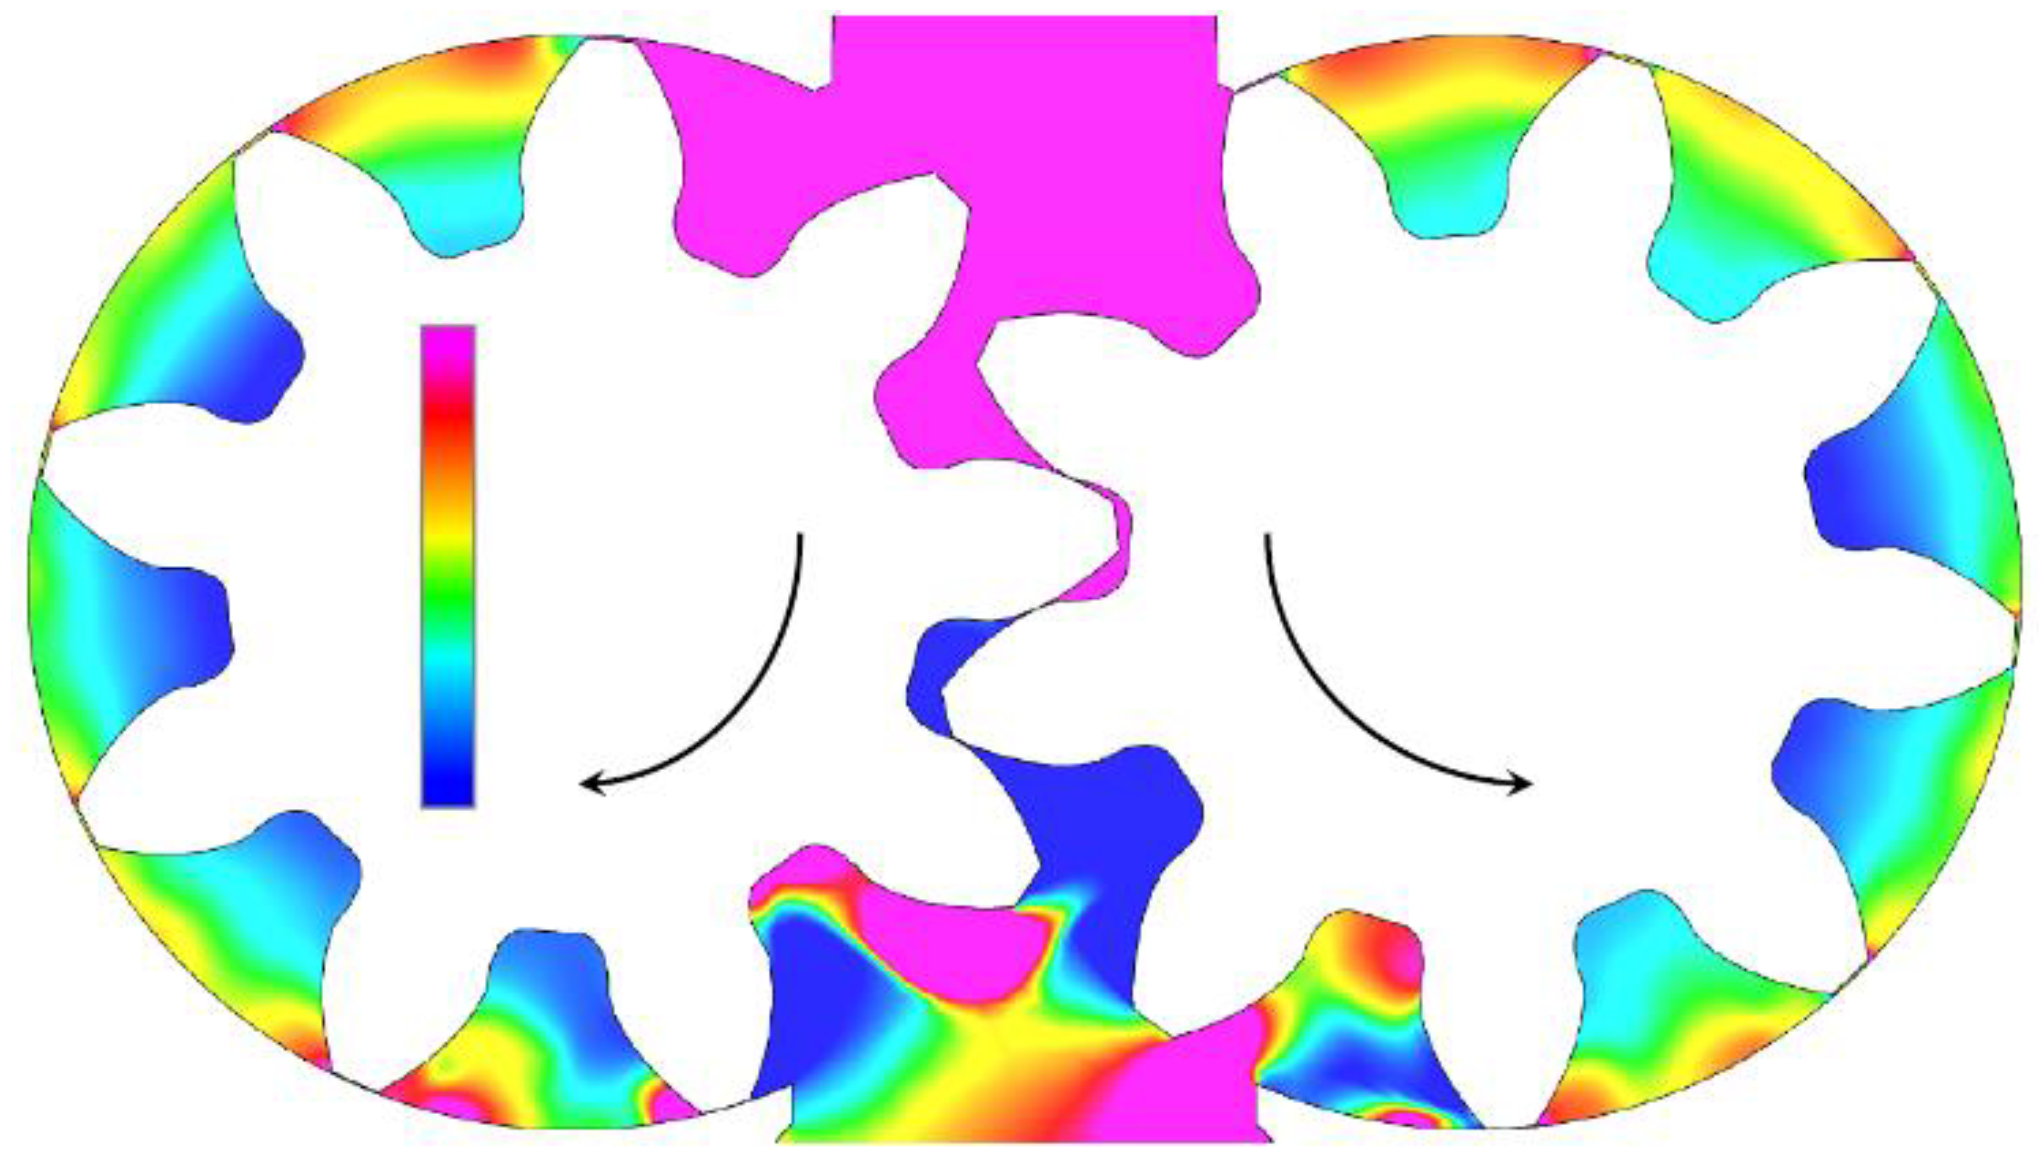
Figure 12.
Comparison between the experimental and simulated normalized delivery flow rate vs. the dimensionless absolute inlet pressure and three different shaft speeds for the spur gear pump.
Figure 12.
Comparison between the experimental and simulated normalized delivery flow rate vs. the dimensionless absolute inlet pressure and three different shaft speeds for the spur gear pump.
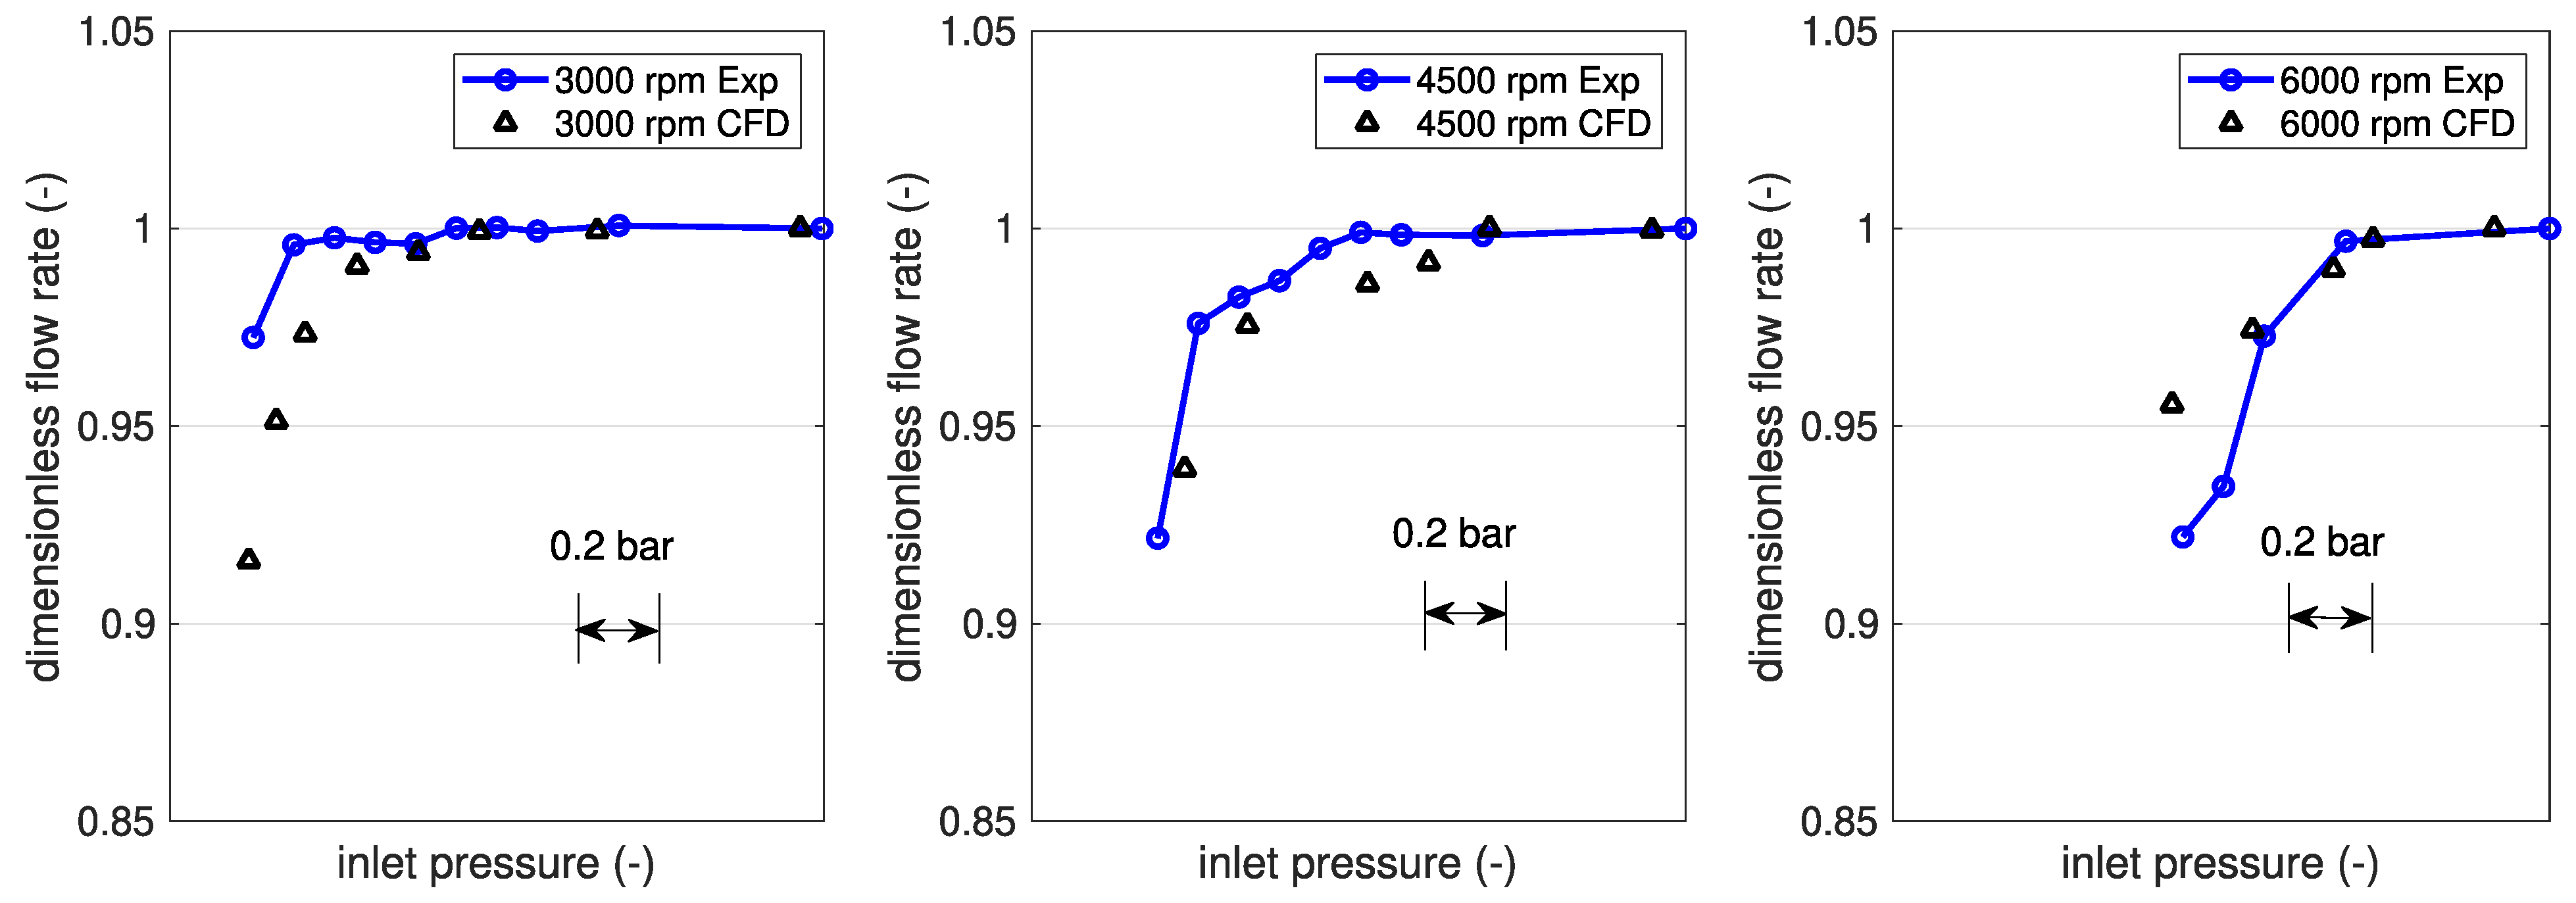
Figure 13.
Superimposition of the rotating fluid domains in the original pump A and the modified versions B and C. (a) Frontal view, (b) axonometric view.
Figure 13.
Superimposition of the rotating fluid domains in the original pump A and the modified versions B and C. (a) Frontal view, (b) axonometric view.

Figure 14.
Superimposition of the silencing grooves on the low-pressure side of the original pump A and versions B and C.
Figure 14.
Superimposition of the silencing grooves on the low-pressure side of the original pump A and versions B and C.
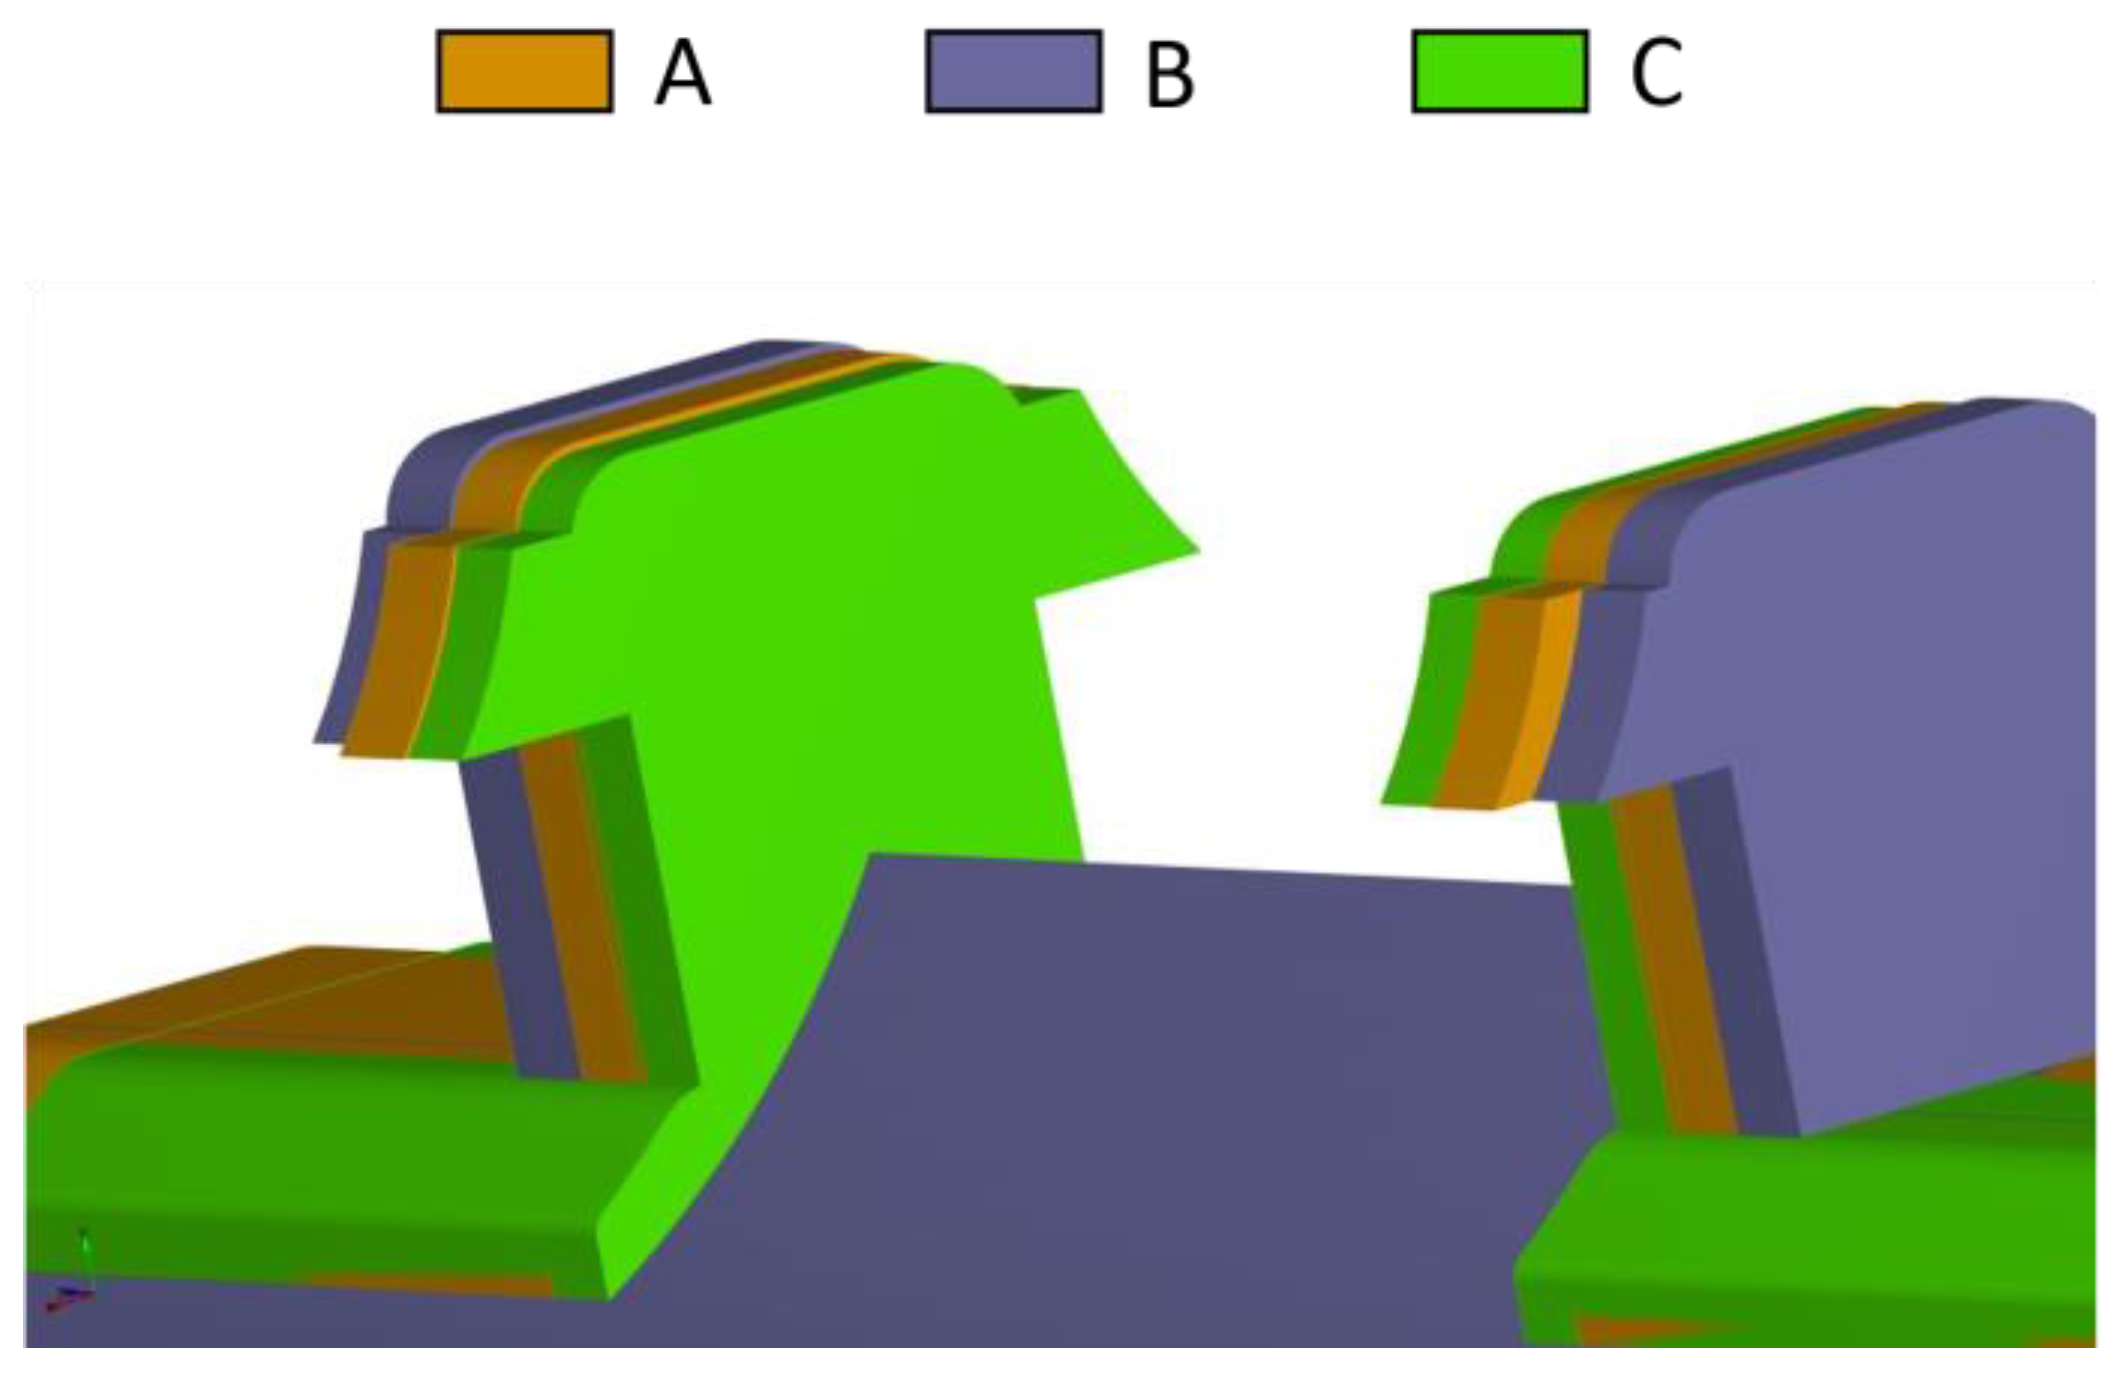
Figure 15.
Definition of (a) the minimum flow area, (b) the rotor–inlet volume interface area.

Figure 16.
Volumetric efficiency of the version B and C pumps.
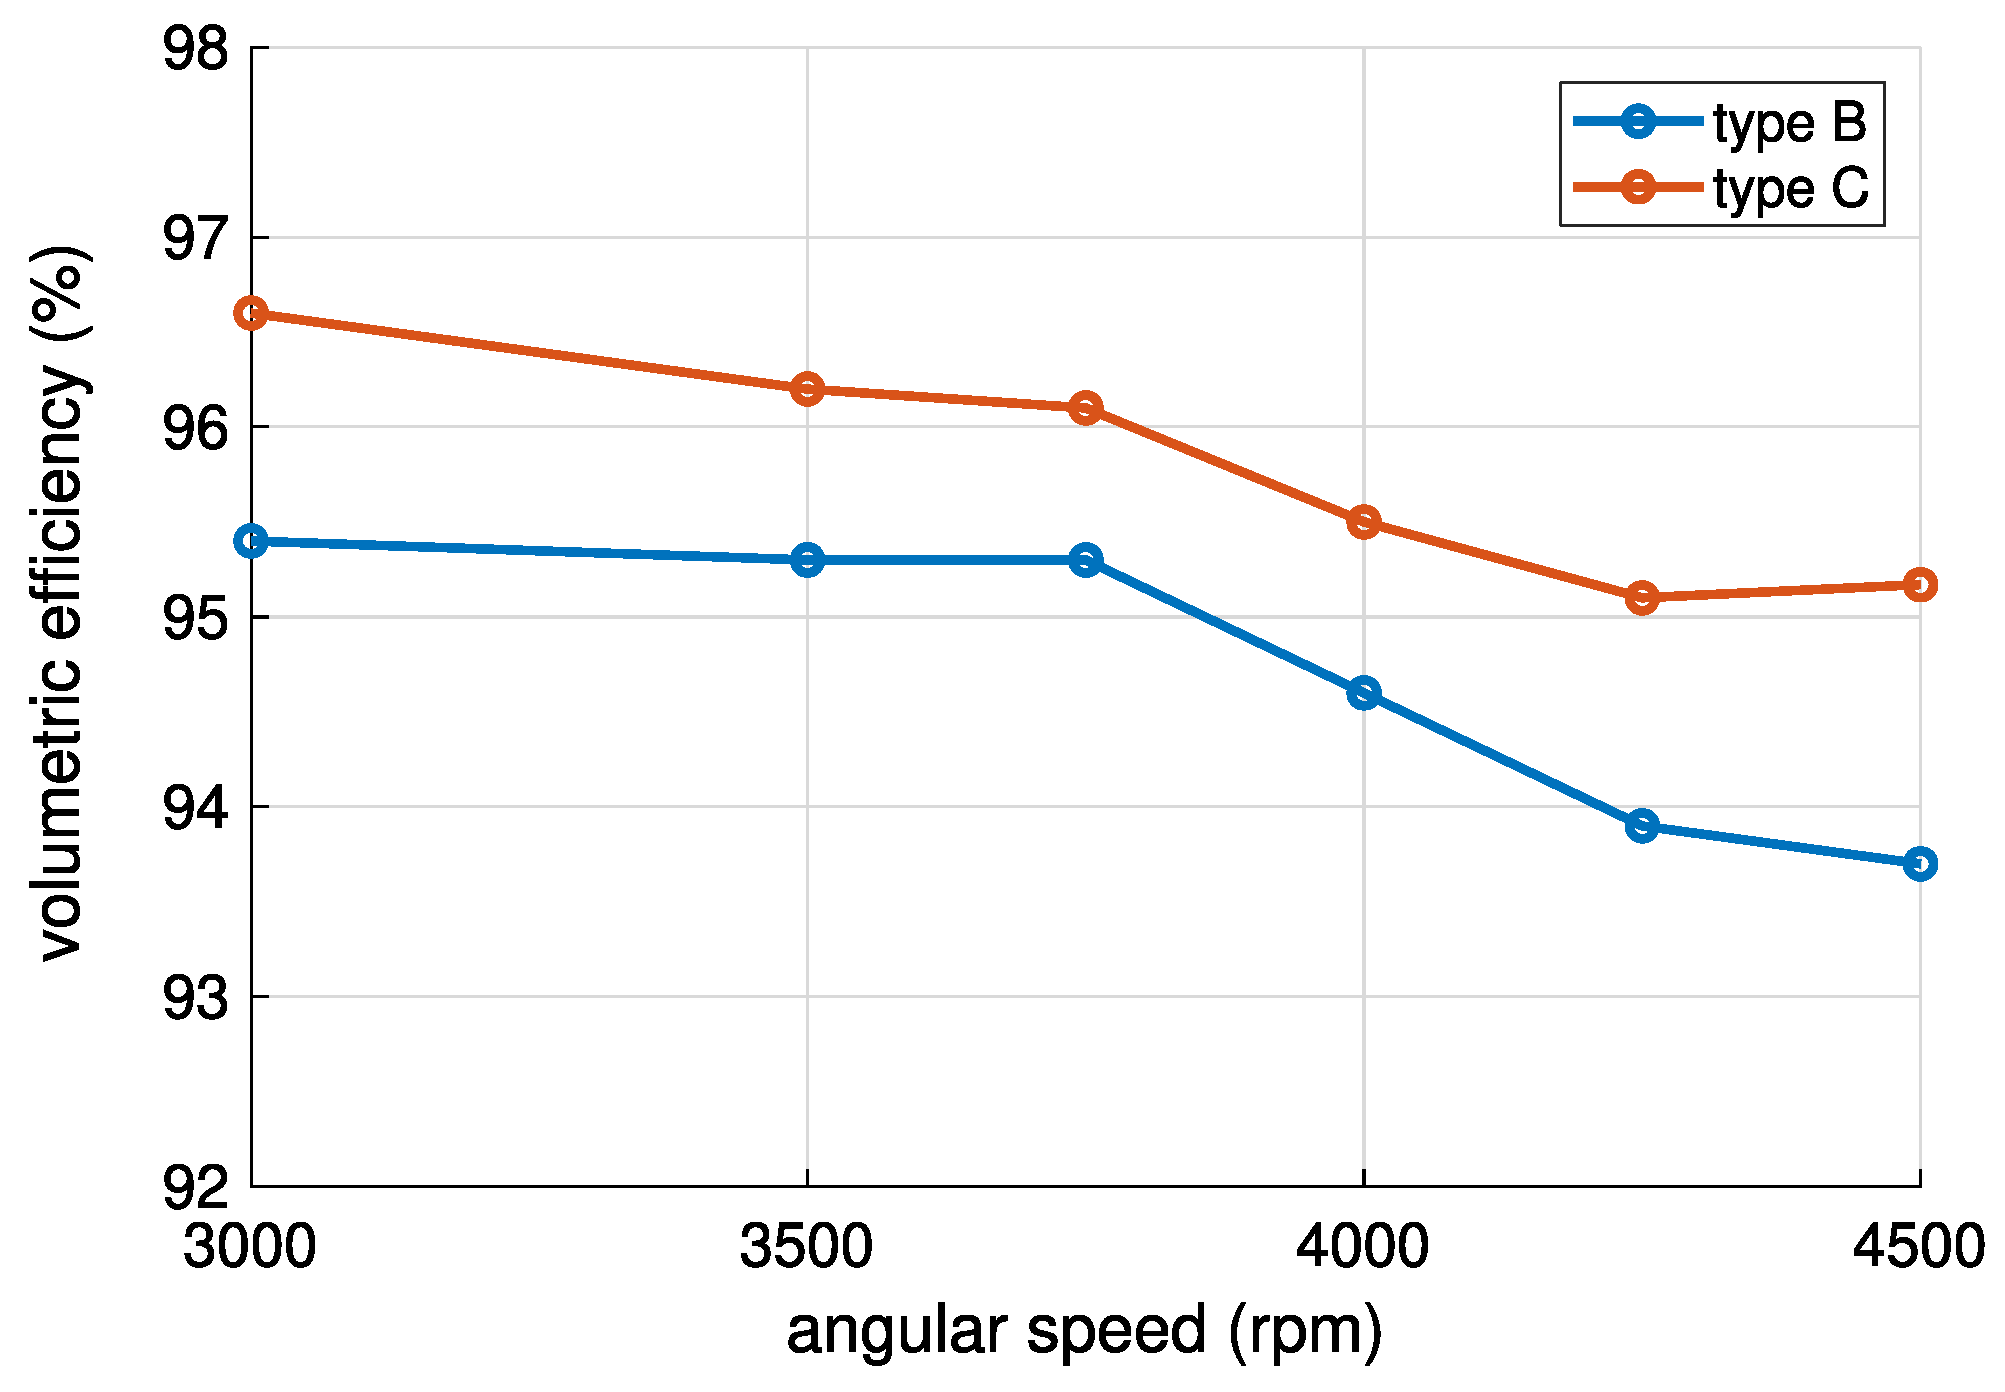
Figure 17.
Grid of the spur gear pump: (a) original version (type A), (b) with increased inlet port (type D).
Figure 17.
Grid of the spur gear pump: (a) original version (type A), (b) with increased inlet port (type D).
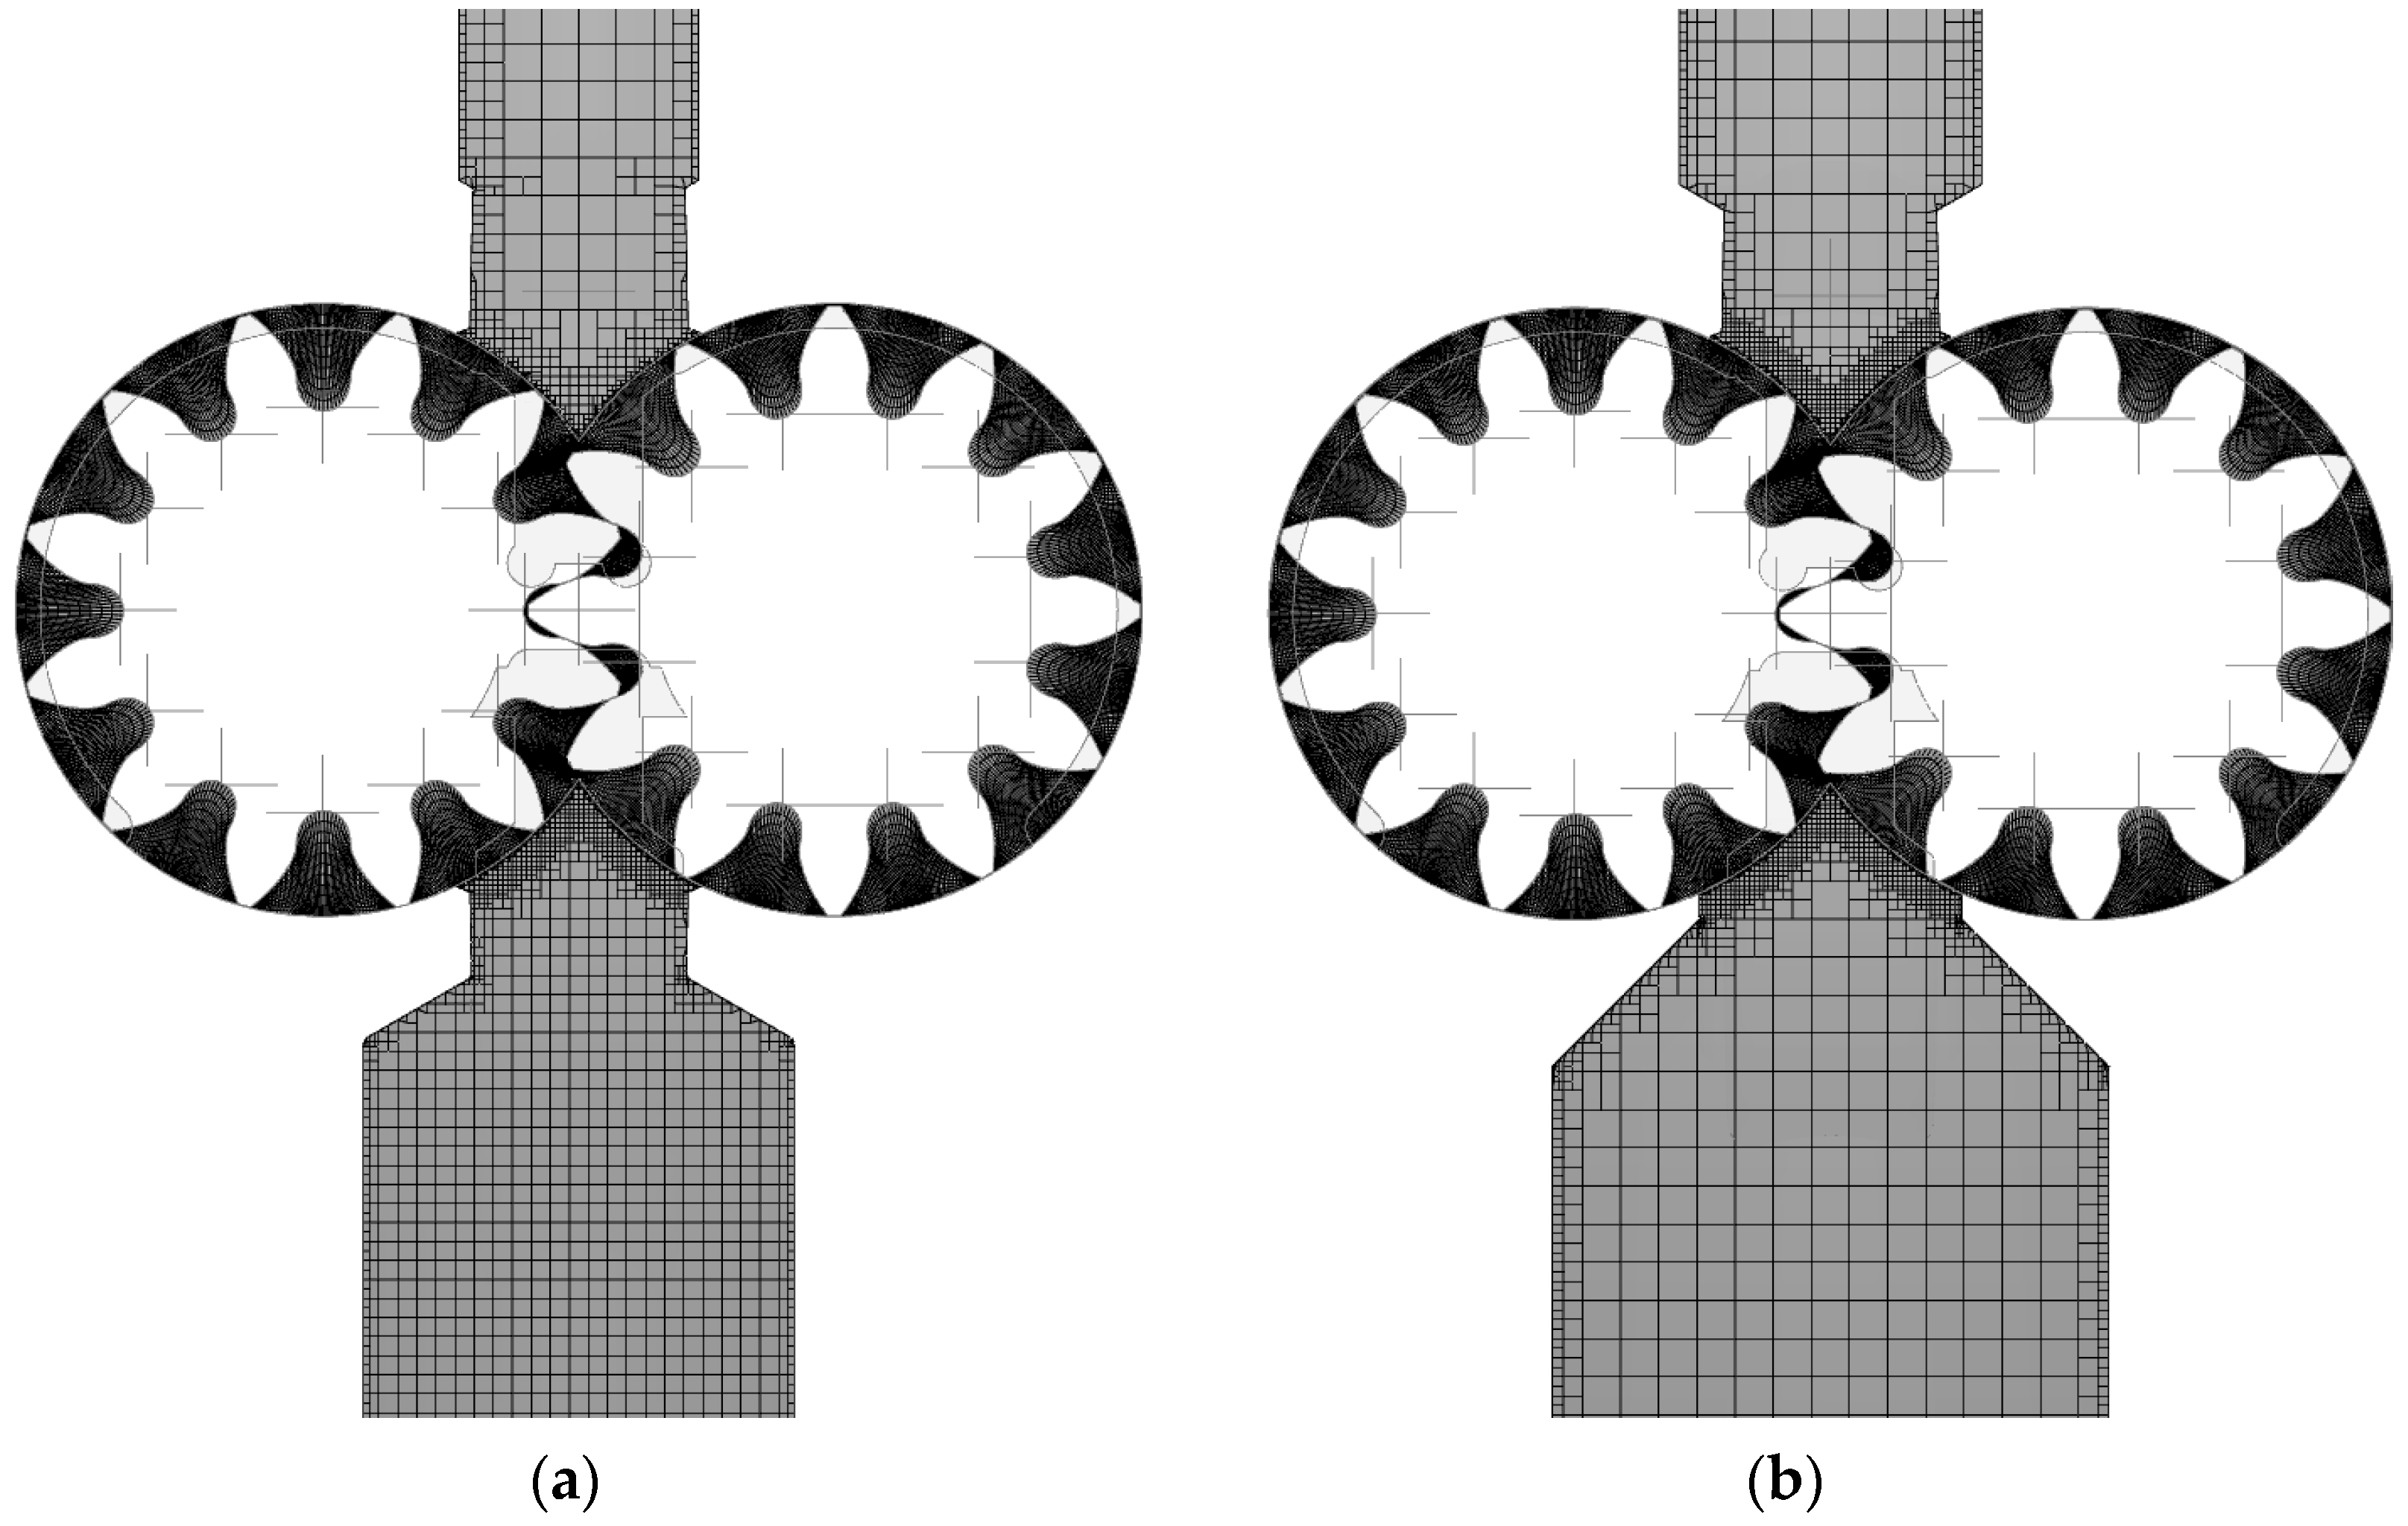
Figure 18.
Comparison between the flow rate measured and simulated for the configurations A and D at 6000 rpm.
Figure 18.
Comparison between the flow rate measured and simulated for the configurations A and D at 6000 rpm.

Table 1.
Configuration of the pumps used in the study.
| Configuration | Description |
|---|---|
| Helical gear | Reference pump |
| Spur gear A | Standard straight-teeth pump |
| Spur gear B | Higher ratio thickness/diameter with respect to spur gear A |
| Spur gear C | Lower ratio thickness/diameter with respect to spur gear A |
| Spur gear D | As spur gear A with larger inlet port |
Table 2.
Influence of the angular step and of the residual on the volumetric efficiency and CPU time.
Table 2.
Influence of the angular step and of the residual on the volumetric efficiency and CPU time.
| Configuration | Volumetric Efficiency | CPU Time (h/rev) |
|---|---|---|
| 0.5 deg—residual drop 0.1 | 94.3% | 3.5 |
| 0.5 deg—residual drop 0.01 | 96.7% | 16.5 |
| 1 deg—residual drop 0.1 | 90.3% | 3 |
| 1 deg—residual drop 0.01 | 96.7% | 7 |
Table 3.
The number of cells for each subdomain used in the helical gear pump.
| Volume | Number of Cells |
|---|---|
| Two rotors | 792,000 |
| Delivery volume | 760,143 |
| Inlet volume | 181,732 |
| Suction duct | 22,800 |
| Total | 1,756,675 |
Table 4.
Technical data on the transducers.
| Quantity | Transducer | Range | Accuracy |
|---|---|---|---|
| Pressures P1, P2 | Trafag 8253 | 0 ÷ 400 bar | ±0.3% F.S. |
| Pressures P3, P4 | Trafag 8254 | −1 ÷ 4 bar | ±0.3% F.S. |
| Flow rate | VSE VS 4 | 1 ÷ 250 L/min | ±0.3% Reading |
Table 5.
Geometrical parameters for versions A, B, and C.
| Parameter | A Version | B Version | C Version |
|---|---|---|---|
| Minimum flow area | - | +6% | −7% |
| Rotor–inlet interface area | - | +6% | −7% |
| Tooth–flank gap | 22 μm | 19 μm | 16 μm |
| Tip clearance on inlet edge | 7 μm | 6 μm | 4 μm |
Disclaimer/Publisher’s Note: The statements, opinions and data contained in all publications are solely those of the individual author(s) and contributor(s) and not of MDPI and/or the editor(s). MDPI and/or the editor(s) disclaim responsibility for any injury to people or property resulting from any ideas, methods, instructions or products referred to in the content. |
© 2023 by the authors. Licensee MDPI, Basel, Switzerland. This article is an open access article distributed under the terms and conditions of the Creative Commons Attribution (CC BY) license (https://creativecommons.org/licenses/by/4.0/).
Share and Cite
MDPI and ACS Style
Corvaglia, A.; Rundo, M.; Bonati, S.; Rigosi, M. Simulation and Experimental Activity for the Evaluation of the Filling Capability in External Gear Pumps. Fluids 2023, 8, 251. https://doi.org/10.3390/fluids8090251
AMA Style
Corvaglia A, Rundo M, Bonati S, Rigosi M. Simulation and Experimental Activity for the Evaluation of the Filling Capability in External Gear Pumps. Fluids. 2023; 8(9):251. https://doi.org/10.3390/fluids8090251
Chicago/Turabian StyleCorvaglia, Alessandro, Massimo Rundo, Sara Bonati, and Manuel Rigosi. 2023. "Simulation and Experimental Activity for the Evaluation of the Filling Capability in External Gear Pumps" Fluids 8, no. 9: 251. https://doi.org/10.3390/fluids8090251