
The Potential Role of Circulating Long Miscellaneous RNAs in the Diagnosis and Prognosis of Hepatitis C Related Hepatocellular Carcinoma

 ,
,  , , , , , ,
Abstract
:1. Introduction
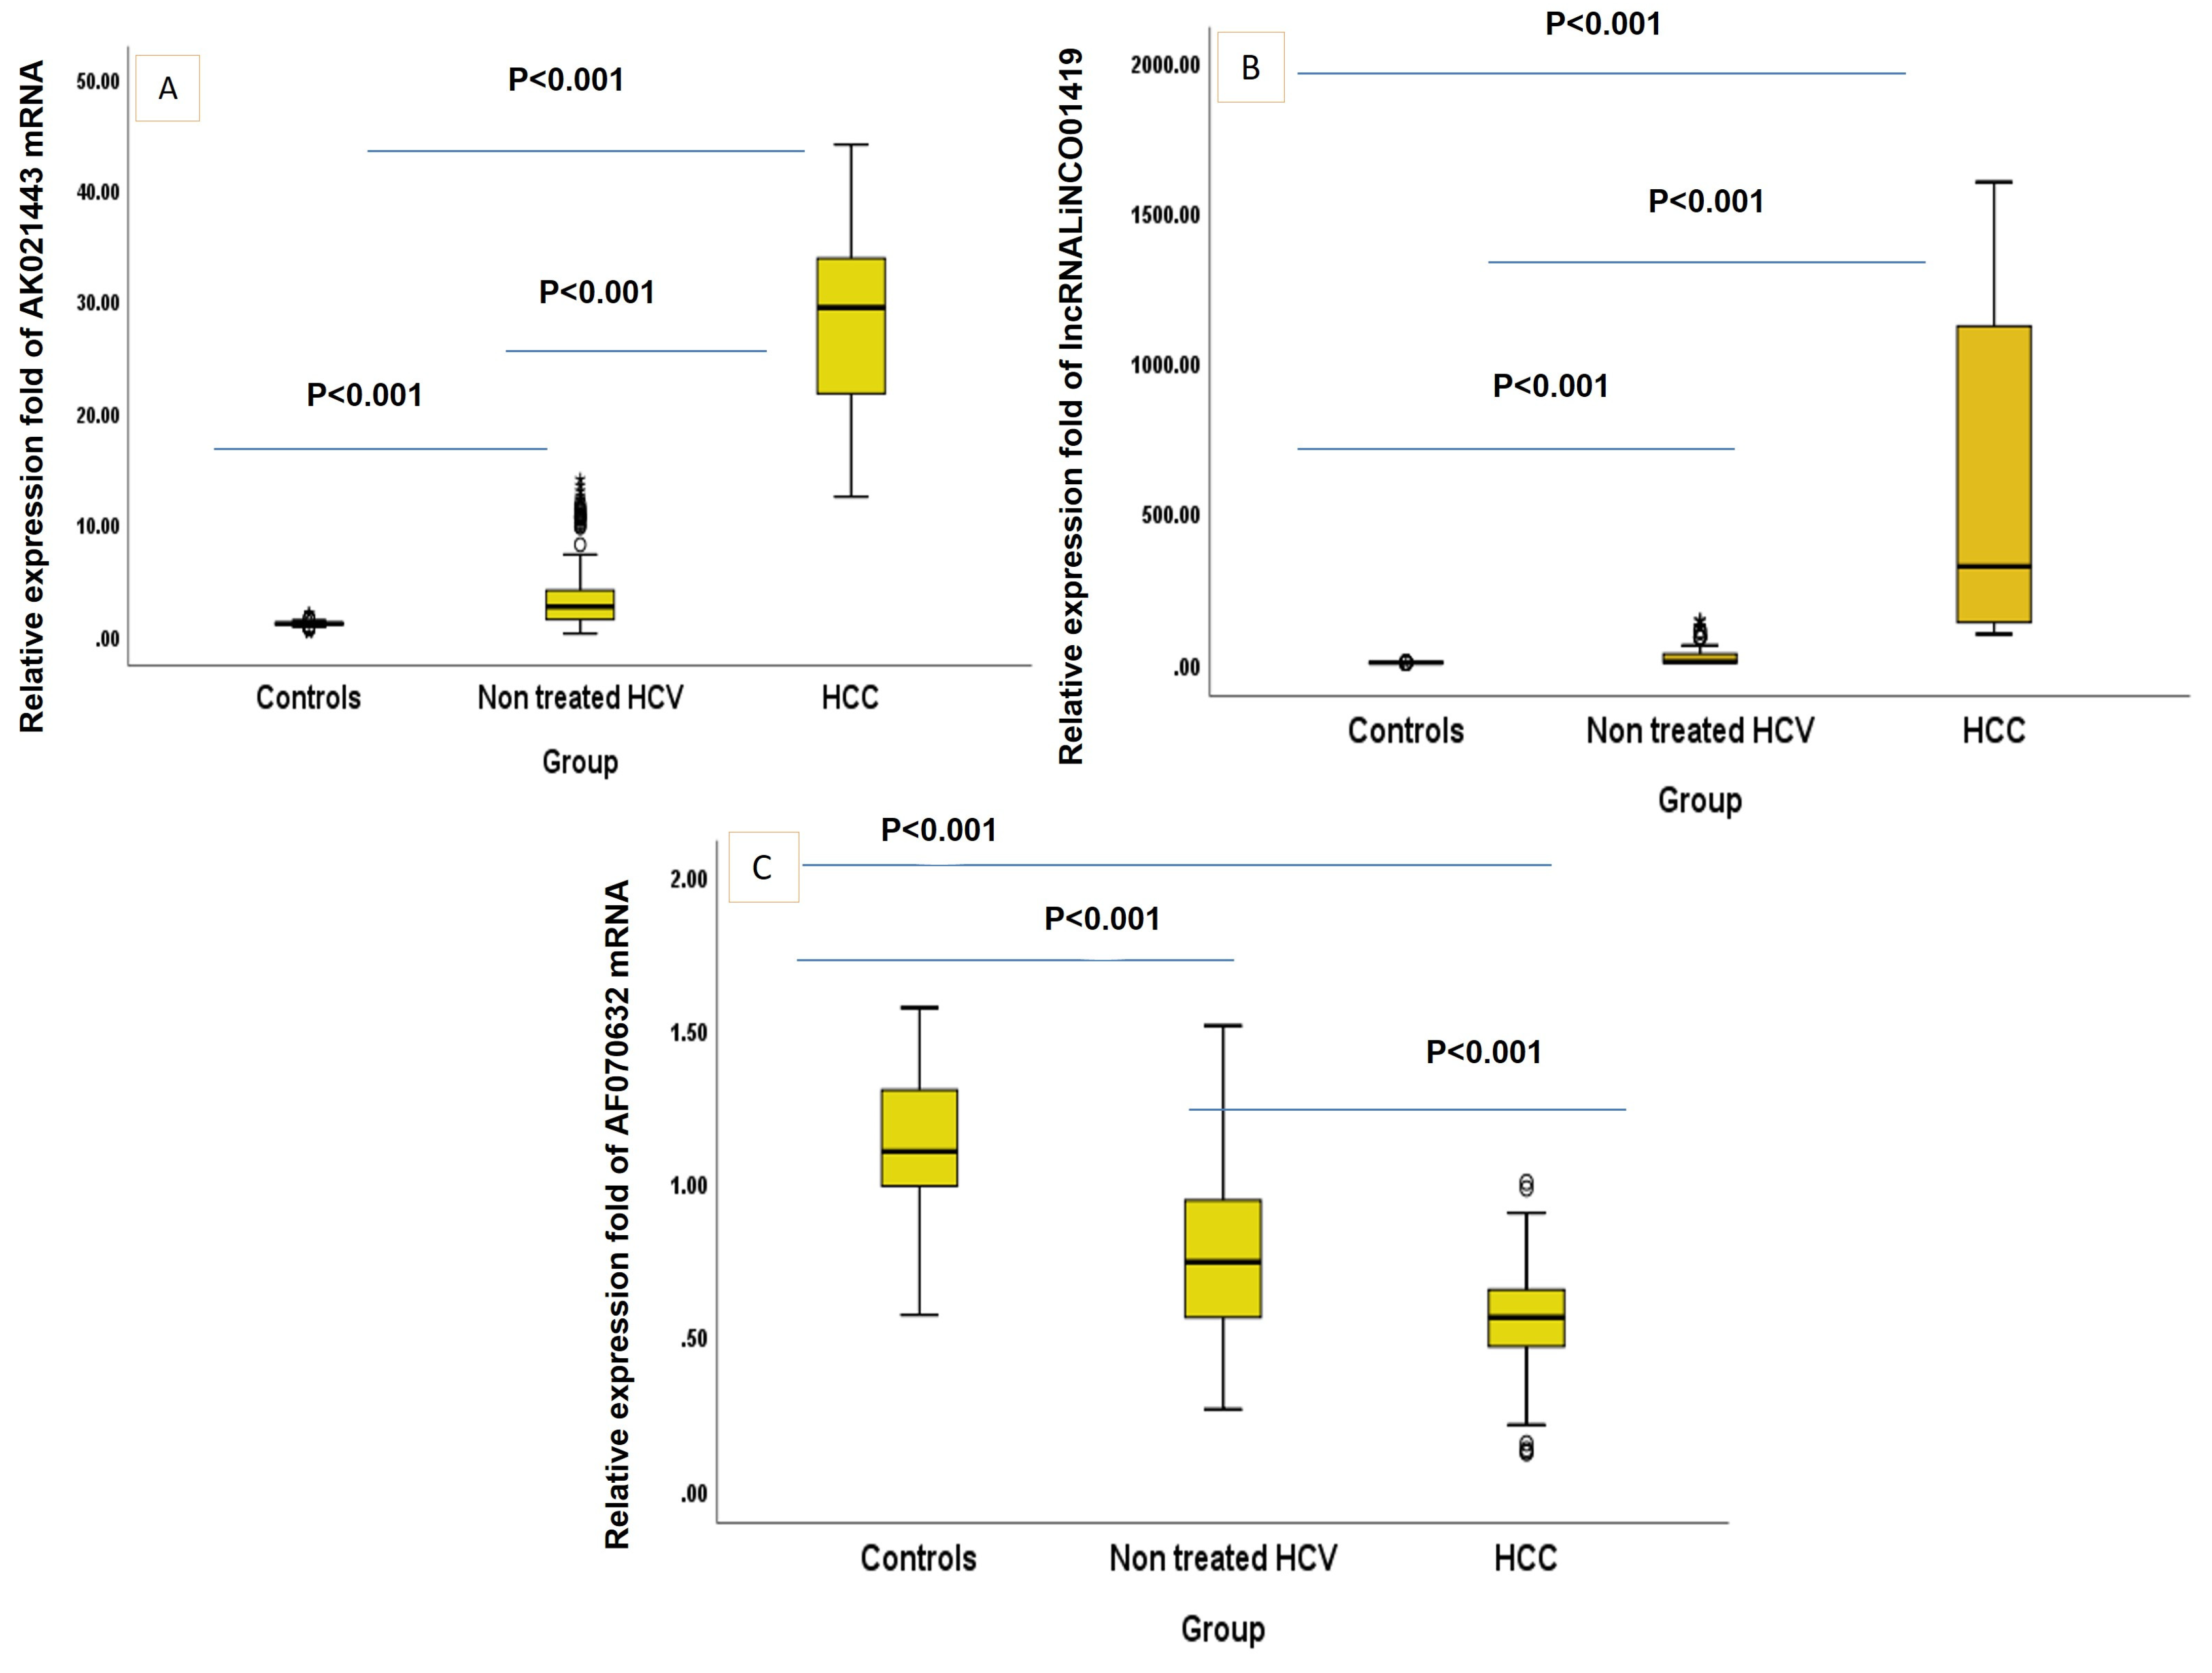
2. Results

| Child Pugh Class | No | Non Treated HCV | No | HCC | Mann–Whitney Test | p Value | |
|---|---|---|---|---|---|---|---|
| Median (IQR) | Median (IQR) | ||||||
| mRNA AK021443 | A | 167 | 2.65 [1.38–5.03] | 16 | 20.52 [13.73–38.38] | 6.47 | <0.001 * - |
| B | 27 | 2.15 [1.30–2.64] | 82 | 28.11 [22.01–33.03] | 7.77 | ||
| C | 0 | - | 22 | 33.84 [27.21–38.65] | - | ||
| LncRNA LINCO01419 | A | 167 | 4.07 [1.65–31.05] | 16 | 234.92 [135.69–570.74] | 6.48 | <0.001 * |
| B | 27 | 2.68 [1.60–10.17] | 82 | 215.20 [131.33–1120.55] | 7.77 | <0.001 * | |
| C | 0 | - | 22 | 1101.63 [27.03–1240.10] | - | - | |
| mRNA AF070632 | A | 167 | 0.75 [0.56–0.95] | 16 | 0.61 [0.46–0.74] | 2.23 | 0.026 * |
| B | 27 | 0.71 [0.55–0.90] | 82 | 0.56 [0.47–0.65] | 3.39 | 0.001 * | |
| C | 0 | - | 22 | 0.55 [0.34–0.57] | - | - |
3. Materials and Methods
3.1. Population of the Study
3.2. Blood Sampling and Laboratory Analyses
3.3. Extraction of Total RNA and cDNA Formation
3.4. Bioinformatics Analysis
3.5. Sample Size
3.6. Statistical Analysis
4. Discussion
5. Conclusions
Supplementary Materials
Author Contributions
Funding
Institutional Review Board Statement
Informed Consent Statement
Data Availability Statement
Acknowledgments
Conflicts of Interest
References
- Kanwal, F.; Kramer, J.; Asch, S.M.; Chayanupatkul, M.; Cao, Y.; El-Serag, H.B. Risk of hepatocellular cancer in HCV patients treated with direct-acting antiviral agents. Gastroenterology 2017, 153, 996–1005.e1. [Google Scholar] [CrossRef]
- Ng, J.; Wu, J. Hepatitis B- and Hepatitis C-Related Hepatocellular Carcinomas in the United States: Similarities and Differences. Hepat. Mon. 2012, 12, e7635. [Google Scholar] [CrossRef]
- Gomaa, A.; Allam, N.; Elsharkawy, A.; El Kassas, M.; Waked, I. Hepatitis C infection in Egypt: Prevalence, impact and management strategies. Hepat. Med. 2017, 9, 17–25. [Google Scholar] [CrossRef]
- Sung, H.; Ferlay, J.; Siegel, R.L.; Laversanne, M.; Soerjomataram, I.; Jemal, A. Global cancer statistics 2020: GLOBOCAN estimates of incidence and mortality worldwide for 36 cancers in 185 countries. CA A Cancer J. Clin. 2021, 71, 209–249. [Google Scholar] [CrossRef]
- Wang, X.; Zhang, A.; Sun, H. Power of metabolomics in diagnosis and biomarker discovery of hepatocellular carcinoma. Hepatology 2013, 57, 2072–2077. [Google Scholar] [CrossRef]
- Trevisani, F.; D’Intino, P.E.; Morselli-Labate, A.M.; Mazzella, G.; Accogli, E.; Caraceni, P.; Domenicali, M.; Notariis, S.D.; Roda, E.; Bernardi, M. Serum alpha-fetoprotein for diagnosis of hepatocellular carcinoma in patients with chronic liver disease: Influence of HBsAg and anti-HCV status. J. Hepatol. 2001, 34, 570–575. [Google Scholar] [CrossRef]
- Daniele, B.; Bencivenga, A.; Megna, A.S.; Tinessa, V. Alpha-fetoprotein and ultrasonography screening for hepatocellular carcinoma. Gastroenterology 2004, 127 (Suppl. S1), S108–S112. [Google Scholar] [CrossRef]
- Gurakar, A.; Garonzik-Wang, M.M.J.; Kim, A.; Anders, R.A.; Oshima, K.; Georgiades, C.; Gurakar, M.; Ottmann, S.; Cameron, A.M.; Philosophe, B.; et al. Clinicopathological distinction of low-AFP-secreting vs. high-AFP-secreting hepatocellular carcinomas. Ann. Hepatol. 2019, 17, 1052–1066. [Google Scholar] [CrossRef]
- Niu, Z.-S.; Niu, X.-J.; Wang, W.-H. Genetic alterations in hepatocellular carcinoma: An update. World J. Gastroenterol. 2016, 22, 9069–9095. [Google Scholar] [CrossRef]
- Wahid, B.; Ali, A.; Rafique, S.; Idrees, M. New Insights into the Epigenetics of Hepatocellular Carcinoma. BioMed Res. Int. 2017, 2017, 1609575. [Google Scholar] [CrossRef]
- Wang, W.; Wei, C. Advances in the early diagnosis of hepatocellular carcinoma. Genes. Dis. 2020, 7, 308–319. [Google Scholar] [CrossRef]
- Gan, X.; Luo, Y.; Dai, G.; Lin, J.; Liu, X.; Zhang, X.; Li, A. Identification of Gene Signatures for Diagnosis and Prognosis of Hepatocellular Carcinomas Patients at Early Stage. Front. Genet. 2020, 11, 857. [Google Scholar] [CrossRef] [PubMed]
- Huang, Z.; Zhou, J.-K.; Peng, Y.; He, W.; Huang, C. The role of long noncoding RNAs in hepatocellular carcinoma. Mol. Cancer 2020, 19, 77. [Google Scholar] [CrossRef] [PubMed]
- Wang, K.; Guo, W.X.; Li, N.; Gao, C.F.; Shi, J.; Tang, Y.F.; Shen, F.; Wu, M.C.; Liu, S.R.; Cheng, S.Q. Serum LncRNAs profiles serve as novel potential biomarkers for the diagnosis of HBV-positive hepatocellular carcinoma. PLoS ONE 2015, 10, e0144934. [Google Scholar] [CrossRef] [PubMed]
- Motawi, T.M.; El-Maraghy, S.A.; Sabry, D.; Mehana, N.A. The expression of long non coding RNA genes is associated with expression with polymorphisms of HULC rs7763881 and MALAT1 rs619586 in hepatocellular carcinoma and HBV Egyptian patients. J. Cell Biochem. 2019, 120, 14645–14656. [Google Scholar] [CrossRef]
- Plissonnier, M.-L.; Herzog, K.; Levrero, M.; Zeisel, M.B. Non-coding RNAs and hepatitis C virus-induced hepatocellular carcinoma. Viruses 2018, 10, 591. [Google Scholar] [CrossRef]
- Hull, R.; Mbita, Z.; Dlamini, Z. Long non-coding RNAs (LncRNAs), viral oncogenomics, and aberrant splicing events: Therapeutics implications. Am. J. Cancer Res. 2021, 11, 866. [Google Scholar]
- Zhang, H.; Zhu, C.; Zhao, Y.; Li, M.; Wu, L.; Yang, X.; Wan, X.; Wang, A.; Zhang, M.Q.; Sang, X.; et al. Long non-coding RNA expression profiles of hepatitis C virus-related dysplasia and hepatocellular carcinoma. Oncotarget 2015, 6, 43770–43778. [Google Scholar] [CrossRef]
- Marrugo-Ramírez, J.; Mir, M.; Samitier, J. Blood-based cancer biomarkers in liquid biopsy: A promising non-invasive alternative to tissue biopsy. Int. J. Mol. Sci. 2018, 19, 2877. [Google Scholar] [CrossRef]
- Neoplasia, I.C.G.f.H. Pathologic diagnosis of early hepatocellular carcinoma: A report of the international consensus group for hepatocellular neoplasia. Hepatology 2009, 49, 658–664. [Google Scholar]
- Li, Y.; Wang, D.; Zhu, G. Increased expression of long noncoding RNA AK021443 predicts worse clinical outcome in hepatocellular carcinoma. Eur. Rev. Med. Pharmacol. Sci. 2018, 22, 4855–4860. [Google Scholar] [CrossRef] [PubMed]
- Dorak, M.T. Real-Time PCR; Taylor & Francis: Abingdon, UK, 2007. [Google Scholar]
- Bao, Z.; Yang, Z.; Huang, Z.; Zhou, Y.; Cui, Q.; Dong, D. LncRNADisease 2.0: An updated database of long non-coding RNA-associated diseases. Nucleic Acids Res. 2019, 47, D1034–D1037. [Google Scholar] [CrossRef]
- Austin, P.C.; Steyerberg, E.W. Events per variable (EPV) and the relative performance of different strategies for estimating the out-of-sample validity of logistic regression models. Stat. Methods Med. Res. 2017, 26, 796–808. [Google Scholar] [CrossRef]
- Chew, B.H.; Ghazali, S.S.; Ismail, M.; Haniff, J.; Bujang, M.A. Age ≥ 60 years was an independent risk factor for diabetes-related complications despite good control of cardiovascular risk factors in patients with type 2 diabetes mellitus. Exp. Gerontol. 2013, 48, 485–491. [Google Scholar] [CrossRef]
- Chew, B.H.; Mastura, I.; Shariff-Ghazali, S.; Lee, P.Y.; Cheong, A.T.; Ahmad, Z.; Taher, S.W.; Haniff, J.; Mustapha, F.I.; Bujang, M.A. Determinants of uncontrolled hypertension in adult type 2 diabetes mellitus: An analysis of the Malaysian diabetes registry 2009. Cardiovasc. Diabetol. 2012, 11, 54. [Google Scholar] [CrossRef]
- Zhang, Q.; Matsuura, K.; Kleiner, D.E.; Zamboni, F.; Alter, H.J.; Farci, P. Analysis of long noncoding RNA expression in hepatocellular carcinoma of different viral etiology. J. Transl. Med. 2016, 14, 328. [Google Scholar] [CrossRef] [PubMed]
- Liu, W.-T.; Lu, X.; Tang, G.-H.; Ren, J.-J.; Liao, W.-J.; Ge, P.-L.; Huang, J.-F. LncRNAs expression signatures of hepatocellular carcinoma revealed by microarray. World J. Gastroenterol. WJG 2014, 20, 6314. [Google Scholar] [CrossRef]
- Unfried, J.P.; Fortes, P. LncRNAs in HCV infection and HCV-related liver disease. Int. J. Mol. Sci. 2020, 21, 2255. [Google Scholar] [CrossRef]
- Zhang, G.; Chen, X.; Ma, L.; Ding, R.; Zhao, L.; Ma, F.; Deng, X. LINC01419 facilitates hepatocellular carcinoma growth metastasis through targeting EZH2-regulated RECK. Aging 2020, 12, 11071. [Google Scholar] [CrossRef]
- Wang, K.; Li, W.; Liu, Y.; Hao, Z.; Hua, X.; Ma, Z.; Feng, Z. Identification of lncRNA prognostic signature and analysis of their functions for HCV-related hepatocellular carcinoma. Res. Sq. 2020, preprint. [Google Scholar] [CrossRef]
- Wang, Y.; Qiu, W.; Liu, N.; Sun, L.; Liu, Z.; Lv, J. Forkhead box K1 regulates the malignant behavior of gastric cancer by inhibiting autophagy. Ann. Transl. Med. 2020, 2, 107. [Google Scholar] [CrossRef]
- Dang, H.; Chen, L.; Tang, P.; Cai, X.; Zhang, W.; Zhang, R.; Huang, A.; Tang, H. LINC01419 promotes cell proliferation and metastasis in hepatocellular carcinoma by enhancing NDRG1 promoter activity. Cell. Oncol. 2020, 43, 931–947. [Google Scholar] [CrossRef] [PubMed]
- Choi, K.K.; Kim, S.H.; Choi, S.B.; Lim, J.H.; Choi, G.H.; Choi, J.S.; Kim, K.S. Portal venous invasion: The single most independent risk factor for immediate postoperative recurrence of hepatocellular carcinoma. J. Gastroenterol. Hepatol. 2011, 26, 1646–1651. [Google Scholar] [CrossRef] [PubMed]
- Wu, J.j.; Zhang, Z.g.; Zhu, P.; Zhang, B.x.; Chen, X.p.; Shu, C.; Zhang, W.; Feng, R.; Li, G. Comparative liver function models for ruptured hepatocellular carcinoma: A 10-year single center experience. Asian J. Surg. 2019, 42, 874–882. [Google Scholar] [CrossRef] [PubMed]
- Wang, Y.Y.; Zhao, X.H.; Ma, L.; Ye, J.Z.; Wu, F.X.; Tang, J.; You, X.; Xiang, B.; Li, L. Comparison of the ability of Child-Pugh score, MELD score, and ICG-R15 to assess preoperative hepatic functional reserve in patients with hepatocellular carcinoma. J. Surg. Oncol. 2018, 118, 440–445. [Google Scholar] [CrossRef]
- Zhao, S.; Wang, M.; Yang, Z.; Tan, K.; Zheng, D.; Du, X.; Liu, L. Comparison between Child-Pugh score Albumin-Bilirubin grade in the prognosis of patients with HCC after liver resection using time-dependent ROC. Ann. Transl. Med. 2020, 8, 539. [Google Scholar] [CrossRef]


| Controls (no = 120) | Non Treated HCV (no = 194) | HCC (no = 120) | p Value for Test of Sig | Post Hoc Test | Effect Size | ||||
|---|---|---|---|---|---|---|---|---|---|
| Mean ± SD | Mean ± SD | Mean ± SD | |||||||
| Age (years) | 56.57 ± 6.42 | 56.33 ± 7.92 | 58.02 ± 7.32 | 0.126 | P1 = 0.958, P2 = 0.280, P3 = 0.120 | - | |||
| Sex: no, % | - | - | |||||||
| Male | 78 | 65.0 | 136 | 70.1 | 92 | 76.7 | 0.138 | ||
| Female | 42 | 35.0 | 58 | 29.9 | 28 | 23.3 | |||
| Smoking: no, % | 24 | 20.0 | 50 | 25.8 | 40 | 33.3 | 0.062 | - | - |
| Diabetes Mellitus: no, % | 20 | 16.7 | 31 | 16.0 | 45 | 37.5 | <0.001 * | - | - |
| Hypertension: no, % | 17 | 14.2 | 35 | 18.0 | 48 | 40.0 | <0.001 * | - | - |
| Hb (gm/dL) | 13.5 ± 0.7 | 12.1 ± 1.8 | 10.6 ± 1.4 | <0.001 * | P1, P2, P3 < 0.001 | −0.481 [(−0.527)–(−0.431)] | |||
| TLC × 103 | 6.8 ± 0.5 | 6.0 ± 1.5 | 5.3 ± 1.3 | <0.001 * | P1, P2, P3 < 0.001 | −0.359 [(−0.412)–(−0.303)] | |||
| Platelets × 103 | 251.7 ± 28.0 | 164.4 ± 51.7 | 136.9 ± 47.2 | <0.001 * | P1, P2, P3 < 0.001 | −0.544 [(−0.586)–(−0.498)] | |||
| Pt | 89.0 ± 9.5 | 82.7 ± 11.5 | 72.4 ± 14.7 | <0.001 * | P1, P2, P3 < 0.001 | −0.361 [(−0.414)–(−0.306)] | |||
| INR | 1.1 ± 0.1 | 1.4 ± 0.3 | 1.4 ± 0.2 | <0.001 * | P1, P2 < 0.001, P3 = 0.607 | 0.321 [0.264–0.376] | |||
| ALT | 23 [19–25] | 52.5 [38–61] | 51 [44–60] | <0.001 * | P1, P2 < 0.001, P3 = 0.407 | 0.478 [0.428–0.524] | |||
| AST | 23 [21–27] | 45 [38–59] | 55 [46.65] | <0.001 * | P1, P2, P3 < 0.001 | 0.549 [0.5047–0.591] | |||
| ALP | 77 [65–91] | 127 [95–187] | 160 [122.7–231] | <0.001 * | P1, P2, P3 < 0.001 | 0.508 [0.460–0.553] | |||
| GGT | 27 [25–31.7] | 128 [55–155] | 173 [80–217] | <0.001 * | P1, P2, P3 < 0.001 | 0.592 [0.550–0.631] | |||
| AFP | 4.5 [3–6] | 12.5 [3–31.4] | 135.3 [13.5–416.3] | <0.001 * | P1, P2, P3 < 0.001 | 0.479 [0.430–0.526] | |||
| CEA | 4.2 [2.99–5.4] | 6.9 [3.9–8.9] | 13.3 [6–20] | <0.001 * | P1, P2, P3 < 0.001 | 0.439 [0.388–0.488] | |||
| Alb | 3.9 ± 0.4 | 4.3 ± 0.4 | 3.5 ± 0.6 | <0.001 * | P1, P2, P3 < 0.001 | −0.207 [(−0.266)–(−0.146)] | |||
| T. Bilirubin | 0.6 ± 0.1 | 0.7 ± 0.1 | 1.1 ± 0.1 | <0.001 * | P1, P2, P3 < 0.001 | 0.654 [0.617–0.688] | |||
| D. Bilirubin | 0.17 ± 0.02 | 0.38 ± 0.12 | 0.50 ± 0.15 | <0.001 * | P1, P2, P3 < 0.001 | 0.641 [0.603–0.676] | |||
| BUN | 11.5 ± 1.6 | 11.4 ± 1.7 | 11.0 ± 2.9 | 0.059 | P1 = 0.995, P2 = 0.374, P3 = 0.423 | −0.071 [(−0.133)–(−0.009)] | |||
| Creatinine | 0.7 ± 0.1 | 0.9 ± 0.2 | 1.1 ± 0.1 | <0.001 * | P1, P2, P3 < 0.001 | 0.571 [0.528–0.612] | |||
| AK021443 | 1.01 [0.93–1.09] | 2.55 [1.38–4.06] | 29.34 [21.59–33.84] | <0.001 * | P1, P2, P3 < 0.001 | 0.696 [0.663–0.727] | |||
| LINCO01419 | 1.06 [1–1.12] | 4.05 [1.65–30.53] | 320.57 [134.4–1118.3] | <0.001 * | P1, P2, P3 < 0.001 | 0.688 [0.654–0.720] | |||
| AF070632 | 1.10 [0.98–1.3] | 0.74 [0.56–0.94] | 0.56 [0.46–0.65] | <0.001 * | P1, P2, P3 < 0.001 | −0.553 [(−0.595)–(−0.509)] | |||
| HCC | ||||||
|---|---|---|---|---|---|---|
| AK021443 | LINC01419 | AF070632 | ||||
| rs | p Value | rs | p Value | rs | p Value | |
| Hb (gm/dL) | −0.040 | 0.665 | −0.109 | 0.238 | −0.033 | 0.717 |
| TLC × 103 | 0.218 | 0.017 * | 0.043 | 0.640 | −0.040 | 0.666 |
| Platelets × 103 | 0.218 | 0.017 * | −0.003 | 0.976 | −0.230 | 0.011 * |
| Pt | 0.004 | 0.964 | 0.044 | 0.633 | −0.156 | 0.089 |
| INR | 0.073 | 0.430 | −0.056 | 0.546 | −0.041 | 0.660 |
| ALT | −0.291 | 0.001 * | 0.092 | 0.315 | 0.080 | 0.383 |
| AST | −0.224 | 0.014 * | 0.041 | 0.656 | 0.092 | 0.317 |
| ALP | −0.057 | 0.533 | 0.034 | 0.712 | 0.099 | 0.281 |
| GGT | 0.065 | 0.484 | 0.084 | 0.359 | −0.066 | 0.477 |
| AFP | 0.075 | 0.417 | 0.456 | <0.001 * | −0.228 | 0.012 * |
| CEA | −0.019 | 0.840 | 0.101 | 0.271 | −0.012 | 0.900 |
| Alb | 0.043 | 0.637 | 0.120 | 0.193 | −0.232 | 0.011 * |
| T. Bilirubin | −0.028 | 0.765 | 0.089 | 0.333 | −0.245 | 0.007 * |
| D. Bilirubin | −0.224 | 0.014 * | −0.110 | 0.233 | −0.017 | 0.850 |
| BUN | 0.035 | 0.706 | −0.165 | 0.072 | 0.103 | 0.261 |
| Viral load | 0.567 | <0.001 * | 0.091 | 0.322 | −0.121 | 0.187 |
| Child Pugh | 0.036 | 0.699 | 0.278 | 0.002 * | −0.184 | 0.045 * |
| LINC01419 | 0.133 | 0.148 | - | - | - | - |
| AF070632 | −0.116 | 0.209 | −0.314 | <0.001 * | - | - |
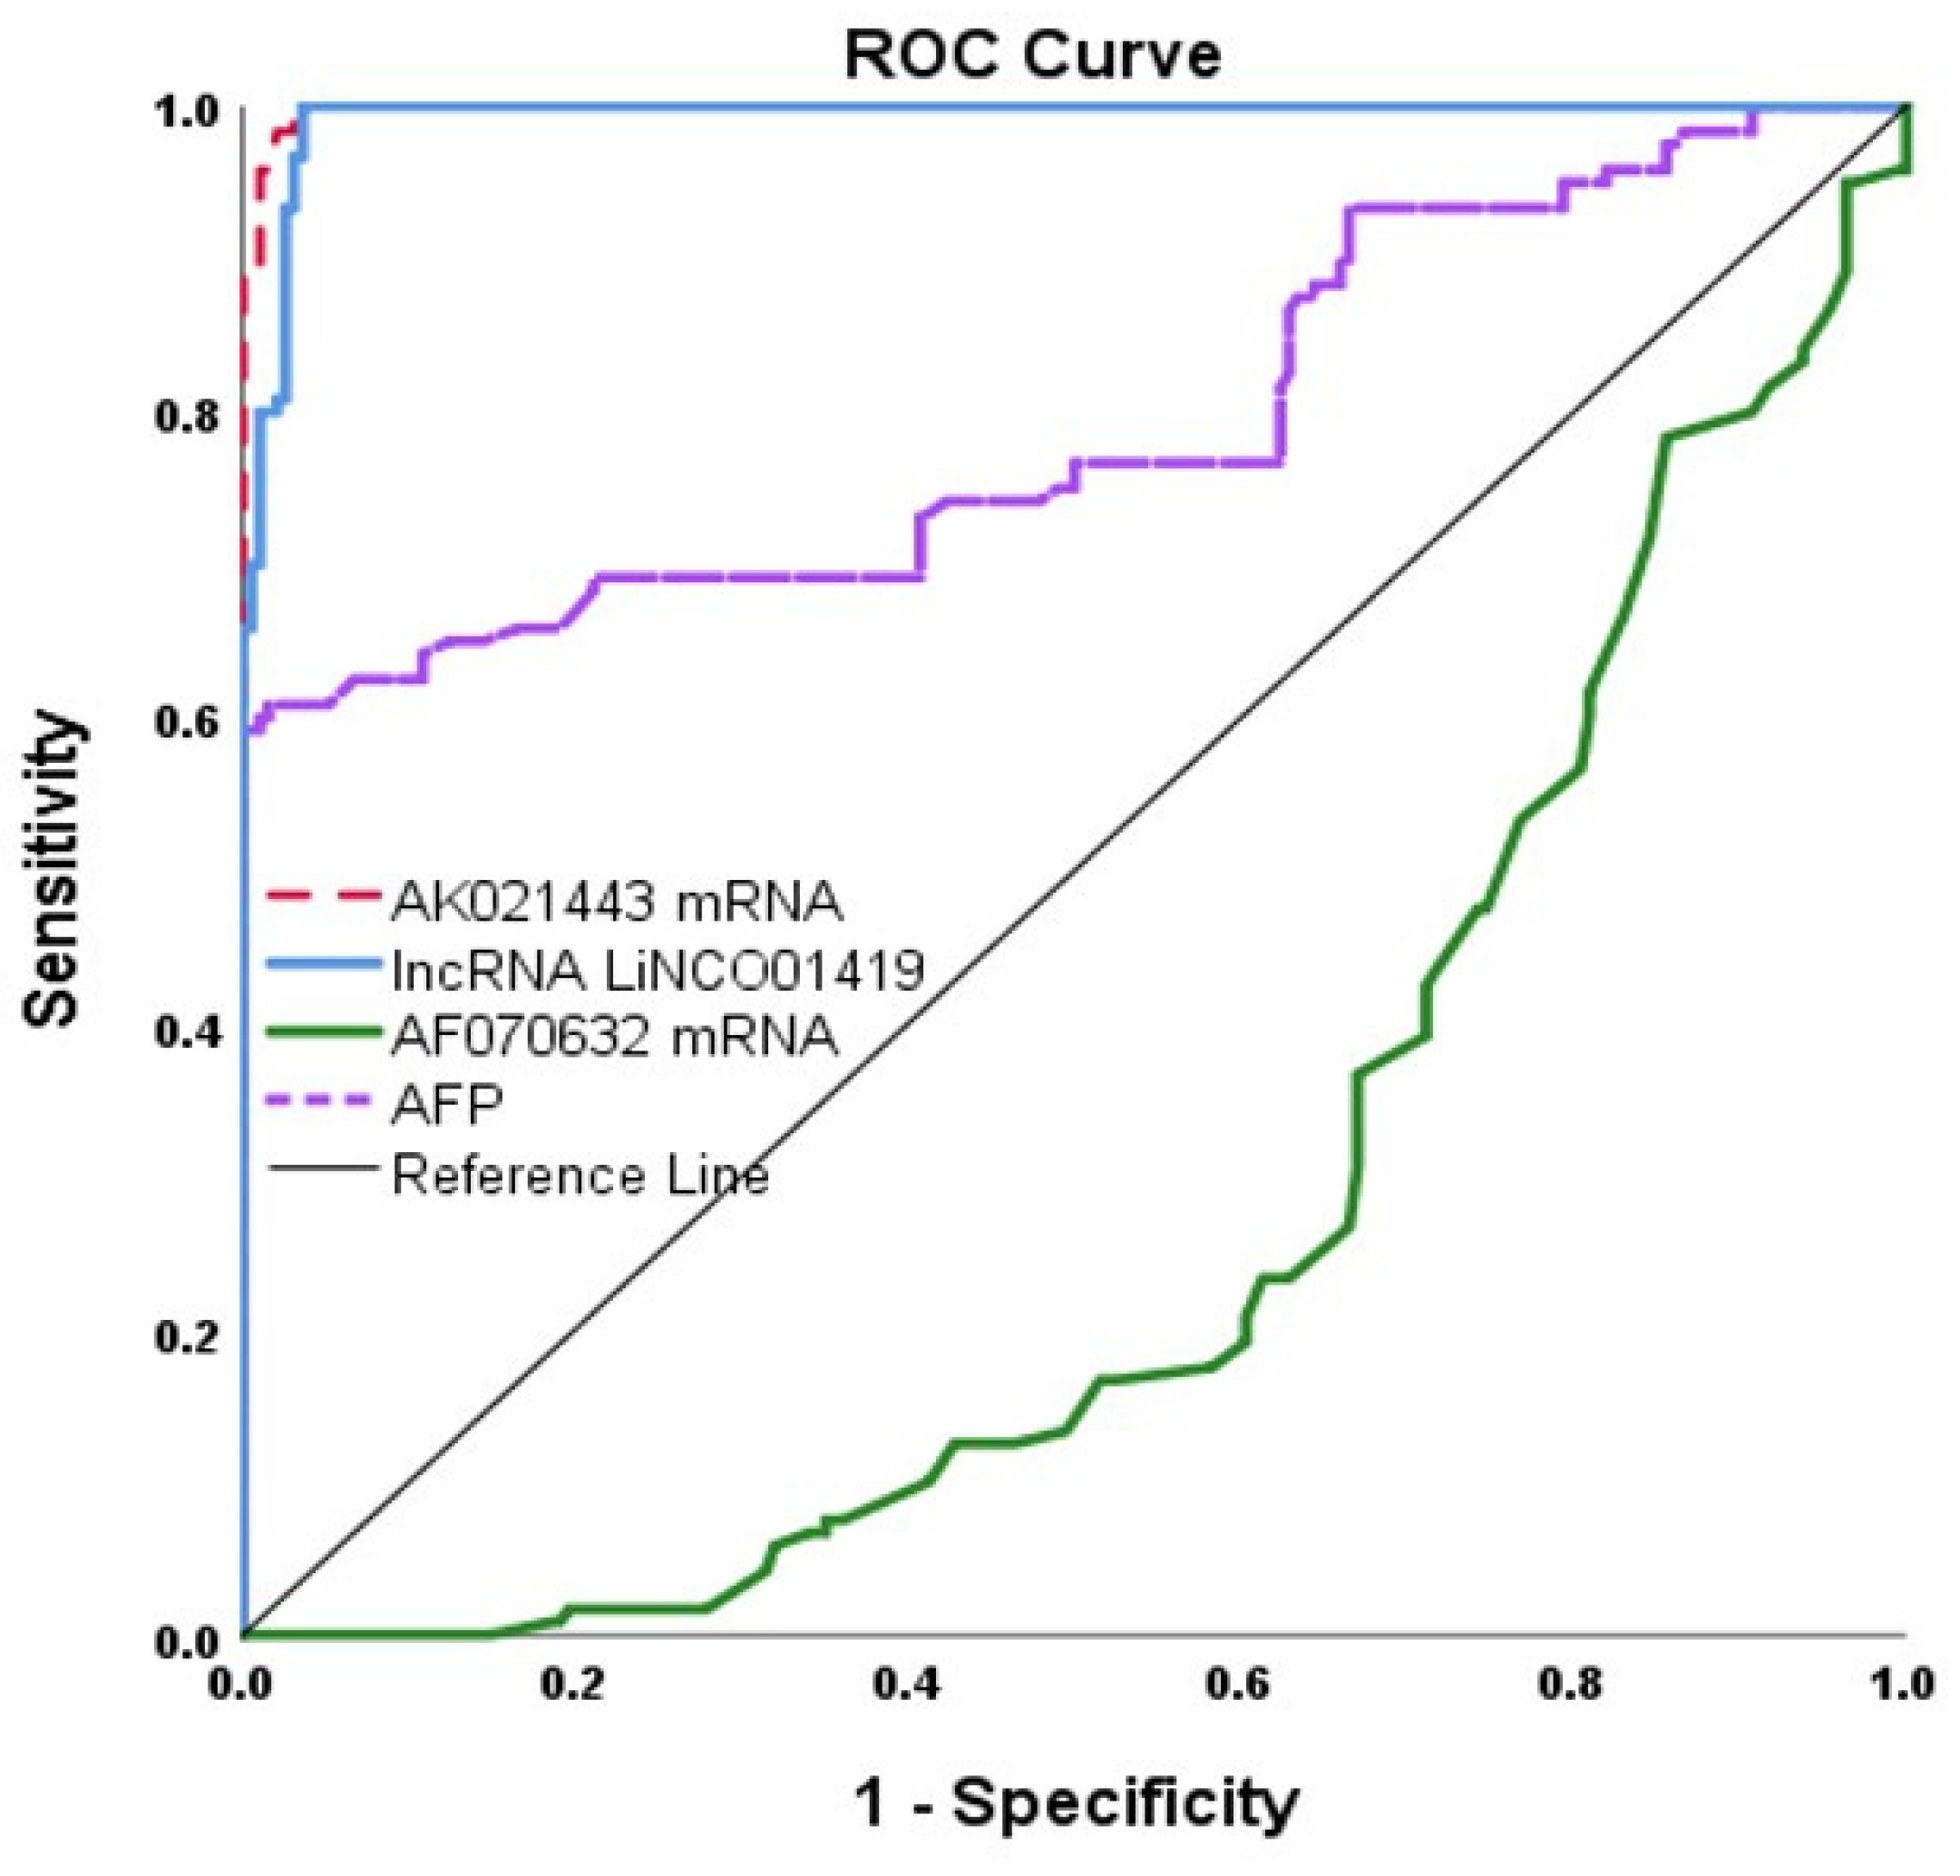
| HCC vs. Non Treated HCV | ||||
|---|---|---|---|---|
| AK021443 | LINC01419 | AF070632 | AFP | |
| AUC | 0.998 [0.996–1.0] | 0.993 [0.987–0.999] | 0.725 [0.670–0.780] | 0.792 [0.735–0.849] |
| Cutoff point | ≥12.97 | ≥91.84 | ≤0.68 | >16.96 |
| Sensitivity% | 100 [96–100] | 100 [96–100] | 81 [72–87] | 73 [64.5–81] |
| Specificity% | 97 [91–99] | 97 [91–99] | 60 [51–69] | 59 [52–66] |
| PPV% | 98 [96–99] | 98 [96–99] | 70 [64–76] | 53 [45–60] |
| NPV% | 97 [91–99] | 97 [91–99] | 67 [59–74] | 78 [71–85] |
| Accuracy | 100 [96–100] | 100 [96–100] | 76 [66–84] | 65 [59–70] |
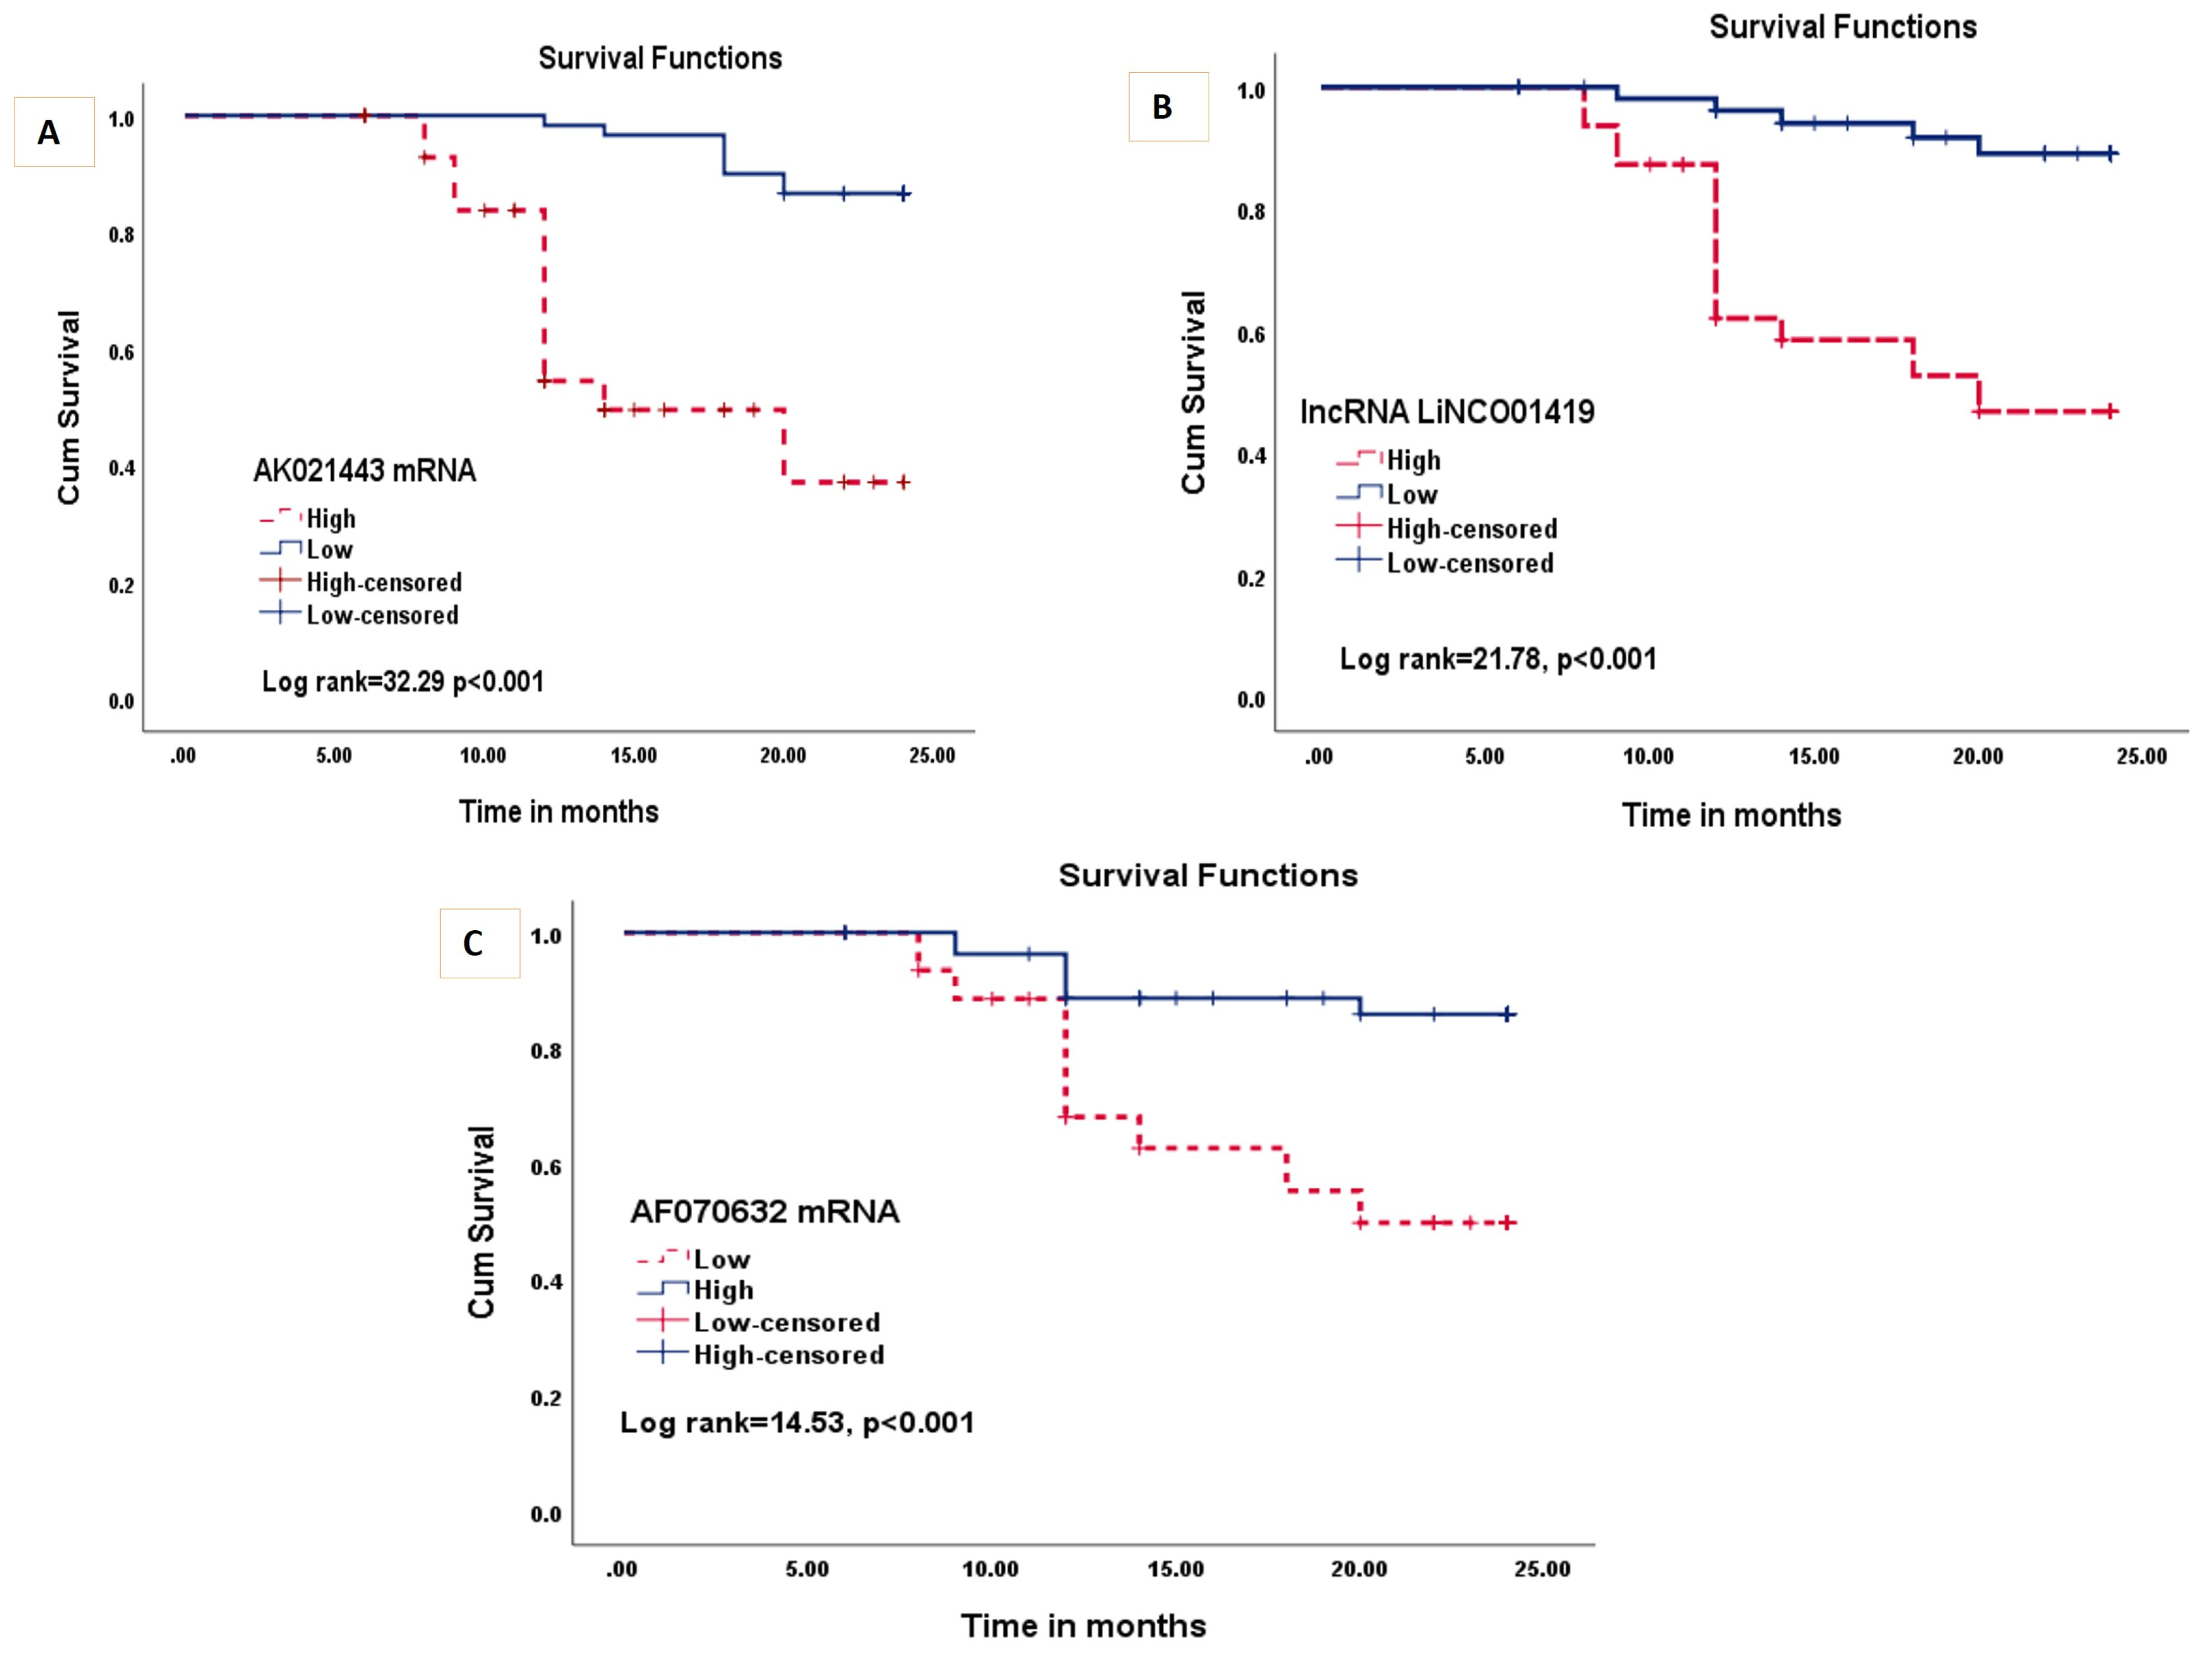
| Univariate Survival Analysis | Multivariate Analysis | |||
|---|---|---|---|---|
| HR [CI 95%] | p Value | HR [CI 95%] | p Value | |
| Age (≥60) | 1.71 [0.88–3.33] | 0.113 | - | - |
| Sex (male) | 3.12 [1.10–8.83] | 0.032 * | 1.14 [0.35–3.70] | 0.823 |
| Co-morbidity | 3.41 [0.81–14.24] | 0.092 | - | - |
| Portal invasion | 1.95 [1.0–3.80] | 0.048 * | 2.20 [1.05–4.60] | 0.037 * |
| CEA (High) | 1.78 [0.90–3.53] | 0.095 | - | - |
| Child Pugh | ||||
| A | 1.0 | - | ||
| B | 4.95 [0.61–34.27] | 0.137 | 4.24 [0.84–21.22] | 0.079 |
| C | 23.0 [3.01–175.53] | 0.002 * | 9.97 [1.96–50.58] | 0.005 * |
| MELD (High) | 1.46 [0.75–2.83] | 0.255 | - | - |
| AFP (High) | 3.44 [1.61–7.34] | 0.001 * | 1.66 [0.67–4.10] | 0.268 |
| AK021443 (High expression) | 7.42 [3.26–16.88] | <0.001 * | 10.06 [3.36–30.07] | <0.001 * |
| LINCO01419 (High expression) | 6.50 [2.52–16.75] | <0.001 * | 4.13 [1.32–12.86] | 0.014 * |
| AF070632 (Low expression) | 4.11 [1.80–9.40] | <0.001 * | 2.70 [1.07–6.81] | 0.035 * |
Disclaimer/Publisher’s Note: The statements, opinions and data contained in all publications are solely those of the individual author(s) and contributor(s) and not of MDPI and/or the editor(s). MDPI and/or the editor(s) disclaim responsibility for any injury to people or property resulting from any ideas, methods, instructions or products referred to in the content. |
© 2023 by the authors. Licensee MDPI, Basel, Switzerland. This article is an open access article distributed under the terms and conditions of the Creative Commons Attribution (CC BY) license (https://creativecommons.org/licenses/by/4.0/).
Share and Cite
Abdelsattar, S.; Fahim, S.A.; Kamel, H.F.M.; Al-Amodi, H.; Kasemy, Z.A.; Khalil, F.O.; Abdallah, M.S.; Bedair, H.M.; Gadallah, A.-N.A.-A.; Sabry, A.; et al. The Potential Role of Circulating Long Miscellaneous RNAs in the Diagnosis and Prognosis of Hepatitis C Related Hepatocellular Carcinoma. Non-Coding RNA 2023, 9, 62. https://doi.org/10.3390/ncrna9050062
Abdelsattar S, Fahim SA, Kamel HFM, Al-Amodi H, Kasemy ZA, Khalil FO, Abdallah MS, Bedair HM, Gadallah A-NA-A, Sabry A, et al. The Potential Role of Circulating Long Miscellaneous RNAs in the Diagnosis and Prognosis of Hepatitis C Related Hepatocellular Carcinoma. Non-Coding RNA. 2023; 9(5):62. https://doi.org/10.3390/ncrna9050062
Chicago/Turabian StyleAbdelsattar, Shimaa, Sally A. Fahim, Hala F. M. Kamel, Hiba Al-Amodi, Zeinab A. Kasemy, Fatma O. Khalil, Mahmoud S. Abdallah, Hanan M. Bedair, Abdel-Naser Abdel-Atty Gadallah, Aliaa Sabry, and et al. 2023. "The Potential Role of Circulating Long Miscellaneous RNAs in the Diagnosis and Prognosis of Hepatitis C Related Hepatocellular Carcinoma" Non-Coding RNA 9, no. 5: 62. https://doi.org/10.3390/ncrna9050062