
High Energy Density Primary Lithium Battery with Fluorinated S-Doped Graphene
by
 , and
, and
Marie Colin
1,
Hani Farhat
1,
Sam Chen
2,
Elodie Petit
1,
Emmanuel Flahaut
3 ,
,
Katia Guérin
1 and
Marc Dubois
1,* 1
Institut de Chimie de Clermont-Ferrand (UMR 6296), CNRS, Université Clermont Auvergne, BP 10448, F-63178 Aubière, France
2
School of Environmental and Life Sciences, The University of Newcastle, Callaghan, NSW 2308, Australia
3
CIRIMAT, Université Toulouse 3 Paul Sabatier, Toulouse INP, CNRS, Université de Toulouse, 118 Route de Narbonne, CEDEX 09, F-31062 Toulouse, France
*
Author to whom correspondence should be addressed.
C 2024, 10(1), 3; https://doi.org/10.3390/c10010003
Submission received: 8 October 2023
/
Revised: 16 November 2023
/
Accepted: 5 December 2023
/
Published: 25 December 2023
(This article belongs to the Special Issue Nanoporous Carbons for Hydrogen Sorption and Electrochemical Energy Storage)
Abstract
:Sulphur-doped graphene was fluorinated using molecular fluorine (F2). First, the fluorination conditions were adapted in order to be mild enough to maintain S in the carbon lattice and form S-F bonds. An unusually weakened C-F bonding for an F/C ratio of 0.71 was then achieved, which allowed enhanced performances when used as a cathode in primary lithium batteries. The material prepared at a moderate fluorination temperature of 70 °C for a period of 60 min exhibits a high mid-discharge reduction potential of 3.11 V at 10 mA/g and a power density of 3605 W/kg at a discharge rate of 2C. These electrochemical properties make the fluorine/sulfur co-doped graphene a promising material.
Keywords:
graphene; Co-doping; S-doping; fluorinated carbons; fluorination; primary lithium battery; cathode1. Introduction
An expanded and/or nanometric structure can improve electrochemical performances, in particular by ensuring better ionic diffusion during the electrochemical reactions. In addition to a nanometric structure favorable to ionic diffusion, the electron density can be modulated by the presence of heteroelements, i.e., doping. For carbonaceous (nano)materials, the heteroelements most commonly used for doping are nitrogen and sulfur, and more rarely phosphorus and boron. In the present work, commercial graphene is used as the carbon matrix in order to combine both homogeneous doping and nanometric size. The presence of nitrogen atoms in graphene increases the conductivity of the material by creating active sites that will favor electron transfer [1]. These atoms can be linked to carbons in different ways: (i) forming a pyrrole type, an aromatic ring of five atoms, one of which is nitrogen; (ii) giving a pyridine type when nitrogen substitutes carbon in a benzene ring at the edge of pinholes or the edge of graphene sheets; or (iii) forming a graphitic type by substituting a carbon atom within the graphitic network [2,3]. Co-doping is possible when multiple types of heteroatoms are introduced into graphene, such as N, F or P, F co-doped graphene. It has been found that the doping of graphene with nitrogen or phosphorus leads to the weakening of C-F bonds [3,4]. N, S co-doping led to the surface defluorination of fluorinated carbons (CFx) with weakened covalent C-F bonds [5]. To the best of our knowledge, studies on doping fluorinated graphene do not show evidence of bond formation between the N, P, or S heteroatom and fluorine [3,6].
Carbons doped with heteroatoms such as nitrogen, phosphorus, or boron are widely used for energy storage [4,5,7,8,9,10,11]. In particular, boron-doped fluorinated graphene (B-CFx) delivers high capacities of up to 1200 mAh/g at 0.01C thanks to the defects created by the boron atoms in the graphene, which allow Li+ ions to adsorb onto the defects, giving extra capacity [7]. B-CFx then delivers a very high energy density of 2974 Wh/kg. Boron doping makes it possible to increase the fluorination rate while maintaining electrochemically active C-F bonds, preferably with weakened covalency, in order to guarantee a high reduction potential. Some research has been performed on sulfur doping. SF6 has been used as a fluorinating agent for the preparation of fluorine and sulfur co-doped amorphous carbon films and fluorine and sulfur co-doped suspended sulfur graphene [12,13]; only covalent C-F bonds were formed, and sulfur was present in C-S-C groups, but no S-F bonds were formed. Peng et al. incorporated sulfur by manual grinding into fluorinated graphene, which formed C=S bonds [11]. In the present work, the direct gas/solid fluorination of sulfur-doped graphene was investigated with molecular fluorine gas (F2). It should be noted that fluorine/sulfur-doped materials have not been tested as cathodes in lithium batteries yet.
Fluorinated graphene exhibits electronic, thermal, and even tribological properties that differ from graphene, making it suitable for use in energy storage systems. The most common route of preparation for fluorinated graphene involves exfoliating fluorinated graphite (top-down approach). Bottom-up methods such as direct gaseous fluorination, plasma fluorination with CF4 or SF6, etc., are also used [14,15,16,17], as well as liquid-phase fluorination using solvents [18,19,20]. Fluorinated graphene can be obtained using graphite oxide as a precursor. The first work on fluorinating graphite oxide with molecular fluorine was carried out by Nakajima et al. [21]. The graphite oxide was also fluorinated with hydrofluoric acid at high temperatures [22]. Graphite oxide (GO) is composed of stacked sheets of graphene oxide (GO) and can be exfoliated to isolate those sheets. The shaping of graphene oxide films produces a light, flexible, and self-supporting material that can be used in energy storage systems. The presence of oxygen in CFx can improve electrochemical performance; Mar et al. obtained higher potentials and capacities in the simultaneous presence of oxygen and fluorine, leading to increased mass-energy densities of 2398 Wh/kg compared with only 835 Wh/kg for a conventional CFx without oxygen [23]. We then seek to take advantage of the simultaneous presence of two heteroelements and sulfur in the present work.
After fluorinating the commercial sulfur-doped graphene with molecular fluorine gas sulfur, the product was characterized to study the morphology, structure, elemental distribution, and quantity of the heteroelements (sulfur, oxygen, and fluorine) within the material and the bonds formed after fluorination. Finally, they will be studied as a cathode electrode in a primary lithium battery in order to evidence the possible improvements thanks to the presence of both S and F.
2. Materials and Methods
2.1. Fluorination of Sulfur-Doped Graphene
Sulfur-doped graphene (Sigma Aldrich, Saint Louis, MO, USA) consists of 85–95% carbon, 2.0–4.0% sulfur, and less than 7.5% oxygen, according to the supplier’s data. Sulfur-doped graphene (S-graphene) was fluorinated by static fluorination with molecular fluorine gas using the following procedure: fluorine gas was introduced into the reactor to obtain a relative pressure of 0.5 bar, and the reactor was then filled with nitrogen until atmospheric pressure was reached. An F2/N2 gas mixture (50/50 %vol.) was used for different fluorination temperatures and durations (Table 1). S-doped graphene exhibits both a low crystalline order and a high specific surface area (>500 m2/g according to the product specification) that induce high reactivity towards molecular fluorine [24]; so, dilution of F2 and the low fluorination temperature in the 25–140 °C range were used. The color of the compound changed from black to brown as the fluorination temperature increased, as is generally observed for CFx [25].
2.2. Physico-Chemical Characterization
X-ray diffraction (XRD) patterns were recorded using a PANalytical X’PERT X-ray diffractometer with Cu(Kα) radiation. FTIR experiments were conducted with a Nicolet Summit (Thermoscientific, Waltham, MA, USA) spectrometer in an Attenuated Total Reflection (ATR) mode. For each spectrum, 128 scans with 4 cm−1 resolution were collected between 4000 and 450 cm−1. 19F and 13C solid-state NMR experiments were performed using a 300 MHz Bruker Avance spectrometer at room temperature. A cross-polarization (CP)/magic-angle spinning (MAS) NMR probe operating with 2.5 mm and 4 mm rotors was used at 30 kHz and 10 kHz spinning rates for 19F and 13C measurements, respectively. A probe (Bruker, Billerica, MA, USA) with fluorine decoupling on a 4 mm rotor was used. For MAS spectra, a simple sequence was performed with a single π/2 pulse length of 4.0 and 3.5 μs for 19F and 13C, respectively. 13C NMR was performed at a frequency of 73.4 MHz, and tetramethylsilane (TMS) was used as the reference. 19F NMR was carried out with a frequency of 282.2 MHz and the spectra were externally referenced to CF3COOH, and then to CFCl3 (δCF3COOH = −78.5 ppm/CFCl3). Transmission Electron Microscopy (TEM) samples were prepared with chloroform and ultrasonication. TEM analysis was performed using a JEOL JEM-F200 Multi-Purpose FEG-S/TEM operating at an accelerating voltage of 200 kV. X-ray photoelectron spectroscopy (XPS) spectra were recorded using an ESCALAB 250 Xi, Thermo Scientific, with a monochromated Al K alpha X-ray source (1486.68 eV) and a pass energy of 100 eV and a step energy of 1 eV for survey scans or 20 eV and a step energy of 0.1 eV for region scans. An electrochemical study was performed using both cyclic voltammetry and galvanostatic discharge. The positive electrode of the powdered fluorinated S-graphene compound was composed of the sample (80 wt.%, 2–3 mg), acetylene black (from Mersen, Courbevoie, France, 10 wt.%), to ensure the electronic conductivity and polyvinylidene difluoride (PVDF from Aldrich, 10 wt.%) as the binder. After stirring in propylene carbonate (PC), the mixture was spread uniformly onto a stainless-steel current-collector disk 12 mm in diameter. After PC evaporation, the disk was heated under vacuum at 40 °C and then 120 °C, for 1 h at each temperature, to remove traces of both water and solvent. The electrolyte was composed of lithium hexafluorophosphate (LiPF6) salt dissolved in a mixture of propylene carbonate/ethylene carbonate/dimethyl carbonate (PC:EC:3DMC; 1:1:3 vol%). Three Celgard separators impregnated with the electrolyte were placed between the electrodes, and a lithium foil was used both as counter and reference electrodes. The button cells (CR2032) were assembled in an argon-filled dried glove box. Relaxation was performed for 5 h before any electrochemical process. Then, cyclic voltammetry was carried out at a scan rate of 0.01 mV.s−1 in the potential range between 1.5 V and 4.0 V at room temperature. Galvanostatic discharge curves were recorded at 10 mA/g until 1.5 V. Power tests were performed at different discharge rates considering 1C = 751 mA/g. The tests were carried out using an MPG apparatus from Biologic. For post-mortem 19F NMR analysis, the cell was opened in an argon-filled dried glove box, and the electrode was rinsed with PC and dried before analysis.
3. Results
3.1. Physico-Chemical Characterization
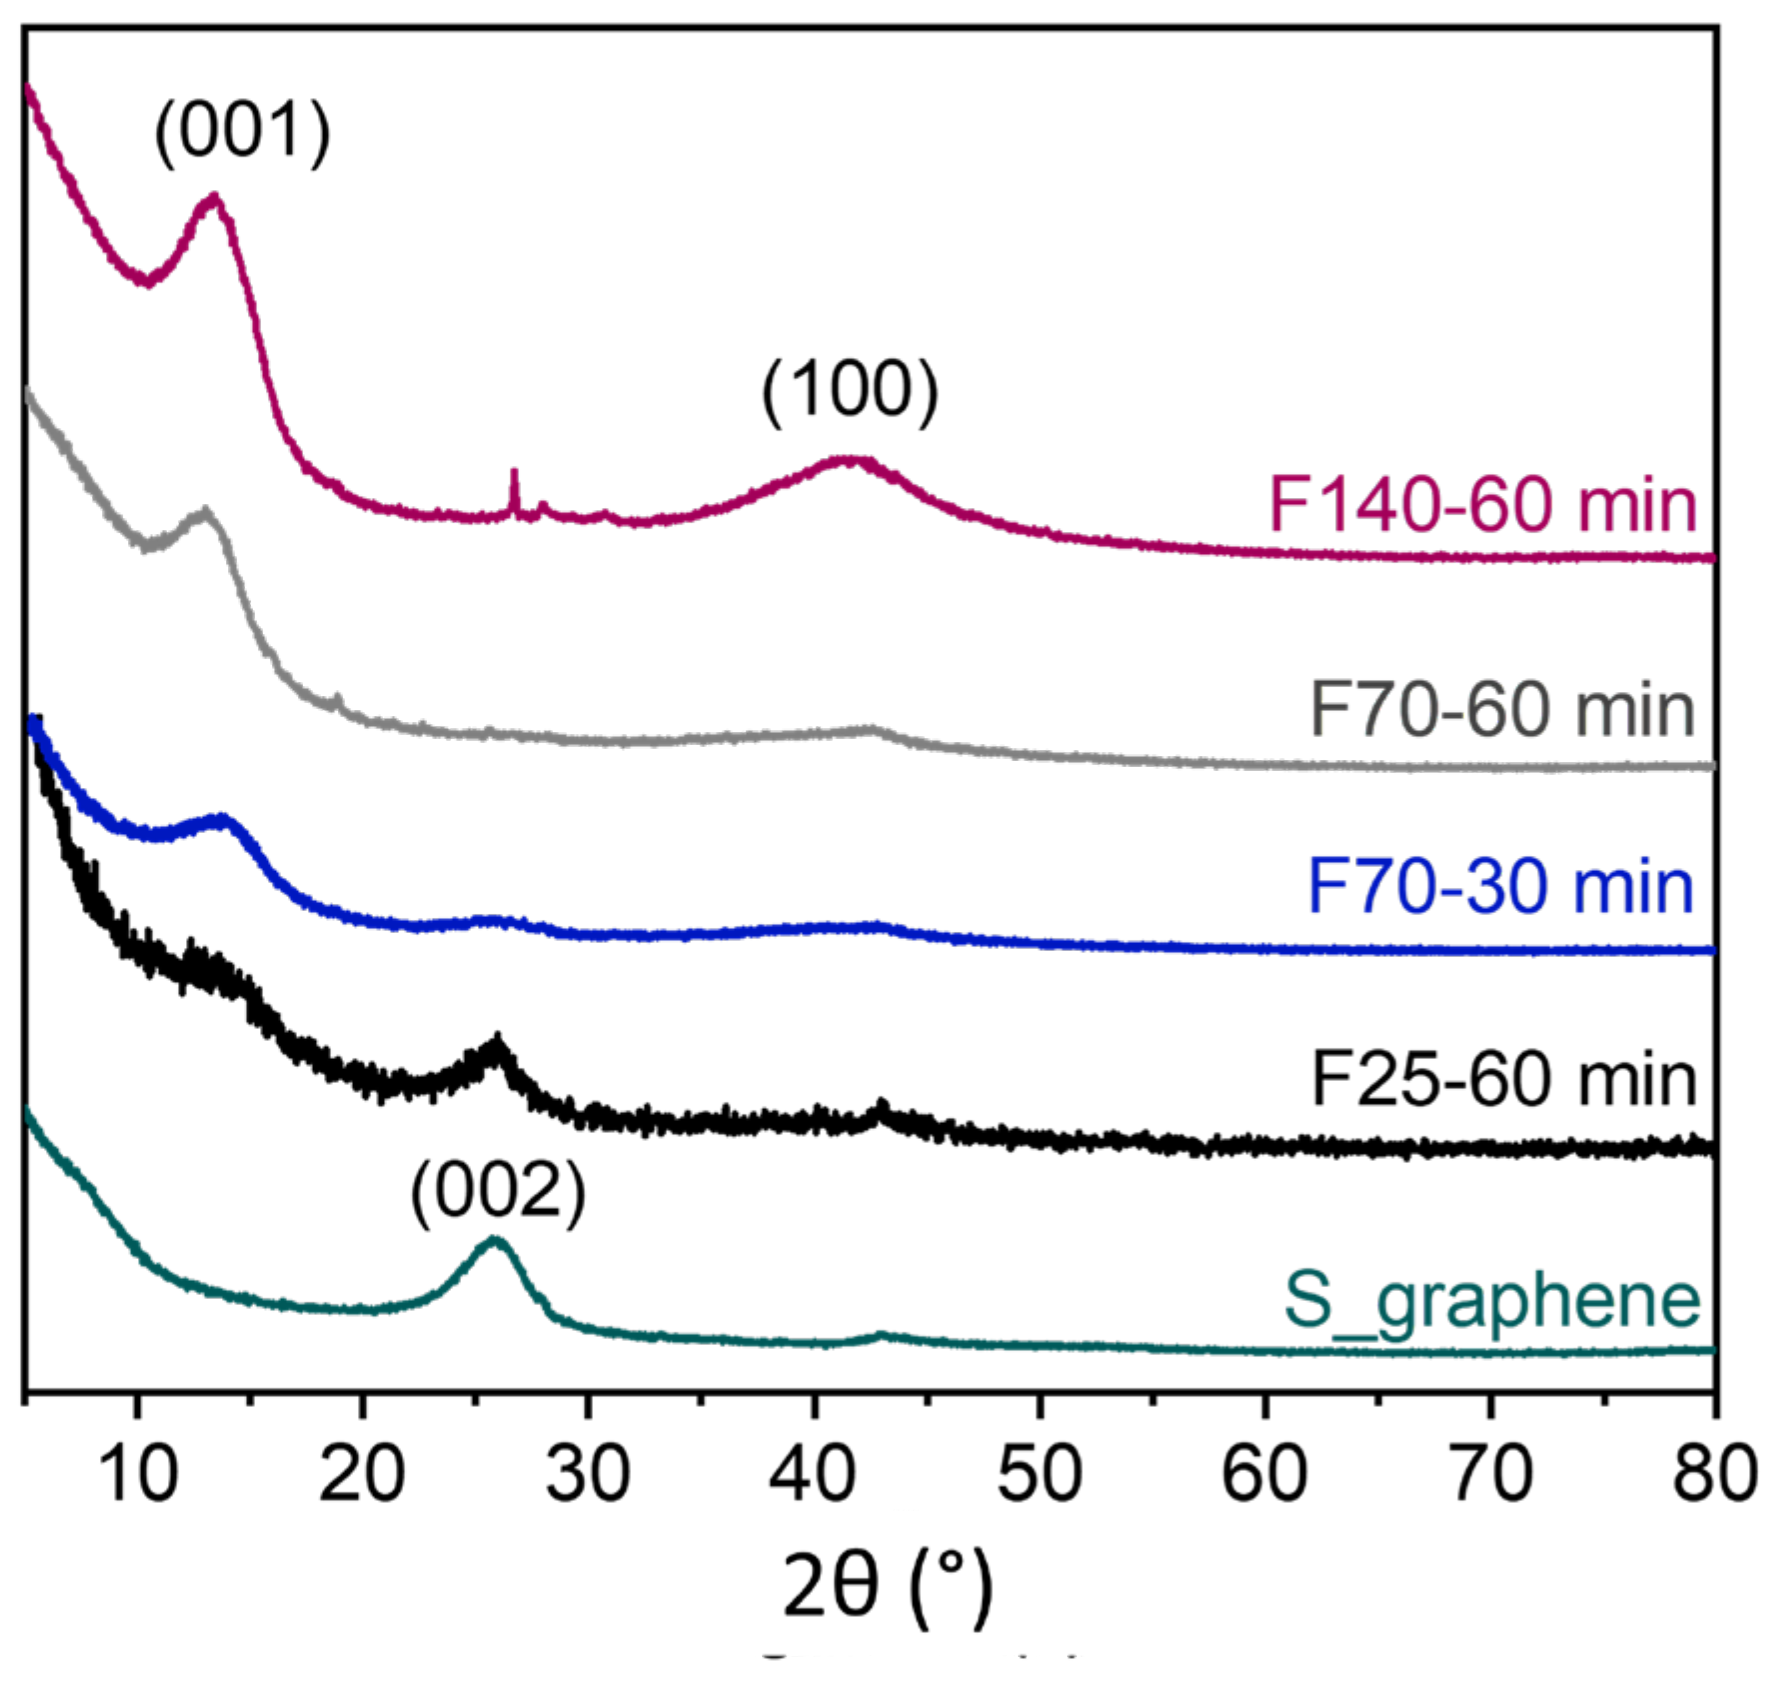
X-ray diffractograms of S-graphene before and after fluorination are shown in Figure 1. Before fluorination, the S-graphene compound shows a diffraction peak at 25.9° for the (002) plane of the initial graphitic matrix. The planes diffract at an angle close to that of graphite (2θ~26.5°), which means that the S-graphene compound is not of a single-layer type but is rather multi-layer. The width of the peak and its lower intensity compared with graphite show that the material exhibits a weakly crystallized structure [26]. In other words, the compound has a lower degree of stacking order between the layers. The peak corresponding to the (002) plane is retained for the F25-60 min compound but has slightly shifted towards a smaller angle value, indicating a d-spacing of 0.36 nm for F25-60 min (compared to 0.35 nm for S-graphene). A new broad diffraction peak appeared near 14°; however, the fluorocarbon matrix is only slightly present in this material, demonstrating that fluorination is not very pronounced. From a fluorination temperature of 70 °C, the (002) peak of a stacked graphene phase disappears, evidencing the completion of fluorination.
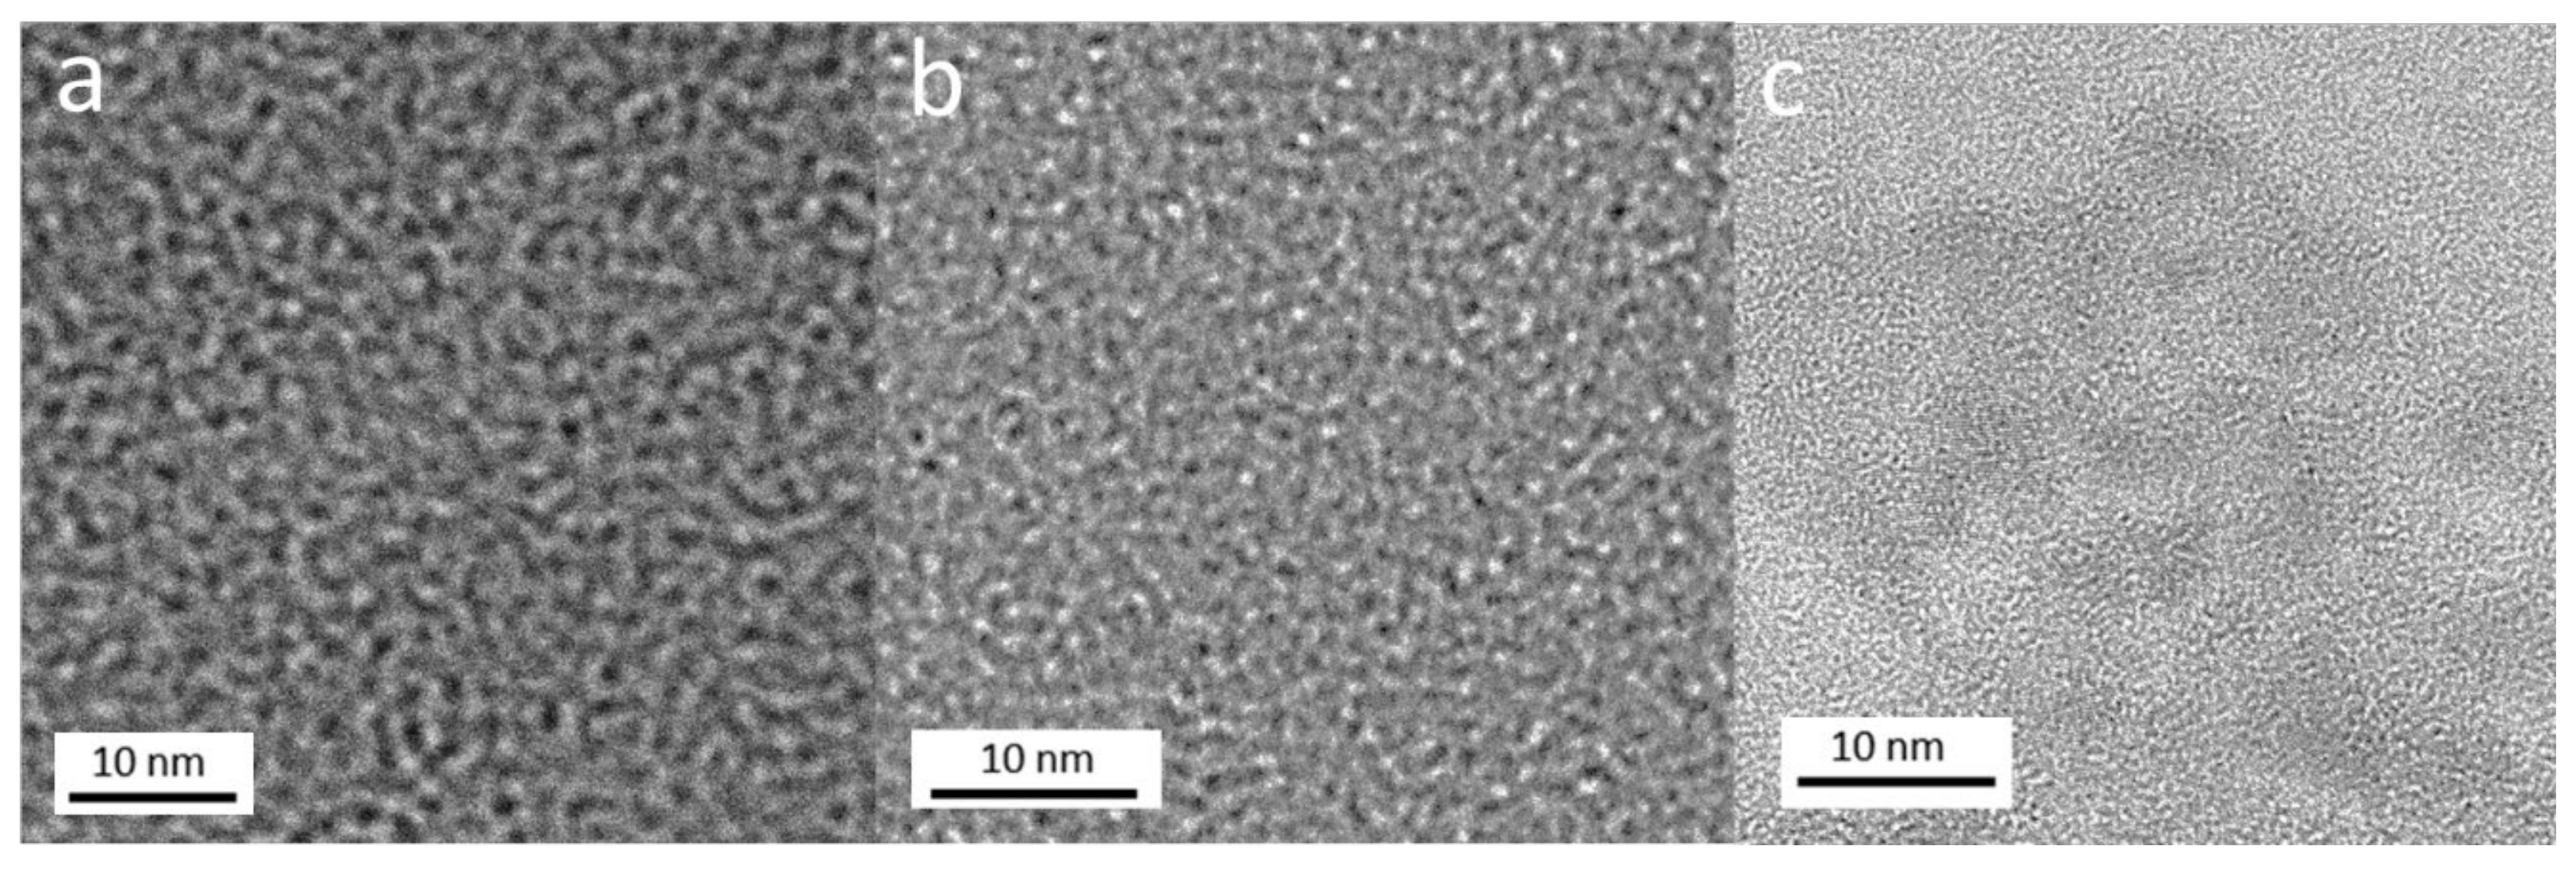
Non-fluorinated and fluorinated compounds F70-60 min and F140-60 min were analyzed by transmission electron microscopy (Figure 2). TEM images of the compounds highlight a disordered structure, which becomes even more disorganized after fluorination at 70 °C and 140 °C. The TEM images are consistent with the XRD analysis.
Elemental maps of carbon, fluorine, oxygen, and sulfur have been acquired and are shown in Figure 3. The average atomic percentages of the elements extracted from the EDX measurements are summarized in Table 2 for S-graphene, F70-60 min, and F140-60 min. The elements C and F are clearly visible on the EDX maps for both fluorinated samples. The maps show that fluorine is homogeneously distributed within the graphene material. The chemical compositions show that oxygen in the S-graphene can still be detected after fluorination but in very small quantities. The analysis also shows the presence of sulfur only for the compound F70-60 min in contrast to F140-60 min. Quantification of the elements evidences a decrease in the carbon content from around 94% initially to 91% and 83% after fluorination at 70 °C and 140 °C, respectively, with fluorine appearing at 5% and 17%. The amount of sulfur decreases slightly after fluorination at 70 °C and completely after fluorination at 140 °C.
The infrared spectra of fluorinated S-graphene acquired with ATR mode are shown in Figure 4. We observe the appearance of a broad massif between 1200 and 1100 cm−1 after fluorination, which increases in intensity as the temperature and fluorination time increase. This cluster corresponds to the superimposition of bands related to the vibration mode of covalent C-F bonds at 1210 cm−1 and weakened covalent C---F bonds at 1160 cm−1. At the highest temperature (140 °C), the material contains a majority of covalent C-F bonds, and the shoulder peak corresponding to the weakened covalent C---F bonds has weakened. CF2 groups are also revealed by the vibrational band at 1320 cm−1; their formation is favored by the edges of the graphene sheets. An unusual doublet band centered at 932 and 922 cm−1 was observed, with an absorption maximum for the F70-60 min compound. This doublet was identified in the case of compound SF4 and has been assigned to the vibration of S-F bonds [27]. Fluorination conditions that are too drastic, i.e., 140 °C for 1 h, result in the disappearance of the doublet assigned to S-F. Conversely, conditions that were too mild in terms of the duration (30 min at 70 °C) or temperature (1 h at 25 °C) were not sufficient to form a high amount of S-F bonds, as evidenced by the low intensity of the doublet on the IR spectrum.
The 19F and 13C NMR spectra of fluorinated S-graphene are shown in Figure 5. In 19F NMR, three main contributions are visible in the bulk corresponding to bonds involving fluorine atoms (Figure 6a). The C-F bonds and the CF2 and CF3 groups are highlighted by bands at −173, −120, and −78 ppm, respectively [25,28,29,30]. The covalency of the C-F bonds becomes stronger as the fluorination temperature increases, resulting in a chemical shift moving towards the lower values, i.e., from −150 to −180 ppm. Another band at 58 ppm is attributed to S-F bonds, already identified by infrared spectroscopy (Figure 5). The S-F bond band is more intense in the case of long fluorination (F25-60 min and F70-60 min) at a “moderate” temperature. The S-F bonds disappeared after fluorination at higher temperatures, i.e., 140 °C.
The 13C NMR spectra (Figure 5b) do not show a band assigned to carbon-sulfur bonds. Within the NMR detection limit, our fluorinated materials therefore contain no C-S bonds (C-S-C groups) as reported in the literature [12,13]. Two main bands are present at 84 ppm for covalent C-F bonds and between 120 and 135 ppm for non-fluorinated C sp2 atoms. In a weakly fluorinated environment (F25-60 min), the sp2 C atoms show a resonance at 122 ppm, close to that expected for graphite (120 ppm). When the amount of fluorine is higher (F140-60 min), this band moves towards higher chemical shifts, suggesting a decrease in the hyperconjugation; the more fluorinated the environment of a C-F bond, the less influence the neighboring C sp2 has on the electron density around the 19F nuclei. In other words, the C-F bond is strengthened [29,31]. In the case of a higher degree of fluorination, as for F140-60 min, the quantity of sp2 C atoms decreases in favor of the formation of C-F bonds. The F/C fluorination rate of the compounds is calculated by deconvolution of the 13C spectra (F/C = (SC-F + 2SCF2)/(SC-F + SCF2 + SCsp2 + SCsp3) with S being the integrated surfaces of the bands). The F/C ratios are 0.22 ± 0.02 for F25-60 min, 0.51 ± 0.02 for F70-30 min, 0.72 ± 0.02 for F70-60 min, and 0.82 ± 0.02 for F140-60 min. The fluorination rate increases when the fluorination temperature is higher. It also increases for longer fluorination at the same temperature (70 °C). The compound fluorinated for 60 min has a higher F/C ratio than the compound fluorinated for 30 min. The 19F→13C cross-polarization (CP) NMR spectra of compounds F70-60 min and F140-60 min are shown in Figure 5c. This analysis is in good agreement with the 13C and 19F NMR analyses. CP favors the nuclear resonance of C directly bonded to fluorine atoms. After fluorination at 140 °C, the quantity of non-fluorinated sp2 C is much lower, or even non-existent, in contrast to the compound fluorinated at 70 °C. CF2 groups are much more present after fluorination at 140 °C.
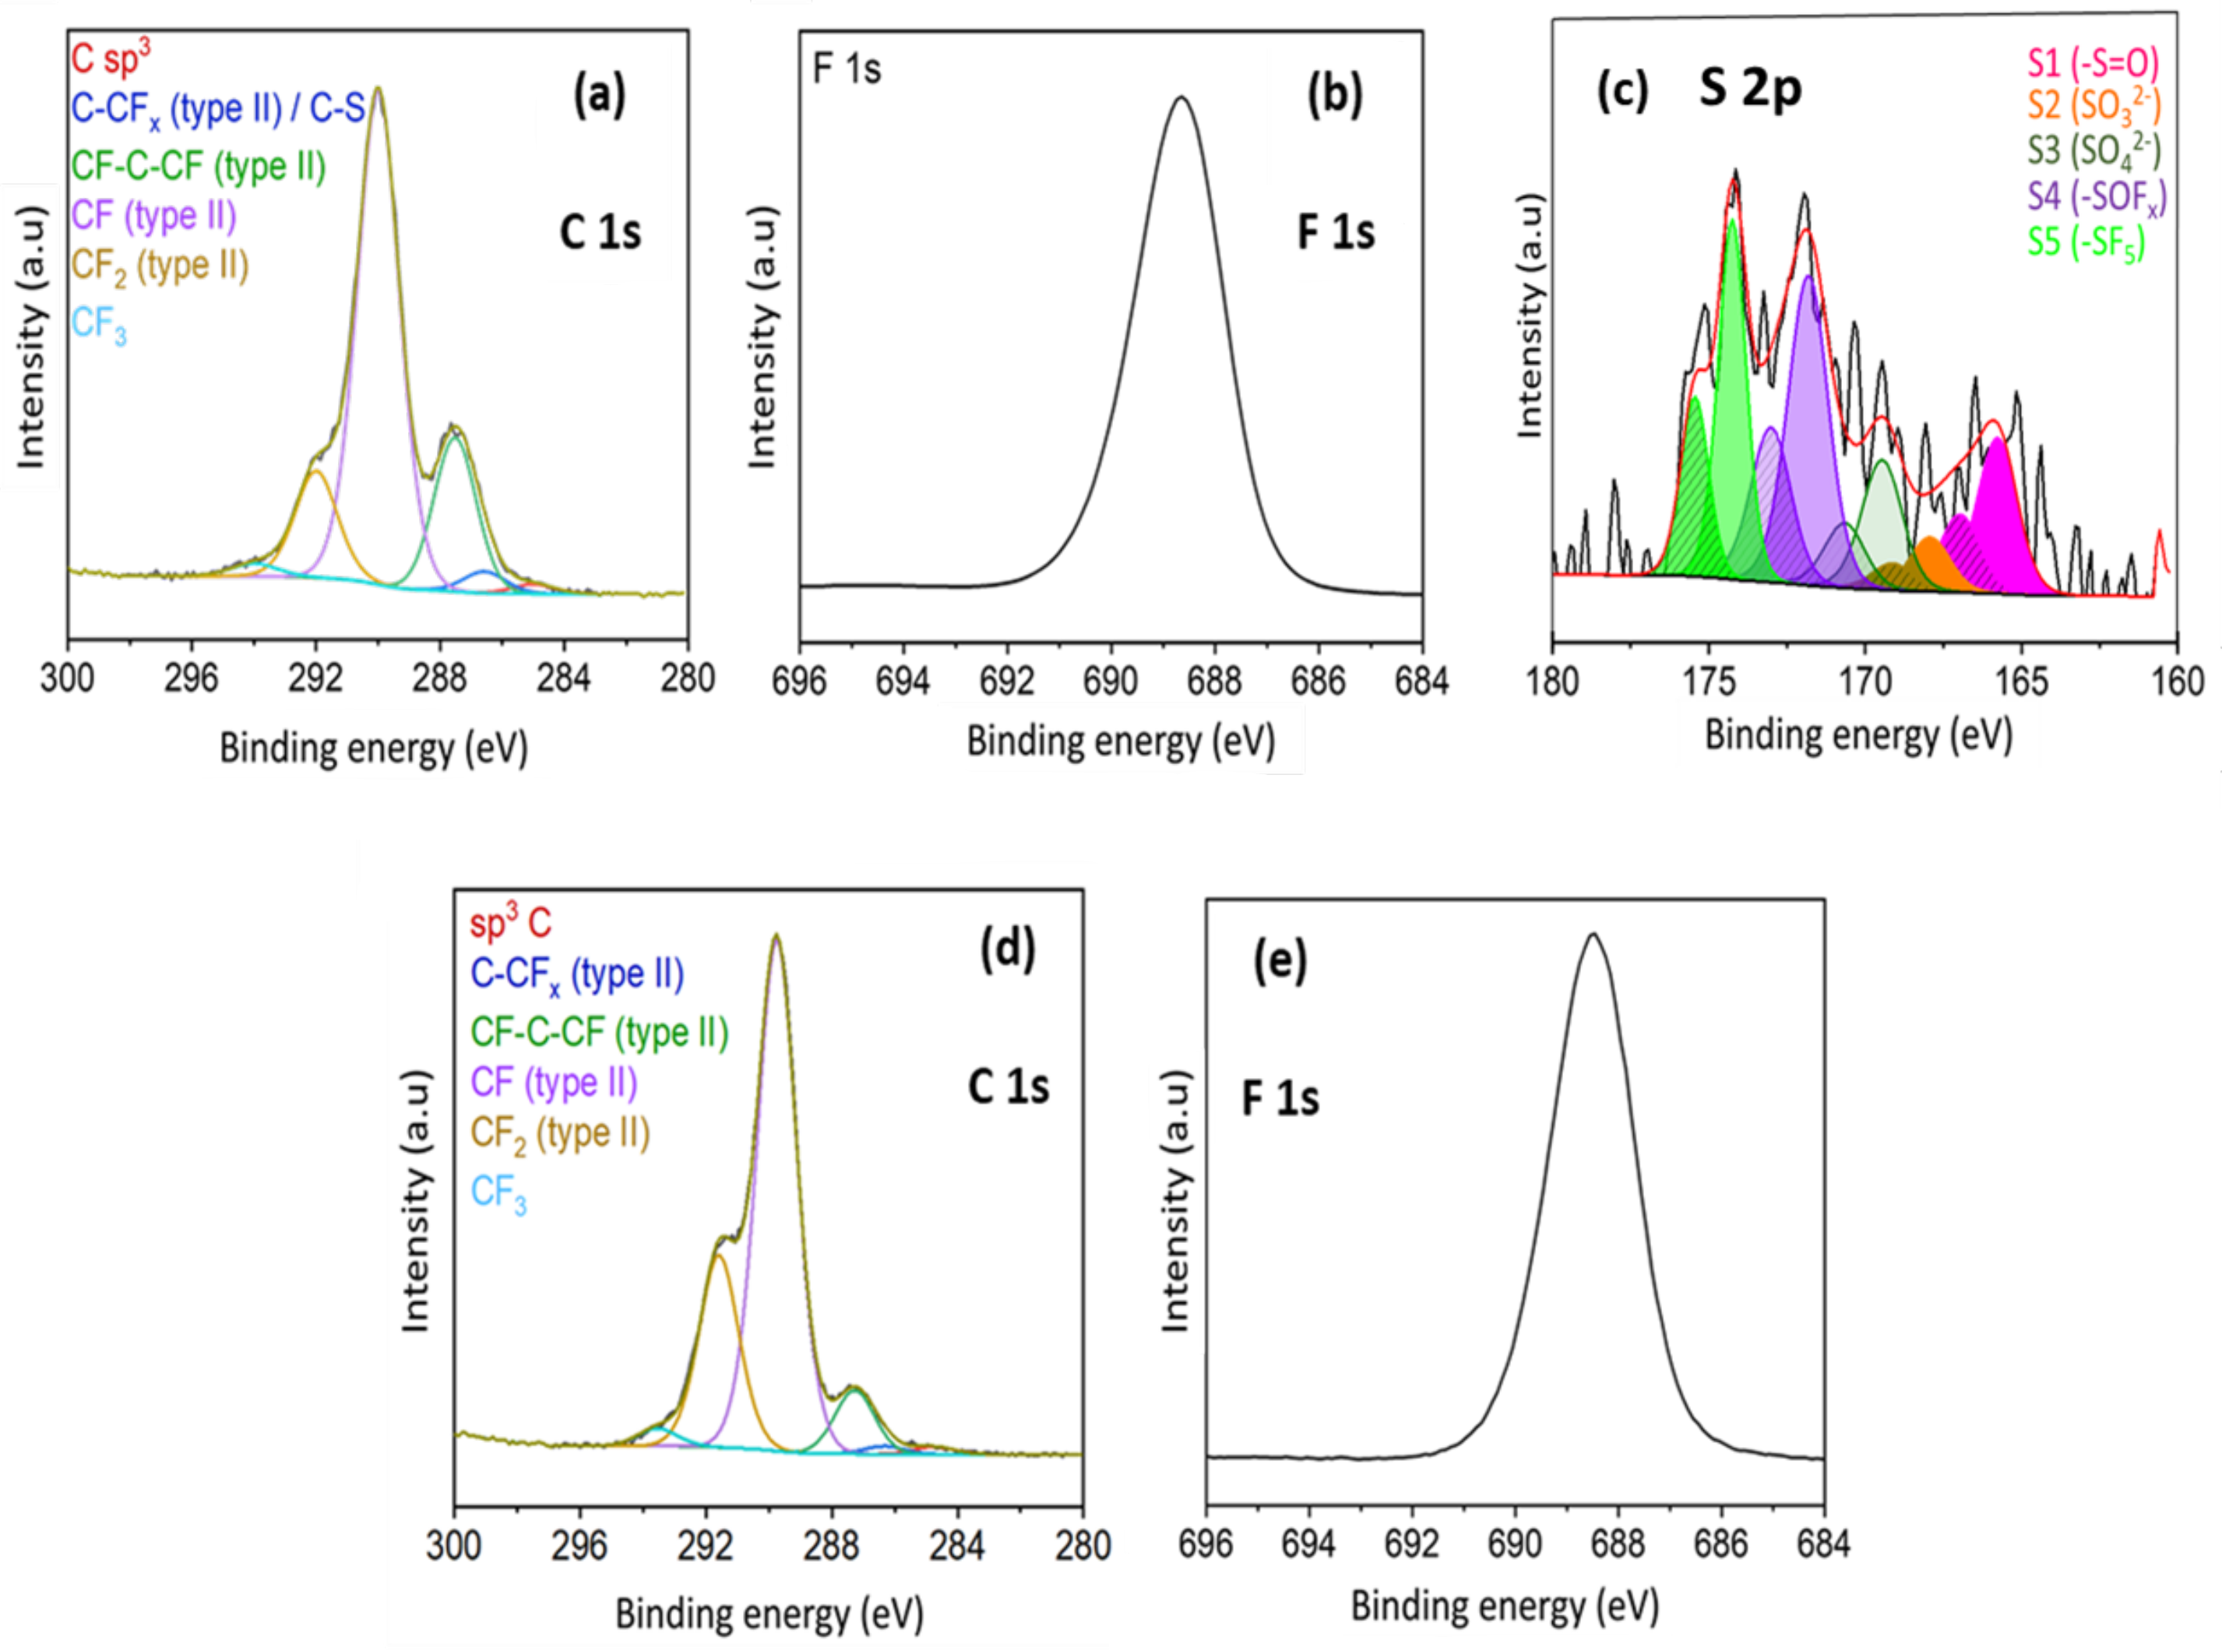
The XPS survey spectra of the non-fluorinated and fluorinated compounds at 70 and 140 °C for 1 h are shown in Figure 6. The C1s, F1s, and S2p XPS spectra of the fluorinated compounds are given in Figure 7 and the experimental data from the analysis of the XPS spectra are given in Table 3. The as-received S-graphene contains 4.6 atomic (at.) % sulfur, indicated by the presence of the S2s and S2p peaks, which is in agreement with the supplier data. After fluorination at 70 and 140 °C, the C1s peak at 290.0 eV decreased significantly in intensity. The carbon content drops from 92 at.% for S-graphene to 52 at.% for F70-60 min and 45 at.% for F140-60 min. The introduction of fluorine is evident with a peak at 688.7 eV and 688.5 eV for F70-60 min and F140-60 min, respectively. The fluorine contents are 47 at.% for F70-60 min and 55 at.% for F140-60 min, which are over-expressed at the extreme surface of the material when the fluorination temperature is higher. The surface fluorination ratios F/C were 0.90 for F70-60 min and 1.21 for F140-60 min. The amount of oxygen, 3.3 at.% in the S-graphene, decreases after fluorination and when increasing the temperature. O is present at 1.30 at.% for F70-60 min and only at 0.48 at.% for F140-60 min. The C1s spectrum of F70-60 min (Figure 7a) can be deconvoluted into six contributions, three of which are in majorities. Most C-F bonds (62.0 at.%) show a binding energy of 290.0 eV, sp2 C atoms with a fluorinated environment (CF-C-CF) emerge at 287.5 eV, and CF2 groups at 292.0 eV. The C1s spectrum of compound F140-60 min (Figure 7d) is also deconvoluted into six contributions, three of which are positioned at the same binding energies. C-F bonds are still dominant (63.9 at.%). The amount of sp2 C (CF-C-CF) is lower after fluorination at 140 °C with 7.8 at.% compared with 18.9 at.% for F70-60 min. However, CF2 groups are present in greater quantities for F140-60 min (24.0 at.% compared with 13.4 at.% for F70-60 min). The presence of fluorine is evident by an F1s peak located near 688 eV corresponding to covalent C-F bonds (Figure 7b,e) [32] for both compounds. Sulfur is present on the surface of the compound only for F70-60 min. The S2p spectra (Figure 7c) are deconvoluted into several contributions corresponding to two major groups, SOx and SFx. Based on several reports [33,34,35], the SOx environments range from 165.5 eV to 170.2 eV. In our case, we have three environments: the first environment is S 2p3/2 S1 (-S=O) at 165.7 eV associated with the S 2p1/2 orbital at 166.9 eV (hatched contribution) with an orbital splitting of 1.2 eV and an intensity ratio of 2. For the second environment corresponding to S 2p3/2 S2 (SO32−) at 167.9 eV, the S 2p1/2 at 169.1 eV also exhibits the same orbital splitting and the same intensity ratio. For the third environment, S 2p3/2 S3 (SO42−) at 169.4 eV 2p3/2 and 2p1/2 at 170.6 eV. As in the reference [36,37], the sum of the two orbitals (S2p3/2 and S2p1/2) of S 2p spectra are highlighted (Figure 7c and Table 3). The higher the oxygen coordination, the more the binding energy shifts towards higher energies.
For SFx environments [38], they fall in the higher energy range above 170.2 eV, depending on the degree of coordination with fluorine, with up to 178.5 eV for SF6 as cited in the following article from the XPS database. In our case, we have three environments: the first environment is S 2p3/2 S4 (-SOFx) at 171.7 eV associated with S 2p1/2 at 172.9 eV, with x > 2 but less than 5, an intermediate environment between (S 2p3/2 (-SOF2) at 170.2 eV) and SF5. The second environment is 2p3/2 S5 (SF5) at 174.2 eV and S 2p1/2 at 175.4 eV.
3.2. Electrochemical Tests
In order to study the effect of sulfur and the unusual S-F bond on the reversibility of Li/CFx batteries, the compound fluorinated at 70 °C for 1 h (F70-60 min) was tested as a positive electrode in primary lithium batteries using lithium as the anode. The choice fell to the material with the highest fluorination rate (F/C = 0.72 ± 0.02) but that retains the S-F bonds formed during fluorination.
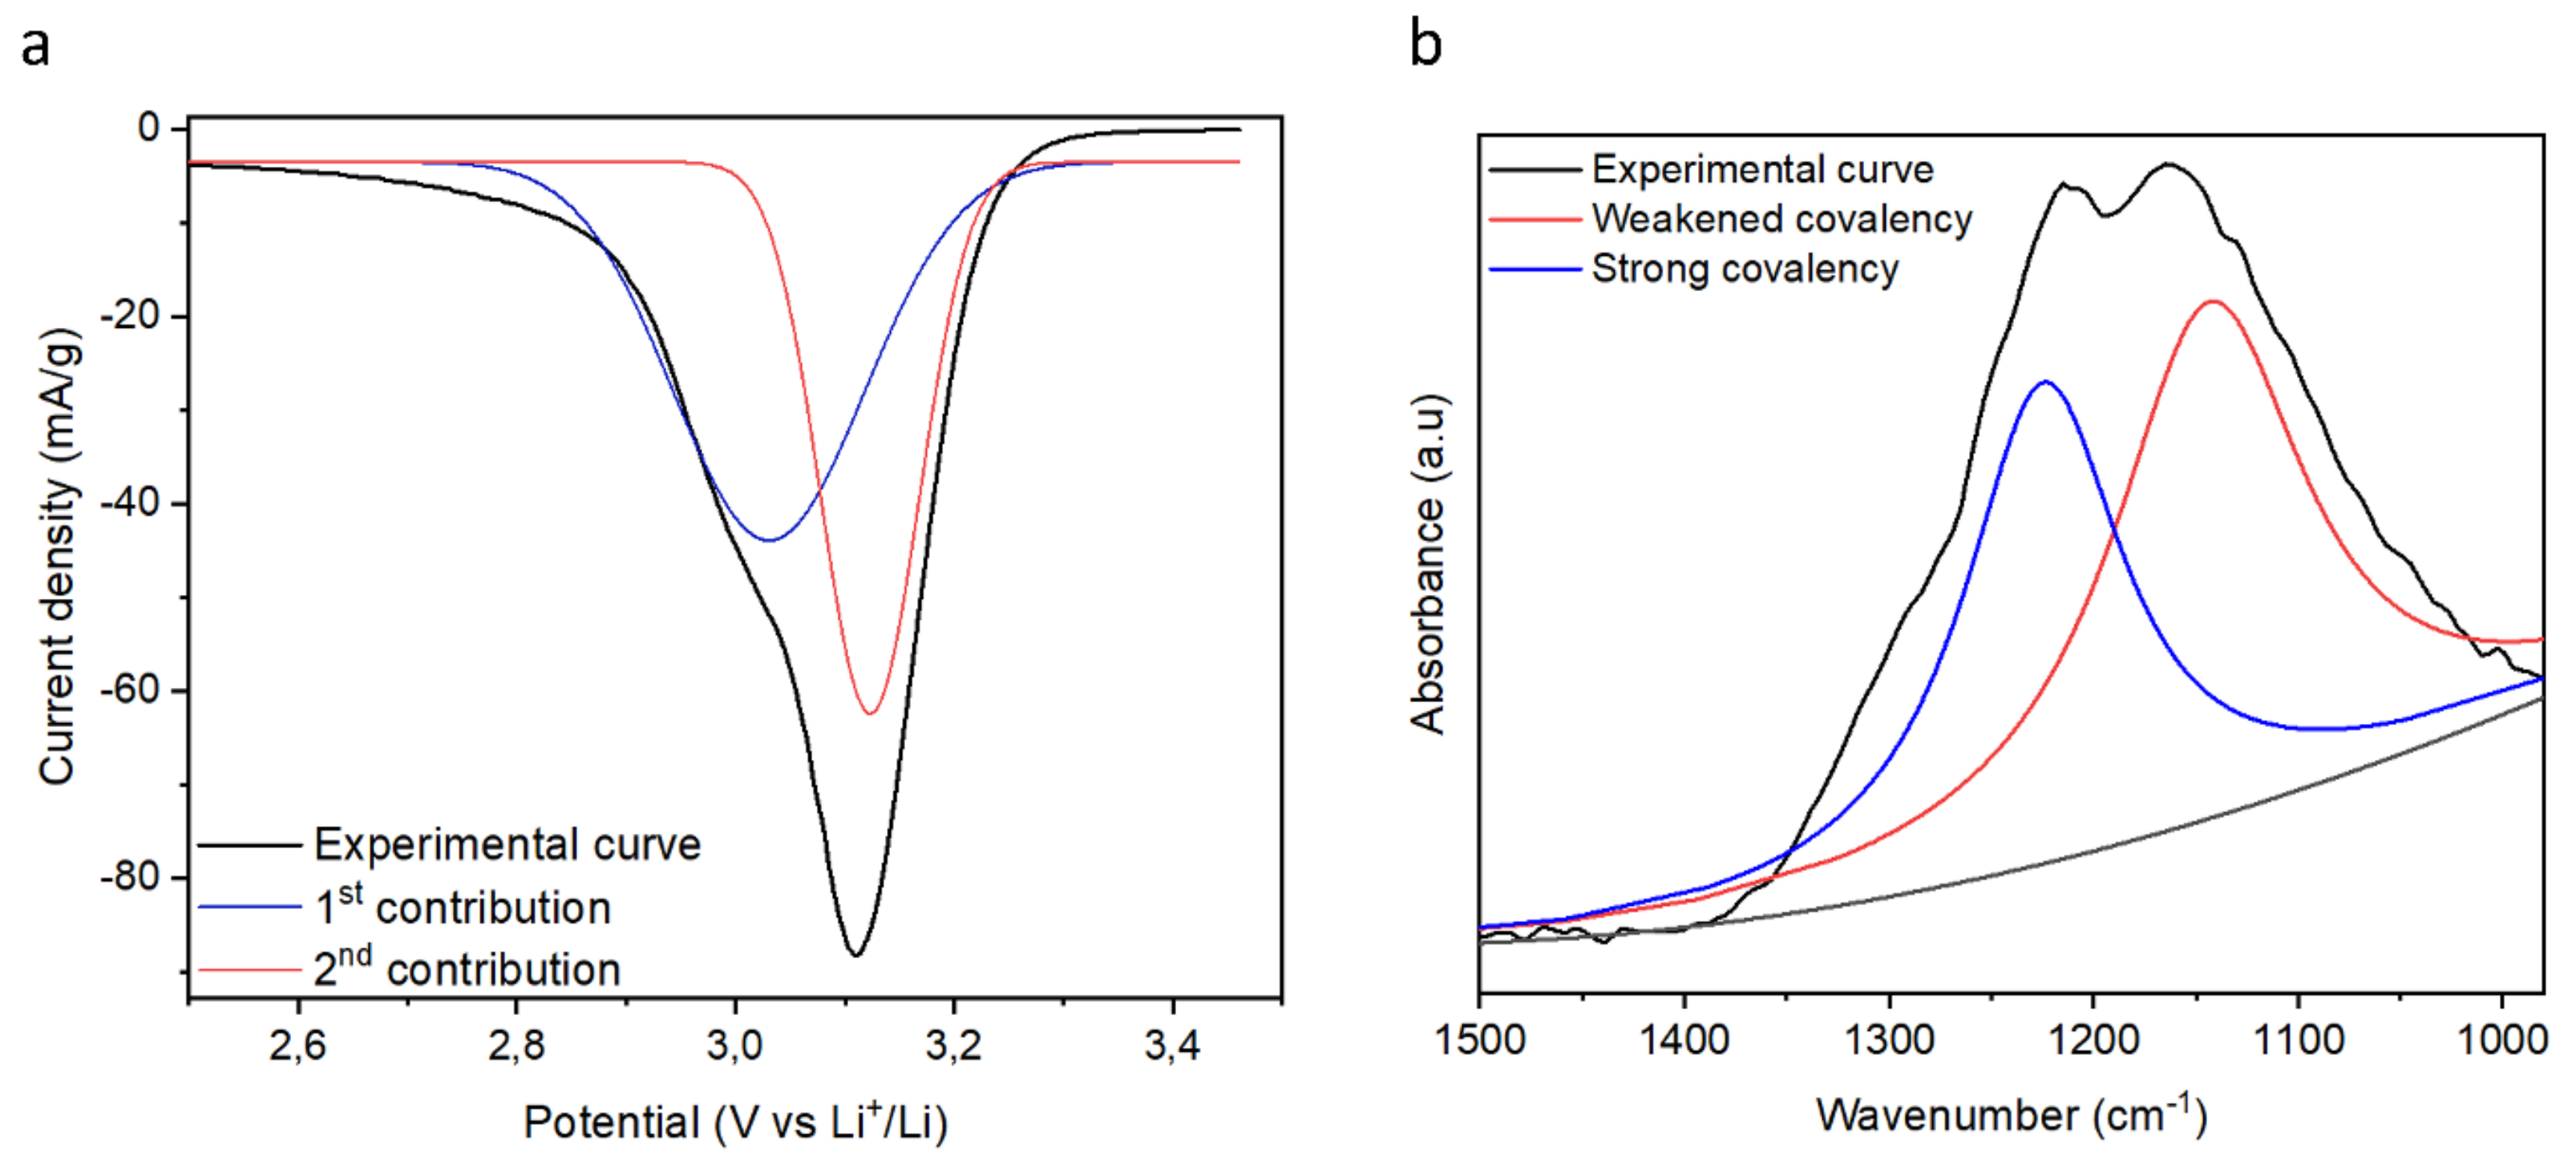
Cyclic voltammetry of compound F70-60 min recorded at 0.01 mV/s with LiPF6 in the EC/PC/3DMC 1M electrolyte is shown in Figure 8. This electrochemical analysis technique highlights the different types of bonds determined during previous analyses by both infrared spectroscopy and solid-state NMR.
The two components centered at 3.12 and 3.04 V are necessary to fit the reduction branch (Figure 8a). Each is related to one type of C-F bond: the stronger the covalence, the lower the discharge potential. Those data are in perfect agreement with the two IR vibration bands, which are assigned to pure and weakened covalent C-F bonds.
Galvanostatic discharge makes it possible to quantitatively evaluate the electrochemical properties of the material in battery applications via the delivered capacity. The galvanostatic discharge curve at 10 mA/g up to 1.5 V for the F70-60 min compound is shown in Figure 9. Compound F70-60 min has a theoretical capacity of 751 mAh/g considering the F/C fluorination rate of 0.72 calculated from 13C NMR. The experimental discharge curve shows a flat profile with a single plateau, whereas two steps were expected at distinct potentials corresponding to the breaking of the two types of bond, as can be seen by cyclic voltammetry (Figure 9). The galvanostatic discharge, applied under these conditions, does not allow the different C-F bonds to be discriminated. The material delivers a capacity of 773 mAh/g through the reduction of up to 1.5 V, which is close to the theoretical value considering the experimental errors. A reduction in the C-F bonds occurred at a half discharge potential of 3.10 V. This value is high for a material with covalent C-F bonds and is more similar to the reduction potential of bonds with weakened covalency [39]. The high potential may also be due to the sp2 hybridized carbon atoms, which ensure better electronic conduction and thus contribute to increasing the potential. A high potential is observed for the case of fluorinated graphite prepared at room temperature with a catalytic gaseous atmosphere [40]. For comparison, the material in question is composed of weakened C-F bonds (C---F) and has an F/C fluorination rate of approximately 0.5, which is lower than for F70-60 min. The level of non-fluorinated sp2 carbons and the resulting hyperconjugation do not explain the high potential of F70-60 min; this point will be discussed later.
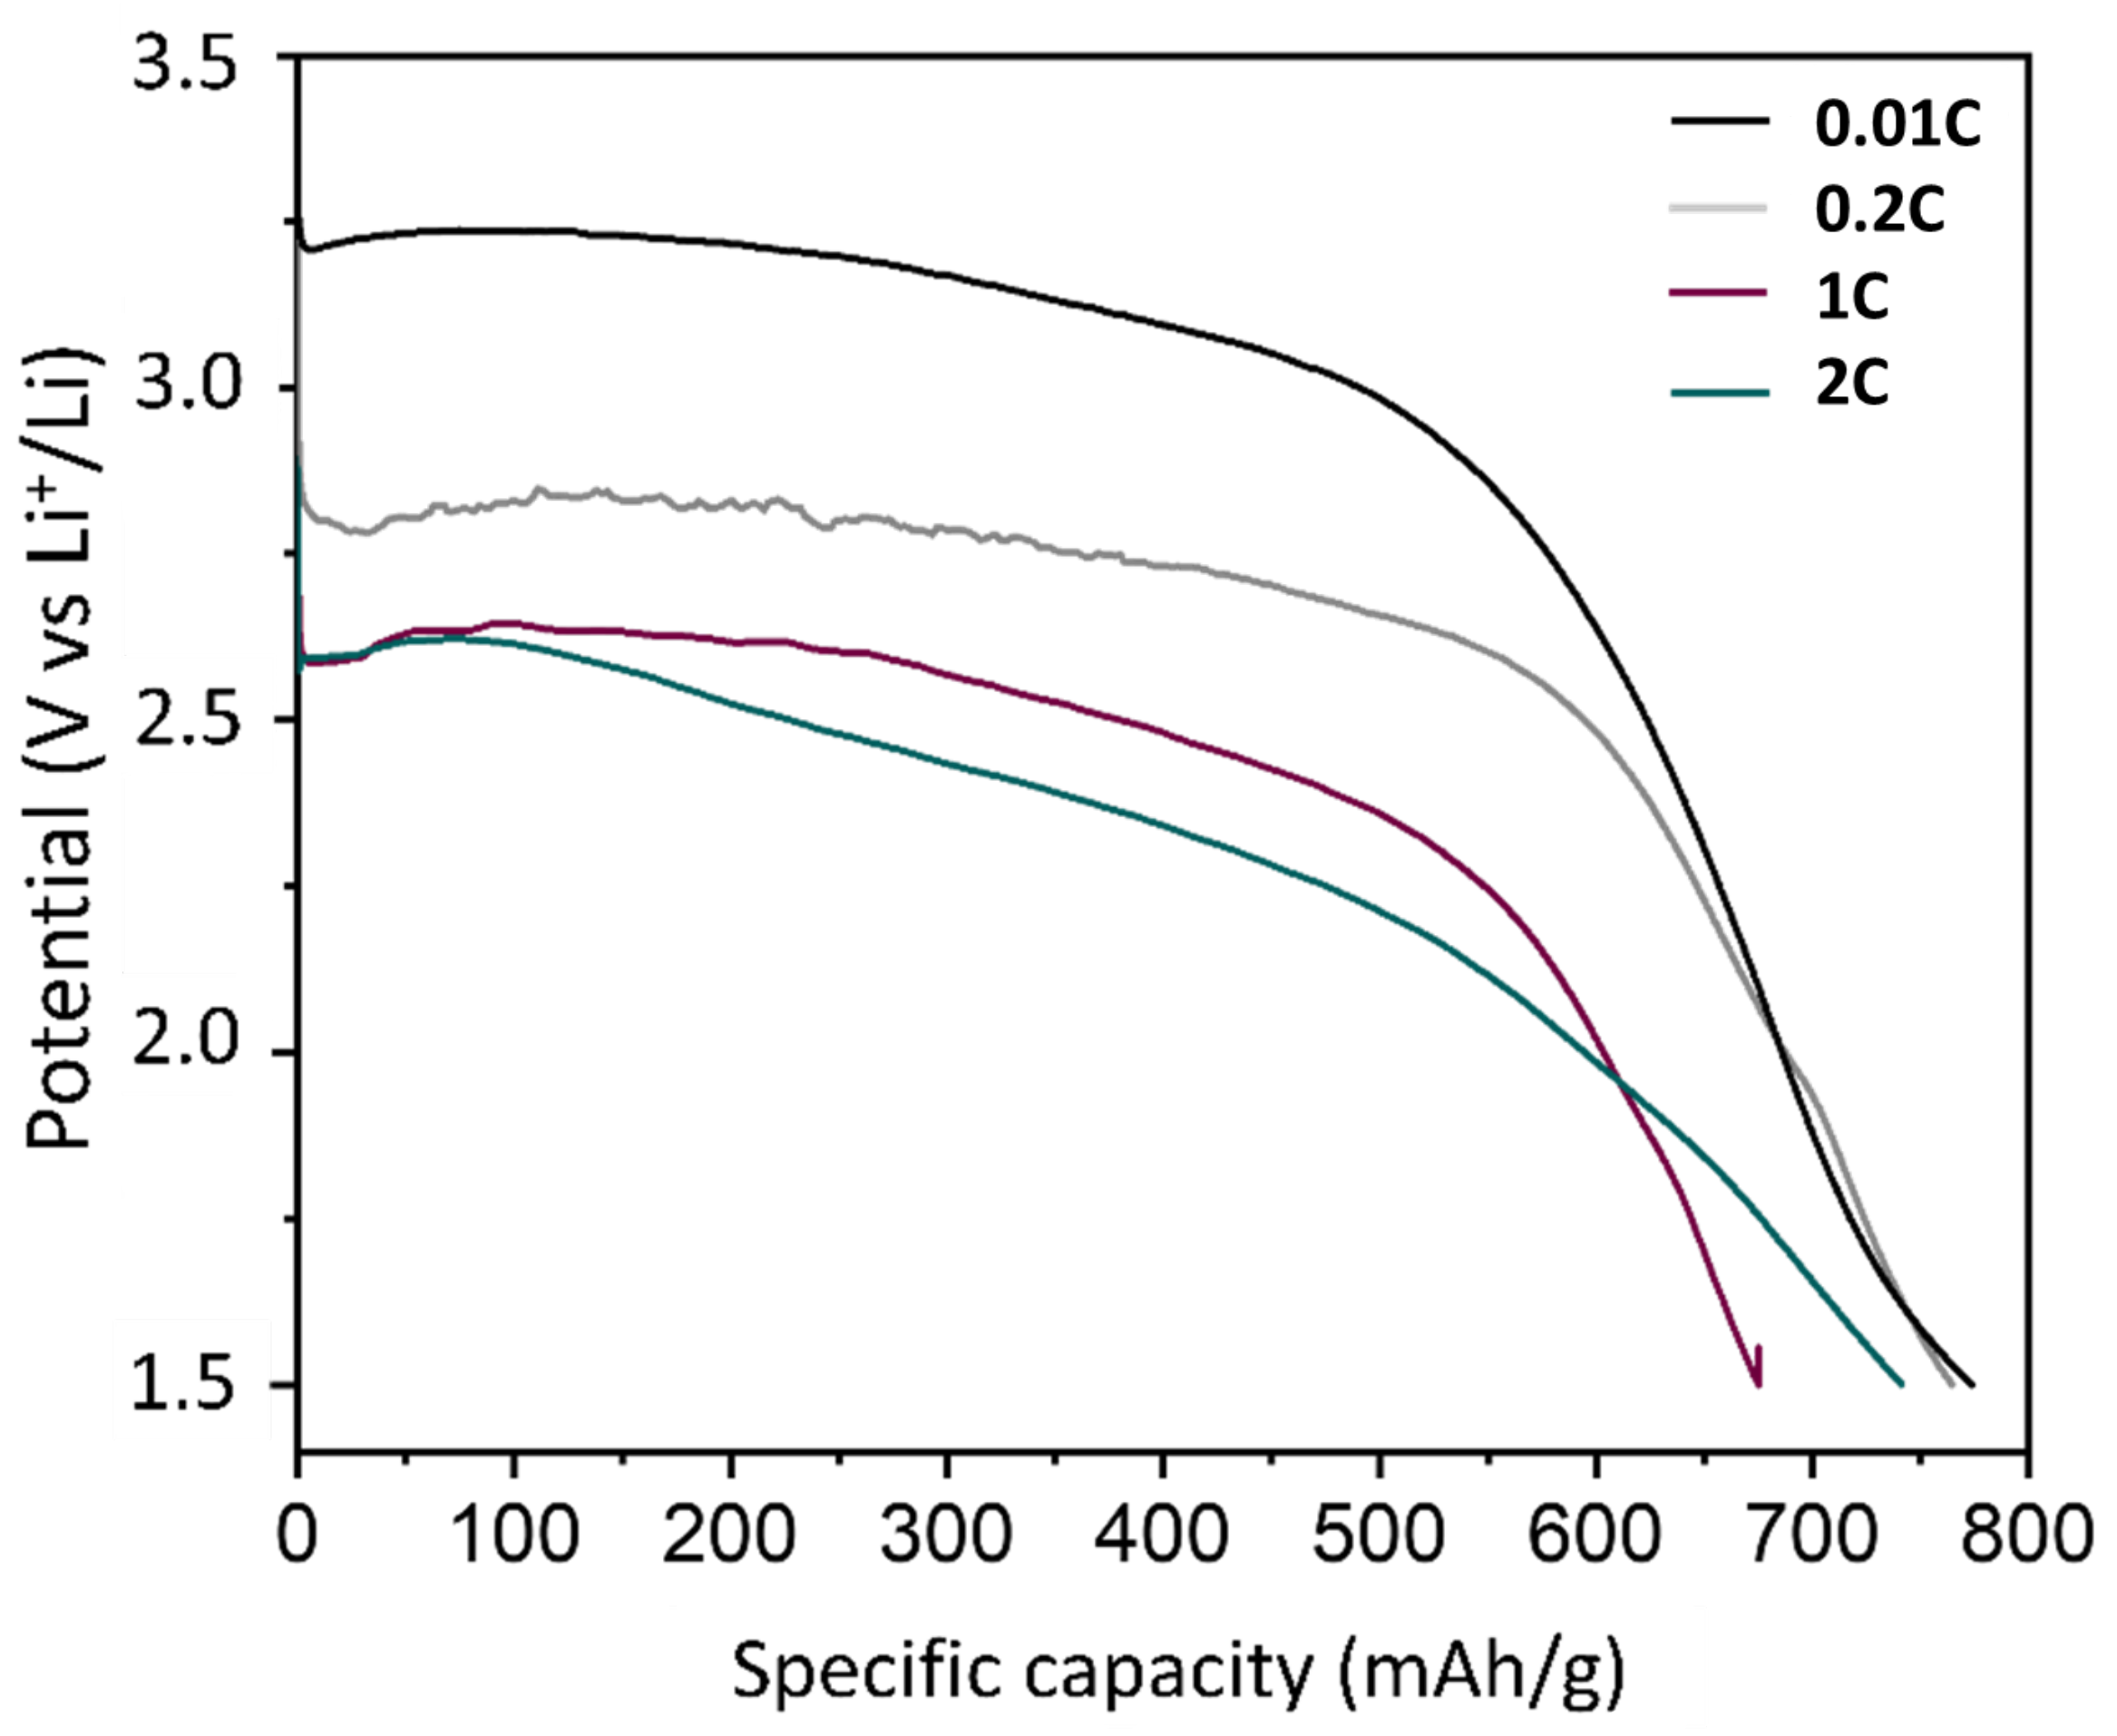
The reduction potential of the F70-60 min compound is advantageously high since a high potential coupled with a high capacity will deliver a high energy density. The galvanostatic discharge curves for the F70-60 min compound at different current densities are shown in Figure 10. The applied current densities and experimental electrochemical data such as the capacity (Cexp), half-discharge potential (E1/2), specific energy, power density, and faradic efficiency are summarized in Table 4.
The discharge curves show a conventional profile for CFx as the discharge regime increases with a single plateau corresponding to the breaking of the C-F bonds. More unusually, the material delivers similar capacities whatever the applied current density up to 2C, with faradic efficiencies close to 100%. The potential remains fairly high, i.e., 2.40 V at 2C, enabling high specific energy densities of 1778 Wh/kg to be obtained. In addition, in contrast to conventional CFx, the potential drop at the beginning of the discharge is non-existent thanks to the sp2 C present in the material, which ensures better electronic conduction.
The reduction potential of B-CFx is between 2.75 and 2.90 V at 0.01C with the 1M LiPF6 dissolved in the EC/DMC electrolyte, depending on the fluorination degree of the material [7]. These potentials are still lower than the potential of 3.11 V obtained for the compound F70-60 min at 0.01C. However, it is difficult to compare electrochemical systems directly if they do not involve the same electrolyte and electrode formulation. CFx doped with nitrogen and sulfur (N,S-CFx) on the surface achieved high electrochemical performance up to discharge rates equivalent to 70C [5]. However, the reduction potential is lower in the case of N,S-CFx. For example, at a discharge rate of 0.1C, N,S-CFx delivers a capacity of 787 mAh/g at a potential of 2.59 V, resulting in an energy density of 2038 Wh/kg. In our case, the F70-60 min compound, reduced to a higher discharge rate of 0.2C, delivers a capacity of 764 mAh/g at a potential of 2.74 V, giving an energy density of 2093 Wh/kg. In order to compare the performance of the two materials at the same discharge rate, we will consider the equivalent discharge rate at 1C. The precise values of the capacities and potentials obtained at 1C for N,S-CFx are not given by Zhu et al. but the reduction potential is estimated to be around 2.40 V, whereas our F70-60 min material reduces at a potential of 2.54 V at 1C. In the case of CFx doped with phosphorus (P-CFx), the material demonstrates capacities delivered up to 20C [4]. Polarization of the material at the start of the discharge is present from the 2C regime onwards, unlike the F70-60 min material, which does not show any. Electronic conduction therefore seems to be better in our case. In addition, the average reduction potential is also lower for P-CFx, with a potential of 2.5 V at 0.1C giving an energy density of 2025 Wh/kg. At 2C, the potential appears to be close to 2.3 V, 0.1 V lower than F70-60 min. However, it is important to take into account the differences in the electrode formulation and electrolyte used, which can affect the electrochemical results. The electrode formulation using P-CFx or N,S-CFx involves vertically grown carbon fibers of the dimension 1D, which should provide better electronic conduction than the 0D spherical carbon used in our case (carbon black). In addition, the 1M LiBF4 dissolved in a PC/DMC mixture electrolyte should also lead to better electrochemical performance thanks to the salt used, which proved to be better than the LiPF6 we used. Despite these two points, our material exhibits better performance and a better reduction potential when the most “favorable” conditions are not used. The F70-60 min compound seems to demonstrate better electrochemical performance in terms of the reduction potential, which leads to higher energy densities. The F70-60 min compound also delivers an interesting power density of 3605 W/kg at a discharge rate of 2C.
Cyclic voltammetry and galvanostatic discharge showed a high half-discharge potential, while the types of C-F bonds determined during physicochemical characterization tended to show high covalency for C-F bonds. In the literature, graphs representing the half-discharge reduction potential as a function of the 19F chemical shift of C-F bonds have been drawn up. The figure highlights the correlation between these two parameters: the more negative the chemical shift of the C-F bonds, the stronger the covalency of the C-F bonds, and the lower the reduction potential (Figure 11, [40]). If the data for compound F70-60 min are placed on this type of graph, represented by a star, it can be seen that they lie significantly outside the established trend curves. (Figure 11) The reduction potential of the material appears to be much higher than expected in relation to its chemical shift in 19F NMR, i.e., according to the covalency of the C-F bonds of which it is composed. An effect of the S-F bonds and/or doping on the battery’s discharge potential can thus be indirectly demonstrated. Once again, materials with identical electrode and electrolyte formulations and equal current regimes should be compared.
An 19F NMR post-mortem analysis was carried out on the electrode, i.e., the mixture of F70-60 min, PVDF, and acetylene black, after its preparation without contact with the electrolyte (Figure 12). The spectrum of the electrode showed several peaks. Firstly, there is a doublet at around −93 ppm corresponding to the CF2 groups in the PVDF used for the electrode formulation. Two other changes can be noted:
- -
- The position of the peak corresponding to the C-F bonds changes to a lower chemical shift. Initially, the C-F bonds resonate at −175 ppm in powdered F70-60 min, indicating the presence of covalent C-F bonds. After electrode formulation, the chemical shift of the C-F bonds fell sharply to −155 ppm. The electron conduction provided by the black acetylene in the electrode interfered with the NMR measurements, even on the 19F nuclei. The peak of CF2 in PVDF also shifted. In addition, the mass of active material is lower in the rotor (close to 2 mg, whereas around 10 mg are compacted in the rotor for powdered F70-60 min). This results in a lower signal-to-noise ratio. It is therefore difficult to say whether the strength of the C-F bond in the electrode material has been weakened during the electrode formulation.
- -
- If the ratios of the intensities of the peaks linked to the S-F bonds (at 52 ppm) and C-F (−155 or −175 ppm) are considered for the spectra of the electrode and the initial powder, a decrease is noted after the formulation. Some of the S-F bonds were broken during electrode formulation. The unassigned peak at 10 ppm would be related to a decomposition product.
The 19F NMR spectrum of the electrode after its discharge to 1.5 V was recorded (Figure 12). No peak is visible between −150 and −190 ppm, which means that all the C-F bonds were broken during the reduction. The S-F bonds were also completely reduced as evidenced by the absence of the peak at 52 ppm. The electrochemical reduction in F70-60 min formed LiF, which is characterized by an intense peak at −207 ppm
4. Conclusions
Sulfur doping increases the electrochemical performance of fluorinated graphene in primary lithium batteries by weakening the C-F bonds while allowing a high enough fluorination rate to deliver high capacities, unlike CFx composed of semi-ionic C---F bonds, which have a lower fluorination rate and therefore lower delivered capacities [33,40]. Fluorination led to the formation of S-F bonds, which have never been reported in the literature. The formation of these bonds is favored at a moderate fluorination temperature of 70 °C for a period of 60 min but can be eliminated by stronger fluorination conditions. The F70-60 min compound resulting from these mild fluorination conditions has an F/C ratio of 0.71 and covalent C-F bonds but exhibits a high mid-discharge reduction potential of 3.11 V at 10 mA/g. The origin of this abnormally high potential is still ambiguous, and the role of S-F bonds and sulfur doping has yet to be clarified. Moreover, a power density of 3605 W/kg was obtained at a discharge rate of 2C. These electrochemical properties make the F,S co-doped graphene a promising material, and improvements concerning the formulation and chemical composition (e.g., changes in the S content) would confirm the high potentialities. Moreover, doping can be extended to other heteroelements such as B or P in order to tailor the properties, opening a new class of cathode materials for primary lithium batteries.
Author Contributions
Conceptualization, M.D., M.C., S.C. and K.G.; methodology, M.D. and K.G.; formal analysis, M.D., M.C., S.C., H.F., E.F., E.P. and K.G.; investigation, data curation, M.D., M.C., S.C., H.F., E.F., E.P. and K.G.; writing—original draft preparation, M.D., M.C., S.C., H.F., E.F. and K.G.; writing—review and editing, M.D., M.C., S.C., H.F., E.F. and K.G.; visualization, supervision, M.D. and K.G.; project administration, M.D.; funding acquisition, M.D. All authors have read and agreed to the published version of the manuscript.
Funding
This research received no external funding.
Data Availability Statement
Data is contained within the article.
Acknowledgments
M.D.: K.G. and M.C. acknowledge I-Site CAP2025, Université Clermont Auvergne, and Clermont Auvergne Métropole for support via the Académie CAP20-25; S.C. acknowledges the funding from the Australian Research Council (DP230100542), AMP Foundation’s Tomorrow Fund, and the support from the University of Newcastle. E.F and M.D. acknowledge financial support from CNRS IRP C-FUNCTION.
Conflicts of Interest
The authors declare no conflicts of interest.
References
- Panja, T.; Bhattacharjya, D.; Yu, J.-S. Nitrogen and phosphorus co-doped cubic ordered mesoporous carbon as a supercapacitor electrode material with extraordinary cyclic stability. J. Mater. Chem. A 2015, 3, 18001–18009. [Google Scholar] [CrossRef]
- Zhuang, S.; Lee, E.S.; Lei, L.; Nunna, B.B.; Kuang, L.; Zhang, W. Synthesis of nitrogen-doped graphene catalyst by high-energy wet ball milling for electrochemical systems: Synthesis of N-G catalyst by high-energy wet ball milling. Int. J. Energy Res. 2016, 40, 2136–2149. [Google Scholar] [CrossRef]
- Zhang, G.; Colin, M.; Yang, X.; Sun, S.; Dodelet, J.-P.; Dubois, M. C-F bonding in fluorinated N-Doped carbons. Appl. Surf. Sci. 2022, 577, 151721. [Google Scholar] [CrossRef]
- Zhu, D.; Yuan, J.; Dai, Y.; Peng, Y.; Li, W.; Zhang, F.; Li, A.; Zhang, J. High-Rate Performance of Fluorinated Carbon Material Doped by Phosphorus Species for Lithium-Fluorinated Carbon Battery. Energy Technol. 2022, 10, 2200155. [Google Scholar] [CrossRef]
- Zhu, D.; Yuan, J.; Wang, T.; Dai, Y.; Peng, Y.; Li, W.; Li, A.; Zhang, J. A novel one-step method to prepare N, S Co-doped sub-fluorinated carbon electrode materials for ultrahigh-rate lithium-fluorinated carbon battery. J. Power Sources 2022, 551, 232188. [Google Scholar] [CrossRef]
- Wang, X.; Sun, G.; Routh, P.; Kim, D.-H.; Huang, W.; Chen, P. Heteroatom-doped graphene materials: Syntheses, properties and applications. Chem. Soc. Rev. 2014, 43, 7067–7098. [Google Scholar] [CrossRef] [PubMed]
- Wang, K.; Feng, Y.; Kong, L.; Peng, C.; Hu, Y.; Li, W.; Li, Y.; Feng, W. The Fluorination of Boron-Doped Graphene for CFx Cathode with Ultrahigh Energy Density. Energy Environ. Mater. 2022, 6, e12437. [Google Scholar] [CrossRef]
- Shen, W.; Wang, C.; Xu, Q.; Liu, H.; Wang, Y. Nitrogen-Doping-Induced Defects of a Carbon Coating Layer Facilitate Na-Storage in Electrode Materials. Adv. Energy Mater. 2015, 5, 1400982. [Google Scholar] [CrossRef]
- Li, Y.; Chen, M.; Liu, B.; Zhang, Y.; Liang, X.; Xia, X. Heteroatom Doping: An Effective Way to Boost Sodium Ion Storage. Adv. Energy Mater. 2020, 10, 2000927. [Google Scholar] [CrossRef]
- Wan, H.; Shen, X.; Jiang, H.; Zhang, C.; Jiang, K.; Chen, T.; Shi, L.; Dong, L.; He, C.; Xu, Y.; et al. Biomass-derived N/S dual-doped porous hard-carbon as high-capacity anodes for lithium/sodium ions batteries. Energy 2021, 231, 121102. [Google Scholar] [CrossRef]
- Peng, S.; Yan, S.; Wang, N.; Nan, W.; Wang, J.; Chen, X.; Wang, C.; Qi, X.; Dai, S. Fluorinated graphene/sulfur hybrid cathode for high energy and high power density lithium primary batteries. RSC Adv. 2018, 8, 12701–12707. [Google Scholar] [CrossRef] [PubMed]
- Wang, F.; Wang, L.; Xue, Q. Fluorine and sulfur co-doped amorphous carbon films to achieve ultra-low friction under high vacuum. Carbon 2016, 96, 411–420. [Google Scholar] [CrossRef]
- Struzzi, C.; Sezen, H.; Amati, M.; Gregoratti, L.; Reckinger, N.; Colomer, J.-F.; Snyders, R.; Bittencourt, C.; Scardamaglia, M. Fluorine and sulfur simultaneously co-doped suspended graphene. Appl. Surf. Sci. 2017, 422, 104–110. [Google Scholar] [CrossRef]
- Plšek, J.; Drogowska, K.A.; Fridrichová, M.; Vejpravová, J.; Kalbáč, M. Laser-ablation-assisted SF6 decomposition for extensive and controlled fluorination of graphene. Carbon 2019, 145, 419–425. [Google Scholar] [CrossRef]
- Yu, X.; Lin, K.; Qiu, K.; Cai, H.; Li, X.; Liu, J.; Pan, N.; Fu, S.; Luo, Y.; Wang, X. Increased chemical enhancement of Raman spectra for molecules adsorbed on fluorinated reduced graphene oxide. Carbon 2012, 50, 4512–4517. [Google Scholar] [CrossRef]
- Wang, B.; Wang, J.; Zhu, J. Fluorination of Graphene: A Spectroscopic and Microscopic Study. ACS Nano 2014, 8, 1862–1870. [Google Scholar] [CrossRef] [PubMed]
- Tahara, K.; Iwasaki, T.; Matsutani, A.; Hatano, M. Effect of radical fluorination on mono- and bi-layer graphene in Ar/F2 plasma. Appl. Phys. Lett. 2012, 101, 163105. [Google Scholar] [CrossRef]
- Gao, X.; Tang, X. Effective reduction of graphene oxide thin films by a fluorinating agent: Diethylaminosulfur trifluoride. Carbon 2014, 76, 133–140. [Google Scholar] [CrossRef]
- Samanta, K.; Some, S.; Kim, Y.; Yoon, Y.; Min, M.; Lee, S.M.; Park, Y.; Lee, H. Highly hydrophilic and insulating fluorinated reduced graphene oxide. Chem. Commun. 2013, 49, 8991. [Google Scholar] [CrossRef]
- Jahanshahi, M.; Kowsari, E.; Haddadi-Asl, V.; Khoobi, M.; Bazri, B.; Aryafard, M.; Lee, J.H.; Kadumudi, F.B.; Talebian, S.; Kamaly, N.; et al. An innovative and eco-friendly modality for synthesis of highly fluorinated graphene by an acidic ionic liquid: Making of an efficacious vehicle for anti-cancer drug delivery. Appl. Surf. Sci. 2020, 515, 146071. [Google Scholar] [CrossRef]
- Nakajima, T.; Mabuchi, A.; Hagiwara, R. A new structure model of graphite oxide. Carbon 1988, 26, 357–361. [Google Scholar] [CrossRef]
- Jankovský, O.; Šimek, P.; Sedmidubský, D.; Matějková, S.; Janoušek, Z.; Šembera, F.; Pumera, M.; Sofer, Z. Water-soluble highly fluorinated graphite oxide. RSC Adv. 2014, 4, 1378–1387. [Google Scholar] [CrossRef]
- Mar, M.; Dubois, M.; Guérin, K.; Batisse, N.; Simon, B.; Bernard, P. Tuning fluorine and oxygen distribution in graphite oxifluorides for enhanced performances in primary lithium battery. Carbon 2019, 141, 6–15. [Google Scholar] [CrossRef]
- Chatenet, M.; Berthon-Fabry, S.; Ahmad, Y.; Guérin, K.; Colin, M.; Farhat, H.; Frezet, L.; Zhang, G.; Dubois, M. Fluorination and its Effects on Electrocatalysts for Low-Temperature Fuel Cells. Adv. Energy Mater. 2023, 13, 2204304. [Google Scholar] [CrossRef]
- Touhara, H.; Okino, F. Property control of carbon materials by fluorination. Carbon 2000, 38, 241–267. [Google Scholar] [CrossRef]
- Siburian, R.; Sihotang, H.; Raja, S.L.; Supeno, M.; Simanjuntak, C. New Route to Synthesize of Graphene Nano Sheets. Orient. J. Chem. 2018, 34, 182–187. [Google Scholar] [CrossRef]
- Yamamoto, H.; Matsumoto, K.; Matsuo, Y.; Sato, Y.; Hagiwara, R. Deoxofluorination of graphite oxide with sulfur tetrafluoride. Dalton Trans. 2020, 49, 47–56. [Google Scholar] [CrossRef]
- Dubois, M.; Giraudet, J.; Guérin, K.; Hamwi, A.; Fawal, Z.; Pirotte, P.; Masin, F. EPR and Solid-State NMR Studies of Poly(dicarbon monofluoride) (C2F)n. J. Phys. Chem. B 2006, 110, 11800–11808. [Google Scholar] [CrossRef]
- Giraudet, J.; Dubois, M.; Guérin, K.; Delabarre, C.; Hamwi, A.; Masin, F. Solid-State NMR Study of the Post-Fluorination of (C2.5F)n Fluorine−GIC. J. Phys. Chem. B 2007, 111, 14143–14151. [Google Scholar] [CrossRef]
- Zhang, W.; Dubois, M.; Guérin, K.; Bonnet, P.; Kharbache, H.; Masin, F.; Kharitonov, A.P.; Hamwi, A. Effect of curvature on C–F bonding in fluorinated carbons: From fullerene and derivatives to graphite. Phys. Chem. Chem. Phys. 2010, 12, 1388–1398. [Google Scholar] [CrossRef]
- Sato, Y.; Itoh, K.; Hagiwara, R.; Fukunaga, T.; Ito, Y. Short-range structures of poly(dicarbon monofluoride) (C2F)n and poly(carbon monofluoride) (CF)n. Carbon 2004, 42, 2897–2903. [Google Scholar] [CrossRef]
- Cheng, L.; Jandhyala, S.; Mordi, G.; Lucero, A.T.; Huang, J.; Azcatl, A.; Addou, R.; Wallace, R.M.; Colombo, L.; Kim, J. Partially Fluorinated Graphene: Structural and Electrical Characterization. ACS Appl. Mater. Interfaces 2016, 8, 5002–5008. [Google Scholar] [CrossRef] [PubMed]
- Dubois, M.; Guérin, K.; Zhang, W.; Ahmad, Y.; Hamwi, A.; Fawal, Z.; Kharbache, H.; Masin, F. Tuning the discharge potential of fluorinated carbon used as electrode in primary lithium battery. Electrochim. Acta 2012, 59, 485–491. [Google Scholar] [CrossRef]
- Feng, X.; Xu, M.; Guo, N.; Ma, R.; Yan, L.; Cai, L.; Jia, D.; Ai, L.; Wang, L. Dual-Salt-Induced Hierarchical Porous Structure in a Carbon Sheet for High Performance Supercapacitors. Langmuir 2023, 39, 6865–6873. [Google Scholar] [CrossRef] [PubMed]
- Li, M.; Liu, C.; Zhao, H.; An, H.; Cao, H.; Zhang, Y.; Fan, Z. Tuning sulfur doping in graphene for highly sensitive dopamine biosensors. Carbon 2015, 86, 197–206. [Google Scholar] [CrossRef]
- Kiciński, W.; Dziura, A. Heteroatom-doped carbon gels from phenols and heterocyclic aldehydes: Sulfur-doped carbon xerogels. Carbon 2014, 75, 56–67. [Google Scholar] [CrossRef]
- Lacey, M.J.; Yalamanchili, A.; Maibach, J.; Tengstedt, C.; Edström, K.; Brandell, D. The Li-S battery: An investigation of redox shuttle and self-discharge behaviour with LiNO3-containing electrolytes. RSC Adv. 2015, 6, 3632–3641. [Google Scholar] [CrossRef]
- Barlow, A.J.; Quinton, J.S. Radio frequency SF6 plasma modified single-walled carbon nanotubes: Synchrotron spectroscopy and plasma characterisation studies. In Proceedings of the IEEE 2010 International Conference on Nanoscience and Nanotechnology (ICONN), Sydney, Australia, 22–26 February 2010; pp. 120–123. [Google Scholar] [CrossRef]
- Lindberg, B.J.; Hamrin, K.; Johansson, G.; Gelius, U.; Fahlman, A.; Nordling, C.; Siegbahn, K. Molecular Spectroscopy by Means of ESCA II. Sulfur compounds. Correlation of electron binding energy with structure. Phys. Scr. 1970, 1, 286–298. [Google Scholar] [CrossRef]
- Delabarre, C.; Guérin, K.; Dubois, M.; Giraudet, J.; Fawal, Z.; Hamwi, A. Highly fluorinated graphite prepared from graphite fluoride formed using BF3 catalyst. J. Fluor. Chem. 2005, 126, 1078–1087. [Google Scholar] [CrossRef]
Figure 1.
X-ray diffractograms of S-graphene compounds before and after fluorination.

Figure 2.
TEM images of non-fluorinated S-graphene compounds (a), F70-60 min (b), and F140-60 min (c).
Figure 2.
TEM images of non-fluorinated S-graphene compounds (a), F70-60 min (b), and F140-60 min (c).

Figure 3.
TEM images of compounds F70-60 min and elemental mapping of compounds of F70-60 min (a) and F140-60 min (b). S mappings are not shown because of the low S content.
Figure 3.
TEM images of compounds F70-60 min and elemental mapping of compounds of F70-60 min (a) and F140-60 min (b). S mappings are not shown because of the low S content.

Figure 4.
Infrared spectra of sulfur-doped graphene before and after fluorination under different conditions.
Figure 4.
Infrared spectra of sulfur-doped graphene before and after fluorination under different conditions.

Figure 5.
19F (a), 13C (b), and 19F→13C cross-polarization (c) NMR spectra of sulfur-doped fluorinated graphene.
Figure 5.
19F (a), 13C (b), and 19F→13C cross-polarization (c) NMR spectra of sulfur-doped fluorinated graphene.

Figure 6.
XPS spectra of S-graphene before (a) and after fluorination at 70 °C (b) and 140 °C (c) for 60 min.
Figure 6.
XPS spectra of S-graphene before (a) and after fluorination at 70 °C (b) and 140 °C (c) for 60 min.

Figure 7.
XPS C 1s and F 1s spectra of compounds F70-60 min (a,b) and F140-60 min (d,e) and S 2p spectrum of compound F70-60 min (c).
Figure 7.
XPS C 1s and F 1s spectra of compounds F70-60 min (a,b) and F140-60 min (d,e) and S 2p spectrum of compound F70-60 min (c).

Figure 8.
(a) Voltammogram of compound F70-60 min recorded at 0.01 mV/s with 1M LiPF6 in EC/PC/3DMC electrolyte, (b) IR spectrum of F70-60 min.
Figure 8.
(a) Voltammogram of compound F70-60 min recorded at 0.01 mV/s with 1M LiPF6 in EC/PC/3DMC electrolyte, (b) IR spectrum of F70-60 min.

Figure 9.
Galvanostatic discharge curve for F70-60 min at 10 mA/g with 1M LiPF6 in EC/PC/3DMC.

Figure 10.
Galvanostatic discharge curves for F70-60 min at different current densities.

Figure 11.
Reduction potential at mid-discharge as a function of the 19F chemical shift of the C-F bonds of several materials taken from [40]. The cells used 1M LiClO4 in PC electrolyte. The compound F70-60 min is represented by the red star. IF5 means room temperature graphite prepared with IF5 catalyst and its post-treatment temperature is added, e.g., IF5-350 was post-fluorinated with pure F2 gas at 350 °C. The same notation is used for graphite fluoride with (C2.5F)n structural type.

Figure 12.
19F NMR spectra of F70-60 min (grey), of the electrode before any electrochemical process (blue), and of the electrode after electrochemical reduction of up to 1.5 V (red).
Figure 12.
19F NMR spectra of F70-60 min (grey), of the electrode before any electrochemical process (blue), and of the electrode after electrochemical reduction of up to 1.5 V (red).


Table 1.
Fluorination temperatures and durations for sulfur-doped graphene.
| Notation | Temperature (°C) | Duration (min) |
|---|---|---|
| F25-30 min | 25 | 30 |
| F70-30 min | 70 | 30 |
| F70-60 min | 70 | 60 |
| F140-60 min | 140 | 60 |
Table 2.
Chemical composition in C, O, S, and F of the compounds S-graphene, F70-60 min, and F140-60 min.
Table 2.
Chemical composition in C, O, S, and F of the compounds S-graphene, F70-60 min, and F140-60 min.
| Chemical Composition | ||||
|---|---|---|---|---|
| Compound | TEM-EDX | |||
| C | O | S | F | |
| S-graphene | 93.68 | 2.99 | 2.47 | --- |
| F70-60 min | 90.75 | 1.93 | 2.00 | 5.02 |
| F140-60 min | 83.02 | 0.46 | 0.00 | 16.82 |
Table 3.
Relative contents of carbon-, oxygen-, fluorine-, and sulfur-containing groups from the deconvolution of XPS spectra of compounds F70-60 min and F140-60 min. Because of the low sulfur content, no component of either C-S or S-F is considered.
Table 3.
Relative contents of carbon-, oxygen-, fluorine-, and sulfur-containing groups from the deconvolution of XPS spectra of compounds F70-60 min and F140-60 min. Because of the low sulfur content, no component of either C-S or S-F is considered.
| Element | Assignment | F70-60 Min | F140-60 Min | |||
|---|---|---|---|---|---|---|
| Binding Energy (eV) | Relative Amount (at.%) | Binding Energy (eV) | Relative Amount (at.%) | |||
| C | C (sp3) | 285.0 | 0.62 | 284.7 | 0.43 | |
| C -CFx (type II) & C-S | 286.6 | 1.4 | 286.3 | 0.45 | ||
| CF-C-CF (type II) | 287.5 | 9.8 | 287.3 | 3.5 | ||
| CF (type II) | 290.0 | 31.9 | 289.7 | 28.8 | ||
| CF2 (type II) | 292.0 | 6.9 | 291.6 | 10.8 | ||
| CF3 | 294.0 | 0.91 | 293.5 | 1 | ||
| O | O-C-F | 535.1 | 1.57 | 534.96 | 0.45 | |
| C-O | - | - | 532.15 | 0.11 | ||
| F | C-F | 688.7 | 46.7 | 688.5 | 54.5 | |
| SOx & SFx | S 2p3/2 | S 2p1/2 | - | - | ||
| S | S1 (-S=O) | 165.7 | 166.9 | 0.02 | ||
| S2 (SO32−) | 167.9 | 169.1 | 0.01 | - | - | |
| S3 (SO42−) | 169.4 | 170.6 | 0.01 | - | - | |
| S4 (-SOFx) | 171.7 | 172.9 | 0.04 | - | - | |
| S5 (-SF5) | 174.2 | 175.4 | 0.03 | - | - | |
Table 4.
Electrochemical data for F70-60 min obtained at different reduction current densities.
| C Rate | Current Densities (mA/g) | Cexp ± 10% (mAh/g) | E1/2 (V) | Specific Energy (Wh/kg) | Power Density (W/kg) | Faradic Yield (%) ± 10% |
|---|---|---|---|---|---|---|
| 0.01C | 10 | 773 | 3.10 | 2396 | 31 | 103 |
| 0.2C | 150 | 764 | 2.74 | 2093 | 411 | 102 |
| 1C | 751 | 675 | 2.54 | 1715 | 1908 | 90 |
| 2C | 1502 | 741 | 2.40 | 1778 | 3605 | 99 |
Disclaimer/Publisher’s Note: The statements, opinions and data contained in all publications are solely those of the individual author(s) and contributor(s) and not of MDPI and/or the editor(s). MDPI and/or the editor(s) disclaim responsibility for any injury to people or property resulting from any ideas, methods, instructions or products referred to in the content. |
© 2023 by the authors. Licensee MDPI, Basel, Switzerland. This article is an open access article distributed under the terms and conditions of the Creative Commons Attribution (CC BY) license (https://creativecommons.org/licenses/by/4.0/).
Share and Cite
MDPI and ACS Style
Colin, M.; Farhat, H.; Chen, S.; Petit, E.; Flahaut, E.; Guérin, K.; Dubois, M. High Energy Density Primary Lithium Battery with Fluorinated S-Doped Graphene. C 2024, 10, 3. https://doi.org/10.3390/c10010003
AMA Style
Colin M, Farhat H, Chen S, Petit E, Flahaut E, Guérin K, Dubois M. High Energy Density Primary Lithium Battery with Fluorinated S-Doped Graphene. C. 2024; 10(1):3. https://doi.org/10.3390/c10010003
Chicago/Turabian StyleColin, Marie, Hani Farhat, Sam Chen, Elodie Petit, Emmanuel Flahaut, Katia Guérin, and Marc Dubois. 2024. "High Energy Density Primary Lithium Battery with Fluorinated S-Doped Graphene" C 10, no. 1: 3. https://doi.org/10.3390/c10010003
Note that from the first issue of 2016, this journal uses article numbers instead of page numbers. See further details here.