Article

Co-Inoculation of Latilactobacillus sakei with Pichia kluyveri or Saccharomyces boulardii Improves Flavour Compound Profiles of Salt-Free Fermented Wheat Gluten

1
Department of Food Science and Technology, National University of Singapore, Science Drive 2, Singapore 117542, Singapore
2
Nestlé Research and Development Center Singapore, 29 Quality Road, Singapore 618802, Singapore
3
Nestlé Research Konolfingen, Nestléstrasse 3, 3510 Konolfingen, Switzerland
4
Nestlé Product Technology Center Food, Lange Str. 21, 78224 Singen, Germany
5
Department of Microbiology and Immunology, NUS Yong Loo Lin School of Medicine, National University of Singapore, 1E Kent Ridge Road, Singapore 119228, Singapore
6
National University of Singapore (Suzhou) Research Institute, No. 377 Linquan Street, Suzhou Industrial Park, Suzhou 215123, China
*
Author to whom correspondence should be addressed.
Fermentation 2024, 10(2), 75; https://doi.org/10.3390/fermentation10020075
Submission received: 12 January 2024 / Revised: 20 January 2024 / Accepted: 21 January 2024 / Published: 24 January 2024
(This article belongs to the Collection Yeast Biotechnology)

Abstract

:
A wheat gluten fermentation process with the inoculation of different microorganisms under salt-free conditions has the potential to produce varying flavour profiles. As research on the co-fermentation of yeasts and lactic acid bacteria (LAB) in salt-free wheat gluten fermentation is scarce, the current work studied the flavour impact on fermented wheat gluten by the co-inoculation of Latilactobacillus sakei with one yeast (Saccharomyces boulardii or Pichia kluyveri). The results showed that similar glucose and organic acid levels were detected, but early death of yeasts was observed during liquid-state fermentation (LSF) in co-fermentations. The concentrations of most free amino acids were comparable. Volatile compound analysis showed synergistic effects in co-cultured fermentations on the production of certain compounds such as isoamyl acetate. Principal component analysis revealed clear differences in volatile profiles between co-fermentation and single-strain fermentation. Therefore, a fermented sauce produced by co-inoculating LAB and yeast with a new and fruitier flavour was developed.

1. Introduction

Fermentation as a traditional biopreservation method has been widely used in the food industry to extend shelf life, and at the same time, impart characteristic flavours to products [1]. Among the various fermented products, the aroma profiles of beer, wine and soy sauce have been well characterized, and yeasts play a key role in some signature aroma production such as fruitiness and floral flavour [2,3,4,5,6]. One of the most important pathways for fruity and floral aroma generation by yeast is through the Ehrlich pathway of amino acid metabolism. Branched-chain or aromatic amino acids including leucine, isoleucine, valine and phenylalanine are transaminated, decarboxylated and reduced to form flavour active alcohols, and subsequently esters [7,8]. Under different environmental conditions, the transcription and translation of one of the key enzymes, alcohol acetyl-CoA transferase, for ester production can be regulated, depending on a number of factors such as temperature, amount of unsaturated fatty acid and availability of precursors [9,10]. Thus, the efficiency of the production of flavour-active compounds could be affected by many external factors, and it could potentially be improved by the modulation of fermentation conditions.
Many studies have reported on beneficial interactions between LAB and yeasts in a variety of food products, such as wine, coffee, dairy products and sourdough, to boost desirable flavour compounds [11,12,13,14], demonstrating the potential of co-culturing non-halophilic LAB and yeast to generate interesting aroma compounds in a zero-salt or low-salt environment. However, salt is usually added at high concentrations in many savoury sauce fermentation processes. To ensure the survival of microbes under high-salt fermentation conditions, halophilic yeasts and lactic acid bacteria (LAB) are also usually involved in the spontaneous fermentation of soy sauce. Many studies have explored the possibility of co-inoculation of yeasts and LAB into soy sauce, with special focus on the effect of halophilic strains that could survive in the high-salt condition in soy sauce fermentation [5]. The halophilic LAB strain Tetragenococcus halophilus has been paired with Zygosaccharomyces rouxii, showing enhanced taste and more complex volatile compounds production [15], higher levels of key volatile compounds such as 4-hydroxy-2,5-dimethyl-3(2H)-furanone (HDMF) [16] and improved levels of sweet and umami amino acids [17]. Meyerozyma (Pichia) guilliermondii is sometimes co-inoculated with Z. rouxii, and some key volatile flavour compounds such as HDMF and 2-methyl-1-propanol were reported to increase [16,18]. However, most of the reported co-cultured fermentations were conducted using halophilic strains with the presence of salt in soybean-based substrates, and similar research is scarce on wheat gluten under salt-free conditions using non-halophilic LAB and/or yeasts to produce a savoury sauce product.
Since the co-inoculation of yeast and LAB is a commonly used method in salt-containing sauce fermentation, and also given the abundant knowledge of aromatic compound production by non-halophilic yeasts under salt-free conditions in the wine industry, we hypothesize that if a bacteriocin-producing LAB could be selected and paired up with a non-halophilic wine yeast under salt-free conditions, there is a potential of producing a fermented savoury product with a new flavour direction, which can be differentiated from traditional soy sauce. In our previous study, we demonstrated that the single-inoculation of Lactobacillus sakei LTH673, Pichia kluyveri FrootZen or Saccharomyces boulardii NCYC3264 in a salt-free wheat gluten fermentation process could lead to differentiating flavour profiles [19]. In this study, in order to further modify or intensify flavour production, a similar fermentation process with a slight modification was carried out. Wheat gluten, the dough-forming protein in wheat, was still selected as the protein source to carry out salt-free fermentation based on a patent by Baensch et al. [20] and Lim et al. [21], which involves a short salt-free fermentation process using LAB. Given the salt-free condition, we investigated the impact of the co-inoculation of non-halophilic bacteriocingenic Latilactobacillus sakei LTH673 with Pichia kluyveri FrootZen or Saccharomyces boulardii NCYC 3264 on the flavour compound profiles of fermented salt-free wheat gluten.

2. Materials and Methods

2.1. Chemicals, Reagents and Microorganisms

L. sakei subsp. sakei LTH673 (“LSK”) was obtained from Nestlé Culture Collection (Lausanne, Switzerland). P. kluyveri FrootZen (“FZ”) was bought from Chr. Hansen (Hørsholm, Denmark). S. boulardii NCYC 3264 (“3264SB”) was procured from National Collection of Yeast Culture (Norwich, UK). Aspergillus oryzae koji seed Ichimurasaki was purchased from Bio’C (Aichi, Japan). The growth and storage conditions were set as reported by Chen et al. [19].

2.2. Solid-State Fermentation (SSF)

Wheat gluten obtained from the Nestlé Dongguan factory in China and a 0.84% w/w acetic acid solution (Mercury Chemicals, Singapore) were mixed together at 186:119 (w/w). The wetted wheat gluten was rested for 20 min before being cooked at 100 °C for 20 min. It was left at room temperature to cool before the inoculation of strains.
Two inoculated samples were then prepared: FZCO samples were inoculated with P. kluyveri FrootZen to reach a final count of approximately 104 CFU/mL and L. sakei LTH673 to reach a final count of approximately 105 CFU/mL based on the calculation of stock count and total weight of the substrate; 3264CO samples were inoculated with S. boulardii NCYC 3264 to reach a final count of approximately 104 CFU/mL and L. sakei LTH673 to reach a final count of approximately 105 CFU/mL based on the calculation of stock count and total weight of the substrate. The inoculated gluten was incubated in a sterile incubation box with width of 20 mm, length of 20 mm and height of 10 mm for SSF. The temperature of the system was set to be 30 °C from 0 to 24 h, 29 °C from 25 to 34 h and 26 °C from 35 to 40 h. Aeration was achieved by pumping 20 L/h filtered compressed air into the system from the bottom of the system where a tray of water was placed. After 40 h of SSF, the koji was harvested and stored at −80 °C before LSF. The koji was stored for a maximum of 4 weeks.

2.3. Liquid-State Fermentation (LSF)

LSF was conducted after SSF by mixing the koji with sterile milli Q water at 7:13 (w/w) and incubating it for four days in a bioreactor (Infors HT, Singapore). Temperature was set to be 30 °C on the first day, paired with a build-in pH stat with 32% sodium hydroxide (Chemical Industries Far East Ltd., Singapore) to maintain the pH above 6.5. From the second day onwards, pH was allowed to drop with the removal of pH control, and the temperature was raised to 35 °C until the fourth day. The stirring was set to be 400 rpm throughout the LSF. Daily samples were stored at −80 °C before analysis.

2.4. Microbial Enumeration

Samples from SSF were diluted with Milli Q water in the ratio of 1:10 (w/w). The diluted samples underwent serial dilution by 10 folds with peptone water (Oxoid). Spread plating on MRS agar with 0.05% (w/w) natamycin (Dupont, Singapore) was used to quantify LAB. Spread plating on potato dextrose agar (PDA) (Oxoid) with 0.01% (w/w) chloramphenicol (Sigma-Aldrich, Singapore) was used to enumerate yeast and fungi. The sterility of the fermented substrates was checked by ensuring no growth of contaminating species on plate count agar (PCA) (Oxoid). Incubation of all plates was carried out at 30 °C for 1–2 days before the counting of colonies.

2.5. Non-Volatile Compound Analysis

Organic acid analysis was conducted using the method by Lu et al. [22] in triplicates. The equipment and column used was Shimadzu HPLC apparatus with Supelcogel C-610 column (300 × 7.8 mm, Supelco, Bellefonte, PA, USA), with 0.1% (v/v) sulfuric acid as a mobile phase at 0.4 mL/min. The detector of photodiode array was set at 210 nm. All samples from day 0, 1, 2, 3 and 4 of LSF were diluted 10, 100 and 100 times with 0.1% (v/v) sulfuric acid. The diluted samples were then filtered with PTFE filters (13 mm, 0.22 μm) before HPLC organic acid analysis.
Glucose content in the samples was analysed using Roche glucose enzymatic assay kits based on the supplier’s instructions (BioScience Diagnostics Pte Ltd., Singapore).
For free amino acids analysis, samples were prepared into 10, 100, 1000-time dilutions using distilled water. The dilutions were then filtered with 0.2 nm PVDF Acrodisc LC13 filters (PALL, Singapore) before analysis. The dilutions were then injected into an LC-MS system (Agilent Technologies, Santa Clara, and MS from Sciex, Framingham, MA, USA) paired with a triple quadrupole (QQQ) Mass Spectrometer (MS). Mobile phase was prepared as follows: Eluent A: acetonitrile: water:acetic acid at 100:900:5 (v/v) ratio; Eluent B: acetonitrile: water: acetic acid at 900:100:5 (v/v) ratio, and they were run at a flow rate of 0.6 mL/min. The columns included a CC 8/4 Nucleodur 100-3 HILIC pre-column, followed by EC 250/4 Nucleodur 100-3 HILIC column. The mobile phase gradient, equipment setting, use and preparation of internal and external standards, and calculation of actual concentration of free amino acids were all conducted according to the methods reported by Chen et al. [19]. The ratio of the peak areas of external standards (Sigma-Aldrich, Singapore) with the respective internal standards, and the peaks of corresponding internal standards, were used to establish standard curves for each amino acid. The following formula was used for the calculation of actual concentration of each amino acid.
Concentration of actual amino acid = ( Peak area of amino acid in the sample Peak area of respective internal standard b ) k a
where a (the slope of the linear regression), b (intercept of the linear regression) and k (dilution factor) could be determined from the standard curve.

2.6. Volatile Compound Analysis

Samples from days 0, 1, 2, 3 and 4 of LSF from each inoculation group (FZCO and 3264CO) were analysed for volatile compounds in triplicates by using solid-phase microextraction (SPME) and gas chromatography–mass spectrometry (SPME-GC-MS) (Agilent 7890B GC/5977 MSD) (Agilent Technologies, Singapore) with a DB-5MS UI column (30 m × 0.250 mm × 0.25 μm) (Agilent Technologies). The extraction, equipment setup, temperature gradient, analysis and identification were all performed according to the method used in the study by Chen et al. [19]. The identification of the compounds was based on the matching of the mass spectra in the main EI MS Library with the Agilent Mass Hunter (version 10.0) quantitative analysis software. The peak area detected for each volatile compound was used to estimate the quantity of the compound.

2.7. Statistical Analysis

Three biological triplicates were conducted for each inoculation group. When comparing cell count data, independent t-test was used to determine the difference in cell counts between the two inoculation groups on each day using Minitab 17 at p < 0.05. Outliers were detected and removed using box plot method on Python 3.

3. Results

3.1. Changes in Microbial Populations

The inoculation dosage of L. sakei in FZCO samples and 3264CO samples was standardized at 105 CFU/mL, while P. kluyveri FrootZen and S. boulardii NCYC3264 inoculum sizes in FZCO samples and 3264CO samples were 10 times lower than that of L. sakei LTH673. Cell counts at the end of SSF are shown in Figure 1.
Final LAB counts in both co-cultured trials did not differ significantly at the end of SSF. LAB in both trials grew from approximately 105 to 108 CFU/g and yeast to 108 CFU/g (Figure 1a), suggesting that the inoculation of a yeast at a lower count than LAB did not impede yeast growth as they grew to comparable counts to the LAB. Both yeasts grew 4 logs from 104 to approximately 108 CFU/g in both FZCO and 3264CO co-cultured samples (Figure 1b).
In Figure 2a, fungal count declined rapidly from day 0 to day 2 of LSF. In Figure 2b, a decreasing trend was also observed for yeast counts in the two co-culture trials. From Figure 2c, the LAB count followed similar trends in all samples. The increase in LAB count to more than 9 Log (CFU/mL) from day 0 to 1 in all trials was followed by a slow decline from day 1 to day 4. The final LAB count was still above 5 Log (CFU/mL) in all trials.
The pH changes during LSF are shown in Figure 2d. The pH control above 6.5 was removed on day 1. In general, the pH of samples in all trials decreased over the 4-day fermentation. The trends of pH changes over LSF were similar in LSK, FZCO and 3264CO samples.

3.2. Changes in Sugar and Organic Acids

Sugar analysis was conducted on all the samples, and glucose was the only sugar detected in all samples. Glucose was only detected at the beginning of LSF at a level below 1 mg/mL and was no longer detectable after day 1. Organic acid analysis was also performed, and lactic acid, acetic acid, quinic acid, oxalic acid and formic acid were identified in all the samples. From Figure 3a,b, similar trends can be seen for all the organic acids. The concentration of lactic acid increased over LSF to more than 40 mg/mL on day 4. Similarly, the acetic acid level also increased from less than 5 mg/mL to more than 10 mg/mL (Figure 3a,b). Quinic acid, oxalic acid and formic acid remained relatively low below 10 mg/mL most of the time (Figure 3a,b).

3.3. Changes in Free Amino Acids during Liquid State

The changes in selected amino acids are presented in Table 1. As seen in Table 1, with the presence of L. sakei in all trials, the changes in the concentration of glutamic acid were similar across the different inoculation conditions. Glutamic acid increased from less than 40 mM at the beginning of LSF to more than 100 mM in all trials. Another savoury amino acid, cysteine, was present at a relatively lower level than glutamic acid. The concentration of cysteine remained lower than 1.00 mM throughout LSF in both co-culture trials, in the presence of both L. sakei and one yeast (Table 1). The three branched-chain amino acids (BCAAs), leucine, isoleucine and valine, exhibited similar increasing trends in all treatment groups. The final concentrations of the three BCAAs were slightly lower in 3264CO samples (Table 1). The concentration of serine remained at a relatively low and steady level in both inoculation groups. In FZCO samples, the level reduced from 8.80 mM on day 0 to 5.04 mM on day 2 and increased again to 7.12 mM on day 4 (Table 1). While in 3264CO samples, serine was depleted from 4.08 mM on day 1 and slowly increased to 2.47 mM on day 4 (Table 1). In terms of arginine, the concentration of arginine started from 2.20 to 2.25 mM in both treatment groups but dropped below 0.15 mM in FZCO samples during LSF, while it remained at a relatively constant level above 1.5 mM in 3264CO (Table 1). At the same time, the ornithine levels in both groups were comparable, showing an increasing trend over LSF (Table 1).

3.4. Changes in Volatile Compounds during Liquid-State Fermentation

The changes in the concentration of detected volatile compounds over LSF are illustrated in the heat map in Figure 4a,b. The mathematical summation of peak area of a particular compound is shown under the LSK+FZ group (monocultures) and 3264+LSK group (monocultures) [19], to compare against the peak area in the respective co-culture groups (FZCO and 3264CO).
From Figure 4a, the peak areas of many carbonyl compounds were higher in co-cultured samples inoculated with both L. sakei and P. kluyveri than the summation of the peak area of corresponding compounds in monocultures (results from [19]), including 2,3-butanedione, 2 and 3-methylbutanal, 2-methyl 2-butenal, hexanal, heptanal, benzaldehyde, methional, 3-octanone, etc., except for pentanal, 2-octenal and 2-phenyl 2-butanal. The intensity of most carbonyl compounds increased over the 4-day LSF and peaked on days 3 or 4. In terms of alcohols, ethanol increased over time in FZCO. Volatile alcohols such as 2-methyl propanol, propanol, 2 and 3-methyl butanol, 2,3-butanediol, hexanol and methionol were higher in FZCO than the mathematical summation of individual inoculation. For esters, most esters were higher in peak area in the mathematical summation of single cultures, except for 2-methyl butyl acetate and isoamyl acetate, which were detected with the highest peak area among all esters, were higher in FZCO. A decreasing trend was seen for isoamyl acetate over LSF. Overall, a synergistic effect could be seen for most carbonyl compounds, alcohols, and some esters such as 2-methyl butyl acetate and isoamyl acetate, while the rest of the esters were higher in individual inoculations.
From Figure 4b, carbonyl compounds including 2,3-butanedione, 2-methyl butanal, 3-methyl butanal, 2-heptanone, 3-octanone, benzeneacetaldehyde, 2-nonanone and 2-phenyl-2-butenal were higher in peak area in the mathematical summation of the individual inoculation of L. sakei and S. boulardii. However, the peak area for pentanal, 2-methyl 2-butenal, heptanal, methional, 2-octenal and 2-nonenal were higher in the co-culture of L. sakei and S. boulardii. For alcohols, ethanol, 2-methyl propanol, 2-methyl butanol, 3-methyl butanol, hexanol, 1-octen-3-ol and phenethyl alcohol were lower in co-cultured samples, but with higher levels of propanol and higher methional on day 3. Most esters, except for 3-methylthiopropyl acetate, ethyl heptanoate, ethyl octanoate, ethyl palmitate, ethyl linoeate and ethyl oleate, were higher in the co-cultured samples with L. sakei and S. boulardii. For other compounds, the co-cultured sample was higher in dihydro-5-pentyl-2(3H)-furanone but lower in 2-pentyl furan and 2,6-dimethyl pyrazine.

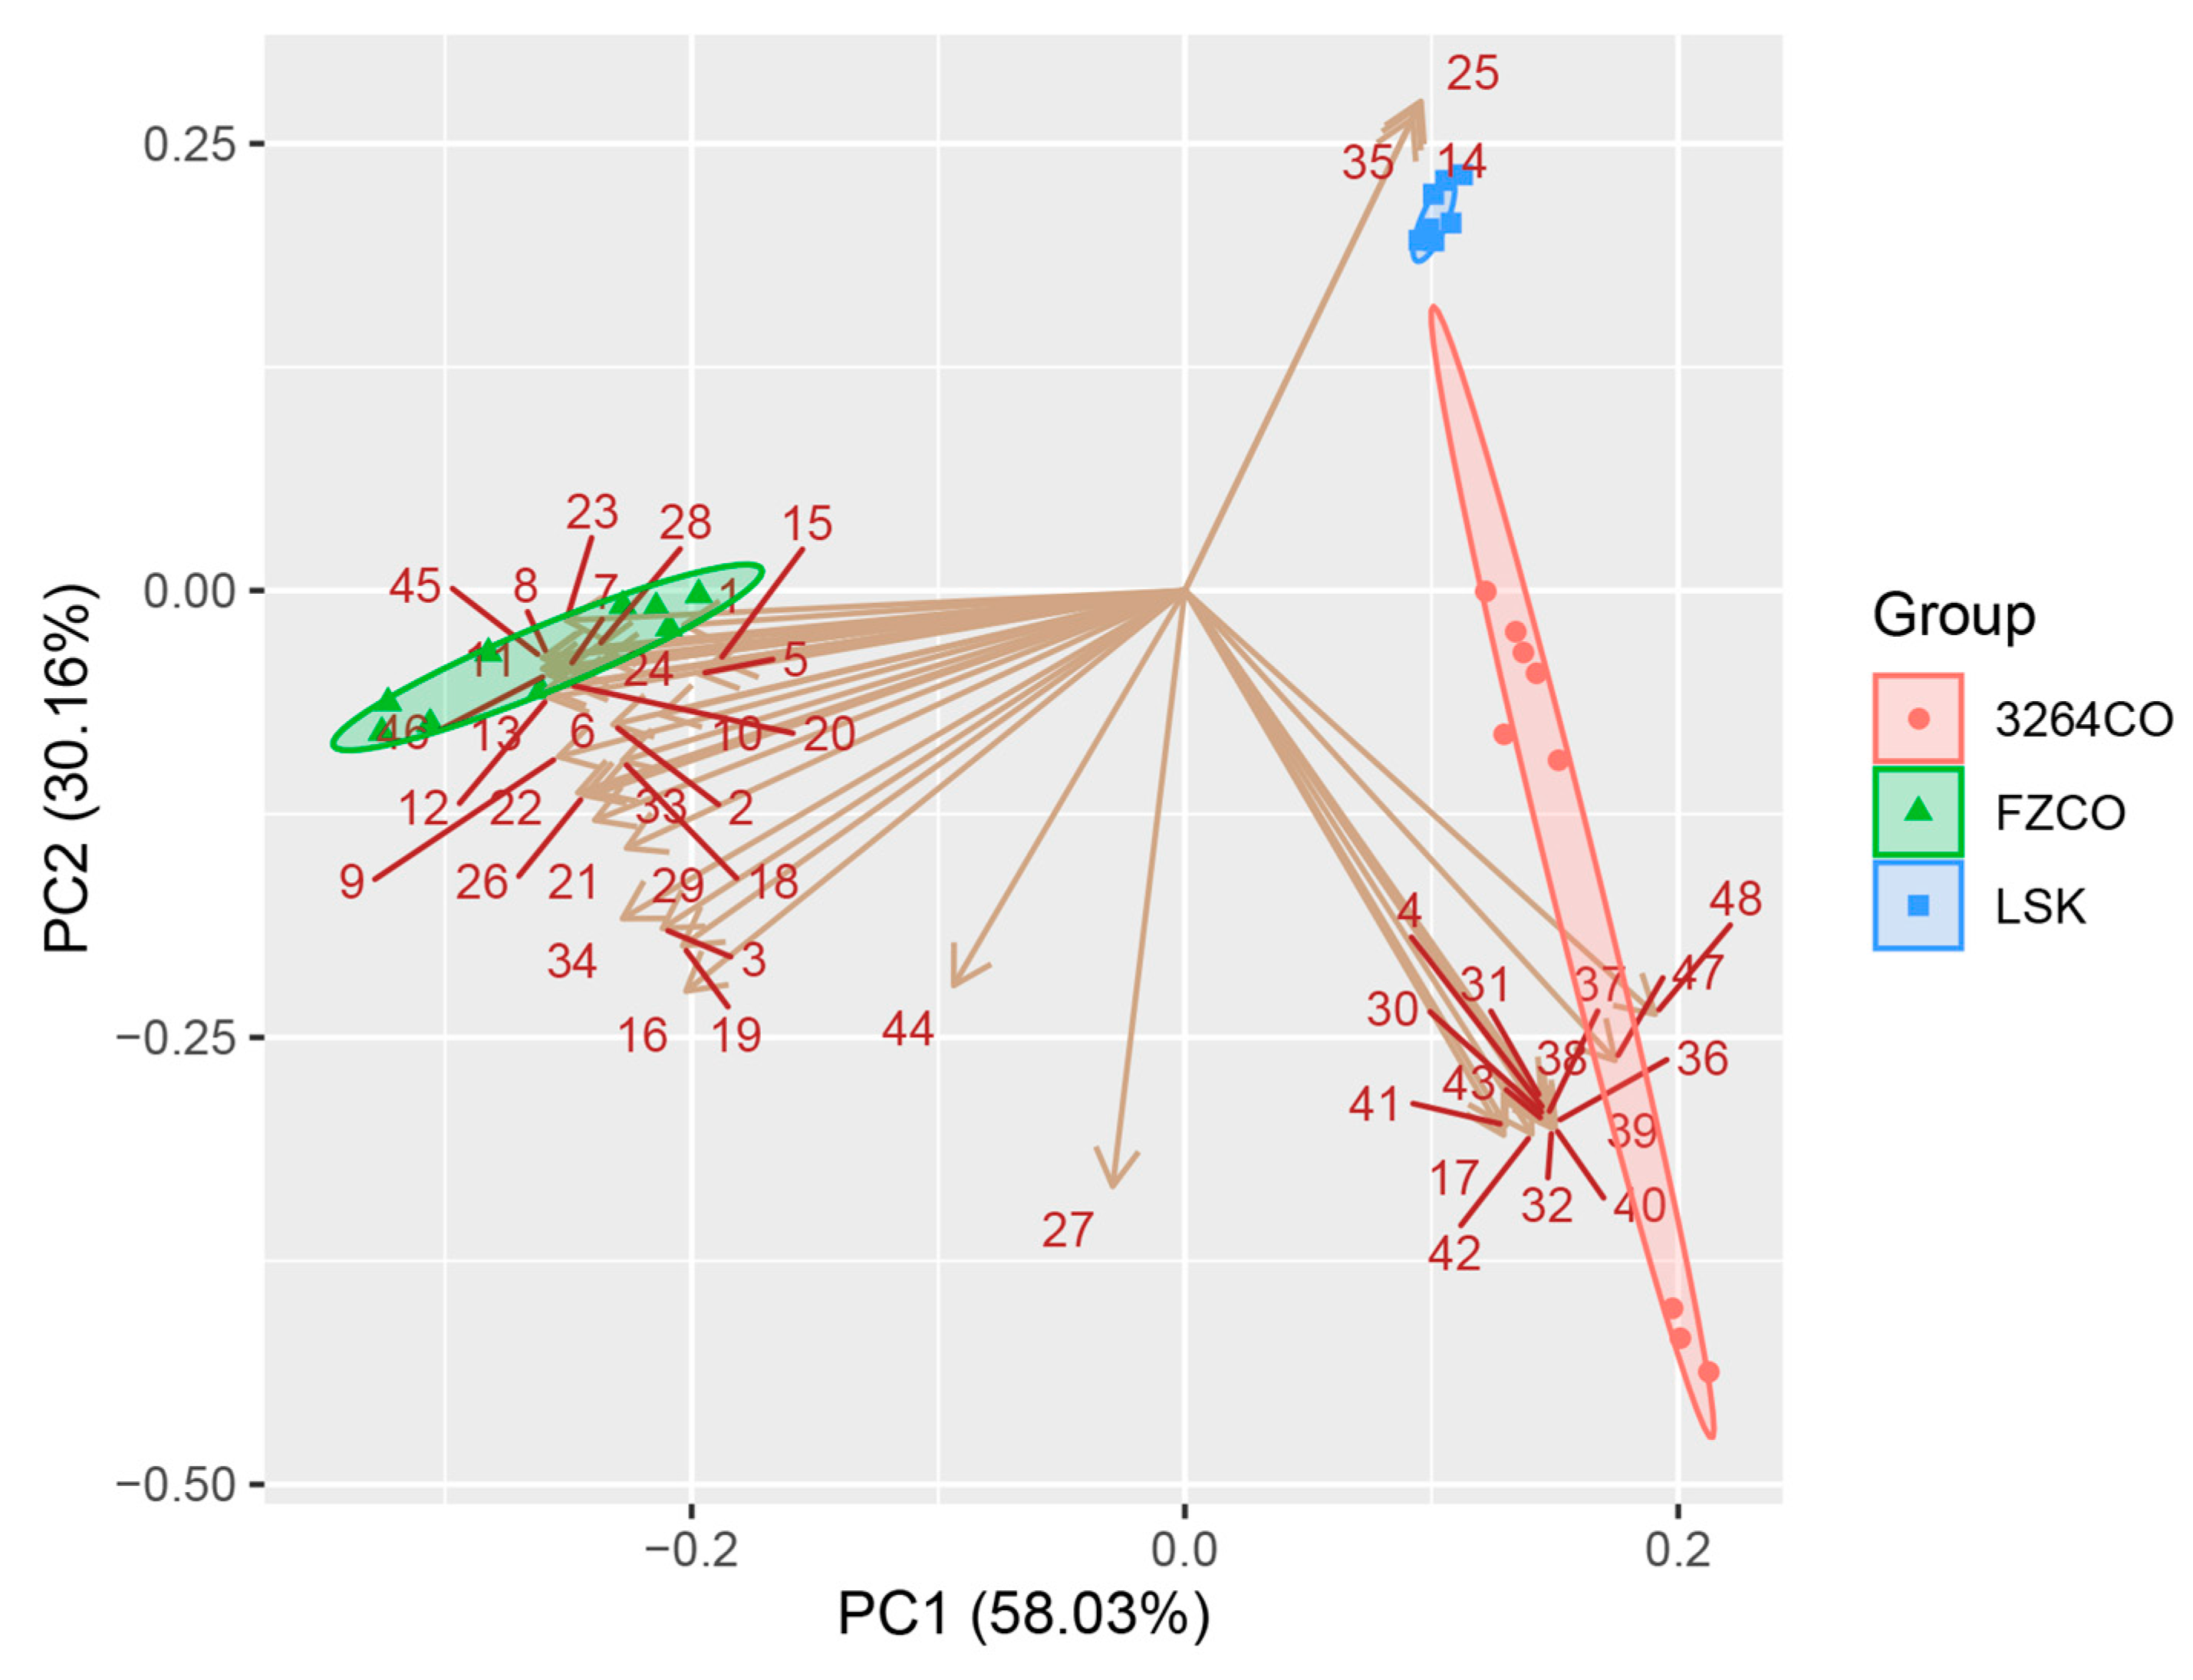
3.5. Principal Component Analysis of Volatile Compounds in Fermented Wheat Gluten Sauce

PCA was performed based on the peak areas of the volatile compounds identified in LSK [19], FZCO and 3264CO on day 4 of LSF. Figure 5 shows the score plot of the differences in volatile compounds in different inoculation conditions. The LSK sample is in the negative PC1 (58.03%) region while FZCO is located in the positive PC1 region, which is affected by compounds such as isoamyl acetate and 2-phenethyl alcohol, which are perceived to be fruity and floral, respectively. At the same time, 3264CO is mostly in the negative PC2 (30.16%) region, while LSK is located in the positive PC2 region. This difference is caused by some esters such as 2-phenylethyl acetate, ethyl benzoate and ethyl palmitate. Most of these esters also contribute to fruity and floral perceptions. In general, the co-inoculation of LAB and yeast gives rise to very different volatile profiles as compared to L. sakei single inoculation, mostly in terms of fruity and floral direction.

4. Discussion

This study focused on the flavour compound profile of wheat gluten undergoing a 40 h SSF followed by a 4-day LSF. The combination of co-culturing a yeast and a LAB was explored in this salt-free wheat gluten fermentation process, and with cell counts, organic acids, amino acids and volatile compounds compared.
During SSF, although yeasts were inoculated at a lower count than the LAB, both strains were able to grow without suppression. One reason could be the spatial fixation of the microbes in SSF, and the localized microbes are only able to utilize the nutrients at the point of anchorage. Another reason could be the lack of competition for nutrients between the yeast and the LAB due to underlying mechanisms that prevent exclusion [23], as they may utilize different sources of energy to build up the cell mass when co-cultured. An abundant supply of nutrients such as amino acids in the gluten could be another explanation. Yeast counts for both P. kluyveri and S. boulardii were slightly lower in single cultures [19] than that in co-cultured samples (FZCO and 3264CO). This indicates that the inoculation of L. sakei with FZ yeast or 3264 yeast could potentially improve the growth of the yeast in SSF. Many studies have shown evidence of the mutual stimulation of growth in LAB and yeasts in many food products with a stable microbial community [12,24]. In this case, the yeast might be able to utilize the metabolites from LAB such as acids for enhanced cell growth [23].
However, when L. sakei and either of the yeasts were co-inoculated at the beginning of SSF, fungal and yeast counts started to decline during LSF, which was not reported in the study when single yeast/LAB culture was inoculated [19]. Yeast suppression by LAB has been reported in some co-cultured LSF studies on soy sauce [25,26]. From the organic acid analysis, it could be seen that the concentration of acetic acid increased rapidly since the start of LSF, and the presence of acetic acid at certain concentrations (e.g., 20–200 mM for 200 min at pH 3 for S. cerevisiae) was shown to trigger programmed cell death in some yeasts, and the concentration to activate apoptosis varies with different species [27,28,29]. The acetic acid concentration from day 1 onwards (e.g., approximately 167 mM) was within the range that may cause apoptosis in some yeasts. Given the pH of the samples on day 2 to day 4, some of the acetic acid molecules were present as an undissociated form, which could penetrate cell membrane and affect yeast survival more easily than the dissociated form. Further, the yeasts present in wheat gluten were exposed to the acetic acid for a longer time than the reported cases. Therefore, it is possible that the decline in yeast and fungal counts was attributed to the undissociated acetic acid molecules or other anti-yeast or anti-fungal compounds produced by L. sakei LTH673. More studies need to be conducted to understand the survival of the selected yeast at the given acetic acid concentration.
In terms of glucose utilization and organic acid profile, a similar trend was observed in samples co-inoculated by L. sakei and one yeast. In a prior study on single inoculation, it was shown that P. kluyveri FrootZen and S. boulardii NCYC3264 were poor lactic acid producers as compared to L. sakei LTH673 when single-cultured [19]. Thus, the increasing concentrations of lactic acid in both co-culture trials were mostly produced by L. sakei, by consuming the glucose present in the wheat-gluten. The lactic acid concentrations in both co-culture trials from day 3 to day 4 were lower than that in LSK samples, possibly due to competition for glucose and co-metabolism. Lactic acid as the metabolites of L. sakei could possibly be used by the yeasts as a carbon source, leading to the lower lactic acid content in the co-culture trials, or the lactic acid fermentation pathway favoured the reaction into other by products, such as acetic acid and carbon dioxide.
In terms of amino acid metabolism, transamination reaction converts BCAAs (valine, leucine and isoleucine) into flavour-imparting volatile compounds including the corresponding branched-chain alcohols, aldehydes and acids, by enzymes such as amino acid aminotransferases, pyruvate decarboxylases and alcohol dehydrogenases [30,31,32]. When yeasts and LAB were single-inoculated, P. kluyveri FrootZen was shown to be the best producer for transamination products such as 3-methyl butanal, 3-methyl butanol and isoamyl acetate [19]. In this study, the final leucine and isoleucine concentrations were also lower in the co-culture trials than single inoculation [19], indicating higher rates of consumption. Moreover, after adding up the respective peak area for 3-methyl butanal, 2-methyl butanal, 3-methyl butanol, 2-methyl butanol and isoamyl acetate in the two single-inoculated samples, the respective total peak area was much lower than the detected peak area of each compound in FZCO co-culture trial. Thus, a synergistic effect was revealed when P. kluyveri was co-inoculated with L. sakei in terms of some of the transamination products. One hypothesis is that since both L. sakei and P. kluyveri, when inoculated together with A. oryzae, were capable of the first step of transamination to generate the respective keto-acids from BCAA transamination reaction [19], a larger pool of aldehydes could then be generated from leucine and isoleucine to serve as precursors for subsequent reactions. P. kluyveri can further catalyse the reduction of aldehydes to alcohols and esters at a higher rate. As a result, a larger reservoir of alcohols led to a higher production of esters such as isoamyl acetate. Similarly, although the levels of 2 or 3-methyl butanal and 2 or 3-methyl butanol were lower in samples co-cultured with L. sakei and S. boulardii, the detected isoamyl acetate level was much higher in the 3264CO co-culture throughout LSF, as compared to the mathematical summation of peak areas in the two single-cultured samples. This could be because most of the branched-chain aldehydes and alcohols might have been channelled to the esterification and/or alcoholysis reaction between isoamyl alcohol and acetyl-CoA, which contributes to the higher isoamyl acetate level in co-culture trials.
It was noticeable that the production of the important ester isoamyl acetate, which imparts banana and fruity aroma, was decreasing in the co-cultured samples with L. sakei and P. kluyveri during LSF. There are three possible reasons for the reduction of isoamyl acetate in samples co-fermented by L. sakei and P. kluyveri during LSF. The first reason is the decline in yeast count during LSF. After the main ester-producing yeast died off, further accumulation of most esters slowed down. The second reason could be the chemical and enzymatic ester hydrolysis that may have occurred in the presence of acid and enzymes from autolyzed yeasts [8,33], which would lower the concentration of some esters. The third reason is that sampling might have also played a role in the loss of some volatile compounds when the production rate was lower during the later stage of LSF.
Methionine concentration was higher in samples single-cultured with L. sakei on day 4 of LSF [19], as compared to samples co-fermented by L. sakei and yeast possibly due to a lower consumption rate in single-cultured trials. Methionine can be converted to methional by the decarboxylation of 4-methylthio-2-oxobutyric acid (KMBA) [34,35]. From the degradation of methional, a potent flavour compound imparting cooked potato and savoury aroma, methionol, can be produced via the Ehrlich pathway [35]. During LSF, the methional and methionol levels seemed to be higher in samples co-fermented by yeast and L. sakei, as seen in the heat maps in Figure 4a,b. The higher methionine consumption and higher methionol and methional production in both co-cultured samples indicate a synergistic effect for the conversion of methionine into methionol and methional when both LAB and yeast are present. A key reason may be the production of keto-acids, especially alpha-ketoglutaric acid, by yeasts, and these keto-acids are crucial amino acceptors for LAB in the transamination of some amino acids including BCAA and methionine [36].
Among the volatile compounds, hexanal is a very potent contributor to a green flavour. It could be a product from unsaturated lipid oxidation chemically and/or by lipid oxidase (LOX) [37], given that more than 95% of the lipids present in the wheat gluten are unsaturated fatty acids. Heptanol is one of the end products of lipid oxidation as well. The higher peak area of lipid oxidation end products in co-culture trials as compared to the mathematical summation of the peak area in single-inoculated samples may indicate microbial interactions between the strains that either favoured the synthesis or slowed down the breakdown of the end product. Damiani et al. [38] also demonstrated that oxidative yeast could accelerate the lipid oxidation process in sourdough.

5. Conclusions

In this study, wheat glutens co-fermented by L. sakei LTH673 and P. kluyveri FrootZen, as well as by L. sakei LTH673 and S. boulardii NCYC3264, under salt-free conditions were compared against each other, and with the single-culture which had been previously studied. The cell count results showed that the yeasts were able to grow during SSF, while they declined during LSF when co-cultured with L. sakei. The LAB count was not affected by the presence of yeast. Glucose was depleted and converted to acetic acid and lactic acid during LSF. BCAAs and methionine concentrations were lower in co-culture trials than single-culture trials, corresponding to higher production of transamination products such as 2-methyl butanol, 3-methyl butanol, 2-methyl butanal, 3-methyl butanal, methionol and methional. Synergistic effects were exhibited in trials co-fermented by yeast and LAB, in terms of the production of some flavour-impacting aroma compounds, such as isoamyl acetate. The PCA results also demonstrate that the inoculation of yeasts could change the overall volatile profile of the fermented wheat gluten. This proves the feasibility of co-inoculating non-halophilic yeasts with LAB into a salt-free fermentation process to enhance the production of fruity aroma compounds. The possibility of inoculating a wider range of non-halophilic yeasts and LAB could also be explored in the future for higher fruity aroma profiles or other flavour directions.

Author Contributions

S.C.: Conceptualization, Data curation, Investigation, Methodology, Formal analysis, Writing—original draft. F.Z.: Investigation, Formal analysis. J.A.M.: Conceptualization, Writing—Review and editing, Supervision, Fund acquisition. Y.K.L.: Conceptualization, Supervision, Fund acquisition. E.A.: Conceptualization, Writing—review and editing, Supervision. Y.L.: Conceptualization, Writing—review and editing, Supervision. S.-Q.L.: Conceptualization, Writing—Review and editing, Supervision, Fund acquisition. All authors have read and agreed to the published version of the manuscript.

Funding

This study was supported by EDB-IPP grants from the Economic Development Board Singapore.

Data Availability Statement

Data are contained within the article.

Acknowledgments

The authors would like to thank Ayrine Chiu for her technical support, and Cindy Lee for her help in sensory evaluation during screening.

Conflicts of Interest

The authors confirm that they have no conflicts of interest with respect to the work described in this manuscript.

References

  1. Nuraida, L. A review: Health promoting lactic acid bacteria in traditional Indonesian fermented foods. Food Sci. Hum. Wellness 2015, 4, 47–55. [Google Scholar] [CrossRef]
  2. De Castilhos, M.B.M.; Del Bianchi, V.L.; Gómez-Alonso, S.; García-Romero, E.; Hermosín-Gutiérrez, I. Sensory descriptive and comprehensive GC-MS as suitable tools to characterize the effects of alternative winemaking procedures on wine aroma. Part I: BRS Carmem and BRS Violeta. Food Chem. 2019, 272, 462–470. [Google Scholar] [CrossRef]
  3. Ferreira, I.M.; Guido, L.F. Impact of wort amino acids on beer flavour: A review. Fermentation 2018, 4, 23. [Google Scholar] [CrossRef]
  4. Holt, S.; Miks, M.H.; De Carvalho, B.T.; Foulquié-Moreno, M.R.; Thevelein, J.M. The molecular biology of fruity and floral aromas in beer and other alcoholic beverages. FEMS Microbiol. Rev. 2019, 43, 193–222. [Google Scholar] [CrossRef]
  5. Gao, X.; Zhao, X.; Hu, F.; Fu, J.; Zhang, Z.; Liu, Z.; Wang, B.; He, R.; Ma, H.; Ho, C.T. The latest advances on soy sauce research in the past decade: Emphasis on the advances in China. Food Res. Int. 2023, 173, 113407. [Google Scholar] [CrossRef]
  6. Gao, X.; Liu, E.; Zhang, J.; Yang, L.; Huang, Q.; Chen, S.; Ma, H.; Ho, C.T.; Liao, L. Accelerating aroma formation of raw soy sauce using low intensity sonication. Food Chem. 2020, 329, 127118. [Google Scholar] [CrossRef]
  7. Hazelwood, L.A.; Daran, J.M.; Van Maris, A.J.A.; Pronk, J.T.; Dickinson, J.R. The Ehrlich pathway for fusel alcohol production: A century of research on Saccharomyces cerevisiae metabolism. Appl. Environ. Microbiol. 2008, 74, 2259–2266. [Google Scholar] [CrossRef]
  8. Vanderhaegen, B.; Neven, H.; Coghe, S.; Verstrepen, K.J.; Verachtert, H.; Derdelinckx, G. Evolution of chemical and sensory properties during aging of top-fermented beer. J. Agric. Food Chem. 2003, 51, 6782–6790. [Google Scholar] [CrossRef]
  9. Nakagawa, Y.; Sakumoto, N.; Kaneko, Y.; Harashima, S. Mga2p is a putative sensor for low temperature and oxygen to induce OLE1 transcription in Saccharomyces cerevisiae. Biochem. Biophys. Res. Commun. 2002, 291, 707–713. [Google Scholar] [CrossRef] [PubMed]
  10. Fujiwara, D.; Yoshimoto, H.; Sone, H.; Harashima, S.; Tamai, Y. Transcriptional co-regulation of Saccharomyces cerevisiae alcohol acetyltransferase gene, ATF1 and Δ-9 fatty acid desaturase gene, OLE1 by unsaturated fatty acids. Yeast 1998, 14, 711–721. [Google Scholar] [CrossRef]
  11. Anfang, N.; Brajkovich, M.; Goddard, M.R. Co-fermentation with Pichia kluyveri increases varietal thiol concentrations in Sauvignon Blanc. Aust. J. Grape Wine Res. 2008, 15, 1–8. [Google Scholar] [CrossRef]
  12. De Vuyst, L.; Neysens, P. The sourdough microflora: Biodiversity and metabolic interactions. Trends Food Sci. Technol. 2005, 16, 43–56. [Google Scholar] [CrossRef]
  13. Huang, Z.; Huang, L.; Xing, G.; Xu, X.; Tu, C.; Dong, M. Effect of co-fermentation with lactic acid bacteria and K. marxianus on physicochemical and sensory properties of goat milk. Foods 2020, 9, 299. [Google Scholar] [CrossRef] [PubMed]
  14. Wang, C.; Sun, J.; Lassabliere, B.; Yu, B.; Liu, S.Q. Coffee flavour modification through controlled fermentation of green coffee beans by Saccharomyces cerevisiae and Pichia kluyveri: Part II. Mixed cultures with or without lactic acid bacteria. Food Res. Int. 2020, 136, 109452. [Google Scholar] [CrossRef] [PubMed]
  15. Devanthi, P.V.P.; Linforth, R.; Onyeaka, H.; Gkatzionis, K. Effects of co-inoculation and sequential inoculation of Tetragenococcus halophilus and Zygosaccharomyces rouxii on soy sauce fermentation. Food Chem. 2018, 240, 1–8. [Google Scholar] [CrossRef] [PubMed]
  16. Singracha, P.; Niamsiri, N.; Visessanguan, W.; Lertsiri, S.; Assavanig, A. Application of lactic acid bacteria and yeasts as starter cultures for reduced-salt soy sauce (moromi) fermentation. LWT-Food Sci. Technol. 2017, 78, 181–188. [Google Scholar] [CrossRef]
  17. Cui, R.Y.; Zheng, J.; Wu, C.D.; Zhou, R.Q. Effect of different halophilic microbial fermentation patterns on the volatile compound profiles and sensory properties of soy sauce moromi. Eur. Food Res. Technol. 2014, 239, 321–331. [Google Scholar] [CrossRef]
  18. Wah, T.T.; Walaisri, S.; Assavanig, A.; Niamsiri, N.; Lertsiri, S. Co-culturing of Pichia guilliermondii enhanced volatile flavor compound formation by Zygosaccharomyces rouxii in the model system of Thai soy sauce fermentation. Int. J. Food Microbiol. 2013, 160, 282–289. [Google Scholar] [CrossRef]
  19. Chen, S.; Zhang, F.; Ananta, E.; Muller, J.A.; Liang, Y.; Lee, Y.K.; Liu, S.-Q. Inoculation of Latilactobacillus sakei with Pichia kluyveri or Saccharomyces boulardii improves flavor compound profiles of salt-free fermented wheat-gluten: Effects from single strain inoculation. Curr. Res. Nutr. Food Sci. 2023, 6, 100492. [Google Scholar] [CrossRef]
  20. Baensch, J.; Gaier, W.; Lim, B.G.; Lai, H.L.; Khoo, H.G.N. Hydrolyzate Seasoning Preparation in the Presence of Lactic Acid Bacteria. United States Patent US 5,965,178 A, 12 October 1999. Available online: https://patft.uspto.gov/netacgi/nph-Parser?Sect1=PTO1&Sect2=HITOFF&d=PALL&p=1&u=%2Fnetahtml%2FPTO%2Fsrchnum.htm&r=1&f=G&l=50&s1=5965178.PN.&OS=PN/5965178&RS=PN/5965178 (accessed on 25 July 2022).
  21. Lim, B.G.; Ng, T.L.; Heyland, S.; Dac, T.H. Production of a Hydrolysate. United States Patent US 6,383,532 B1, 7 May 2002. Available online: https://patents.justia.com/patent/6383532 (accessed on 19 January 2024).
  22. Lu, Y.; Chan, L.J.; Li, X.; Liu, S.Q. Effects of different inoculation strategies of Saccharomyces cerevisiae and Williopsis saturnus on chemical components of mango wine. LWT-Food Sci. Technol. 2018, 87, 85–92. [Google Scholar] [CrossRef]
  23. Sieuwerts, S.; Bron, P.A.; Smid, E.J. Mutually stimulating interactions between lactic acid bacteria and Saccharomyces cerevisiae in sourdough fermentation. LWT-Food Sci. Technol. 2018, 90, 201–206. [Google Scholar] [CrossRef]
  24. Sieuwerts, S.; De Bok, F.A.M.; Hugenholtz, J.; Van Hylckama Vlieg, J.E.T. Unraveling microbial interactions in food fermentations: From classical to genomics approaches. Appl. Environ. Microbiol. 2008, 74, 4997–5007. [Google Scholar] [CrossRef] [PubMed]
  25. Lee, K.E.; Lee, S.M.; Choi, Y.H.; Hurh, B.S.; Kim, Y.S. Comparative volatile profiles in soy sauce according to inoculated microorganisms. Biosci. Biotechnol. Biochem. 2013, 77, 2192–2200. [Google Scholar] [CrossRef] [PubMed]
  26. Noda, F.; Hayashi, K.; Mizunuma, T. Antagonism between osmophilic lactic acid bacteria and yeasts in brine fermentation of soy sauce. Appl. Environ. Microbiol. 1980, 40, 452–457. [Google Scholar] [CrossRef] [PubMed]
  27. Giannattasio, S.; Guaragnella, N.; Corte-Real, M.; Passarella, S.; Marra, E. Acid stress adaptation protects Saccharomyces cerevisiae from acetic acid-induced programmed cell death. Gene 2005, 354, 93–98. [Google Scholar] [CrossRef] [PubMed]
  28. Ludovico, P.; Sousa, M.J.; Silva, M.T.; Leão, C.; Côrte-Real, M. Saccharomyces cerevisiae commits to a programmed cell death process in response to acetic acid. Microbiology 2001, 147, 2409–2415. [Google Scholar] [CrossRef] [PubMed]
  29. Ludovico, P.; Sansonetty, F.; Silva, M.T.; Côrte-Real, M. Acetic acid induces a programmed cell death process in the food spoilage yeast Zygosaccharomyces bailii. FEMS Yeast Res. 2003, 3, 91–96. [Google Scholar] [CrossRef]
  30. Derrick, S.; Large, P.J. Activities of the enzymes of the Ehrlich pathway and formation of branched-chain alcohols in Saccharomyces cerevisiae and Candida utilis grown in continuous culture on valine or ammonium as sole nitrogen source. J. Gen. Microbiol. 1993, 139, 2783–2792. [Google Scholar] [CrossRef]
  31. Dickinson, J.R.; Norte, V. A study of branched-chain amino acid aminotransferase and isolation of mutations affecting the catabolism of branched-chain amino acids in Saccharomyces cerevisiae. FEBS Lett. 1993, 326, 29–32. [Google Scholar] [CrossRef]
  32. Swiegers, J.H.; Bartowsky, E.J.; Henschke, P.A.; Pretorius, I.S. Yeast and bacterial modulation of wine aroma and flavour. Aust. J. Grape Wine Res. 2005, 11, 139–173. [Google Scholar] [CrossRef]
  33. Bánsági, T.; Taylor, A.F. Ester hydrolysis: Conditions for acid autocatalysis and a kinetic switch. Tetrahedron 2017, 73, 5018–5022. [Google Scholar] [CrossRef]
  34. Amárita, F.; Fernández-Esplá, D.; Requena, T.; Pelaez, C. Conversion of methionine to methional by Lactococcus lactis. FEMS Microbiol. Lett. 2001, 204, 189–195. [Google Scholar] [CrossRef] [PubMed]
  35. Perpète, P.; Duthoit, O.; De Maeyer, S.; Imray, L.; Lawton, A.I.; Stavropoulos, K.E.; Gitonga, V.W.; Hewlins, M.J.E.; Richard Dickinson, J. Methionine catabolism in Saccharomyces cerevisiae. FEMS Yeast Res. 2006, 6, 48–56. [Google Scholar] [CrossRef] [PubMed]
  36. Yivon, M.; Rijnen, L. Cheese flavour formation by amino acid catabolism. Int. Dairy J. 2001, 11, 195–201. [Google Scholar] [CrossRef]
  37. Gänzle, M.G.; Schwab, C. Exploitation of the metabolic potential of lactic acid bacteria for improved quality of gluten-free bread. In The Science of Gluten-Free Foods and Beverages; Arendt, E.K., Bello, F.B., Eds.; AACC International, Inc.: Cork, Ireland, 2009; pp. 99–111. [Google Scholar] [CrossRef]
  38. Damiani, P.; Gobbetti, M.; Cossignani, L.; Corsetti, A.; Simonetti, M.S.; Rossi, J. The sourdough microflora. Characterization of hetero- and homofermentative lactic acid bacteria, yeasts and their interactions on the basis of the volatile compounds produced. LWT-Food Sci. Technol. 1996, 29, 63–70. [Google Scholar] [CrossRef]
Figure 1. Initial and final lactic acid bacterial counts in samples of FZCO (P. kluyveri FrootZen and L. sakei LTH673) and 3264CO (S. boulardii NCYC3264 and L. sakei LTH673) (a), initial and final yeast counts in samples of FZCO (co-culture of P. kluyveri FrootZen and L. sakei LTH673) and 3264CO (co-culture of S. boulardii NCYC3264 and L. sakei LTH673) (b) during solid-state fermentation of wheat gluten. Values in the same graph with different capital letters represent significant differences (p < 0.05). Results are expressed as the mean ± SD, n = 3.
Fermentation 10 00075 g001
Figure 2. Changes in A. oryzae count (a), yeast count (b), LAB count (c) and pH (d) over the 4-day liquid-state fermentation of wheat gluten slurries. Symbols: Fermentation 10 00075 i001 changes in cell count of co-culture of L. sakei LTH673 and P. kluyveri FrootZen; Fermentation 10 00075 i002 changes in cell count of co-culture of L. sakei LTH673 and S. boulardii NCYC3264.
Fermentation 10 00075 g002aFermentation 10 00075 g002b
Figure 3. Changes in concentration of Fermentation 10 00075 i003 glucose, Fermentation 10 00075 i004 lactic acid, Fermentation 10 00075 i005 acetic acid, Fermentation 10 00075 i006 quinic acid, Fermentation 10 00075 i007 oxalic acid and Fermentation 10 00075 i008 formic acid concentration in samples of FZCO (co-culture of L. sakei LTH673 and P. kluveri FrootZen) (a), 3264CO (co-culture of L. sakei LTH673 and S. boulardii NCYC3264) (b) during liquid-state fermentation of wheat gluten slurries.
Fermentation 10 00075 g003aFermentation 10 00075 g003b
Figure 4. Heat map showing the peak area of volatile compounds on days 0, 1, 2, 3 and 4 during LSF in FZCO sample (co-cultured with L. sakei LTH673 and P. kluyveri FrootZen), and the mathematical summation of the peak areas of same volatile compounds in LSK monoculture (L. sakei) [19] and FZ monoculture (P. kluyveri FrootZen) [19] for easy comparison (a). Heat map showing the peak area of volatile compounds on days 0, 1, 2, 3 and 4 during LSF in 3264CO samples (co-cultured with L. sakei LTH673 and S. boulardii NCYC3264), and the mathematical summation of the peak areas of the same volatile compounds in LSK monoculture (L. sakei) [19] and FZ monoculture (S. boulardii NCYC3264) [19] for easy comparison (b). Red colour represents the highest peak area in each row for a single compound, followed by orange, yellow and green from the highest to the lowest intensity. The colours of the compound names indicate the groups which the volatile compounds belong to.
Fermentation 10 00075 g004aFermentation 10 00075 g004b
Figure 5. PCA score plot of volatile compounds identified in LSK control (gluten fermented with L. sakei only) [19], FZCO (gluten co-fermented with L. sakei and P. kluyveri) and 3264CO (gluten co-fermented with L. sakei and S. boulardii). Codes: (1) 2,3-Butanedione; (2) 3-Methyl butanal; (3) 2-Methyl butanal; (4) Pentanal; (5) 2-Methyl 2-butenal; (6) Hexanal; (7) Heptanal; (8) 2-Heptanone; (9) Methional; (10) Benzaldehyde; (11) Octanone; (12) Benzeneacetaldehyde; (13) 2-Octenal; (14) 4-Nontanone; (15) 2-Nonanone; (16) Nonanal; (17) 2-Phenyl-2-butenal; (18) 2-Nonenal; (19) Ethanol; (20) 2-Methyl propanol; (21) Propanol; (22) 3-Methyl butanol; (23) 2,3-Butanediol; (24) Hexanol; (25) Heptanol; (26) 1-Octen-3-ol; (27) 2-Phenethyl alcohol; (28) Methionol; (29) Ethyl acetate; (30) Propyl acetate; (31) Isobutyl acetate; (32) Ethyl isovalerate; (33) Isoamyl acetate; (34) 2-Methyl butyl acetate; (35) 3-Methylthiopropyl acetate; (36) Hexyl acetate; (37) Ethyl heptanoate; (38) Ethyl benzoate; (39) Ethyl octanoate; (40) Ethyl nonanoate; (41) 2-Phenylethyl acetate; (42) Ethyl palmitate; (43) Ethyl linoleate; (44) Acetic acid; (45) 2-Pentyl furan; (46) 2,6-Dimethyl pyrazine; (47) Dihydro-5-pentyl-2(3H)-furanone; (48) 2-Methoxy-4-vinylphenol. The arrows indicate the influence of each volatile compound to the overall difference among the groups.
Fermentation 10 00075 g005
Table 1. Concentrations of free amino acids in co-cultured wheat gluten slurries during LSF.
Name of Free Amino AcidDay 0Day 1Day 2Day 3Day 4
Concentration * (mM) (mean ± S.D) in FZCO
Alanine7.13 ± 1.4234.55 ± 9.7831.57 ± 2.7131.65 ± 0.7533.41 ± 0.86
Arginine2.25 ± 0.310.10 ± 0.030.12 ± 0.010.13 ± 0.020.12 ± 0.00
Aspartic acid4.91 ± 0.427.18 ± 1.567.44 ± 1.547.95 ± 0.879.41 ± 0.54
Cysteine0.99 ± 0.110.22 ± 0.130.38 ± 0.020.44 ± 0.120.59 ± 0.13
Glutamic acid37.91 ± 6.00119.13 ± 2.24152.12 ± 6.17165.07 ± 13.08178.75 ± 10.98
Glutamine3.20 ± 0.5715.51 ± 3.508.18 ± 1.105.25 ± 1.333.61 ± 2.42
Glycine6.36 ± 0.6028.94 ± 8.1226.38 ± 1.4026.44 ± 1.0427.88 ± 0.80
Histidine1.81 ± 0.328.34 ± 1.777.20 ± 0.406.85 ± 0.157.14 ± 0.55
Isoleucine7.49 ± 1.1228.23 ± 7.6525.94 ± 2.8725.88 ± 1.5928.36 ± 1.50
Lysine3.94 ± 0.567.08 ± 1.796.40 ± 0.486.38 ± 0.206.99 ± 0.33
Leucine11.56 ± 3.7041.79 ± 10.0937.91 ± 4.6737.78 ± 2.4540.78 ± 2.34
Methionine2.14 ± 0.396.56 ± 1.526.08 ± 0.365.86 ± 0.206.36 ± 0.34
Ornithine0.26 ± 0.0715.45 ± 3.8711.77 ± 1.5110.88 ± 0.3011.41 ± 1.37
Phenylalanine6.52 ± 2.4727.84 ± 7.1123.71 ± 1.5322.78 ± 1.5824.43 ± 0.79
Proline21.38 ± 5.5660.66 ± 5.8457.46 ± 4.6553.64 ± 6.9556.03 ± 5.05
Serine8.80 ± 3.146.32 ± 0.835.04 ± 0.875.25 ± 2.237.12 ± 2.63
Threonine4.31 ± 0.4118.14 ± 3.4421.05 ± 8.4622.05 ± 3.9522.99 ± 0.64
Tryptophan0.85 ± 0.161.96 ± 1.433.10 ± 0.373.14 ± 0.283.23 ± 0.10
Tyrosine5.59 ± 1.4216.54 ± 4.3412.30 ± 1.2810.98 ± 0.6211.12 ± 0.48
Valine13.76 ± 3.7228.29 ± 6.7926.26 ± 2.0526.24 ± 1.3928.48 ± 1.01
Concentration (mM) (mean ± S.D) in FZCO
Alanine4.89 ± 0.6625.00 ± 1.8028.57 ± 1.5233.69 ± 3.0136.53 ± 6.52
Arginine2.20 ± 0.541.83 ± 0.382.15 ± 0.451.64 ± 0.081.62 ± 0.87
Aspartic acid4.06 ± 0.303.48 ± 0.154.87 ± 0.905.51 ± 1.266.47 ± 1.50
Cysteine0.47 ± 0.100.09 ± 0.010.20 ± 0.030.42 ± 0.040.55 ± 0.11
Glutamic acid26.50 ± 1.61117.64 ± 6.85124.16 ± 10.08143.32 ± 9.82149.87 ± 9.27
Glutamine2.42 ± 0.3913.29 ± 0.3112.13 ± 0.1411.63 ± 0.6211.89 ± 2.07
Glycine5.39 ± 1.0117.99 ± 0.4120.62 ± 0.7624.81 ± 2.2729.19 ± 5.77
Histidine1.07 ± 0.095.85 ± 0.176.31 ± 0.467.20 ± 0.597.62 ± 1.23
Isoleucine4.23 ± 0.6114.04 ± 0.9516.87 ± 1.2119.91 ± 1.9521.12 ± 3.72
Lysine3.37 ± 0.164.75 ± 0.085.40 ± 0.316.38 ± 0.687.32 ± 1.29
Leucine5.76 ± 0.8219.88 ± 1.4323.57 ± 1.6427.78 ± 2.4530.17 ± 6.05
Methionine1.36 ± 0.374.28 ± 0.304.98 ± 0.305.59 ± 0.495.98 ± 0.98
Ornithine0.35 ± 0.448.18 ± 1.229.92 ± 0.6811.05 ± 0.9811.29 ± 1.72
Phenylalanine3.39 ± 0.2718.73 ± 0.5920.23 ± 0.6422.38 ± 1.6323.57 ± 3.17
Proline7.83 ± 1.3963.85 ± 5.3359.96 ± 4.4462.57 ± 7.6766.24 ± 4.46
Serine4.08 ± 0.30N.DN.D1.24 ± 1.062.47 ± 1.19
Threonine4.24 ± 0.4914.40 ± 0.2114.39 ± 0.1414.66 ± 0.2114.61 ± 0.26
Tryptophan0.48 ± 0.042.70 ± 0.533.32 ± 0.203.42 ± 0.343.59 ± 0.47
Tyrosine3.40 ± 0.1612.27 ± 0.6310.97 ± 0.8911.17 ± 0.6812.20 ± 1.59
Valine7.83 ± 0.9716.60 ± 1.1718.95 ± 1.3022.35 ± 2.2023.42 ± 3.49
* Concentration of amino acids are displayed as mean ± standard deviation for three independent experiments. FZCO: changes in amino acid concentration in co-culture of L. sakei LTH673 and P. kluyveri FrootZen; 3264CO: changes in amino acid concentration in co-culture of L. sakei LTH673 and S. boulardii NCYC3264. N.D: not detected.
Disclaimer/Publisher’s Note: The statements, opinions and data contained in all publications are solely those of the individual author(s) and contributor(s) and not of MDPI and/or the editor(s). MDPI and/or the editor(s) disclaim responsibility for any injury to people or property resulting from any ideas, methods, instructions or products referred to in the content.

