Article

Effect of High Altitude on Serum Biochemical Parameters, Immunoglobulins, and Rumen Metabolism of Sanhe Heifers

State Key Laboratory of Animal Nutrition, College of Animal Science and Technology, China Agricultural University, Beijing 100193, China
*
Authors to whom correspondence should be addressed.
Fermentation 2024, 10(3), 170; https://doi.org/10.3390/fermentation10030170
Submission received: 9 January 2024 / Revised: 12 February 2024 / Accepted: 15 February 2024 / Published: 18 March 2024
(This article belongs to the Section Microbial Metabolism, Physiology & Genetics)

Abstract

:
Rumen metabolism is closely related to feed utilization and the environmental adaptability of cows. However, information on the influence of altitude on ruminal metabolism is limited. Our study aimed to investigate differences in rumen metabolism and blood biochemical indicators among Sanhe heifers residing at various altitudes. A total of 20 serum and ruminal fluid samples were collected from Sanhe heifers in China, including those from Hulunbeier City (approximately 700 m altitude; 119°57′ E, 47°17′ N; named LA) and Lhasa City (approximately 3650 m altitude; 91°06′ E, 29°36′ N; named HA). Compared with LA heifers, HA heifers had higher levels of serum cortisol, glucose, and blood urea nitrogen (p < 0.05) and lower Ca2+ concentrations (p < 0.05). Using liquid chromatography–mass spectrometry (LC–MS)-based untargeted metabolomic technology, we identified a significant difference in 312 metabolites between the LA and HA groups. Metabolic pathway analysis, based on significantly different rumen metabolites, identified 20 enriched metabolic pathways within hierarchy III, which are encompassed within 6 broader metabolic pathways in hierarchy I. This study constitutes the first elucidation of the altitudinal adaptation mechanism of ruminants from the perspective of rumen metabolism, thereby offering a novel angle for investigating high-altitude adaptation in both humans and animals.

1. Introduction

The Qinghai–Tibetan Plateau occupies one-fourth of the land area of China and is referred to as the “third pole of the earth” and “top of the world” [1,2]. As animal husbandry is the main source of income for Tibetan people, its development will help local people to increase their income sources. However, this region is marked by intense ultraviolet radiation, a low partial pressure of atmospheric oxygen, and cold temperatures all year round [1,3], which bring great challenges to animal survival and breeding [4,5].
Ascending to high elevations alters metabolic and physiological processes in the body [6], inducing hypoxia that causes the body to maintain its oxygen homeostasis [7]. When people enter a high-altitude hypoxic environment, their aerobic metabolism decreases, whereas the levels of anaerobic glycolysis increase [8]. Concomitantly, metabolic disorders, reduced organ function, and microecological imbalance occur. Of note, the physical and chemical characteristics of blood can reflect the adaptability of the body to a high-altitude hypoxic environment. Similar findings have been reported for other animals in high-altitude areas. A recent study reported metabolic changes in the blood of Jersey cows at different altitudes [9].
As an important organ, the rumen of adult ruminants digests roughage through the proliferation and activity of its microbiota. Though the process of coevolution, the structure of the rumen microbiota community has formed a mutually beneficial symbiotic relationship with the host [10]. This mutually beneficial symbiotic relationship shows that gastrointestinal microorganisms play an important role in intestinal stability, nutrient digestion, immunity, behavior, and the health of the host [11,12,13]. The metabolism and digestion of microbiota ruminants plays an important role. The rumen and intestinal epithelium of dairy cows absorb 75% of the energy in the form of microbial metabolite volatile fatty acids (VFAs) [14]. The rumen metabolites VFAs such as acetic acid, propionic acid, and butyric acid are used for energy sources for the host. Acetic acid is used for ATP and lipid synthesis, propionic acid is used for liver gluconeogenesis, and butyric acid is immediately converted into ketone bodies by enzymes, providing energy for the body [15]. Morgavi et al. found that the rumen microbiota significantly affects the metabolic level of ruminants [16]. Changes in rumen metabolism have been associated with various host disorders, such as obesity [17,18,19] and brisket disease [20]. Therefore, the study of rumen metabolism is of great significance for exploring the adaptability of ruminants to high-altitude areas.
In a previous study, we showed that different altitudes affect the rumen bacterial diversity of Sanhe heifers [21]. Changes in rumen microbiota structure may further affect differences in rumen metabolism. This study aimed to investigate the differences in rumen metabolism and blood biochemical indicators in Sanhe heifers at different altitudes.

2. Materials and Methods

2.1. Ethics Statement

The research protocol received approval from the Ethics Committee at the College of Animal Science and Technology, China Agricultural University, under project number AW22121202-1-2.

2.2. Study Regions, Animal, and Experimental Design

Low-altitude (LA) samples were taken from the birthplace of Sanhe cattle, specifically Hulunbuir in the Inner Mongolia Autonomous Region. This region, located at 119°57′ E and 47°17′ N, has an approximate altitude of 700 m. High-altitude (HA) samples were taken from Lhasa, located in the Tibet Autonomous Region. This region, located at 91°06′ E and 29°36′ N, has an altitude of approximately 3650 m. Lhasa experiences an average annual temperature and precipitation of 8.6 °C and 472.5 mm, respectively, whereas Hulunbuir has an average annual temperature and precipitation of 3.3 °C and 538.3 mm, respectively [22].
For our study, 100 Sanhe heifers were transported to the Zhizhao dairy farm in Tibet, and 100 were kept on the Xieertala farm in June 2020. After three months, the study was initiated on September 2020, when 10 healthy 14- to 15-month-old Sanhe heifers with mean body weights of 334.82 ± 13.22 kg were randomly chosen. The study spanned a 30-day duration, during which Sanhe heifers were housed in a consistent feedlot environment for an initial 2-week acclimatization period before commencing sample collection. These heifers were provided with access to a total mixed ration (TMR) twice daily, with feeding sessions taking place between 06:30 and 08:30 and 17:30 and 19:30. The formulation of the TMR aligned with the nutritional requirements of Sanhe heifers, as per the guidelines stipulated by the National Research Council [23]. The LA and HA groups of Sanhe heifers were fed TMR with the similar proportion of nutrients (based on dry matter), containing 15.70% and 15.78% crude protein (CP), 2.92% and 2.91% ether extract (EE), 38.98% and 38.85% neutral detergent fiber (NDF), and 22.36% and 22.79% acid detergent fiber (ADF), respectively. Additionally, the heifers were individually housed in well-ventilated, environmentally controlled tie-stall barns furnished with rubber mattress bedding to ensure optimal animal welfare and comfort.

2.3. Collection and Analysis of Blood Samples

At the end of the experiment, blood samples were collected from each Sanhe heifer via the tail vein. Samples were centrifuged at 3000× g for 10 min to obtain serum and stored at −20 °C until subsequent analysis. The levels of the following biochemical markers were measured using a GF-D200 automatic biochemical analyzer (Caihong, Shandong, China): immunoglobulin A (IgA), immunoglobulin G (IgG), immunoglobulin M (IgM), interleukin-2 (IL-2), interleukin-6 (IL-6), interleukin-10 (IL-10), tumor necrosis factor-α (TNF-α), total protein (TP), albumin (ALB), alanine aminotransferase (ALT), aspartate aminotransferase (AST), alkaline phosphatase (ALP), creatine kinase (CK), Ca, P, blood urea nitrogen (BUN), glucose (GLU), total cholesterol (TC), and nonesterified fatty acid (NEFA). Serum samples were used to measure the levels of glutathione (GSH), nitric oxide synthase (NOS), epinephrine, growth hormone-releasing hormone (GHRH), stimulating hormone (TSH), endothelium-derived relaxing factor (EDRF), and leptin (LEP) by ELISA using a colorimetric kit (Nanjing Jiancheng, Jiangsu, China).

2.4. Ruminal Liquid Collection

Before morning feeding on the last day of the experiment, the ruminal chyme of Sanhe heifers was collected through the mouth of Sanhe heifers using an oral gastric tube (Ancitech, Winnipeg, MB, Canada). Each time a sample was taken, the sampling instrument was rinsed with fresh water, and the initial 0.2 L of the rumen sample was discarded. To acquire rumen fluid, four layers of cheesecloth were used to filter the ruminal chyme that had been collected. The rumen fluid of each Sanhe heifer was immediately frozen at −80 °C for subsequent analysis of the metabolism of rumen microbiota.

2.5. Metabolite Extraction

Briefly, the samples were mixed with cold extraction solvent consisting of methanol/acetonitrile/H2O and sufficiently vortexed to extract the metabolites from the rumen fluids of Sanhe heifers. The samples were thoroughly vortexed to facilitate the extraction of metabolites from the rumen fluids of Sanhe heifers. Following this, the samples were vortexed again and then incubated for 20 min on ice. Subsequently, the samples were centrifuged at 14,000× g for 20 min at 4 °C. To collect and desiccate the supernatant, a vacuum centrifuge was employed at 4 °C. The resulting residues were then reconstituted in 100 μL of acetonitrile/water solvent and transferred into LC vials for subsequent LC–MS analysis.

2.6. LC–MS Analysis and Data Processing

For untargeted metabolomics analysis of polar metabolites, the extracts were analyzed using a Sciex TripleTOF 6600 quadrupole time-of-flight mass spectrometer connected to hydrophilic interaction chromatography through electrospray ionization (Shanghai Applied Protein Technology Co., Ltd., Shanghai, China). Liquid chromatography separation was carried out using a gradient of solvents A and B, where solvent A consisted of 25 mM ammonium acetate in water, and solvent B contained 25 mM ammonium hydroxide in acetonitrile. An ACQUITY UPLC BEH Amide column (2.1 × 100 mm, 1.7 μm particle size; Waters, Wilto, Ireland) was used. The gradient started at 85% B for the first minute, followed by a linear decrease to 65% over 11 min, 40% for 0.1 min, held for 4 min, and then increased to 85% over 0.1 min, with a 5 min re-equilibration period. The column temperature was maintained at 25 °C, the autosampler at 5 °C, and the flow rate was set at 0.4 mL/min. A 2 μL injection volume was used. Both positive and negative ionization modes were applied to the mass spectrometer. The electrospray ionization source was set with the following conditions: source temperature of 600 °C, IonSpray Voltage Floating of 5500 V, and Ion Source Gas 1, Ion Source Gas 2, and curtain gas at 60, 60, and 30, respectively. The time-of-flight mass spectrometer was configured to perform TOF MS scans with an accumulation time of 0.20 s/spectrum during MS acquisition, covering a mass-to-charge ratio (m/z) range of 60–1000 Da. Automatic MS/MS acquisition was set up with a m/z range of 25–1000 Da and an accumulation time of 0.05 s/spectrum for the product ion scan. The product ion scan was obtained using information-dependent acquisition in high-sensitivity mode, with parameters including a collision energy of 35 V with 15 eV and a declustering potential of 60 V for both positive (+) and negative (-) modes, except for isotopes within 4 Da. Additionally, 10 candidate ions were monitored in each cycle.

2.7. Statistical Analysis

Serum biochemistry index data were analyzed using the t-test in SPSS (version 22.0, IBM SPSS, Chicago, IL, USA). All data were shown as the mean, and p < 0.05 was considered significant.
The LC–MS data were initially converted to mzXML format using the ProteoWizard software (http://proteowizard.sourceforge.net/downloads.shtml, accessed on 8 January 2024). Subsequently, XCMS was employed for data preprocessing, peak alignment, retention time correction, and peak area calculation. The resulting dataset, comprising peak number, sample names, and peak areas, was imported into the SIMCA software (version 14.1, Umetrics AB, Sweden) for multivariate statistical analysis, including principal component analysis (PCA) [24] and orthogonal projections to latent structures discriminant analysis (OPLS–DA). Furthermore, the data were used to assess the covariance between the maximum measured data and response variables. Metabolites exhibiting a variable importance projection (VIP) value of >1.0 and a significance level of p < 0.05 were considered significantly different. To identify differential metabolites, the average peak area of each metabolite across all samples was compared, and the fold change (FC) value of the peak area for each metabolite was calculated. To assist in the identification of these differential metabolites, three databases were consulted: the Kyoto Encyclopedia of Genes and Genomes (KEGG, http://www.kegg.jp/, accessed on 8 January 2024), the Human Metabolome Database, and the Bovine Metabolome Database. The KEGG database was utilized to perform enrichment analysis of KEGG metabolic pathways based on the differential metabolites [25]. Only pathways with a significance level of p < 0.05 were considered to have undergone substantial changes. The statistical significance of enriched pathways was determined using Fisher’s exact test.

3. Results

3.1. Serum Immunoglobulins, Cytokines, and Biochemical Parameters

We did not identify any significant differences (p > 0.05) in the levels of serum immunoglobulins and cytokines between the two groups of heifers living at different altitudes (Table 1). In particular, we did not observe any significant differences (p > 0.05) in the levels of serum Lep, TC, and NEFA. Compared with LA heifers, HA heifers had higher levels of serum cortisol, glucose, and blood urea nitrogen (p < 0.05) but lower Ca2+ concentrations (p < 0.05, Table 2).

3.2. Rumen Metabolome of Sanhe Heifers from Different Altitudes

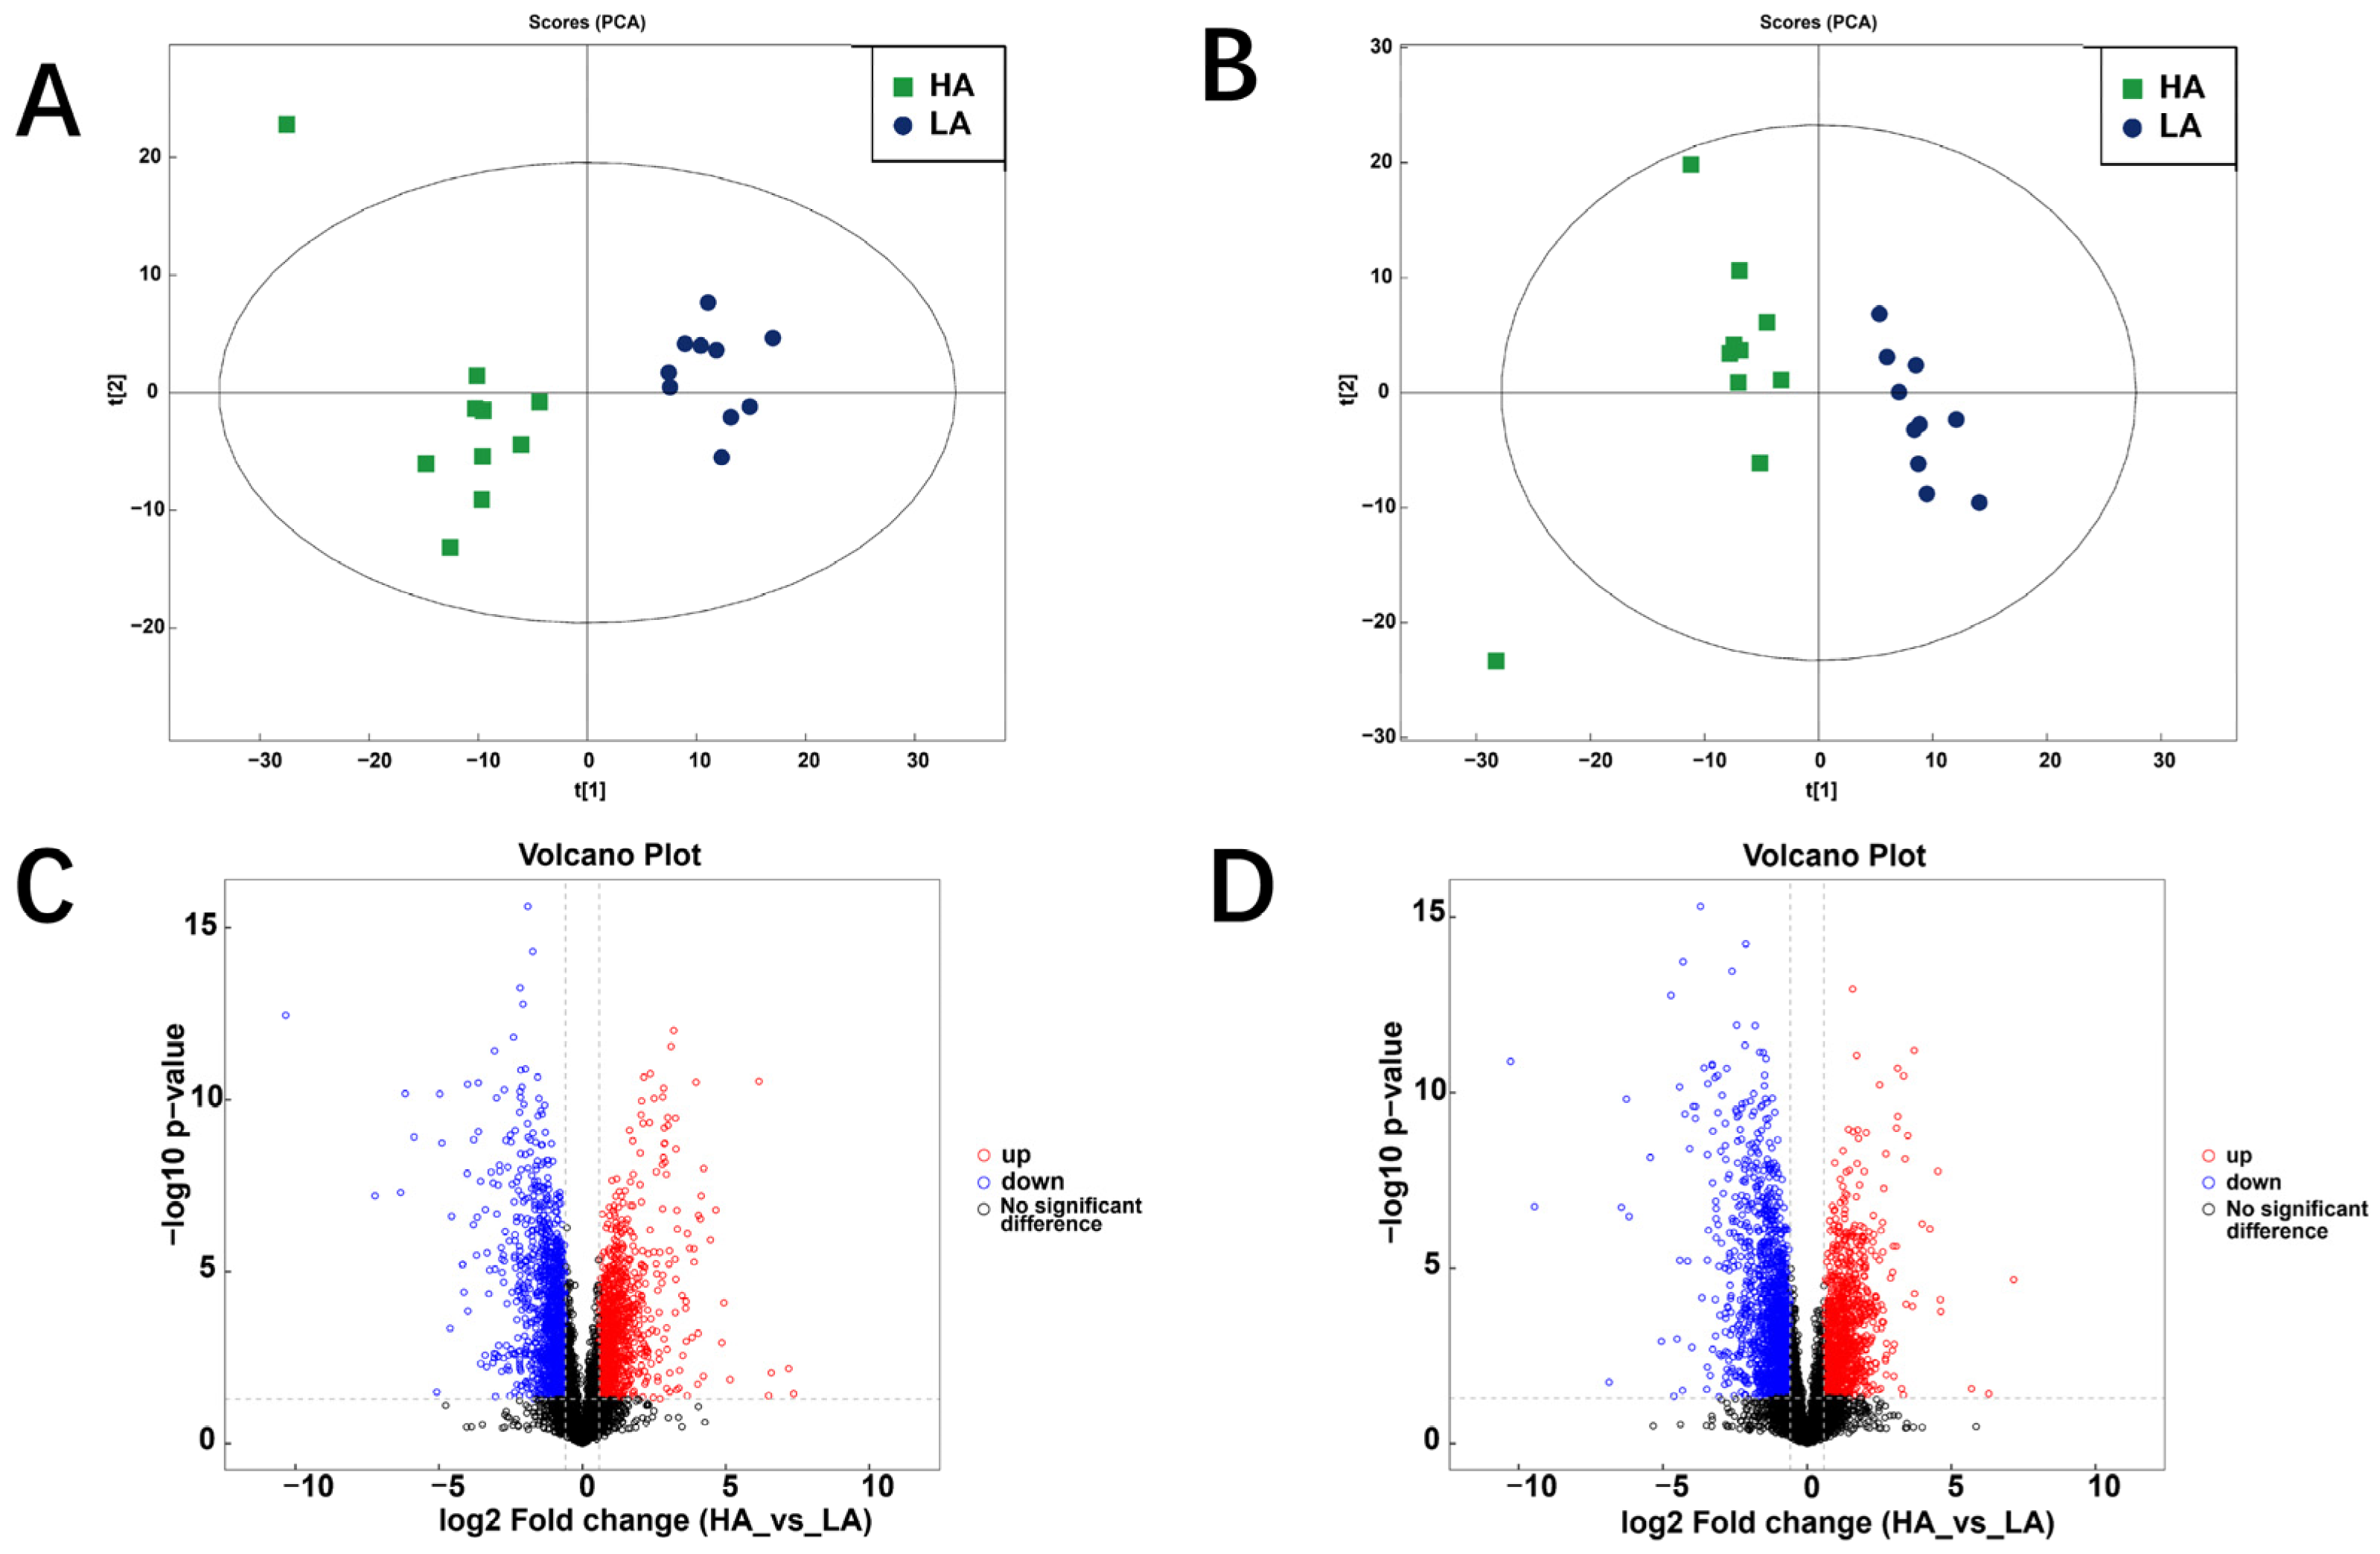
3.2.1. Differential Metabolites

We identified 1678 different metabolites in the rumen metabolome of heifers from different altitudes. Of these, 899 metabolites were detected in the positive ion mode and 779 metabolites were detected in the negative ion mode. To compare the metabolic compositions of the rumen fluid between the HA and LA groups, the differences in LC–MS positive and negative ion modes were evaluated by PCA (Figure 1A,B). The metabolites in the HA and LA groups were well distinguished in PCA score plots of the positive and negative ion modes. Volcano plots and OPLS–DA score plots of the positive and negative ion modes for the two groups are shown in Figure 2C,D and Supplementary Figure S1. OPLS–DA revealed a clear distinction between the two groups in both the positive [R2X(cum) = 0.387, R2Y(cum) = 0.985, Q2(cum) = 0.936] and negative [R2X(cum) = 0.574, R2Y(cum) = 0.994, Q2(cum) = 0.950] ion modes, which was further validated by permutation analysis (positive: Q2 intercept = −0.4015; negative: Q2 intercept = −0.4172). Based on the cut-off (VIP > 1 and p < 0.05) for differential metabolites, we identified 312 metabolites that differed significantly between the LA and HA groups; among which, 186 and 126 were detected in the positive and negative ion modes, respectively.

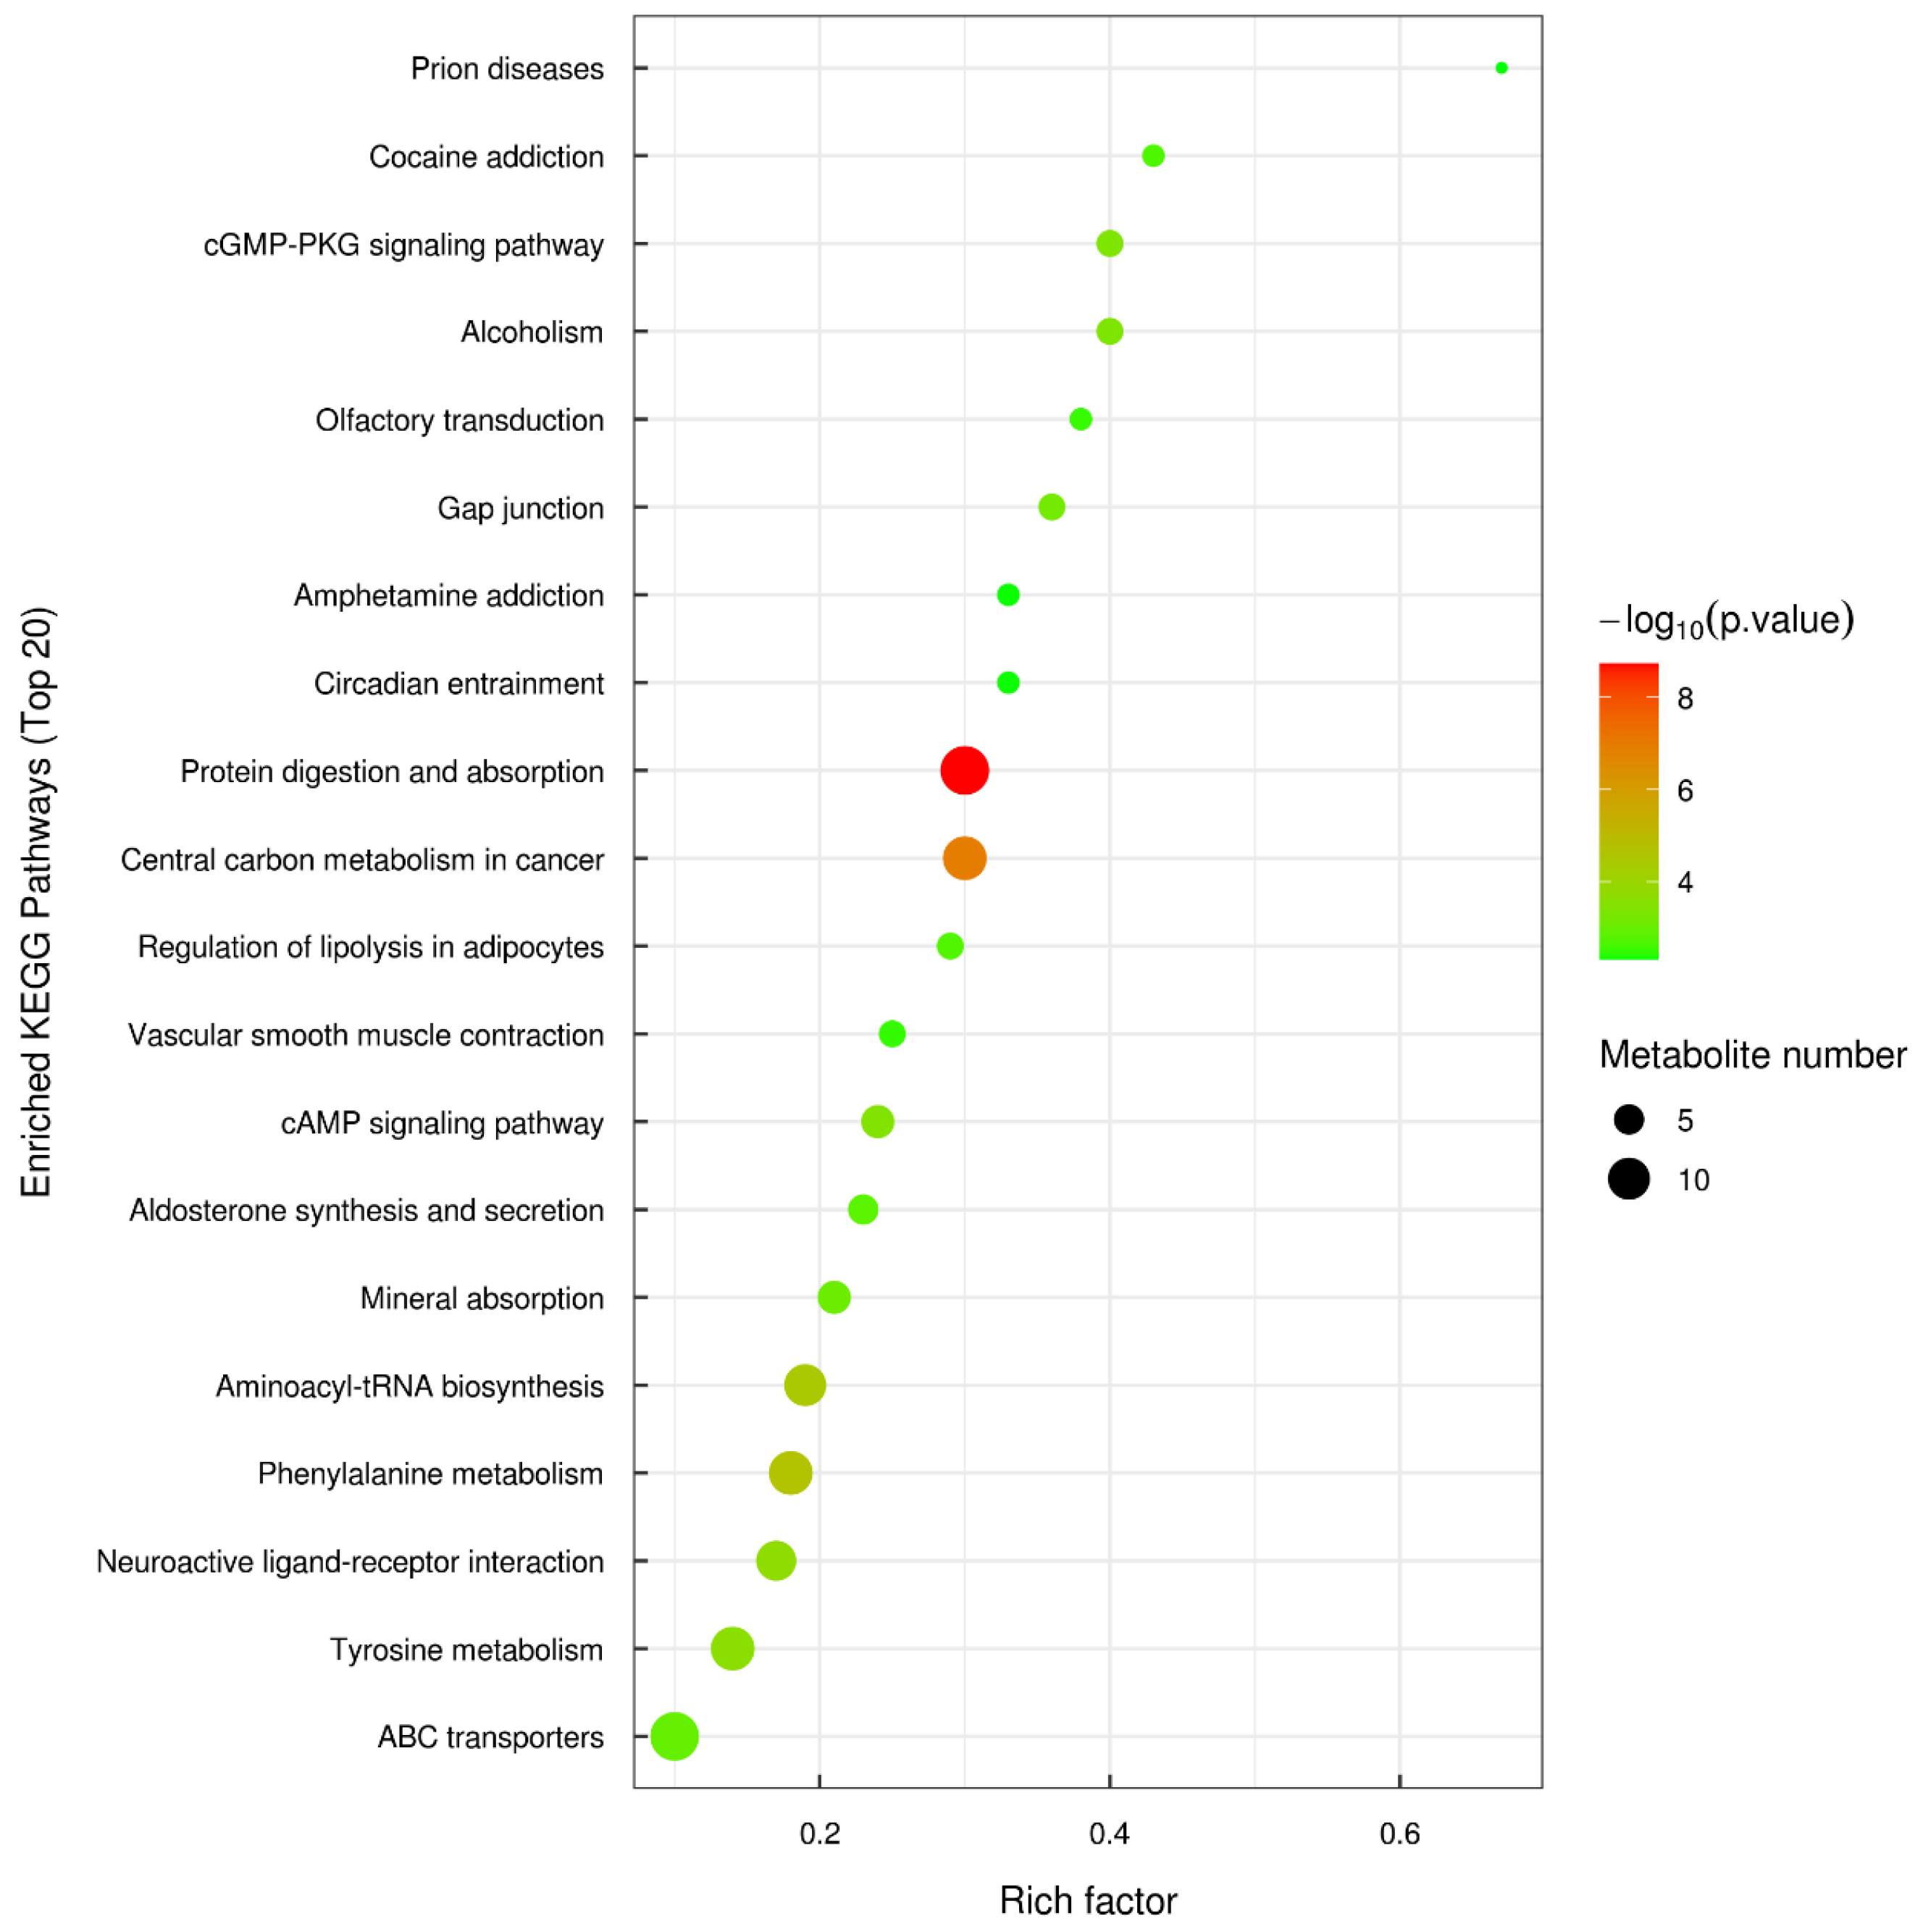
3.2.2. KEGG Pathways

The enriched KEGG pathways identified from the comparison between the LA and HA groups are shown in Figure 2. Metabolic pathway analysis based on significantly different rumen metabolites revealed the enrichment of 20 level III metabolic pathways (Figure 2), namely “protein digestion and absorption”, “central carbon metabolism in cancer”, “phenylalanine metabolism”, “aminoacyl-tRNA biosynthesis”, “neuroactive ligand-receptor interaction”, “tyrosine metabolism”, “cAMP signaling pathway”, “alcoholism”, “cGMP-PKG signaling pathway”, “gap junction”, “mineral absorption”, “ABC transporters”, “aldosterone synthesis and secretion”, “regulation of lipolysis in adipocytes”, “cocaine addiction”, “olfactory transduction”, “vascular smooth muscle contraction”, “circadian entrainment”, “amphetamine addiction”, and “prion diseases”. These belong to six level I metabolic pathways, namely organismal systems, human diseases, metabolism, genetic information processing, environmental information processing, and cellular processes. We found that all 20 metabolic pathways were upregulated.
The metabolites in the differentially enriched KEGG pathways determined by hydrophilic interaction LC–MS analysis are shown in Table 3. We detected a total of 38 upregulated differential metabolites and 26 downregulated differential metabolites.

4. Discussion

High altitude is a potent stressor that modifies the physiological and metabolic systems [26,27]. We previously showed that altitude affects the composition and function of rumen microbiota in Sanhe heifers [21]. In this study, we measured the levels of serum biochemical parameters and investigated the mechanisms of adaptation of rumen metabolome to high-altitude by identifying differences in the rumen microbial metabolites among heifers from different altitudes.
Cytokines play a central role in the immune response by promoting the activation of antigen-specific and nonspecific effector mechanisms and tissue repair. Cytokines are important immune response modulators that may be affected by exposure to high altitude [28]. For example, hypobaric hypoxia causes an inflammatory response through the release of cytokines [29]. Many studies have shown that living at high altitudes leads to an increased content of proinflammatory cytokines, such as interleukin-1beta (IL-1β), IL-6, and TNF-α in the body [30,31,32,33]. However, in this study, high altitude had no significant effect on the serum levels of IgA, IgG, IgM, or those of the four tested inflammatory cytokines, which is consistent with some previous studies [34,35]. This may be because the Sanhe heifers used in this study might have gradually acclimated to the hypoxic environment, having entered Tibet 3 months prior to the experiment.
The adrenal cortex capacity of animals at high altitudes is enhanced, secreting a large number of glucocorticoids, inhibiting excessive stress responses, enhancing resistance, and maintaining and restoring internal environment stability [36]. Cortisol is the main type of glucocorticoid and an important stress hormone that protects the body from stress damage [37]. The metabolic function of glucocorticoids helps to restore the energy balance of the body after a violent reaction. Research has found that when individuals enter high altitudes, their cortisol level is increased to adapt to the high-altitude environment [38], consistent with the results of this study. Under hypoxic stress, an increase in the level of serum cortisol can lead to an increase in the level of blood glucose, in agreement with the increase in the level of serum glucose of Sanhe heifers in the HA group. Ruminant protein digestion can be divided into two periods: (1) degradation and digestion in the rumen, part of which is used to synthesize microbial proteins, and (2) digestion in the abomasum and small intestine [39]. Ammonia absorbed from the rumen is converted to urea and secreted into the blood as BUN [40]. Therefore, the concentration of BUN in ruminants reflects the efficiency of protein utilization. In this study, the increase in BUN concentrations observed in the high-altitude group may have been due to the adaptation of Sanhe cattle to high-altitude hypoxic environments. Previous research has reported that increased serum BUN concentrations may lead to an increase in plasma osmotic pressure that results in tissue edema [41], which means that an increase in BUN concentration may also be one of the signals that high altitude affects the health of animals.
By integrating LC–MS-based untargeted metabolomic analyses, we investigated the mechanisms of adaptation of the rumen metabolome to high altitude. PCA and OPLS–DA score plots showed a significant difference in the metabolic components of rumen fluid between the HA and LA groups and demonstrated an obvious effect of altitude on the composition of rumen metabolites. In a previous study, we found that the digestibility of Sanhe heifers at different altitudes differed [16]. This study suggested that the difference in rumen metabolites is one of the possible reasons for the decline in digestibility in heifers from high altitudes.
Some of the enriched differential metabolic pathways belonged to the digestive system of organismal systems, including mineral and protein digestion and absorption, suggesting that different altitudes affect the digestive system of Sanhe heifers. In addition, the change in the BUN content may be related to the enrichment of this pathway. Among the enriched differential metabolic pathways, some belong to the environmental adaptation of organismal systems, further suggesting that the organisms of Sanhe cattle respond to changes in altitude. Other enriched differential metabolic pathways belong to amino acid metabolism, including tyrosine and phenylalanine metabolism. Recent metabolic studies have shown that various amino acids may be involved in regulating intracellular osmotic pressure during environmental hypoxia [9,42], which is consistent with our results, suggesting that Sanhe heifers adapt to high altitude by changing their amino acid metabolism. Some other enriched differential metabolic pathways belong to environmental information processing, including the “cAMP signaling pathway”, “cGMP-PKG signaling pathway”, “neuroactive ligand-receptor interaction”, and “ABC transporters”. The cAMP signaling pathway regulates critical physiological processes, including metabolism, secretion, calcium homeostasis, muscle contraction, cell fate, and gene transcription [43]. The cyclic nucleotide-gated ion channel regulates downstream pathways by activating calmodulin-and calcium/calmodulin-dependent protein kinases. In addition, the cAMP pathway, also known as the protein kinase A pathway, directly regulates the transmembrane transport of calcium, potassium, sodium, and chloride ions through the phosphorylation of channel proteins, transporters, and receptors on the cell membrane [44]. Interestingly, this may be the reason for the differences in the blood calcium content of Sanhe heifers at different altitudes. ABC transporters exert various physiological functions, such as the removal of foreign substances, nutrient intake, resistance to foreign invasion, antigen transmission, and transportation inhibition, and are closely related to the overall health of the body [45,46]. All of these pathways were upregulated in the HA group compared with those in the LA group.
Furthermore, our findings revealed the enrichment of five distinct metabolic pathways associated with human diseases, underscoring the potential health impact of high altitudes on Sanhe heifers. In a broader context, untargeted metabolomics analysis can illuminate the profound influence of high altitudes [47]. This influence extends to the modification of organismal systems, metabolic pathways, environmental information processing, genetic information processing, and the potential induction of diseases. Additionally, altitude exerts its effects on environmental information processing, organismal systems, human diseases, and genetic information processing. This comprehensive perspective highlights the multifaceted impact of high altitudes on various facets of biological systems and health. However, for a greater understanding of the exact mechanism of differences in metabolism, further studies will be required with ruminants and other animals. Such studies would be beneficial for the development of plateau animals and humans.

5. Conclusions

We investigated the mechanisms of adaptation of the rumen metabolome of Sanhe heifers to high-altitude environments. We studied variations in the rumen metabolites between the LA and HA groups by integrating LC–MS-based untargeted metabolomic analyses, which suggested that the differences in rumen metabolites caused by high altitude may further affect the plateau adaptability of Sanhe heifers. This study provides a new basis for the study of the adaptability of ruminants to high altitudes from the standpoint of rumen digestion.

Supplementary Materials

The following supporting information can be downloaded at: https://www.mdpi.com/article/10.3390/fermentation10030170/s1, Figure S1: The OPLS-DA model were derived from the liquid chromatography/mass spectrometry metabolomics profiles of Sanhe heifer rumen fluid samples from based on all identified metabolite features of rumen fluid samples from the two groups. [(A) negative mode; (B) positive mode].

Author Contributions

Investigation, X.Z., W.W., Z.C., H.Y., Y.W. and S.L.; writing—original draft preparation, X.Z.; writing—review and editing, W.W., Z.C., H.Y., Y.W. and S.L. All authors have read and agreed to the published version of the manuscript.

Funding

This study was funded by the Ministry of Agriculture and Rural Affairs of China, grant number 16190319, and the China Agriculture Research System of MOF and MARA, grant number CARS 36.

Institutional Review Board Statement

The animal study protocol was approved by the Ethics Committee of College of Animal Science and Technology, China Agricultural University, under project number AW22121202-1-2.

Informed Consent Statement

Not applicable.

Data Availability Statement

The original contributions presented in the study are included in the article/Supplementary Material, further inquiries can be directed to the corresponding authors.

Conflicts of Interest

The authors declare no conflicts of interest.

References

  1. Wu, T. The Qinghai-Tibetan Plateau: How high do Tibetans live? High Alt. Med. Biol. 2001, 2, 489–499. [Google Scholar] [CrossRef]
  2. Sun, Y.; Liu, S.; Liu, Y.; Dong, Y.; Li, M.; An, Y.; Shi, F.; Beazley, R. Effects of the interaction among climate, terrain and human activities on biodiversity on the Qinghai-Tibet Plateau. Sci. Total Environ. 2021, 794, 148497. [Google Scholar] [CrossRef]
  3. Zha, R.; Sun, G.; Dong, Z.; Zhikang, Y.U. Assessment of atmospheric oxygen practical pressure and plateau reaction of tourists in the Qinghai-Tibet plateau. Ecol. Environ. Sci. 2016, 25, 92–98. (In Chinese) [Google Scholar]
  4. Cheviron, Z.A.; Brumfield, R.T. Genomic insights into adaptation to high-altitude environments. Heredity 2012, 108, 354–361. [Google Scholar] [CrossRef] [PubMed]
  5. Guo, X.; Long, R.; Kreuzer, M.; Ding, L.; Shang, Z.; Zhang, Y.; Yang, Y.; Cui, G. Importance of functional ingredients in yak milk-derived food on health of Tibetan nomads living under high-altitude stress: A review. Crit. Rev. Food Sci. Nutr. 2014, 54, 292–302. [Google Scholar] [CrossRef] [PubMed]
  6. Rohm, I.; Ratka, J.; Pistulli, R.; Goebel, B.; Gecks, T.; Figulla, H.R.; Yilmaz, A.; Jung, C. Impact of systemic normobaric short-term hypoxia on pro-inflammatory and anti-inflammatory cytokines in healthy volunteers. Clin. Lab. 2015, 61, 1053–1059. [Google Scholar] [CrossRef] [PubMed]
  7. Mazzeo, R.S.; Child, A.; Butterfield, G.E.; Braun, B.; Rock, P.B.; Wolfel, E.E.; Zamudio, S.; Moore, L.G. Sympathoadrenal responses to submaximal exercise in women after acclimatization to 4300 meters. Metabolism 2000, 49, 1036–1042. [Google Scholar] [CrossRef]
  8. Cole, M.A.; Abd Jamil, A.H.; Heather, L.C.; Murray, A.J.; Sutton, E.R.; Slingo, M.; Sebag-Montefiore, L.; Tan, S.C.; Aksentijević, D.; Gildea, O.S.; et al. On the pivotal role of PPARα in adaptation of the heart to hypoxia and why fat in the diet increases hypoxic injury. FASEB J. 2016, 30, 2684–2697. [Google Scholar] [CrossRef]
  9. Kong, Z.; Li, B.; Zhou, C.; He, Q.; Zheng, Y.; Tan, Z. Comparative analysis of metabolic differences of Jersey cattle in different high-altitude areas. Front. Vet. Sci. 2021, 8, 713913. [Google Scholar] [CrossRef]
  10. Malmuthuge, N.; Guan, L.L. Understanding host-microbial interactions in rumen: Searching the best opportunity for microbiota manipulation. J. Anim. Sci. Biotechnol. 2017, 8, 8. [Google Scholar] [CrossRef]
  11. Deusch, S.; Camarinha-Silva, A.; Conrad, J.; Beifuss, U.; Rodehutscord, M.; Seifert, J. A structural and functional elucidation of the rumen microbiome influenced by various diets and microenvironments. Front. Microbiol. 2017, 8, 1605. [Google Scholar] [CrossRef] [PubMed]
  12. Seshadri, R.; Leahy, S.C.; Attwood, G.T.; Teh, K.H.; Lambie, S.C.; Cookson, A.L.; Eloe-Fadrosh, E.A.; Pavlopoulos, G.A.; Hadjithomas, M.; Varghese, N.J.; et al. Cultivation and sequencing of rumen microbiome members from the Hungate1000 Collection. Nat. Biotechnol. 2018, 36, 359–367. [Google Scholar] [CrossRef] [PubMed]
  13. Huws, S.A.; Creevey, C.J.; Oyama, L.B.; Mizrahi, I.; Denman, S.E.; Popova, M.; Muñoz-Tamayo, R.; Forano, E.; Waters, S.M.; Hess, M.; et al. Addressing global ruminant agricultural challenges through understanding the rumen microbiome: Past, present, and future. Front. Microbiol. 2018, 9, 2161. [Google Scholar] [CrossRef]
  14. Bergman, E.N. Energy contributions of volatile fatty acids from the gastrointestinal tract in various species. Physiol. Rev. 1990, 70, 567–590. [Google Scholar] [CrossRef] [PubMed]
  15. Bickhart, D.M.; Weimer, P.J.J. Symposium review: Host-rumen microbe interactions may be leveraged to improve the productivity of dairy cows. J. Dairy Sci. Symp. Rev. 2018, 101, 7680–7689. [Google Scholar] [CrossRef]
  16. Morgavi, D.P.; Rathahao-Paris, E.; Popova, M.; Boccard, J.; Nielsen, K.F.; Boudra, H. Rumen microbial communities influence metabolic phenotypes in lambs. Front. Microbiol. 2015, 6, 1060. [Google Scholar] [CrossRef]
  17. Turnbaugh, P.J.; Bäckhed, F.; Fulton, L.; Gordon, J.I. Diet-induced obesity is linked to marked but reversible alterations in the mouse distal gut microbiome. Cell Host Microbe 2008, 3, 213–223. [Google Scholar] [CrossRef] [PubMed]
  18. Hildebrandt, M.A.; Hoffmann, C.; Sherrill-Mix, S.A.; Keilbaugh, S.A.; Hamady, M.; Chen, Y.Y.; Knight, R.; Ahima, R.S.; Bushman, F.; Wu, G.D. High-fat diet determines the composition of the murine gut microbiome independently of obesity. Gastroenterology 2009, 137, 1716–1724.e1. [Google Scholar] [CrossRef]
  19. Le Chatelier, E.; Nielsen, T.; Qin, J.; Prifti, E.; Hildebrand, F.; Falony, G.; Almeida, M.; Arumugam, M.; Batto, J.M.; Kennedy, S.; et al. Richness of human gut microbiome correlates with metabolic markers. Nature 2013, 500, 541–546. [Google Scholar] [CrossRef]
  20. Gaowa, N.; Panke-Buisse, K.; Wang, S.; Wang, H.; Cao, Z.; Wang, Y.; Yao, K.; Li, S. Brisket disease is associated with lower volatile fatty acid production and altered rumen microbiome in Holstein heifers. Animals 2020, 10, 1712. [Google Scholar] [CrossRef]
  21. Zhang, X.; Huang, S.; Li, S.; Wang, W. Effects of altitude on the digestion performance, serum antioxidative characteristics, rumen fermentation parameters, and rumen bacteria of Sanhe heifers. Front. Microbiol. 2022, 13, 875323. [Google Scholar] [CrossRef] [PubMed]
  22. Ji-hui, F.; Qiao, L.; Yan, Z.; Gen-wei, C.; Xiang-de, F.; Wen-Ming, L. Dynamic variations and influencing factors of groundwater levels in Lhasa City. Wuhan Univ. J. Nat. Sci. 2005, 10, 665–673. [Google Scholar] [CrossRef]
  23. National Research Council. Nutrient requirements of dairy cattle. In Nutrient Requirements of Dairy Cattle; The National Academies Press: Washington, DC, USA, 2001. [Google Scholar]
  24. Wiklund, S.; Johansson, E.; Sjöström, L.; Mellerowicz, E.J.; Edlund, U.; Shockcor, J.P.; Gottfries, J.; Moritz, T.; Trygg, J. Visualization of GC/TOF-MS-based metabolomics data for identification of biochemically interesting compounds using OPLS class models. Anal. Chem. 2008, 80, 115–122. [Google Scholar] [CrossRef] [PubMed]
  25. Kanehisa, M.; Goto, S.; Sato, Y.; Furumichi, M.; Tanabe, M. KEGG for integration and interpretation of large-scale molecular data sets. Nucleic Acids Res. 2012, 40, D109–D114. [Google Scholar] [CrossRef] [PubMed]
  26. Bruschetta, G.; Di Pietro, P.; Miano, M.; Cravana, C.; Ferlazzo, A.M. Effect of altitude on plasma serotonin levels in horses. In Trends in Veterinary Sciences: Current Aspects in Veterinary Morphophysiology, Biochemistry, Animal, Food Hygiene and Clinical Sciences; Boiti, C., Ferlazzo, A., Gaiti, A., Pugliese, A., Eds.; Springer: Berlin/Heidelberg, Germany, 2013; pp. 9–13. [Google Scholar]
  27. Lemos, V.A.; dos Santos, R.V.; Lira, F.S.; Rodrigues, B.; Tufik, S.; de Mello, M.T. Can high altitude influence cytokines and sleep? Mediators Inflamm. 2013, 2013, 279365. [Google Scholar] [CrossRef] [PubMed]
  28. Mishra, K.P.; Ganju, L. Influence of high altitude exposure on the immune system: A review. Immunol. Invest. 2010, 39, 219–234. [Google Scholar] [CrossRef]
  29. Song, T.T.; Bi, Y.H.; Gao, Y.Q.; Huang, R.; Hao, K.; Xu, G.; Tang, J.W.; Ma, Z.Q.; Kong, F.P.; Coote, J.H.; et al. Systemic pro-inflammatory response facilitates the development of cerebral edema during short hypoxia. J. Neuroinflamm. 2016, 13, 63. [Google Scholar] [CrossRef]
  30. Wang, C.; Jiang, H.; Duan, J.; Chen, J.; Wang, Q.; Liu, X.; Wang, C. Exploration of acute phase proteins and inflammatory cytokines in early stage diagnosis of acute mountain sickness. High Alt. Med. Biol. 2018, 19, 170–177. [Google Scholar] [CrossRef]
  31. Dosek, A.; Ohno, H.; Acs, Z.; Taylor, A.W.; Radak, Z. High altitude and oxidative stress. Respir. Physiol. Neurobiol. 2007, 158, 128–131. [Google Scholar] [CrossRef]
  32. Seys, S.F.; Daenen, M.; Dilissen, E.; Van Thienen, R.; Bullens, D.M.; Hespel, P.; Dupont, L.J. Effects of high altitude and cold air exposure on airway inflammation in patients with asthma. Thorax 2013, 68, 906–913. [Google Scholar] [CrossRef]
  33. Boos, C.J.; Woods, D.R.; Varias, A.; Biscocho, S.; Heseltine, P.; Mellor, A.J. High altitude and acute mountain sickness and changes in circulating endothelin-1, interleukin-6, and Interleukin-17a. High Alt. Med. Biol. 2016, 17, 25–31. [Google Scholar] [CrossRef]
  34. Kleger, G.R.; Bärtsch, P.; Vock, P.; Heilig, B.; Roberts, L.J., 2nd; Ballmer, P.E. Evidence against an increase in capillary permeability in subjects exposed to high altitude. J. Appl. Physiol. 1996, 81, 1917–1923. [Google Scholar] [CrossRef] [PubMed]
  35. Bailey, D.M.; Kleger, G.R.; Holzgraefe, M.; Ballmer, P.E.; Bärtsch, P. Pathophysiological significance of peroxidative stress, neuronal damage, and membrane permeability in acute mountain sickness. J. Appl. Physiol. 2004, 96, 1459–1463. [Google Scholar] [CrossRef] [PubMed]
  36. Bruschetta, G.; Fazio, E.; Cravana, C.; Ferlazzo, A.M. Effects of partial versus complete separation after weaning on plasma serotonin, tryptophan and pituitary-adrenal pattern of Anglo-Arabian foals. Livest. Sci. 2017, 198, 157–161. [Google Scholar] [CrossRef]
  37. Vargas, V.E.; Kaushal, K.M.; Monau, T.; Myers, D.A.; Ducsay, C.A. Long-term hypoxia enhances cortisol biosynthesis in near-term ovine fetal adrenal cortical cells. Reprod. Sci. 2011, 18, 277–285. [Google Scholar] [CrossRef] [PubMed]
  38. Sawhney, R.C.; Malhotra, A.S.; Singh, T. Glucoregulatory hormones in man at high altitude. Eur. J. Appl. Physiol. Occup. Physiol. 1991, 62, 286–291. [Google Scholar] [CrossRef]
  39. Harmon, D.L.; Swanson, K.C. Review: Nutritional regulation of intestinal starch and protein assimilation in ruminants. Animal 2020, 14, s17–s28. [Google Scholar] [CrossRef]
  40. Reynolds, C.K.; Kristensen, N.B. Nitrogen recycling through the gut and the nitrogen economy of ruminants: An asynchronous symbiosis. J. Anim. Sci. 2008, 86, E293–E305. [Google Scholar] [CrossRef]
  41. Ogata, H.; Tokuyama, K.; Nagasaka, S.; Ando, A.; Kusaka, I.; Sato, N.; Goto, A.; Ishibashi, S.; Kiyono, K.; Struzik, Z.R.; et al. Long-range correlated glucose fluctuations in diabetes. Methods Inf. Med. 2007, 46, 222–226. [Google Scholar] [CrossRef]
  42. Venter, L.; Loots, D.T.; Mienie, L.J.; Jansen van Rensburg, P.J.; Mason, S.; Vosloo, A.; Lindeque, J.Z. Uncovering the metabolic response of abalone (Haliotis midae) to environmental hypoxia through metabolomics. Metabolomics 2018, 14, 49. [Google Scholar] [CrossRef]
  43. Ould Amer, Y.; Hebert-Chatelain, E. Mitochondrial cAMP-PKA signaling: What do we really know? Biochim. Biophys. Acta Bioenerg. 2018, 1859, 868–877. [Google Scholar] [CrossRef] [PubMed]
  44. Zhang, H.; Kong, Q.; Wang, J.; Jiang, Y.; Hua, H. Complex roles of cAMP-PKA-CREB signaling in cancer. Exp. Hematol. Oncol. 2020, 9, 32. [Google Scholar] [CrossRef] [PubMed]
  45. Liu, X. ABC family transporters. Adv. Exp. Med. Biol. 2019, 1141, 13–100. [Google Scholar] [CrossRef] [PubMed]
  46. Thomas, C.; Tampé, R. Structural and mechanistic principles of ABC transporters. Annu. Rev. Biochem. 2020, 89, 605–636. [Google Scholar] [CrossRef]
  47. Li, J.; Li, C.; Zhang, R.; Jin, L.; Sun, X.; Wang, Z. Effects of high-altitude hypoxia on the metabolites and gut microbiota of Tibetan miniature pigs. Front. Microbiol. 2019, 10, 2879. [Google Scholar] [CrossRef]
Figure 1. Metabolomic profiling of fecal samples. (A,B) Scatter plots of the principal coordinate analysis (PCA) model based on all identified metabolite features of rumen fluid samples from the two groups. [(A) negative mode; (B) positive mode]. (C,D) Volcano plots of the comparison between the low-altitude (LA) and high-altitude (HA) groups [(C) negative mode; (D) positive mode].
Fermentation 10 00170 g001
Figure 2. Enriched Kyoto Encyclopedia of Genes and Genomes (KEGG) pathways of the low-altitude (LA) and high-altitude (HA) groups (only those with p < 0.05 are shown).
Fermentation 10 00170 g002
Table 1. Effect of altitude on levels of serum immunoglobulins and cytokines in Sanhe heifers.
ItemsGroups 1SEMp-Value
LAHA
Immunoglobulin A (IgA, mg/mL)0.130.120.010.89
Immunoglobulin G (IgG, mg/mL)2.392.410.170.96
Immunoglobulin M (IgM, mg/mL)0.820.820.060.99
Interleukin-2 (IL-2, ng/L)128.65107.5910.120.30
Interleukin-6 (IL-6, ng/L)565.06567.2060.870.99
Interleukin-10 (IL-10, ng/L)31.3731.603.100.97
Tumor necrosis factor-α (TNF-α, ng/L)180.3366.7310.360.53
1 LA represents the low-altitude region specifically Hulunbuir City in the Inner Mongolia Autonomous Region, situated at approximately 700 m altitude (coordinates: 119°57’ E, 47°17’ N). HA denotes the high-altitude region, which corresponds to Lhasa City in the Tibet Autonomous Region, located at an approximate altitude of 3750 m (coordinates: 91°06’ E, 29°36’ N).
Table 2. Effect of altitude on serum biochemistry indices of Sanhe heifers.
ItemsGroups 1SEMp Value
LAHA
Leptin (LEP, ng/mL)3.983.690.540.80
Cortisol (Cor, ng/mL)15.3532.463.17<0.01
Glucose (GLU, mmol/L)3.654.030.090.04
Blood urea nitrogen (BUN, mmol/L)3.817.230.43<0.01
Total cholesterol (TC, mmol/L)2.632.680.080.79
Nonesterified fatty acids (NEFA, mmol/L)0.430.470.040.54
Ca2+ (mmol/L)2.050.860.21<0.01
P5+ (mmol/L)2.081.990.080.59
1 LA represents the low-altitude region specifically Hulunbuir City in the Inner Mongolia Autonomous Region, situated at approximately 700 m altitude (coordinates: 119°57′ E, 47°17′ N). HA denotes the high-altitude region, which corresponds to Lhasa City in the Tibet Autonomous Region, located at an approximate altitude of 3750 m (coordinates: 91°06′ E, 29°36′ N).
Table 3. Differential metabolites in differentially enriched KEGG pathways using HILIC–MS analysis.
HMDBMetaboliteVIPFold Changep-ValueDirection
HMDB0000148Glutamic acid5.4892.701<0.001
HMDB00337523-(2-hydroxyphenyl)propionic acid3.8110.317<0.001
HMDB0000251Taurine1.0990.224<0.001
HMDB00004403-hydroxyphenylacetic acid2.3280.423<0.001
HMDB0001335Prostaglandin i24.7662.500<0.001
HMDB0000058Adenosine 3′,5′-cyclic monophosphate5.0070.0860.005
HMDB0000159L-phenylalanine2.4054.418<0.001
HMDB0003213Raffinose1.28918.775<0.001
HMDB0001547Corticosterone3.4820.315<0.001
HMDB0001830Progesterone3.4230.362<0.001
HMDB0000158Tyrosine1.5363.418<0.001
HMDB0000300Uracil8.8932.225<0.001
HMDB0001314Guanosine 3′,5′-cyclic monophosphate1.6900.0990.006
HMDB00000204-hydroxyphenylacetic acid1.6480.401<0.001
HMDB0000161L-alanine1.5282.449<0.001
HMDB000001621-hydroxyprogesterone1.4070.527<0.001
HMDB0000156L-malic acid1.6662.686<0.001
HMDB0000191Aspartic acid4.0912.684<0.001
HMDB0060475DL-glutamic acid5.3392.259<0.001
HMDB0006483D-aspartic acid1.3882.549<0.001
HMDB0000050Adenosine13.6580.391<0.001
HMDB0001397Guanosine 5′-monophosphate1.2022.575<0.001
HMDB0000273His-ser1.8812.0480.003
HMDB0002088N-oleoylethanolamine2.1812.507<0.001
HMDB0000159Phenylalanine1.5502.9900.002
HMDB0000158DL-tyrosine1.0802.336<0.001
HMDB0000156Malate2.8533.1280.002
HMDB0000259Serotonin1.4590.2240.003
HMDB00000223-methoxytyramine1.3862.113<0.001
HMDB0000177Histidine1.4220.589<0.001
HMDB0000767Pseudouridine1.5993.2720.003
HMDB0000228Phenol4.4180.336<0.001
HMDB00007643-Phenylpropanoic acid22.6240.697<0.001
HMDB0000011Beta-hydroxybutyrate1.5830.6290.002
HMDB0000172L-isoleucine1.1430.2540.002
D-glucose 6-phosphate1.3160.2060.034
HMDB0000965Hypotaurine1.0081.8650.002
HMDB0060263Histamine3.4871.9040.019
HMDB0000148L-glutamate1.2593.0980.044
HMDB0062186L-aspartic acid1.3142.1140.010
HMDB0000089Cytidine5.8943.292<0.001
HMDB00006692-hydroxyphenylacetic acid1.1030.564<0.001
HMDB00004233,4-dihydroxyhydrocinnamic acid2.5850.8330.005
HMDB0000687Leucine4.3894.818<0.001
HMDB0000301/HMDB0034174Urocanic acid1.9046.7270.001
HMDB0000210Pantothenic acid1.6281.7730.019
HMDB0000262Thymine4.9863.3040.002
HMDB0002434Hydroquinone1.5180.5960.007
HMDB0000167DL-threonine1.1162.3120.001
HMDB0000301Urocanate4.8467.7670.002
HMDB00012022′-deoxycytidine 5′-monophosphate1.4421.5670.029
HMDB0001870Benzoic acid1.1110.527<0.001
HMDB0000162L-proline1.8441.7780.007
HMDB0000303Ala-Ala9.3202.8240.005
HMDB0000306Tyramine3.2444.4750.024
HMDB00000011-methylhistidine1.3220.2290.015
HMDB00042844-hydroxyphenethyl alcohol2.8851.8270.021
HMDB0000043Betaine3.5990.3840.016
HMDB00003753-(3-Hydroxyphenyl)propanoic acid1.5470.6170.028
HMDB0004063Metanephrine1.2421.4030.040
HMDB0000209Phenylacetic acid1.4731.3990.011
HMDB00023221,5-pentanediamine6.6550.597<0.001
HMDB0001895Salicylic acid4.6040.391<0.001
HMDB0000819Dl-normetanephrine2.6861.9410.005
HILIC–MS, hydrophilic interaction liquid chromatography-mass spectrometry; VIP, variable important in projection. Different metabolites were filtered using significance estimates of p < 0.05 and VIP > 1.0 (n¼5). LA represents the low-altitude region (Hulunbuir City, Inner Mongolia Autonomous Region, situated at approximately 700 m altitude; coordinates: 119°57′ E, 47°17′ N). HA denotes the high-altitude region (Lhasa City, Tibet Autonomous Region, located at an approximate altitude of 3750 m; coordinates: 91°06′ E, 29°36′ N). ‘↑’ indicates an increase in the level of a metabolite in the HA group compared with that in the LA group; ‘↓’ indicates a decrease in the level of a metabolite in the HA group compared with that in the LA group.
Disclaimer/Publisher’s Note: The statements, opinions and data contained in all publications are solely those of the individual author(s) and contributor(s) and not of MDPI and/or the editor(s). MDPI and/or the editor(s) disclaim responsibility for any injury to people or property resulting from any ideas, methods, instructions or products referred to in the content.

