Article

Metagenomic/Metaproteomic Investigation of the Microbiota in Dongbei Suaicai, a Traditional Fermented Chinese Cabbage

College of Food Science and Engineering, Jilin University, 5333 Xi’an Road, Changchun 130062, China
*
Author to whom correspondence should be addressed.
Fermentation 2024, 10(4), 185; https://doi.org/10.3390/fermentation10040185
Submission received: 18 February 2024 / Revised: 21 March 2024 / Accepted: 25 March 2024 / Published: 28 March 2024
(This article belongs to the Section Fermentation for Food and Beverages)

Abstract

:

Highlights

What are the main findings?
  • Important metabolic pathways related to carbohydrate and amino acid metabolisms were enriched.
  • Pediococcus was first found to be one of the most popular genera of late fermentation.
What is the implication of the main finding?
  • The multi-omics of metagenomics and metaproteomics was used to research the microbial ecosystem of Dongbei Suaicai.

Abstract

Dongbei Suaicai (DBSC) has a complicated microbial ecosystem in which the composition and metabolism of microbial communities during the process have not been well explored. Here, combined metagenomic and metaproteomic technology was used to reveal the taxonomic and metabolic profiles of DBSC. The results showed that firmicutes and proteobacteria were the prevalent bacteria in phylum and Pseudomonas, while Weissella, Pediococcus, and Leuconostoc were the prevalent genus. The vital metabolic pathways were involved in glycolysis/gluconeogenesis [path: ko00010], as well as pyruvate metabolism [path: ko00620], fructose and mannose metabolism [path: Ko00051], glycine, and serine and threonine metabolism [path: Ko00260]. Moreover, the key proteins (dps, fliC, tsf, fusA, atpD, metQ, pgi, tpiA, eno, alaS, bglA, tktA, gor, pdhD, aceE, and gnd) in related metabolized pathways were enriched during fermentation. This study will aid in facilitating the understanding of the fermentation mechanisms of DBSC.

1. Introduction

Dongbei Suancai (DBSC), a traditional fermented Chinese cabbage (grown in large quantities all over China) prepared at low temperatures for 1–2 months, has been popular in China and neighboring countries such as South Korea, Japan, and Russia for several centuries [1]. The spontaneous fermentation of DBSC is a method of preservation of vegetables with a long-recorded history, which converts the Chinese cabbage to a product with a pleasant sour flavor [2]. Traditional DBSC is fermented based on the microorganisms attached to the raw material, which produces enzymes hydrolyzing carbohydrates, proteins, and lipids into organic acids and amino and acid aroma precursors [3,4]. Consequently, the fermentation of DBSC forms a complicated microbial ecosystem, which includes microorganisms, enzymes, and metabolites derived from substance and energy exchanges [5]. Previous studies have suggested that the diversity of microbial communities affects the physical and chemical properties of metabolites and enzyme compositions in DBSC [6]. However, up until now, specific mechanisms of substance metabolisms and functions of microbiota during the fermentation of DBSC have been unclear. Therefore, it is essential to deeply research DBSC for improving fermentation management.
With the development of molecular biology and genomics, metagenomics and metaproteomics are playing an important role in fermented product research, which has brought new opportunities for investigating complicated microbial communities [7,8]. Metagenomics refers to the study of genetic material of entire communities of organisms. This process usually involves third-generation sequencing (TGS) after the DNA extraction from the samples. TGS produces a large volume of data in the form of long reads to analyze the microbial community or predicted metabolic functions [9,10,11]. As a branch discipline studying the diversity of microbe flora and interactions within the environment, metagenomics has been applied to detected the dominant and low-epidemic genera to analyze the structural diversity and function of microbial communities, as well as the metabolic pathways related to specific environments in fermented food [12,13]. Meanwhile, metaproteomics is an emerging technology to study.
The metaproteomics technique is often focused on the quantitative functional makeup and associated microbes [14,15]. As a powerful means, metaproteomics has been applied to investigate the proteome in fermented fish, vegetable, maize products, and so on [8,16,17]. However, in metaproteomics, it is particularly challenging to find an appropriate database as the samples routinely contain a huge variety of microbial species, which results in a large size, redundancy, and a lack of biological annotations for the protein sequences [18]. A metagenomic-sequencing database from the same sample would increase the rate of protein identification. Therefore, in this work, the database is composed of protein amino acid sequences obtained by metagenomic analyses of the samples to be analyzed, which can improve the protein-identification rate [19]. Some studies have shown that multiomics can comprehensively unravel the mechanism of complicated microorganism communities [20,21].
In the present study, metagenomics and metaproteomics were applied together to analyze microbial communities and characterize the proteome with an aim to explore the microbial composition of DBSC metabolic activities occurring in the fermentation process and which enzymes perform these functions. This study will provide theoretical support for process regulation and quality DBSC product industries.

2. Materials and Methods

2.1. Sample Preparation and Collection

Fresh Chinese cabbages were purchased from the local market in Changchun, China and fermented using traditional methods [1]. First, the Chinese cabbages were cleaned by removing the rotten and dirty peels and subsequently air-drying them for 3 days, putting them into a 50 L fermentation jar, pickling them with 2% salt, placing a weight on the top, and spontaneously fermenting them (0–15 °C) for 60 days.
The samples (n = 9) were collected at three fermentation time points (Days 20, 40, 60) and extracted from three replicate containers each time. At each sampling time, triplicate brine samples were drawn randomly from the top, middle, and bottom of one container and well mixed. A total of nine mixed samples were gathered and stored in sterile plastic bottles at −80 °C until testing [22].

2.2. Metagenomic Analysis

2.2.1. DNA Extraction, Library Construction, and Sequencing

Nine mixed brine samples were centrifuged at 13,400× g at 4 °C for 1 min, and then extracted for total DNA with Genomic DNA extraction kit (Tiangen–Bio Technology Co, Beijing, China, DP336). Then, 1 μg of DNA per sample was used as the input material for DNA sample preparation. After that, the DNA library with 300–500 bp insert size was constructed using the DNA library construction kits (Universal DNAseq Library Prep Kit, Kaitai–Bio, Nanning, China). The libraries were sequenced on the Illumina HiSeq 2500 platform at the Kaitai Bioinformatics Technology Company (Thermo Fisher Scientific, Waltham, MA, USA).

2.2.2. Information-Analysis Process

Illumina raw reads were preprocessed using the FASTX–Toolkit software (Version 0.21.0) with the following treatments: (1) remove the splice sequences in the sequencing reads; (2) remove the reads containing more than 40% of unqualified (quality ≤ 15) nucleobase; (3) remove the sequences with a truncated length of less than 100 bp; (4) remove the sequences with the truncated N content of more than 5%. After quality filtering, clean reads were assembled and analyzed using the megahit software (Version 1.2.9). Afterwards, MetaGeneMark (http://topaz.gatech.edu/GeneMark/license_download.cgi accessed on 1 January 2023) was used to perform coding-region (CDS) predictions on individual samples and mixed-assembled contigs (≥500 bp) with default parameters. Based on the CDS prediction results, non-redundant genes with identity ≥95% and coverage >90% were clustered, then the longest gene.final.count sequences were selected as representative sequences for the Unigene abundance statistics with Salmon software (Version 5.0.2). Using diamond software (Version 2.0.9) (blastp, value ≤ 1 × 10⁻⁵) to compare the Unigenes with the non-redundant (NR in NCBI) database, the comparison results (evalue ≤ minimum evalue-10) were selected for species classification. Clusters of orthologous groups (COG) and Kyoto Encyclopedia of Genes and Genomes (KEGG) were used for functional analysis (Figure 1).

2.3. Protein Preparation and Metaproteomics

2.3.1. Protein Extraction and Peptide Digestion

Proteins were extracted from each sample; an appropriate amount of SDT (4% SDS, 100 mM Tris-HCl, pH 7.6) lysate was added and quantified with Bicinchoninic Acid Assay (BCA) method. The 20 µg proteins were taken from each sample, added to 5X buffer and boiling bath water for 5 min, then separated by SDS-PAGE (4–20% precast gradient gel, constant pressure 180 V, 45 min) and stained with Cauloblue R-250. The appropriate amount of protein was extracted from all samples and mixed into pool samples for construction of spectral library. All sample proteins were trypsin digested using the filter-aided proteome preparation (FASP). The peptides from the pool samples were graded with high-PH reversed-phase Peptide Separation Kit (10 levels) (Thermo Fisher Scientific, Waltham, MA, USA), desalted with C18 Cartridge, redissolved with 40 μL of 0.1% formic acid after lyophilized, and finally determined at OD280.

2.3.2. Mass Spectrometric Methods

The peptides were chromatographed by using a nanoliter flow-rate HPLC system (Easy-nLC 1200). Specifically, samples were injected into a C18 column for linear gradient separation [Thermo Scientific, ES802, 1.9 µm, 75 µm × 20 cm, 0.1% formic acid acetonitrile aqueous solution] [acetonitrile is 84%], 300 nL/min flow rate). Then, Q-Exactive HF-X mass spectrometer (Thermo Fisher Scientific, Waltham, MA USA) was used for mass spectrometry (detection mode: positive ion; primary mass spectral scan range: 350–1800 m/z; mass spectral resolution: 60,000 [@m/z 200]; AGC target: 1 × 10⁶, maximum IT: 50ms, dynamic exclusion time: 10 s). Each full MS scan collects 20 ddMS2 scans based on the inclusion list (isolation window:1.5 m/z; MS resolution: 30,000 [@m/z 200]; AGC target: 1 × 10⁵; maximum IT: 50 ms; MS2 activation type: HCD; normalized collision energy: 30 eV).

2.3.3. MS Data Analysis

DDA data were directly imported into the Spectronaut software (SpectronautTM 14.4.200727.47784). Then, the database was downloaded according to the corresponding species. The search parameters were set as follows: trypsin as enzyme, max miss cleavage site as 1, fixed modification as carbamidomethyl (C), dynamic modification as oxidation (M) and acetyl (protein N-term). In addition, the identified proteins needed to pass the set-filtering parameter FDR < 1%.

2.4. Bioinformatics Analysis

The COG database (http://www.ncbi.nlm.nih.gov/COG accessed on 1 January 2023), KEGG database (http://www.genome.jp/kegg/pathway.html accessed on 1 January 2023), and NCBI-nr database (ftp://ftp.ncbi.nlm.nih.gov/blast/db/FASTA/nr.gz accessed on 1 January 2023) were used for bioinformatic analysis.

3. Results

3.1. Overview of Metagenomic Data

The nine samples of DBSC were analyzed using metagenomic sequencing. This process generated 699,857,802 raw reads, of which, 683,407,618 reads remained after quality control. In total, >95% reads had sequencing errors lower than 1%, and 1,006,177 ORFs were acquired after gene prediction Table 1, which shows the high quality of the sequencing procedure and statistics of the reads.

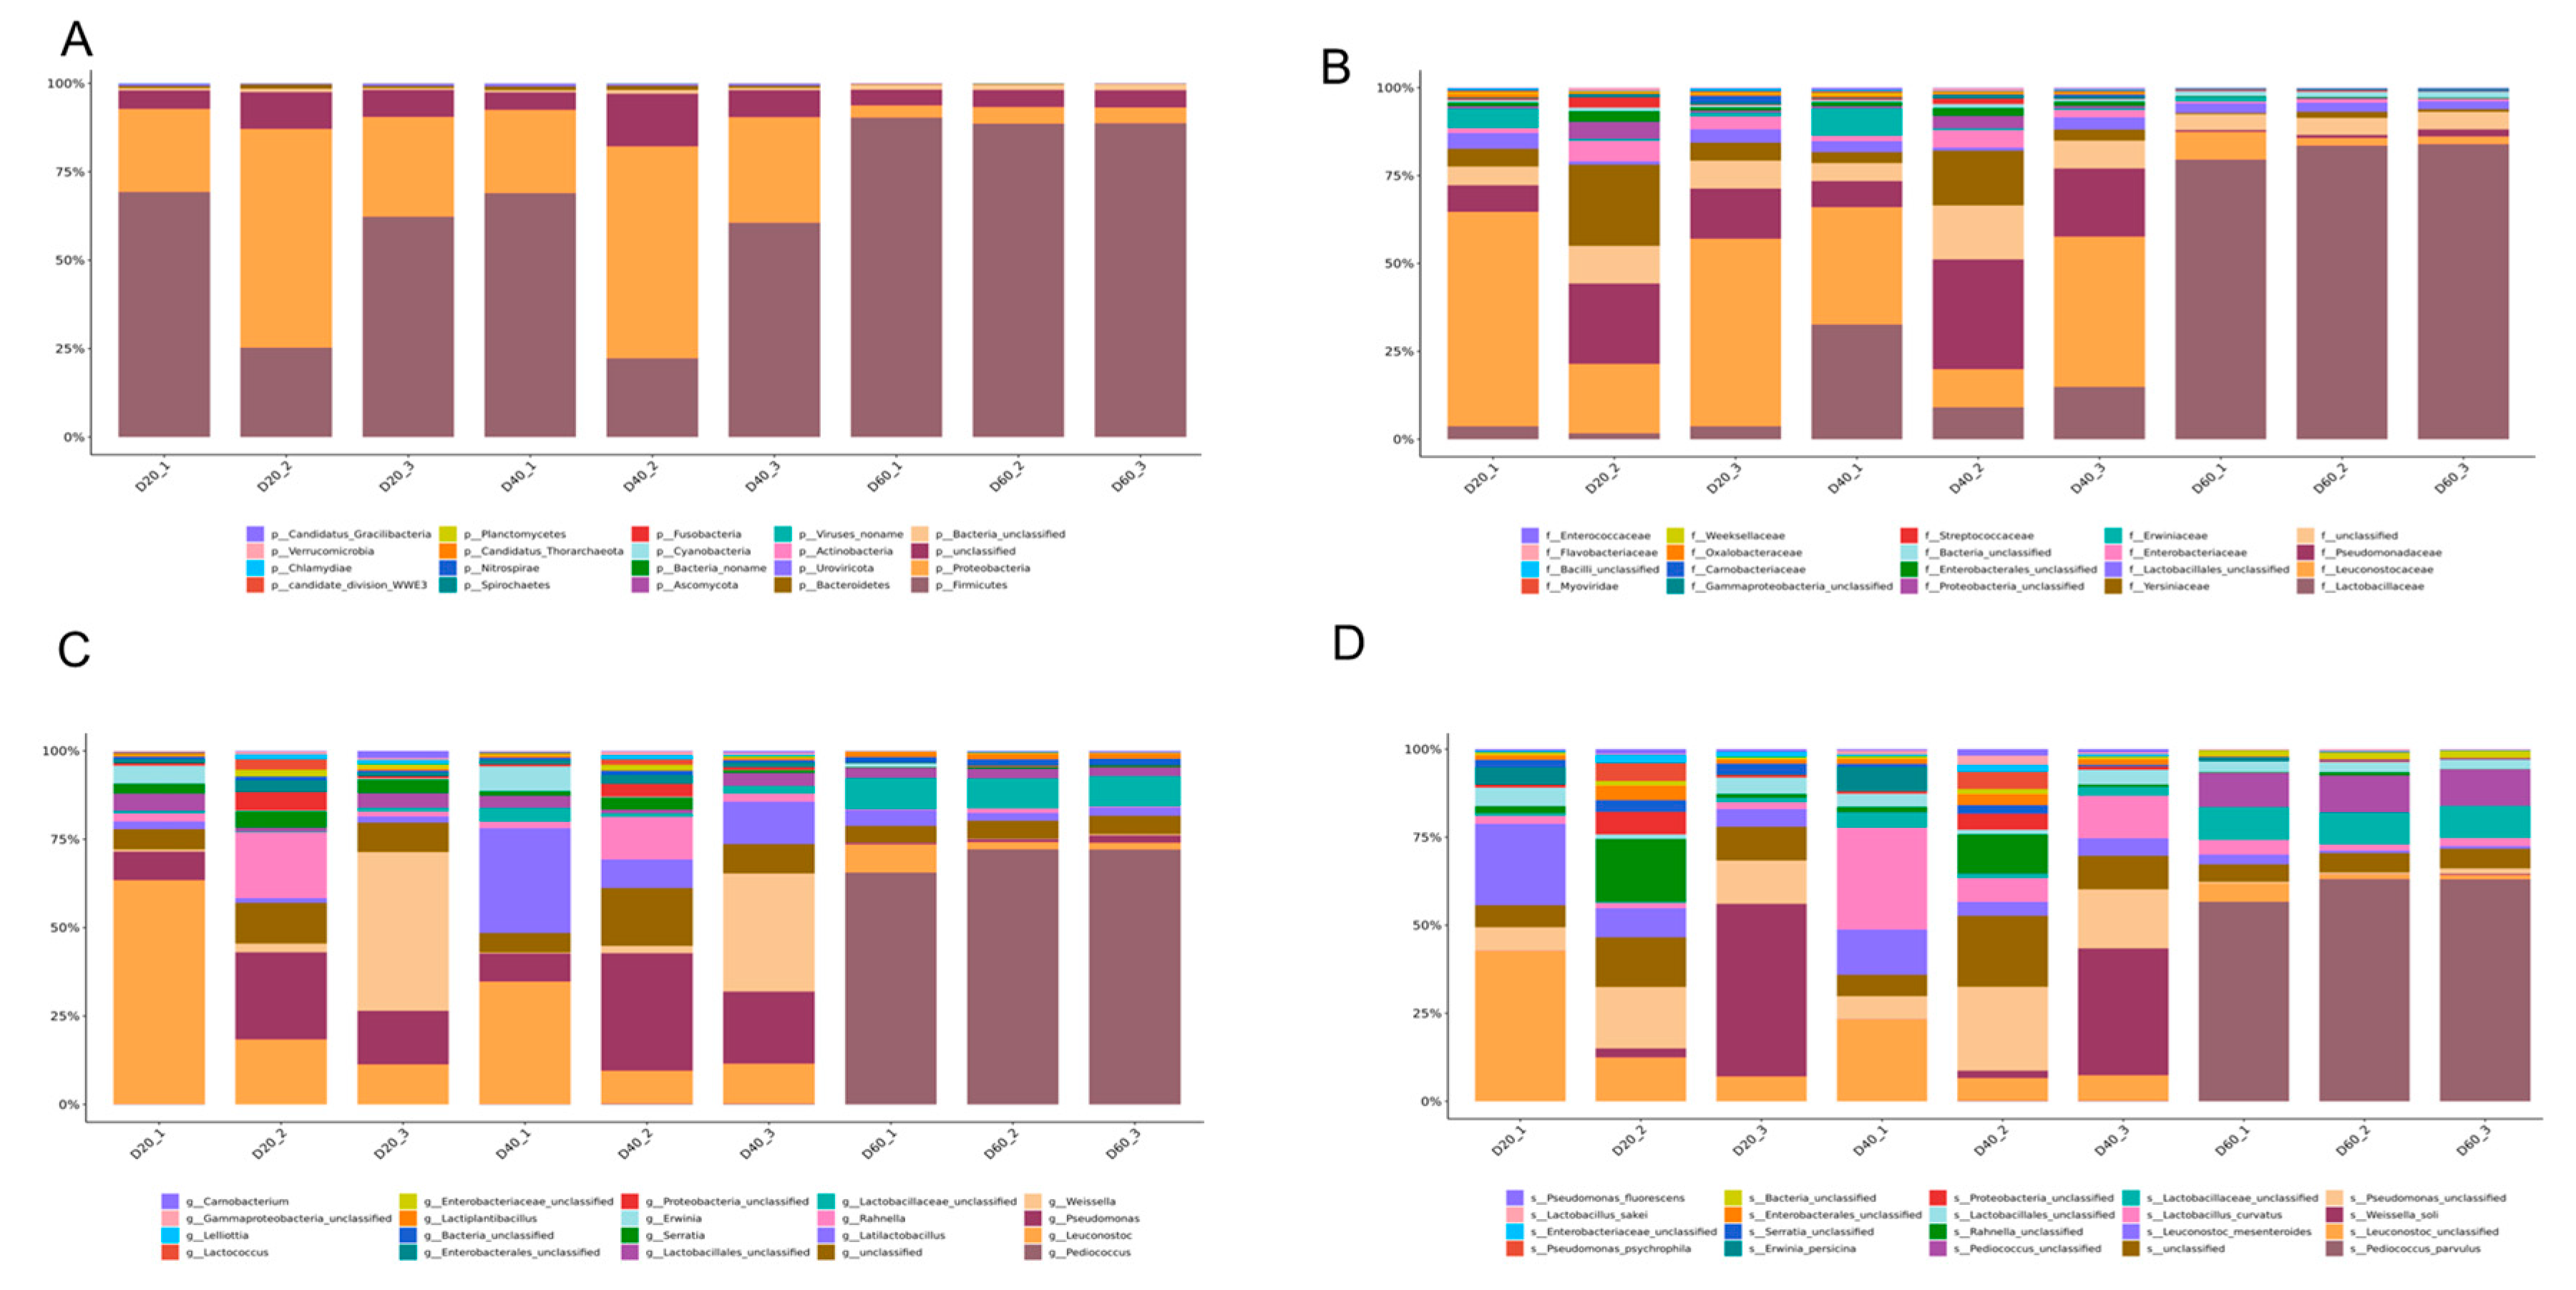
3.2. Taxonomic Composition of Predicted Genes

Figure 2A shows the existence of the top-20 phylum throughout the fermentation period. Firmicute was the most abundant phylum (61.13%), followed by proteobacteria (29.34%), uroviricota (0.39%), bacteroidetes (0.06%), actinobacteria (0.06%), ascomycota (0.02%), cyanobacteria (0.01%), and others. Meanwhile, the abundance of firmicute increased from 52.31% (Day 20) to 89.24% (Day 60) following fermentation progress. Conversely, the abundance of proteobacteria decreased from 37.77% (Day 20) to 4.14% (Day 60). At the family level, leuconostocaceae was expressed as the dominant family with an abundance of 43.15% at the 20th day of fermentation. However, with the extension of fermentation time, the abundance of leuconostocaceae obviously decreased to 28.10% on the 40th day and to 4.02% on the 60th day. Similar to leuconostocaceae, yersiniaceae was also a dominant family on the 20th day with an abundance of 10.85%; it decreased to 7% on the 40th day and to 0.93% on the 60th day. During the first 40 days of fermentation, the abundance of pseudomonadaceae increased from 14.60% to 18.77%, which played an important role in the early stage of fermentation, while it decreased to 1.13% on the 60th day. It is noteworthy that lactobacillaceae gradually occupied the dominant role in the fermentation process, which accounted for an abundance from 2.96% (Day 20) to 18.37% (Day 40), and up to 81.80% at Day 60, which played a decisive role in the late fermentation of DBSC (Figure 2B).
At the genus level (Figure 2C), the abundance of Pediococcus (belonging to lLactobacillaceae) remarkably increased up to 67.19% on the 60th day from 0.04% (Day 20) and 0.19% (Day 40), and it became the most popular genera in the final period. As a member of the lactobacillaceae, Latilactobacillus increased up to 15.15% (Day 40) from 1.66% (Day 20), then decreased to 2.93% (Day 60). As important members of leuconostoceae, Leuconostoc and Weissella declined with the prolongation of fermentation from 28.39% (Day 20), to 16.75% (Day40), to 3.76% (Day 60), and from 14.68% (Day 20), to 10.93% (Day 40), to 0.17% (Day 60), respectively. Pseudomonas shares the same trend as pseudomonadaceae, which increases from 14.60% (Day 20) to 18.77% (Day 40), yet it decreased to 1.13% on the 60th day. As shown in Figure 2D, Weissella_soli and Leuconostoc_mesenteroides were the main species on the 20th day, and their abundance was 16.59% and 9.92%, respectively. Similar to Weissella and Leuconostoc, the abundance of Weissella_soli decreased to 10.28% on Day 40 and abruptly decreased to 0.13% on Day 60, and the abundance of Leuconostoc_mesenteroides decreased to 5.92% on Day 40 and 1.34% on Day 60. Lactobacillus_curvatus occupied the position of the most dominant species on the 40th day with the abundance of 12.92%, then it dropped to 2.39% on Day 60. Pediococcus_parvulus was almost absent during the first 40 days’ fermentation, with abundances of 0% (Day 20) and 0.10% (Day 40), respective. However, it abruptly increased to 54.81% on the 60th day, occupying over half of all species.

3.3. Function Classification of Identified Genes

The abscissa (20, 40, 60) represented fermentation time (day). Figure 3 (A) shows the 23 functional categories of identified genes that were annotated by the COG database. The top-five categories were nothing analysis (NA), translation, ribosomal structure, and biogenesis (J), transcription (K), carbohydrate transport and metabolism (G), and amino acid transport and metabolism (E). Obviously, the percentage of most categories remained steady during fermentation. Among them, the “carbohydrate transport and metabolism” category accounted for 5% on Day 20, 5.01% on Day 40, and increased to 6.27% on Day 60. The “amino acid transport and metabolism” category accounted for 5.50%, 5.06%, and 4.54% on Days 20, 40, and 60. To generate deeper insights into the functional pathways associated with identified genes, they were mapped to the KEGG pathways of KEGG database. The top-20 metabolic subsystems at the KEGG classification Level 3 were identified within the annotated dataset (B). These pathways mainly belong to four classification of 1 level, as follows environmental information processing: ABC transporters (path02010), two-component system (path02020), phosphotransferase system (PTS) (path02060); genetic information processing: ribosome (path03010), aminoacyl-tRNA biosynthesis (path00970); cellular processes: quorum sensing (path02024); metabolism: purine/metabolism (path00230), pyrimidine metabolism (path00240), starch and sucrose metabolism (path00500), amino sugar and nucleotide sugar metabolism (path00520), fructose and mannose metabolism (path00051), galactose metabolism (path00052), glycolysis/gluconeogenesis (path00010), pyruvate metabolism (path00620), cysteine and methionine metabolism (path00270), glycine, serine and threonine metabolism (path00260), peptidoglycan biosynthesis (path00550), oxidative phosphorylation (path00190), and fatty acid biosynthesis (path00061) (Supplementary Material B).

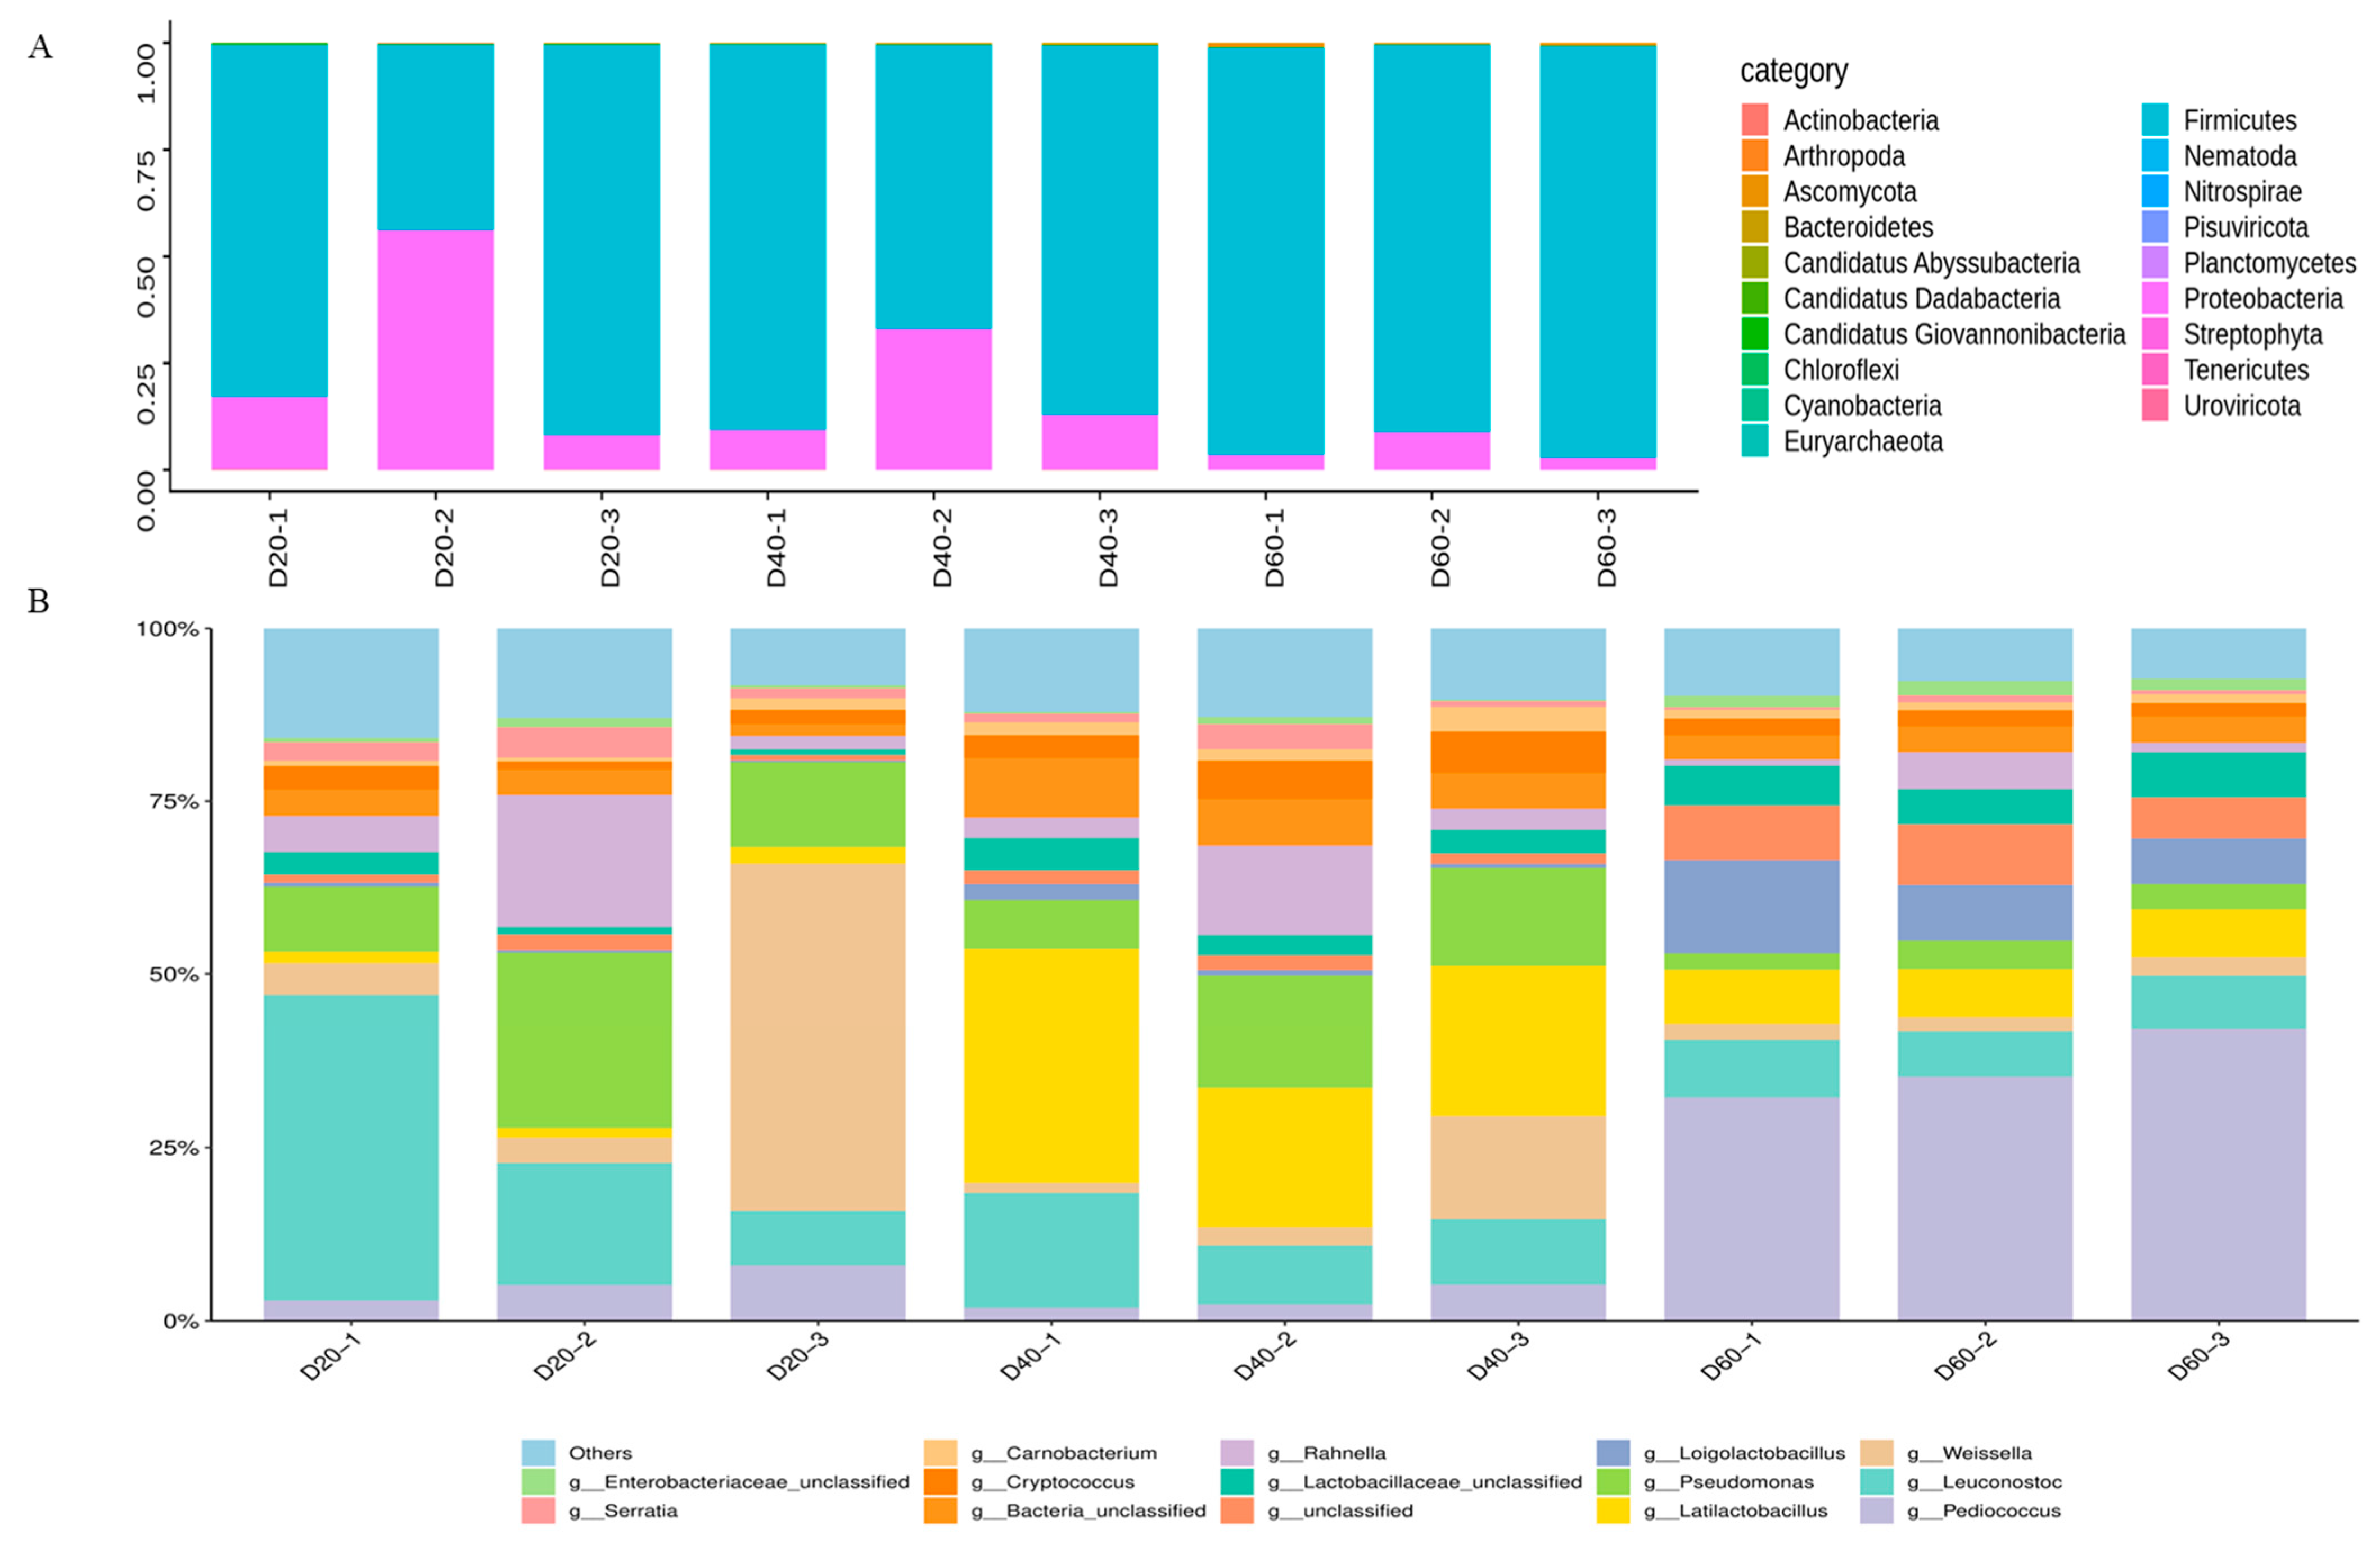
3.4. Taxonomic Composition of Identified Proteins

Through DDA quantitative proteomics technology, 9944 proteins with a high confidence of the correct peptide-sequence assignment (false discovery rate [FDR] < 0.01) were examined totally, including 7719 on Day 20, 6400 on Day 40, and 6132 on Day 60, respectively. The abundances of phyla and genera in the analyzed samples proteins are shown in Figure 4. The results showed that 19 phyla were detected from the nine samples. Among these phyla, firmicutes (89.58%) and proteobacteria (9.63%) accounted for 99.21%. Following the most predominant phyla, the others were ascomycota (0.35%), bacteroidetes (0.20%), and non-dominant phyla (less than 0.01%) (Figure 4A). At the genus level, Figure 4B shows that the proteins were mainly derived from Weissella (27.00%), Leuconostoc (19.81%), Pseudomonas (14.58%), Rahnella (6.58%), and Pediococcus (5.97%) on the 20th day. However, on the 40th day of fermentation, Latilactobacillus (25.07%) occupied the position of the most abundant genus, followed by Pseudomonas (12.48%), Leuconostoc (11.51%), Weissella (6.70%), Rahnella (6.04%), and so on. It is worth noting that Pediococcus (36.28%) was found to be the most abundant genus, along with a number of major genera of Loigolactobacillus (9.69%), Leuconostoc (7.60%), Latilactobacillus (7.29%), Lactobacillaceae_unclassified (5.89%), and others, which had an abundance of <5% on the 60th day (Supplementary Material C).

3.5. Function Classification of Proteins

According to the COG database, the identified proteins were functionally clustered into 22 classifications (Figure 5A). Among them, the “translation, ribosomal structure, and biogenesis” category was assigned the most proteins, which were 2311 (17.36%), 1987 (18.74%), and 1898(18.67%) om Days 20, 40, and 60, respectively. They were followed by 1206 (9.06%, Day 20) 895 (8.44%, Day 40), and 907 (8.92%, Day 60) proteins, which were enriched in the “transport and metabolism” category. Furthermore, the “amino acid transport and metabolism” category was related to proteins that decreased from 1318 (9.90%, Day 20) to 804 (7.58%, Day 40) to 634 (6.24%, Day 60). The other categories accounted for a relatively small proportion. The function annotation of identified proteins in nine DBSC samples was performed using KEGG. Top-10 KOs (K03286, K04077, K02406, K03671, K02358, K04043, K03704, K02112, K02078, K02935) were shown in Figure 5B. By analyzing the homologous classification of proteins, the 10 proteins identified were involved in genetic information and environmental treatment pathways, which necessitates further exploration (Supplementary Material D).

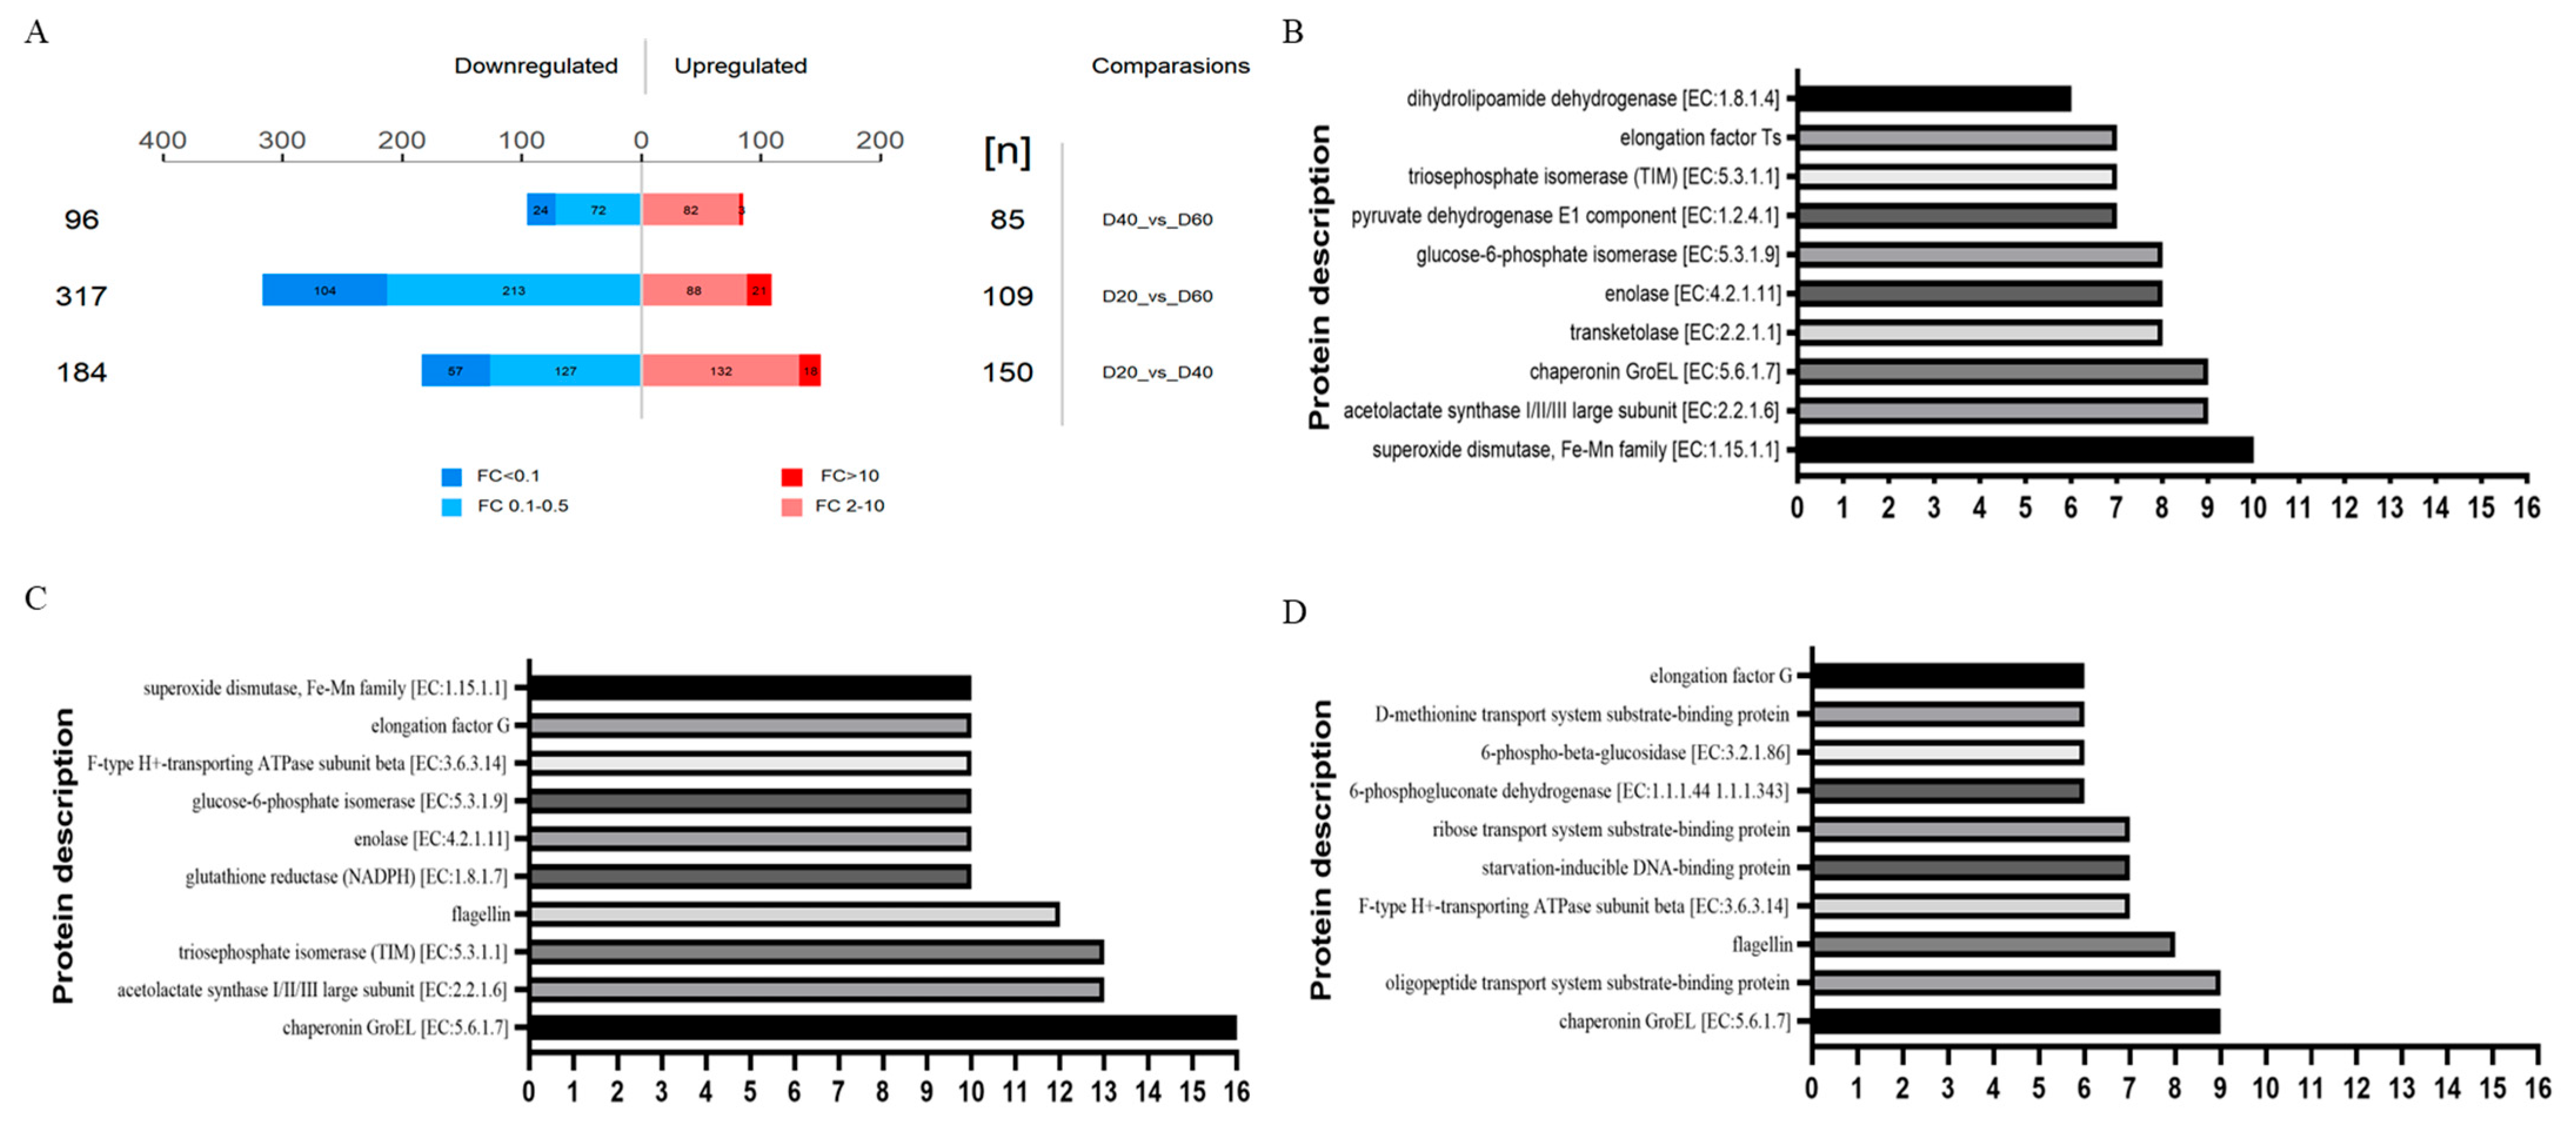
3.6. Overview and Analysis of Differential Proteins

Based on the standard (fold change >2 or <0.5 and p < 0.05 (t-test)), the numbers of significantly upregulated and downregulated proteins between different samples are shown in Figure 6A, of which by more than 10 times was marked with darker colors. The upregulated and downregulated DEPs were 150 and 184 in D20 versus D40, 109 and 317 in D20 versus D60, 85 and 96 in D40 versus 60, respectively. Furthermore, the top-10 DEPs of the three comparison groups were shown in Figure 6B–D. To engender insights into the functional and species information of these DEPs, the DEPs were classified to the KEGG and NR database (Table 2). Primary functional categories of the DEPs were associated mainly with carbohydrate metabolism, amino acid metabolism, signal transduction, and transcription and translation pathways. Specifically, the proteins (pgi, tpiA, bglA, gor, pdhD, aceE, gnd,) that were involved in the pathways of starch and sucrose metabolism (map00500), glycolysis/gluconeogenesis (map00010), galactose metabolism (map00051), pentose phosphate pathway (map00030), and so on, were mainly produced by Pediococcus, Pseudomonas, and Lactococcus. In addition, the proteins (SOD2, fusA, atpD, oppA, rbsB, groEL, Dps, fliC, tsf, metQ) related to signal transduction, transcription, and translation pathways were mainly secreted by Pediococcus, Pseudomonas, Weissella, Rahnella, and Serratia. Only pdhD, mainly produced by Lactobacillus and Carnobacterium, was mapped to glycine, serine, and threonine metabolism (map00260) pathways (Supplementary Material E).

4. Discussion

4.1. Microbial Community Composition

Spontaneous fermentations generally lead to distinctive, complicated, and well-balanced microbial communities [4]. Our results showed that protebacteria and firmicutes were the dominant phyla, which was consistent with previous reports [23,24]. Based on the metagenomic date, during DBSC spontaneous fermentation, there was a dramatic decrease in the phylum proteobacteria (from 52.31% to 89.24%) and an increase of firmicutes (from 52.31% to 89.24%). The microbial community structure mainly relies on the fermentation environment [25]. A decrease of pH can lead to the microbial community changing to enrich those bacteria with more acidic tolerance during fermentation [26]. In DBSC fermentation, lactobacillaceae are considered as efficient fermenters, which are proficient in metalizing carbohydrates to generate a range of organic acids under anaerobic or limited oxygen conditions [27]. Moreover, lactobacillaceae have the ability to survive in self-imposed acid stress, which explains how lactobacillaceae abounded in the late stage of fermentation [28].
Furthermore, Leuconostoc spp. is a gram-positive, non-sporulating, non-gelatin liquifying and microaerophilic lactic acid bacteria, which is also considered as a strong food fermentation starter [29]. Leuconostoc can ferment glucose into lactic acid, carbon dioxide, and acetic acid and ethanol [30]. Zabat et al. showed that the initial proliferation of Leuconostoc rapidly produced carbon dioxide and acid, which quickly lowered the environmental pH, inhibiting the growth of undesirable microorganisms that might cause food spoilage while preserving the color of the cabbage, as well as favoring the succession of other LABs [31]. This agrees with our results that Leuconostoc was identified as the main species on Day 20 of DBSC fermentation. As a species of Leuconostoc, Leuconotoc mesenteroides can ferment fructose into mannitol, which are frequently used as sweeteners and thickeners in food sectors and is tolerant during osmotic stress [32]. And Leuconotoc mesenteroides can also utilize other sugars (pentose, arabinose, and xylose), which contributes to the development of complex and unique flavor characteristics [30].
It is worth noting that Pediococcus suddenly turned into the dominant genera in the later period of DBSC fermentation. This result was inconsistent with other reports that Lactobacillus was generally considered the predominant bacterial genus, while Pediococcus plays an unimportant role in DBSC samples [23,33]. Tlais et al. have suggested that lactobacilli and Pediococcus all have high metabolic potential for phenolics bioconversion in DBSC fermentation [34]. Additionally, Pediococcus could consume glucose and fructose as the main fermentable sugars to produce lactic acid and acetic acid, which compose the main organic acid of DBSC [35]. Therefore, we suggest that Pediococcus and Lactobacillus may have similar functions in the fermentation process. Interestingly, as the member of Pediococcus, P. parvulus has been reported as a novel key player during Xuanwei Ham fermentation, including the secretion of acid, expedition of the growth of LAB, and the consumption of sugar [36]. This indicates that the function of the Pediococcus genus has always been neglected, which may have an important influence on the flavor formation in the later period of DBSC fermentation.
According to the metaproteomic results, at the level of phylum, ascomycota was the only fungi among the dominant phylum, which may be due to ascomycota fungi adapting well to saprobic, parasitic, or mutualistic life modes [37]. However, it is a pity that prior studies have focused primarily on bacterium that limited knowledge of the fungi role in the fermentation of fermented vegetables, which should be paid more attention in the future [38].
Pseudomonas is a common genus in food, which can be isolated from plant surfaces, soil, water, and raw materials and may be frequently introduced into the processing environment through many routes [39]. Pseudomonas form biofilms at low (4 and 10 °C) temperatures, which is a survival mechanism that can allow bacteria to withstand the external stresses, but Pseudomonas growth is limited in acidic and high-salt environments [40]. Previous studies have considered that Pseudomonas is the important genus for the spoilage of food, which can produce large amounts of extracellular enzymes and degraded foods, resulting in off-flavors and off-tasting foods [41,42]. Pseudomonas has a strong ability of producing proteases and possesses genes for carbohydrate transport and metabolism, signal transduction, secondary metabolite synthesis, polysaccharide lyase, and carbohydrate esterases [43,44]. In the study, a high abundance of Pseudomonas was observed during the first 40 days, while the abundance gradually decreased due to the anaerobic acidic environment.
Weissella are facultatively anaerobic chemoorganotrophs with an obligately fermentative metabolism that has characteristics for fermenting glucose heterofermentative via the hexose-monophosphate and phosphoketolase pathways that can produce lactic acid [45]. In our work, Weissella were initially assigned to the most proteins, which consisted with reports from Yang et al. [26]. Weissella have been isolated from and occur in a wide range of habitats, such as European sourdoughs and African traditional fermented foods. So, Weissella play a perceived technical role in such traditional food fermentation.
Metagenomic and metaproteomic investigations of main microbial had no significant divergence, which included Pseudomonas, Weissella, Pediococcus, and Leuconostoc. Meanwhile, the content of the same phylum or genus was different in the two quantification strategies. It is reasonable that taxonomic abundances based on metagenomics and metaproteomics are different since there are divergences between genetic potential and expressed functional activity [46]. In some cases, the proportion of gene species is not equal to functional microorganisms [47]. The reliability of the results was greatly improved by combining two methods to verify each other.

4.2. Biological Function Analysis

Remarks: The box with a red background denotes an upregulated protein, the box with a green background denotes downregulated proteins, and the box with a yellow background denotes the presence of numerous proteins that are both upregulated and downregulated. Large squares stand in for other pathways, while light-green bottom boxes represent species-specific proteins and light-purple bottom boxes indicate small molecular metabolites.
Functional quantification is increasingly recognized as the essential link between biodiversity patterns and ecosystem functioning [48]. Overall, during DBSC fermentation, a large amount of proteins (enzymes) were involved in life activities, such as DNA replication, RNA transcription and protein synthesis, cellular activities, intracellular and intercellular communication, energy metabolism, and activities related to the metabolism of substances (carbohydrates, amino acids). In particular, proteins (fusA, atpD, oppA, rbsB groEL, Dps, fliC, tsf, metQ) related to basic life activities were the most abundant and produced by a variety of bacteria, such as Pseudomonas, Weissella, Pediococcus, and Leuconostoc. These results suggested that microorganisms constantly metabolize and reproduce, communicate with the surrounding environment, and produce stress reactions in the DBSC fermentation process. In addition, four co-occurrence-enriched metabolic pathways were explored, including glycolysis/gluconeogenesis [PATH: ko00010], pyruvate metabolism [PATH: ko00620], fructose and mannose metabolism [path: Ko00051], glycine, and serine and threonine metabolism [path: Ko00260].
The glycolysis/gluconeogenesis pathway is the process of converting glucose into pyruvate and generating small amounts of ATP and NADH, and it is also a central pathway that produces important precursor metabolites [49]. As shown in Figure 7A, the glycolysis/gluconeogenesis pathway includes glycolysis (glucose => pyruvate), gluconeogenesis (oxaloacetate => fructose-6P), pyruvate oxidation (pyruvate => acetyl-CoA), and the pathway modules. Additionally, the enzymes (glucose-6-phosphate isomerase [EC:5.3.1.9], triosephosphate isomerase [TIM] [EC:5.3.1.1], 6-phospho-beta-glucosidase [EC:3.2.1.86], dihydrolipoyl dehydrogenase [EC:1.8.1.4], and pyruvate dehydrogenase E1 component [EC:1.2.4.1]) involved in glycolysis/gluconeogenesis pathways are presented in Figure 7A (marked with red circles), which mostly belonged to Leuconostoc, Serratia, and Pediococcus. Generally speaking, the microorganisms present in the raw material undergo homofermentation or heterofermentation, with the formation of various products in DBSC. Sauerkraut undergoes a sequential fermentation that is initiated by heterofermentative lactic acid bacteria and completed by homofermentative bacteria [50]. Our results showed that the glycolysis/gluconeogenesis pathway had similar metabolic levels at Days 20, 40, and 60 during DBSC fermentation, which was likely due to the fact that Leuconostoc dominated heterofermentation in the first 20 days, and Serratia played a vital role in metaphase, as well as Pediococcus-dominated homofermentation in the later stage [51,52]. This result indicated that the three genera contributed to carbohydrate degradation to generate flavor in DBSC. Pyruvate metabolism (pathway 00620) plays an important pivotal role in the metabolic linkage under the presence of dihydrolipoamide dehydrogenase [EC: 1.8.1.4] and pyruvate dehydrogenase [EC: 1.2.4.1] (Figure 7B). Pyruvate metabolism is usually an important intermediate process in the carbohydrate metabolic pathways and the formation of various amino carbon skeletons, mainly from the carbohydrate metabolism [53]. In DBSC fermentation, pyruvate was converted primarily to lactic acid [54]. Although lactic acids are odorless and do not directly contribute to the flavor of fermented products, they are responsible for cider–vinegar flavor, ethyl lactate, ethyl acetate, and so on [50].
Besides glucose, the hexoses fructose and mannose were also metabolized sugar [55]. Carbohydrate transportation, particularly fructose and mannose metabolism, was identified in traditional Chinese sauerkraut [56]. As shown in Figure 8A, fructose and mannose metabolism were associated with the production of ascorbic, suggesting the metabolic pathway has a certain effect in the nutritional and flavor substances of DBSC. Moreover, amino contributes to the formation of organoleptic features of fermented products [50]. Other than taste characteristics of themselves, amino acids also metabolize organic acids, aldehydes, ketones, esters, and other products, which have a certain contribution to the color and aroma of fermentation product [21]. Figure 8B shows the glycine, gerine, and threonine metabolism pathway, which included threonine biosynthesis (aspartate => homoserine => threonine), serine biosynthesis (glycerate-3P => serine), ectoine biosynthesis (aspartate => ectoine), creatine pathway, cysteine biosynthesis (homocysteine + serine => cysteine), cetaine biosynthesis (choline => betaine), clycine cleavage system, cctoine-degradation (ectoine => aspartate) pathway modules, and other related metabolisms of alanine, aspartate, glutamate, cysteine, and methionine. Serine has a sweet taste and can be converted to acetic acid by deamidation reaction [57]. Amino acid can be converted to aldehydes, carboxylic acid, and alcohols, while aldehydes are subjected to further conversions into alcohols by dehydrogenation or into carboxylic acids by hydrogenation, which constitutes the formation of flavor [58]. Alanine can provide sweetness, and aminobutyric acid is an amino acid derivative generated by the decarboxylation of glutamic acid [59]. Methionine and cysteine are responsible for the formation of methanethiol, sulfides, thioesters, and other sulfur-containing volatile compounds, which are mainly accountable to the aroma of Brassica vegetables [60]. Therefore, glycine, serine and threonine metabolism improve the flavor quality and nutritional value of DBSC.

5. Conclusions

In this study, metagenomic and metaproteomic approaches were jointly used to reveal the microbiological composition and protein profile and associated metabolic pathways of DBSC at different fermentation times. The bacterial communities were primarily dominated by firmicutes and proteobacteria in the phylum level and Pseudomonas, Weissella, Pediococcus, and Leuconostoc in the genus. In addition, functional metagenomic and metaproteomic profiling indicated that glycolysis/gluconeogenesis [path: ko00010], pyruvate metabolism [path: ko00620], fructose and mannose metabolism [path: Ko00051], and glycine, serine, and threonine metabolism [path: Ko00260] pathways were enriched. Moreover, critical proteins (oppA, rbsB, SOD2, groEL, dps, fliC, tsf, fusA, atpD, metQ, pgi, tpiA, eno, alaS, bglA, tktA, gor, pdhD, aceE, gnd) related to metabolic pathways were identified.
This study provides an important insight into the microbial community structure and metabolic mechanism of DBSC, which provides a theoretical support for the DBSC fermentation industry.

Supplementary Materials

The following supporting information can be downloaded at: https://www.mdpi.com/article/10.3390/fermentation10040185/s1.

Author Contributions

Conceptualization: Y.Z., X.X. (Xiangxiu Xu), X.X. (Xiaowei Xiao), T.Z., M.L.; Methodology: Y.Z., Y.Y., N.G., L.Z., C.Z. and Z.W.; Software: Y.Z; Validation: Y.Z.; Data curation: Y.Z.; Writing—original draft: Y.Z.; Writing—review& editing: H.Y. (Haiqing Ye); Visualization: H.Y. (Haiqing Ye); Supervision: H.Y. (Haiyang Ya); Project administration: H.Y. (Haiqing Ye); Funding acquisition: H.Y. (Haiqing Ye). All authors have read and agreed to the published version of the manuscript.

Funding

This work was supported by the National Natural Science Foundation of China [grant numbers 32372451].

Institutional Review Board Statement

Not applicable.

Informed Consent Statement

Not applicable.

Data Availability Statement

Data are contained within the article.

Conflicts of Interest

The authors declare no conflict of interest.

References

  1. Ye, H.Q.; Lang, X.S.; Ji, Y.Y.; Li, S.N.; Xin, N.C.; Meng, X.R.; Zhang, T.H.; Shen, X.; Zhao, C.H. The interaction between Lactobacillus plantarum SC-5 and its biogenic amine formation with different salt concentrations in Chinese Dongbei Suancai. Food Res. Int. 2021, 150, 110813. [Google Scholar] [CrossRef] [PubMed]
  2. Jagannath, A.; Raju, P.S.; Bawa, A.S. A Two-Step Controlled Lactic Fermentation of Cabbage for Improved Chemical and Microbiological Qualities. J. Food Qual. 2012, 35, 13–20. [Google Scholar] [CrossRef]
  3. Beganovic, J.; Kos, B.; Pavunc, A.L.; Uroic, K.; Jokic, M.; Suskovic, J. Traditionally produced sauerkraut as source of autochthonous functional starter cultures. Microbiol. Res. 2014, 169, 623–632. [Google Scholar] [CrossRef] [PubMed]
  4. Xiao, M.; Huang, T.; Huang, C.; Hardie, J.; Peng, Z.; Xie, M.; Xiong, T. The microbial communities and flavour compounds of Jiangxi yancai, Sichuan paocai and Dongbei suancai: Three major types of traditional Chinese fermented vegetables. Lwt-Food Sci. Technol. 2020, 121, 108865. [Google Scholar] [CrossRef]
  5. Yang, X.; Hu, W.; Xiu, Z.; Jiang, A.; Yang, X.; Saren, G.; Ji, Y.; Guan, Y.; Feng, K. Effect of salt concentration on microbial communities, physicochemical properties and metabolite profile during spontaneous fermentation of Chinese northeast sauerkraut. J. Appl. Microbiol. 2020, 129, 1458–1471. [Google Scholar] [CrossRef] [PubMed]
  6. Xie, M.X.; An, F.Y.; Wu, J.R.; Liu, Y.M.; Shi, H.S.; Wu, R.N. Meta-omics reveal microbial assortments and key enzymes in bean sauce mash, a traditional fermented soybean product. J. Sci. Food Agric. 2019, 99, 6522–6534. [Google Scholar] [CrossRef]
  7. Srinivas, M.; O’Sullivan, O.; Cotter, P.D.; van Sinderen, D.; Kenny, J.G. The Application of Metagenomics to Study Microbial Communities and Develop Desirable Traits in Fermented Foods. Foods 2022, 11, 3297. [Google Scholar] [CrossRef]
  8. Okeke, E.S.; Ita, R.E.; Egong, E.J.; Udofia, L.E.; Mgbechidinma, C.L.; Akan, O.D. Metaproteomics insights into fermented fish and vegetable products and associated microbes. Food Chem. Mol. Sci. 2021, 3, 100045. [Google Scholar] [CrossRef] [PubMed]
  9. Aguiar-Pulido, V.; Huang, W.; Suarez-Ulloa, V.; Cickovski, T.; Mathee, K.; Narasimhan, G. Metagenomics, Metatranscriptomics, and Metabolomics Approaches for Microbiome Analysis. Evol. Bioinform. 2016, 12, 5–16. [Google Scholar] [CrossRef]
  10. Athanasopoulou, K.; Boti, M.A.; Adamopoulos, P.G.; Skourou, P.C.; Scorilas, A. Third-Generation Sequencing: The Spearhead towards the Radical Transformation of Modern Genomics. Life 2022, 12, 30. [Google Scholar] [CrossRef]
  11. Zhou, Z.; Tran, P.Q.; Breister, A.M.; Liu, Y.; Kieft, K.; Cowley, E.S.; Karaoz, U.; Anantharaman, K. METABOLIC: High-throughput profiling of microbial genomes for functional traits, metabolism, biogeochemistry, and community-scale functional networks. Microbiome 2022, 10, 33. [Google Scholar] [CrossRef] [PubMed]
  12. Jansson, J.K.; Hofmockel, K.S. The soil microbiome-from metagenomics to metaphenomics. Curr. Opin. Microbiol. 2018, 43, 162–168. [Google Scholar] [CrossRef] [PubMed]
  13. Zhuang, S.; Tan, Y.; Hong, H.; Li, D.; Zhang, L.; Luo, Y. Exploration of the roles of spoilage bacteria in degrading grass carp proteins during chilled storage: A combined metagenomic and metabolomic approach. Food Res. Int. 2022, 152, 110926. [Google Scholar] [CrossRef] [PubMed]
  14. Schneider, T.; Schmid, E.; de Castro, J.V.; Cardinale, M.; Eberl, L.; Grube, M.; Berg, G.; Riedel, K. Structure and function of the symbiosis partners of the lung lichen (Lobaria pulmonaria L. Hoffm.) analyzed by metaproteomics. Proteomics 2011, 11, 2752–2756. [Google Scholar] [CrossRef] [PubMed]
  15. Riffle, M.; May, D.H.; Timmins-Schiffman, E.; Mikan, M.P.; Jaschob, D.; Noble, W.S.; Nunn, B.L. MetaGOmics: A Web-Based Tool for Peptide-Centric Functional and Taxonomic Analysis of Metaproteomics Data. Proteomes 2018, 6, 2. [Google Scholar] [CrossRef] [PubMed]
  16. Bahule, C.E.; da Silva Martins, L.H.; Mussengue Chauque, B.J.; Lopes, A.S. Metaproteomics as a tool to optimize the maize fermentation process. Trends Food Sci. Technol. 2022, 129, 258–265. [Google Scholar] [CrossRef]
  17. Xia, Y.; Zhu, M.; Du, Y.K.; Wu, Z.Y.; Gomi, K.; Zhang, W.X. Metaproteomics reveals protein composition of multiple saccharifying enzymes in nongxiangxing daqu and jiangxiangxing daqu under different thermophilic temperatures. Int. J. Food Sci. Technol. 2022, 57, 5102–5113. [Google Scholar] [CrossRef]
  18. Muth, T.; Renard, B.Y.; Martens, L. Metaproteomic data analysis at a glance: Advances in computational microbial community proteomics. Expert Rev. Proteom. 2016, 13, 757–769. [Google Scholar] [CrossRef] [PubMed]
  19. Miura, N.; Okuda, S. Current progress and critical challenges to overcome in the bioinformatics of mass spectrometry-based metaproteomics. Comput. Struct. Biotechnol. J. 2023, 21, 1140–1150. [Google Scholar] [CrossRef]
  20. Wu, F.; Ding, X.; Zhang, Y.; Gu, J.-D.; Liu, X.; Guo, Q.; Li, J.; Feng, H. Metagenomic and metaproteomic insights into the microbiome and the key geobiochemical potentials on the sandstone of rock-hewn Beishiku Temple in Northwest China. Sci. Total Environ. 2023, 893, 164616. [Google Scholar] [CrossRef]
  21. Xie, M.; Wu, J.; An, F.; Yue, X.; Tao, D.; Wu, R.; Lee, Y. An integrated metagenomic/metaproteomic investigation of microbiota in dajiang-meju, a traditional fermented soybean product in Northeast China. Food Res. Int. 2019, 115, 414–424. [Google Scholar] [CrossRef]
  22. Liu, D.; Zhang, C.; Zhang, J.; Xin, X.; Liao, X. Metagenomics reveals the formation mechanism of flavor metabolites during the spontaneous fermentation of potherb mustard (Brassica juncea var. multiceps). Food Res. Int. 2021, 148, 110622. [Google Scholar] [CrossRef]
  23. He, J.; Li, F.; Wang, Y.; Wu, H.; Yang, H. Fermentation characteristics and bacterial dynamics during Chinese sauerkraut fermentation by Lactobacillus curvatus LC-20 under varied salt concentrations reveal its potential in low-salt suan cai production. J. Biosci. Bioeng. 2021, 132, 33–40. [Google Scholar] [CrossRef] [PubMed]
  24. Liu, Z.G.; Li, J.Y.; Wei, B.L.; Huang, T.; Xiao, Y.S.; Peng, Z.; Xie, M.Y.; Xiong, T. Bacterial community and composition in Jiang-shui and Suan-cai revealed by high-throughput sequencing of 16S rRNA. Int. J. Food Microbiol. 2019, 306, 108271. [Google Scholar] [CrossRef]
  25. Li, Q.; Kang, J.; Ma, Z.; Li, X.; Liu, L.; Hu, X. Microbial succession and metabolite changes during traditional serofluid dish fermentation. Lwt-Food Sci. Technol. 2017, 84, 771–779. [Google Scholar] [CrossRef]
  26. Yang, X.; Hu, W.; Xiu, Z.; Jiang, A.; Yang, X.; Saren, G.; Ji, Y.; Guan, Y.; Feng, K. Microbial Community Dynamics and Metabolome Changes During Spontaneous Fermentation of Northeast Sauerkraut From Different Households. Front. Microbiol. 2020, 11, 1878. [Google Scholar] [CrossRef] [PubMed]
  27. Li, Z.; Xie, S.; Sun, B.; Zhang, Y.; Liu, K.; Liu, L. Effect of KCl replacement of NaCl on fermentation kinetics, organic acids and sensory quality of sauerkraut from Northeast China. J. Food Process. Preserv. 2022, 46, e16622. [Google Scholar] [CrossRef]
  28. Suissa, R.; Oved, R.; Maan, H.; Hadad, U.; Gilhar, O.; Meijler, M.M.; Koren, O.; Kolodkin-Gal, I. Context-dependent differences in the functional responses of Lactobacillaceae strains to fermentable sugars. Front. Microbiol. 2022, 13, 949932. [Google Scholar] [CrossRef]
  29. Kim, E.; Yang, S.-M.; Kim, I.-S.; Lee, S.-Y.; Kim, H.-Y. Identification of Leuconostoc species based on novel marker genes identified using real-time PCR via computational pangenome analysis. Front. Microbiol. 2022, 13, 1014872. [Google Scholar] [CrossRef]
  30. Yang, X.; Hu, W.; Xiu, Z.; Jiang, A.; Yang, X.; Sarengaowa; Ji, Y.; Guan, Y.; Feng, K. Microbial dynamics and volatilome profiles during the fermentation of Chinese northeast sauerkraut by Leuconostoc mesenteroides ORC 2 and Lactobacillus plantarum HBUAS 51041 under different salt concentrations. Food Res. Int. 2020, 130, 108926. [Google Scholar] [CrossRef]
  31. Zabat, M.A.; Sano, W.H.; Wurster, J.I.; Cabral, D.J.; Belenky, P. Microbial Community Analysis of Sauerkraut Fermentation Reveals a Stable and Rapidly Established Community. Foods 2018, 7, 77. [Google Scholar] [CrossRef] [PubMed]
  32. Alexzman, Z.A.; Ibrahim, M.L.; Annuar, N.H.R. A short review on catalytic hydrogenation of fructose into mannitol. J. Chem. Technol. Biotechnol. 2023, 98, 2618–2626. [Google Scholar] [CrossRef]
  33. Zhang, S.; Zhang, Y.; Wu, L.; Zhang, L.; Wang, S. Characterization of microbiota of naturally fermented sauerkraut by high-throughput sequencing. Food Sci. Biotechnol. 2023, 32, 855–862. [Google Scholar] [CrossRef] [PubMed]
  34. Tlais, A.Z.A.; Lemos, W.J.F., Jr.; Filannino, P.; Campanaro, S.; Gobbetti, M.; Di Cagno, R. How Microbiome Composition Correlates with Biochemical Changes during Sauerkraut Fermentation: A Focus on Neglected Bacterial Players and Functionalities. Microbiol. Spectr. 2022, 10, e00168-22. [Google Scholar] [CrossRef] [PubMed]
  35. Liu, L.; She, X.; Chen, X.; Qian, Y.; Tao, Y.; Li, Y.; Guo, S.; Xiang, W.; Liu, G.; Rao, Y. Microbiota Succession and Chemical Composition Involved in the Radish Fermentation Process in Different Containers. Front. Microbiol. 2020, 11, 502490. [Google Scholar] [CrossRef] [PubMed]
  36. Li, P.; Shen, Q.; Liu, Z.; Fu, P.; Zhou, W. A newly isolated strain Pediococcus parvulus from Xuanwei ham, a traditional Chinese fermented meat product. Int. J. Food Sci. Technol. 2008, 43, 1387–1394. [Google Scholar] [CrossRef]
  37. Maharachchikumbura, S.S.N.; Chen, Y.P.; Ariyawansa, H.A.; Hyde, K.D.; Haelewaters, D.; Perera, R.H.; Samarakoon, M.C.; Wanasinghe, D.N.; Bustamante, D.E.; Liu, J.K.; et al. Integrative approaches for species delimitation in Ascomycota. Fungal Divers. 2021, 109, 155–179. [Google Scholar] [CrossRef]
  38. Barrangou, R.; Yoon, S.S.; Breidt, F.; Fleming, H.P.; Klaenhammer, T.R. Identification and characterization of Leuconostoc fallax strains isolated from an industrial sauerkraut fermentation. Appl. Environ. Microbiol. 2002, 68, 2877–2884. [Google Scholar] [CrossRef] [PubMed]
  39. Maske, B.L.; Pereira, G.V.d.M.; Neto, D.P.d.C.; Lindner, J.d.D.; Letti, L.A.J.; Pagnoncelli, M.G.; Soccol, C.R. Presence and persistence of Pseudomonas sp. during Caspian Sea-style spontaneous milk fermentation highlights the importance of safety and regulatory concerns for traditional and ethnic foods. Food Sci. Technol. 2021, 41, 273–283. [Google Scholar] [CrossRef]
  40. Rawls, K.D.M. Organizational Readiness, Resistance and Race: Examining Faculty Attitudes toward Faculty Diversification in Higher Education. Ph.D. Thesis, Claremont Graduate University, Claremont, CA, USA, 2020. [Google Scholar]
  41. Wang, D.; Cui, F.; Ren, L.; Tan, X.; Lv, X.; Li, Q.; Li, J.; Li, T. Complete Genome Analysis Reveals the Quorum Sensing-Related Spoilage Potential of Pseudomonas fluorescens PF08, a Specific Spoilage Organism of Turbot (Scophthalmus maximus). Front. Microbiol. 2022, 13, 856802. [Google Scholar] [CrossRef]
  42. Parlapani, F.F.; Anagnostopoulos, D.A.; Karamani, E.; Mallouchos, A.; Haroutounian, S.A.; Boziaris, I.S. Growth and Volatile Organic Compound Production of Pseudomonas Fish Spoiler Strains on Fish Juice Agar Model Substrate at Different Temperatures. Microorganisms 2023, 11, 189. [Google Scholar] [CrossRef]
  43. Cleto, S.; Matos, S.; Kluskens, L.; Vieira, M.J. Characterization of Contaminants from a Sanitized Milk Processing Plant. PLoS ONE 2012, 7, e40189. [Google Scholar] [CrossRef]
  44. Du, B.; Lu, M.; Liu, H.; Wu, H.; Zheng, N.; Zhang, Y.; Zhao, S.; Zhao, Y.; Gao, T.; Wang, J. Pseudomonas isolates from raw milk with high level proteolytic activity display reduced carbon substrate utilization and higher levels of antibiotic resistance. Lwt-Food Sci. Technol. 2023, 181, 114766. [Google Scholar] [CrossRef]
  45. Fusco, V.; Quero, G.M.; Cho, G.-S.; Kabisch, J.; Meske, D.; Neve, H.; Bockelmann, W.; Franz, C.M.A.P. The genus Weissella: Taxonomy, ecology and biotechnological potential. Front. Microbiol. 2015, 6, 130276. [Google Scholar] [CrossRef] [PubMed]
  46. Zhao, J.; Yang, Y.; Chen, L.; Zheng, J.; Lv, X.; Li, D.; Fang, Z.; Shen, C.; Mallawaarachchi, V.; Lin, Y.; et al. Quantitative metaproteomics reveals composition and metabolism characteristics of microbial communities in Chinese liquor fermentation starters. Front. Microbiol. 2023, 13, 1098268. [Google Scholar] [CrossRef]
  47. Lohmann, P.; Schäpe, S.S.; Haange, S.B.; Oliphant, K.; Allen-Vercoe, E.; Jehmlich, N.; Von Bergen, M. Function is what counts: How microbial community complexity affects species, proteome and pathway coverage in metaproteomics. Expert Rev. Proteom. 2020, 17, 163–173. [Google Scholar] [CrossRef]
  48. Escalas, A.; Hale, L.; Voordeckers, J.W.; Yang, Y.; Firestone, M.K.; Alvarez-Cohen, L.; Zhou, J. Microbial functional diversity: From concepts to applications. Ecol. Evol. 2019, 9, 12000–12016. [Google Scholar] [CrossRef] [PubMed]
  49. Bezerra do Ó, I.J.; Rego, T.G.; Jose, M.V.; de Farias, S.T. The structural proteome for the primordial glycolysis/gluconeogenesis. Genet. Mol. Res. 2020, 19, gmr18699. [Google Scholar] [CrossRef]
  50. Wieczorek, M.N.; Drabinska, N. Flavour Generation during Lactic Acid Fermentation of Brassica Vegetables-Literature Review. Appl. Sci. 2022, 12, 5598. [Google Scholar] [CrossRef]
  51. Moon, S.H.; Kim, C.R.; Chang, H.C. Heterofermentative lactic acid bacteria as a starter culture to control kimchi fermentation. Lwt-Food Sci. Technol. 2018, 88, 181–188. [Google Scholar] [CrossRef]
  52. Blajman, J.E.; Vinderola, G.; Paez, R.B.; Signorini, M.L. The role of homofermentative and heterofermentative lactic acid bacteria for alfalfa silage: A meta-analysis. J. Agric. Sci. 2020, 158, 107–118. [Google Scholar] [CrossRef]
  53. Wang, Y.; Wu, Y.; Li, C.; Zhao, Y.; Xiang, H.; Li, L.; Yang, X.; Chen, S.; Sun, L.; Qi, B. Genome-Resolved Metaproteomic Analysis of Microbiota and Metabolic Pathways Involved in Taste Formation during Chinese Traditional Fish Sauce (Yu-lu) Fermentation. Front. Nutr. 2022, 9, 851895. [Google Scholar] [CrossRef] [PubMed]
  54. Liu, S.Q. Practical implications of lactate and pyruvate metabolism by lactic acid bacteria in food and beverage fermentations. Int. J. Food Microbiol. 2003, 83, 115–131. [Google Scholar] [CrossRef] [PubMed]
  55. Dynesen, J.; Smits, H.P.; Olsson, L.; Nielsen, J. Carbon catabolite repression of invertase during batch cultivations of Saccharomyces cerevisiae: The role of glucose, fructose, and mannose. Appl. Microbiol. Biotechnol. 1998, 50, 579–582. [Google Scholar] [CrossRef] [PubMed]
  56. Huang, T.; Xiong, T.; Peng, Z.; Xiao, Y.-S.; Liu, Z.-G.; Hu, M.; Xie, M.-Y. Genomic analysis revealed adaptive mechanism to plant-related fermentation of Lactobacillus plantarum NCU116 and Lactobacillus spp. Genomics 2020, 112, 703–711. [Google Scholar] [CrossRef] [PubMed]
  57. Liu, Y.; Chen, X.; Li, F.; Shi, H.; He, M.; Ge, J.; Ling, H.; Cheng, K. Analysis of Microbial Diversity and Metabolites in Sauerkraut Products with and without Microorganism Addition. Foods 2023, 12, 1164. [Google Scholar] [CrossRef] [PubMed]
  58. Smit, G.; Smit, B.A.; Engels, W.J.M. Flavour formation by lactic acid bacteria and biochemical flavour profiling of cheese products. Fems Microbiol. Rev. 2005, 29, 591–610. [Google Scholar] [CrossRef] [PubMed]
  59. Yang, X.Z.; Hu, W.Z.; Xiu, Z.L.; Jiang, A.L.; Yang, X.Y.; Sarengaowa; Ji, Y.R.; Guan, Y.G.; Feng, K. Comparison of northeast sauerkraut fermentation between single lactic acid bacteria strains and traditional fermentation. Food Res. Int. 2020, 137, 109553. [Google Scholar] [CrossRef]
  60. Cartea, M.E.; Francisco, M.; Soengas, P.; Velasco, P. Phenolic Compounds in Brassica Vegetables. Molecules 2011, 16, 251–280. [Google Scholar] [CrossRef]
Figure 1. Schematic overview of the application of metagenomics and metaproteomics for the study of the DBSC.
Fermentation 10 00185 g001
Figure 2. Genomics-based taxonomic profiles: relative abundance (percentage) of microbes at the phylum (A), family (B), genus (C), and species (D) level during DBSC fermentation. The abscissa (20, 40, 60) represented fermentation time (day). Metagenomic sequences were compared against the NCBI-nr database. Overall, 92 phyla, 561 families, 1658 genera, and 7198 species were recovered and identified (Supplementary Material A). The top-20 relative abundance of phylum, family, genera, and species that dominated at each fermentation time point are shown in Figure 2.
Fermentation 10 00185 g002
Figure 3. Function classification of predicted genes: relative abundance (percentage) of function classification COG (A) and KEGG (B) during DBSC fermentation.
Fermentation 10 00185 g003
Figure 4. Protein-based taxonomic profiles: relative abundance (percentage) of microbial at the phylum (A) and genus (B) level during DBSC fermentation. The abscissa (20, 40, 60) represented fermentation time (day).
Fermentation 10 00185 g004
Figure 5. Function classification of proteins: relative abundance (percentage) of function classification COG (A) and Top-10 KEGG KO (B) during DBSC fermentation. Different colors represent different fermentation times (20, 40, 60). Remark: (1) TC.OOP; OmpA−OmpF porin, OOP family (K03286), (2) groEL, HSPD1; chaperonin GroEL (K04077), (3) fliC; flagellin (K02406), (4) trxA; thioredoxin 1 (K03671), (5) tuf, TUFM; elongation factor Tu (K02358), (6) dnaK, HSPA9; molecular chaperone DnaK(K04043), (7) cspA; cold-shock protein (beta−ribbon, CspA family (K03704), (8) TPF1B, atpD; F−type H+−transporting ATPase subunit beta [EC:3.6.3.14] (K02112), (9) acpP; acyl carrier protein (K02078), (10) RP−L7, MRPL12, rplL; large subunit ribosomal protein L7/L12 (K02935).
Fermentation 10 00185 g005
Figure 6. Differential proteins (DEP) analysis: the differential of protein number between three time points (A), KEGG classification statistics of D20 VS D40 (B), D20 VSd60 (C), and D40 VS d60 (D) differen-tial proteins. Remark: oligopeptide transport system substrate-binding protein (oppA, mppA); ribose transport system substrate-binding protein (rbsB); superoxide dismutase, Fe–Mn family [EC: 1.15.1.1] (SOD2); chaperonin GroEL [EC: 5.6.1.7] (groEL, HSPD1); starvation-inducible, DNA-binding protein (dps); flagellin (fliC); Elongation Factor Ts (tsf); Elongation Factor G (fusA); F-type H+-transporting ATPase subunit beta [EC: 3.6.3.14] (atpD); D-methionine transport system substrate-binding protein (metQ); glucose-6-phosphate isomerase [EC: 5.3.1.9] (pgi); triosephosphate isomerase (TIM) [EC: 5.3.1.1] (tpiA); enolase [EC: 4.2.1.11] (eno); acetolactate synthase I/II/III large subunit [EC: 2.2.1.6] (ilvB, ilvG, ilvI); 6-phosphovsbetavsglucosidase [EC: 3.2.1.86] (bglA); transketolase [EC: 2.2.1.1] (tktA, tktB); glutathione reductase (NADPH) [EC: 1.8.1.7] (gor); dihydrolipoamide dehydrogenase [EC: 1.8.1.4] (pdhD); pyruvate dehydrogenase E1 component [EC: 1.2.4.1] (aceE); 6-phosphogluconate dehydrogenase [EC: 1.1.1.44, 1.1.1.343] (gnd).
Fermentation 10 00185 g006
Figure 7. KEGG map of pathway: (A) glycolysis/gluconeogenesis (pathway 00010); (B) pyruvate metabolism (pathway 00620). Red circles represent the identified enzymes.
Fermentation 10 00185 g007
Figure 8. KEGG map of pathway: (A) Fructose and mannose metabolism (pathway 00051); (B) glycine, serine, and threonine metabolism (Pathway 00260). Red circles represent the identified enzymes.
Fermentation 10 00185 g008
Table 1. Statistics of sequencing and bioinformatics analysis.
EigenvalueData
Sequencing
Raw reads(num)699,857,802
Raw bases(bp)104,978,670,300
Q20(%)96.77
Q30(%)91.24
Filter reads(num)683,407,618
Filter bases(bp)101,969,988,159
Q20(%)97.09
Q30(%)91.64
Valid%97.18
Assembly
Contigs (>=1000 bp)77,054
Contigs (>=5000 bp)2302
Contigs (>=10,000 bp)651
Contigs (>=25,000 bp)158
Contigs (>=50,000 bp)35
Total length (>=25,000 bp)6,798,282
Total length (>=50,000 bp)2,736,588
Contigs241,723
Largest contig163,143
Total length262,961,360
GC (%)52.75
N501143
N75736
L5059,782
L75132,629
Annotation
ORFs NO.1,006,177
Integrity start165,987 (16.50%)
Integrity end307,836 (30.59%)
Integrity all445,458 (44.27%)
Integrity none86,896 (8.64%)
Total Length (bp)649.6
Average Length (bp)645.61
GC percent54.96%
Table 2. DEP metabolic pathways and species-statistics analysis.
DEPDEPperidKOKEGG PATHWAYMain Species
oppAD40vsD60K15580map01501, map02010, map02024Pediococcus
rbsBD40vsD60K10439map02010, map02030Pseudomonas
SOD2D20vsD40
D20vsD60
K04564map04013, map04068,
map04146, map04211,
map04212, map04213,
map05016
groELD20vsD40
D40vsD60
D20vsD60
K04077map03018, map04212,
map04940, map05134,
map05152
Xanthomonas
dpsD40vsD60 Serratia
fliCD40vsD60
D20vsD60
K02406map02020, map02040,
map04621, map04626, map05132, map05134
Pseudomonas
tsfD20vsD40K02357map03018Pseudomonas
fusAD40vsD60
D20vsD60
K02112 Pseudomonas
atpDD40vsD60
D20vsD60
K02112map00190, map00195,
map01100
Pseudomonas
metQD40vsD60K02073map02010Weissella
Rahnella
pgiD20vsD40
D20vsD60
K01810map00010, map00030,
map00500, map00520,
map01100, map01110,
map01120, map01130,
map01200
Serratia
Leuconostoc
tpiAD20vsD40
D20vsD60
K01803map00010, map00051,
map00562, map00710,
map01100, map01110,
map01120, map01130,
map01200, map01230
Serratia
Lactococcus
enoD20vsD40
D20vsD60
K01689map00010, map00680,
map01100, map01110,
map01120, map01130,
map01200, map01230,
map03018, map04066
Pseudomonas
Leuconostoc
alaSD20vsD40
D20vsD60
K01652map00290, map00650,
map00660, map00770,
map01100, map01110,
map01130, map01210,
map01230
Leuconostoc
Rahnella
bglAD40vsD60K01223map00010, map00500Pediococcus
tktA D20 vs D40K00615map00030, map00710,
map01051, map01100,
map01110, map01120,
map01130, map01200,
map01230
Serratia
Pseudomonas
gorD20 vs D60K00383map00480, map04918Pseudomonas
Serratia
pdhDD20vsD40K00382map00010, map00020,
map00260, map00280,
map00620, map00630,
map00640, map01100,
map01110, map01120,
map01130, map01200
Lactobacillus
Carnobacterium
aceED20vsD40K00163map00010, map00020,
map00620, map01100,
map01110, map01120,
map01130, map01200
Pseudomonas
gndD40vsD60K00033map00030, map00480,
map01100, map01110,
map01120, map01130,
map01200
Pseudomonas
Disclaimer/Publisher’s Note: The statements, opinions and data contained in all publications are solely those of the individual author(s) and contributor(s) and not of MDPI and/or the editor(s). MDPI and/or the editor(s) disclaim responsibility for any injury to people or property resulting from any ideas, methods, instructions or products referred to in the content.

