Article

Ethanol Production from a Mixture of Waste Tissue Paper and Food Waste through Saccharification and Mixed-Culture Fermentation

1
Department of Environmental Science and Engineering, University of Science and Technology Beijing, Beijing Key Laboratory of Resource-Oriented Treatment of Industrial Pollutants, Beijing 100083, China
2
Xinjiang Key Laboratory of Clean Conversion and High Value Utilization of Biomass Resources, School of Resource and Environmental Science, Yili Normal University, Yining 835000, China
3
Nanchang Institute of Science and Technology, Nanchang 330100, China
*
Author to whom correspondence should be addressed.
Fermentation 2024, 10(4), 194; https://doi.org/10.3390/fermentation10040194
Submission received: 2 February 2024 / Revised: 18 March 2024 / Accepted: 19 March 2024 / Published: 2 April 2024
(This article belongs to the Special Issue Anaerobic Digestion: Waste to Energy)

Abstract

:
This study focused on the co-fermentation of food waste and tissue paper to produce ethanol, which will eliminate the need for additional nitrogen sources and nutrients, thereby reducing production costs. In response to the inhibitory effect of the high concentrations of glucose present in mixed-substrate hydrolysates on xylose fermentation, a co-fermentation process using Saccharomyces cerevisiae and Candida shehatae was proposed. This approach reduced the fermentation time by 24 h, increased the xylose utilization rate to 88%, and improved the ethanol yield from 41% to 46.5%. The impact of external conditions and corresponding optimization were also analyzed in this process. The optimum conditions were a 1:3 ratio of Saccharomyces cerevisiae to Candida shehatae, a pH of 5, and shaking at 150 r/min, and by employing dynamic temperature control, the ethanol production was increased to 21.98 g/L. Compared to conventional processes that only use Saccharomyces cerevisiae, this method enhanced the ethanol yield from 41% to 49%.

1. Introduction

According to the International Energy Agency, the global energy demand increased by 4.6% in 2022. Relying solely on non-renewable resources such as coal and oil is far from sufficient to meet the energy needs of economic development. It is necessary to seek a sustainable alternative energy source that can meet the demand for chemicals and fuels, without affecting land use or causing additional carbon emissions [1]. Bioethanol is a sustainable alternative fuel that, if substituted for gasoline, can reduce greenhouse gas emissions [2]. In the United States, bioethanol is mainly produced from corn, while in Brazil, it is primarily made from sugarcane [3]. China is currently transitioning from first-generation to second-generation ethanol fuel, with the latter not being industrialized yet. The development of the ethanol grain fermentation industry poses risks to national food security. Since 2006, the Chinese government has restricted the use of corn for ethanol production [4]. Waste paper, as a cellulose-based waste that can be recycled multiple times, is theoretically recyclable 6–7 times, but on average is only recycled 2.4 times globally, resulting in enormous production volumes [5]. China alone produces over 90 million tons of waste paper annually. Waste tissue paper (WTP), a non-renewable form of waste paper, has undergone multiple processes and has an extremely low lignin content, consisting of 40–80% cellulose, 5–15% hemicellulose, and negligible lignin [6]. Compared to other lignocellulosic biomasses like agricultural residues, WTP has several advantages as a raw material for ethanol production: it does not require high-energy thermophysical pretreatment for enhanced enzymatic hydrolysis [7], as the pretreatment occurs during the paper-making process; there is an abundance of WTP at low costs [8]; and a well-established national supply chain already exists [9].
The fermentation of cellulose involves challenges such as the need to adjust the pH and add additional nutrients [10]. Typically, a buffering solution is added to regulate the pH. However, due to high costs, using buffering solutions for pH adjustment is not feasible for large-scale applications, necessitating the exploration of co-fermentation substrates to adjust fermentation conditions. After the implementation of waste classification policies in 2019, the amount of food waste (FW) separated has significantly increased. According to data released by the National Bureau of Statistics, the volume of FW processed in China in 2019 amounted to 242 million tons, which represents a significant quantity. In recent years, the growth rate of FW in China has exceeded 10%. However, a large portion of China’s FW is mainly disposed of through landfilling and incineration, leading to resource wastage and environmental pollution. Some studies have already demonstrated that co-fermentation of FW with other organic substrates can achieve a more stable fermentation performance [11]. FW, rich in carbohydrates and fermentation nutrients, has a relatively low pH [12]. It can serve as a nutrient source, an acidity regulator, and a substrate mixed with WTP for ethanol production.
Utilizing FW and WTP as co-fermentation substrates leads to the simultaneous presence of pentoses and hexoses in the mixture. More than a hundred microorganisms have been discovered that can metabolize both five-carbon sugars and six-carbon sugars simultaneously. These primarily include species such as Pichia stipitis, Candida shehatae, Pachysolen tannophilus, and Mucor indicus [13]. Through a selection process, Tang Bin et al. isolated a strain of Candida shehatae and utilized xylose and glucose for fermentation. With a sugar concentration of 60 g/L, the ethanol yields reached 21.6 g/L and 24.2 g/L, respectively. In research conducted by Lebeau et al. [14], Candida shehatae was immobilized on agar plates to examine its fermentation performance in bioreactors. Their study indicated that while the glucose was completely consumed, only 20% of the xylose was utilized. The efficient conversion of mixed sugars to ethanol remains a hot topic in current research.
In this study, a technique has been developed to produce ethanol using a mixture of WTP and FW. After pretreatment, the WTP and the saccharified FW were used for ethanol fermentation. In addition, a mixed fermentation process employing Candida shehatae and Saccharomyces cerevisiae was utilized. This method mitigates the inhibitory effect of glucose on xylose, thereby improving the fermentation efficiency.

2. Materials and Methods

2.1. Material

2.1.1. Tissue Paper

In this study, sanitary tissue paper was used as the source of WTP. The collected WTP was soaked in deionized water for two hours, and hydrothermal pretreatment was then conducted at 250 °C for 20 min. Following this hydrothermal pretreatment, the WTP was dried in an oven at 80 °C for 6 h to facilitate subsequent crushing. The dried WTP was then fed into the YMJ-001 shredder (Jinweilai Electric Appliance Inc. of Yongkang, Zhejiang, China) to achieve a uniform particle size. Subsequently, hydrothermal treatment was carried out at 160 °C. After cooling, the treated material was filtered using a suction pump to obtain processed WTP for subsequent enzymatic hydrolysis.

2.1.2. Food Waste

In this study, the FW used was sourced from a cafeteria and had undergone high-temperature treatment during the cooking process, thus requiring no further preprocessing.

2.1.3. Yeast and Medium

In this research, two types of yeast were selected: Saccharomyces cerevisiae and Candida shehatae. The Saccharomyces cerevisiae used was a commercially available strain from Angel Yeast, known for its application in industrial fermentation processes. The Candida shehatae strain, specifically Candida shehatae CICC 1766, was obtained from the China Center of Industrial Culture Collection (CICC).

2.2. Separate Hydrolysis Fermentation with Mixed Yeast Cultures

In this procedure, 7.5 g (dry weight) of WTP, after undergoing the aforementioned pretreatment, is added to a 250 mL fermentation bottle. Then, 170 mL of deionized water is added, followed by the introduction of 20 g (wet weight) of FW into the bottle. The mixture is sterilized with high-pressure steam for 120 min. After cooling, saccharification enzymes are added: cellulase at 25 U/g (calculated based on the WTP amount), β-glucosidase at 50 U/g (based on the WTP amount), and glucoamylase at 50 U/g (based on the FW amount). The mixture is then left for saccharification for 48 h. The resulting saccharification liquid is used for subsequent fermentation.

2.2.1. Fermentation Performance of Mixed Yeast Cultures

Three different inoculation groups were designed for this study: one was inoculated with Saccharomyces cerevisiae, another was inoculated with Candida shehatae, and the third group co-cultured Saccharomyces cerevisiae and Candida shehatae at a 1:3 ratio. All groups were fermented in a fermented broth with a pH of 5, with the inoculum size set at 10% of the fermented broth. The fermentation process was carried out at 33 °C and 150 rpm for 40 h. To monitor the fermentation process, samples were collected every 5 h to measure the content of ethanol, glucose, and xylose.

2.2.2. The Impact of Mixed Substrates on Fermentation Performance

Four control groups were established for comparative analysis: the group fermenting WTP solely, the group fermenting WTP with urea as a nitrogen source, the group co-fermenting WTP and FW with a dry mass ratio of 3:2, and the group fermenting FW solely. The fermentation performance of co-fermenting FW and WTP was evaluated. Yeast strains, namely Saccharomyces cerevisiae and Candida shehatae, were inoculated at a ratio of 1:3 into the fermentation broth, with an initial inoculation rate of 10%. Fermentation was conducted on a shaker at 150 rpm for a total duration of 40 h. Samples were taken every 5 h for analysis of the ethanol, glucose, and xylose contents.

2.2.3. Impact of pH Regulation on Fermentation Performance

In this experiment, four groups were set up with fermentation liquids at pH levels of 3, 4, 5, and 6. Saccharomyces cerevisiae and Candida shehatae were inoculated into simulated fermentation media, with the inoculation amount set at 10% and the dry basis ratio of WTP to FW set at 3:2. Fermentation was conducted at 33 °C and 150 rpm for 40 h. Samples were taken every 5 h to measure the concentrations of ethanol, glucose, and xylose.

2.2.4. Impact of Mixed Culture Ratios on Fermentation Performance

In this experiment, five groups were established with varying ratios of Saccharomyces cerevisiae and Candida shehatae: 1:0, 3:1, 1:1, 1:3, and 0:1. Subsequent fermentation experiments were performed according to Section 2.2.3.

2.2.5. Impact of Dynamic Temperature Control on Fermentation Performance

In this experiment, six groups were set up with fermentation temperatures of 20 °C, 25 °C, 30 °C, 33 °C, 35 °C, and 40 °C, respectively. Saccharomyces cerevisiae and Candida shehatae were inoculated into a simulated fermentation medium with a pH of 5 at a 1:3 ratio, with an inoculation volume of 10%. Fermentation was conducted on a shaker at 150 rpm for 40 h. Samples were taken every 5 h to measure the concentrations of ethanol, glucose, and xylose. Based on this experiment, four additional groups were designed: three groups with constant temperatures of 30 °C, 33 °C, and 35 °C, respectively, as well as another group with a variable temperature setting of 35 °C for the first 5 h, 30 °C for 5–20 h, and then 35 °C after 20 h. Saccharomyces cerevisiae and Candida shehatae were inoculated into an actual fermentation medium with a pH of 5 and a dry basis ratio of WTP to FW of 3:2. The inoculation volume was set at 10%. Fermentation was conducted on a shaker at 150 rpm for 40 h, with samples being taken every 5 h to measure the concentrations of ethanol, glucose, and xylose.

2.3. Analytical Methods

2.3.1. Determination of Yeast Concentration and Sugar

The yeast concentration was determined according to the OD600 value. Each sample was measured three times, and the average value was taken. Analysis of the reducing sugars in the fermentation liquid was carried out via the DNS method [15]. For the specific measurement of the xylose concentration, High-Performance Liquid Chromatography (HPLC) was used. Each sample underwent centrifugation at 4 °C at 12,000 rpm for 10 min, and the supernatant was filtered through a 0.22 μm membrane. The analysis was conducted on an Agilent 1260 HPLC system (Agilent Technologies Inc., Santa Clara, CA, USA) using a BioRad HPX-87H column, with 0.005 M H2SO4 as the mobile phase, a flow rate of 0.6 mL/min, a column temperature of 55 °C, and a Refractive Index Detector (RID). The xylose concentration was quantified using the external standard method.

2.3.2. Determination of Alcohols and Acids

The mass concentrations of ethanol and acetic acid in the fermentation liquid were determined using a Shimadzu GC-2010plus Liquid–Gas Chromatograph. The sample preparation involved centrifuging each sample at 4 °C at 12,000 rpm for 10 min, followed by filtering the supernatant through a 0.45 μm membrane. For the chromatographic analysis, 100 μL of the filtered sample was mixed with 500 μL of isobutanol in a chromatographic vial and uniformly mixed using a vortex mixer. Liquid–gas chromatography was conducted with an HP-FFAP-type capillary column and a hydrogen Flame Ionization Detector (FID), using nitrogen as the carrier gas. The injection volume was set at 1.0 μL, with the injector and detector temperatures being maintained at 220 °C and 240 °C, respectively.
The utilization rate of the sugars and the yield of ethanol were calculated using the following formulas:
The sugar utilization rate was calculated as follows:
sugar   utilization   rate = ρ consumed glucose + ρ ( consumed xylose ) ρ initial glucose + ρ ( initial xylose ) × 100 %
The ethanol conversion rate was determined as follows:
ethanol   conversion   rate = ρ ( ethanol in the fermentation liquid ) ρ consumed glucose + ρ ( consumed xylose ) × 100 %
In these equations, ρ denotes the concentration of the respective compounds in the fermentation medium. Equation (1) represents the efficiency with which the fermentative organism utilizes the available sugars (glucose and xylose), while Equation (2) quantifies the efficiency of converting these consumed sugars into ethanol.

3. Results

3.1. Characteristics of Food Waste and Waste Tissue Paper

Table 1 presents the composition of WTP and FW. Due to the necessary processing methods employed during the papermaking process, which remove the majority of lignin, hemicellulose, and protein compounds, the lignin content in WTP is relatively low. Additionally, the C/N ratio in WTP is high, reaching 393.49, with a very low nitrogen content. This makes it difficult to sustain yeast growth, reproduction, and fermentation activities during the fermentation process. Therefore, additional nitrogen sources should be supplemented during ethanol fermentation. The C/N ratio in FW is relatively low; this makes FW an excellent supplement for nitrogen. Additionally, the abundance of fruits and vegetables in China contributes to the approximately 15.2% cellulose content in FW. Furthermore, the frequent use of various seasonings in Chinese cooking means that FW is rich in trace elements such as Na+, K+, Mg2+, and Ca2+, which are beneficial for the growth and reproduction of microorganisms.

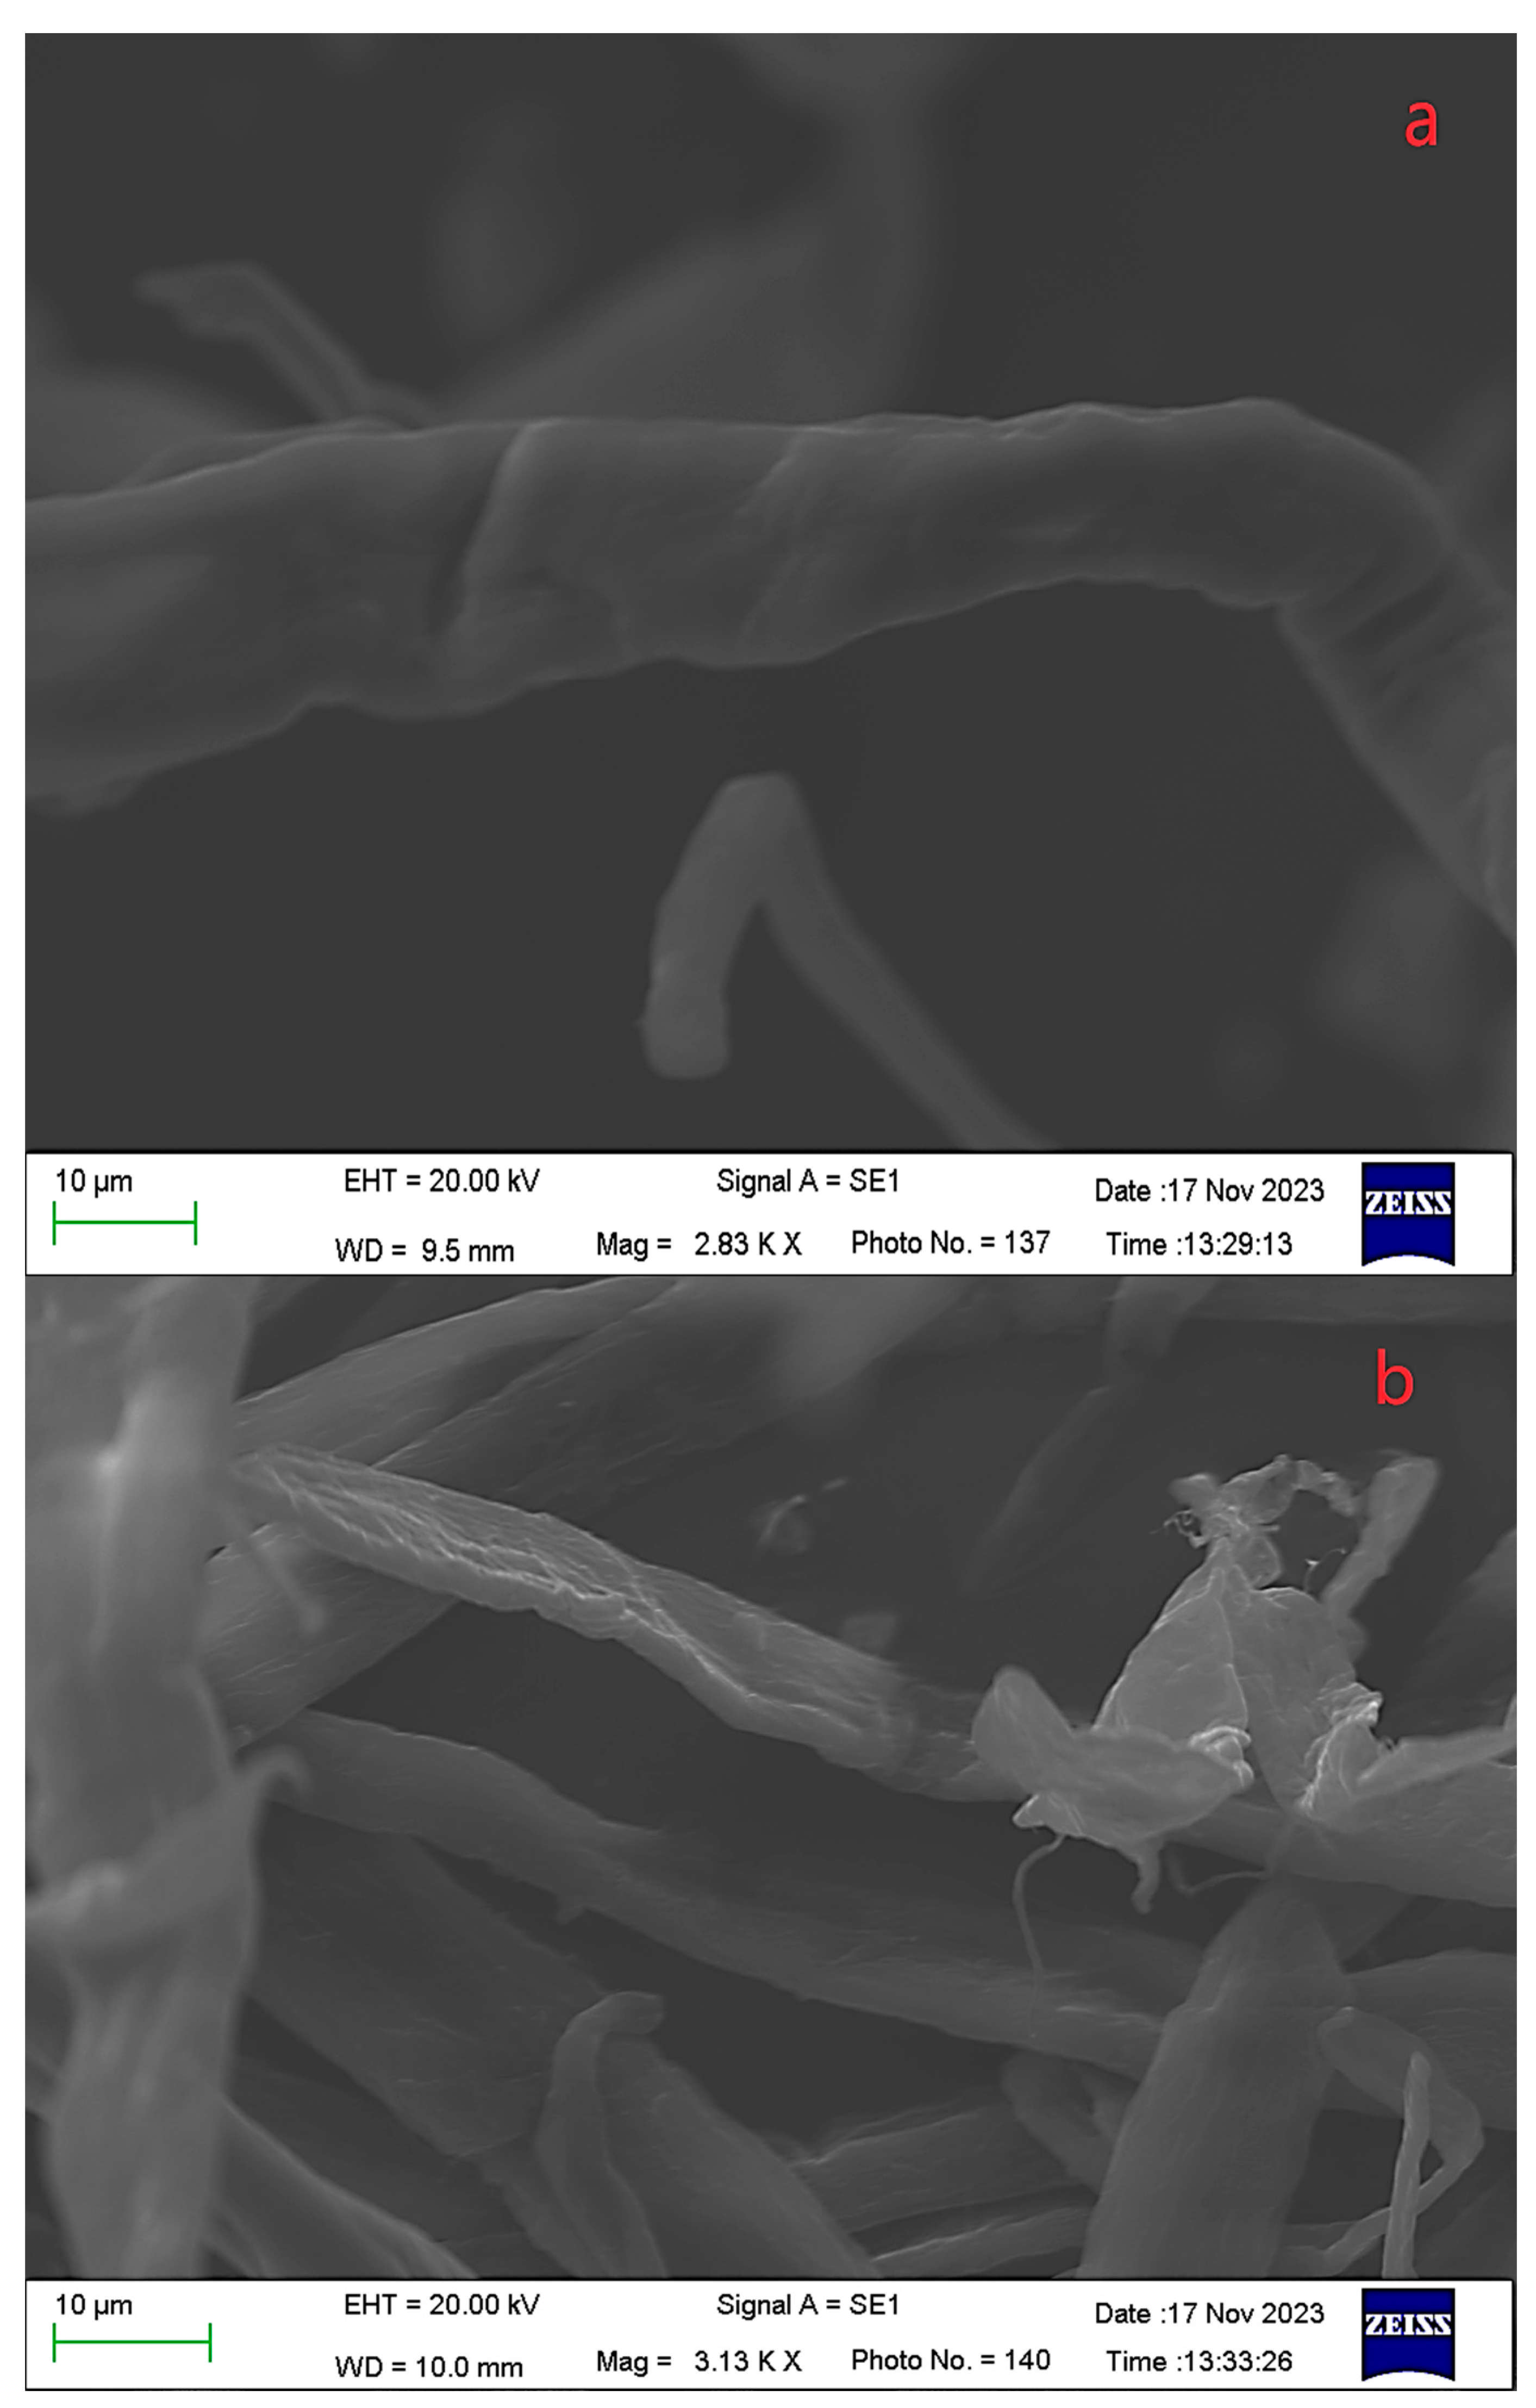
3.2. Impact of Hydrothermal Pretreatment on the Saccharification of Waste Tissue Paper

Natural lignocellulosic materials exhibit inherent resistance to enzymatic hydrolysis when not pretreated. The dense structure formed by cellulose, hemicellulose, and lignin impedes enzymatic attacks, especially the non-productive binding of enzymes with lignin, which physically blocks the enzymatic hydrolysis of cellulose [16]. However, in the processing of WTP, a pretreatment has already been applied, removing most of the lignin. Therefore, a simple hydrothermal pretreatment can sufficiently enhance the enzymatic hydrolysis of the fibrous material.
Scanning electron microscopy (SEM) provides a direct visual observation of the microstructural changes on the surface of materials. The surface morphology of the hydrothermally pretreated WTP was analyzed using SEM, as shown in Figure 1. These images reveal that the fibers of the untreated WTP have a smooth and intact surface, whereas the fibers of the hydrothermally treated WTP display a looser structure with many cracks and wrinkles. This altered structure increases the surface area for solvent contact with the cellulose, facilitating the hydrolysis process. Additionally, some fiber breakage was observed, indicating that the fibers of the WTP became more brittle and prone to break after hydrothermal pretreatment.
After hydrothermal pretreatment, a significant decrease in the lignin content was observed. This reduction is due to the partial dissolution of lignin in water under high-temperature and high-pressure conditions, as well as alterations in the chemical structure of the lignin. These changes include the breaking of chemical bonds and rearrangement of chemical structures, making the lignin more amenable to subsequent processing. When the pretreated WTP was applied to saccharification experiments, the results, displayed in Figure 2, showed that the saccharification time for the tissue paper reduced from 72 h to approximately 48 h, shortening the process by 24 h. The concentration of reducing sugars in the saccharification liquid reached 47.7 g/L, compared to 45 g/L before hydrothermal pretreatment, marking an improvement of 7% in saccharification efficiency. This improvement is attributed to the partial depolymerization and hydrolysis of cellulose and hemicellulose after hydrothermal pretreatment. This process reduces the crystallinity of the fibers and increases porosity, thereby making the cellulose more susceptible to enzymatic attacks [17]. Moreover, hydrothermal pretreatment removes some lignin and a small portion of hemicellulose [18]. In untreated cellulose, these substances play a protective role, hindering enzyme access to the cellulose. Their partial removal provides enzymes with more opportunities to act directly on the cellulose.

3.3. Separate Hydrolysis Fermentation with Mixed Yeast Cultures

3.3.1. Impact of Mixed and Single Yeast Cultures on Ethanol Fermentation

Due to the inhibitory effect of glucose on the ability of Candida shehatae to metabolize xylose [19], comparing the mass concentrations of glucose, xylose, and ethanol across both single-yeast and mixed-yeast fermentations helped in determining the optimal fermentation yeast strain. These specific experimental results are illustrated in Figure 3:
As shown in Figure 3a, Saccharomyces cerevisiae can only metabolize glucose. After 15 h, the fermentation rate began to slow down, reaching the fermentation endpoint at 25 h with an ethanol yield of 19.02 g/L, which was only 41% of the theoretical yield. The xylose concentration remained unchanged during this period, indicating that Saccharomyces cerevisiae could only utilize glucose and did not have the capability to degrade xylose. Figure 3c reveals that Candida shehatae preferentially utilizes glucose. After 20 h, the mass concentration of glucose was 9 g/L; then, the metabolic rate of xylose began to increase, suggesting that glucose had an inhibitory effect on the utilization of xylose. Candida shehatae prioritized the use of glucose and only started to ferment xylose when the concentration of glucose decreased to a certain level. This is due to glucose, mannose, and xylose using the same non-specific transporters. This means that these transporters do not exclusively transport any one type of sugar. Additionally, the active transport systems for these sugars are repressed when there is a high concentration of glucose or a high overall sugar concentration [20]. After 40 h of fermentation, the process approximately reached its endpoint with an ethanol yield of 20.87 g/L, which was around 45% of the yield rate. As shown in Figure 3b, when Candida shehatae and Saccharomyces cerevisiae were inoculated together for co-fermentation, the glucose level reached a low point after 20 h, which was significantly lower than when Candida shehatae was used alone. This demonstrated that the addition of Saccharomyces cerevisiae accelerated the degradation of glucose and relieved its inhibitory effect on xylose metabolism. At 25 h, the residual xylose concentration was 0.68 g/L, with a utilization rate of 88%. At this point, the ethanol concentration reached its peak, with a production of 22.98 g/L and a yield rate of 46.5%. Compared to the fermentation with only Candida shehatae, the co-fermentation of both yeasts resulted in a shorter fermentation time and a higher ethanol yield rate. The co-fermentation of Candida shehatae and Saccharomyces cerevisiae not only accelerated the degradation of glucose, shortening the fermentation time and increasing the degradation rate, but also alleviated the inhibition of xylose metabolism by glucose during the single-strain fermentation of Candida shehatae, thereby improving the utilization rate of xylose. Therefore, the fermentation effect when using the mixed yeast cultures was significantly superior to that of the single-yeast fermentation.

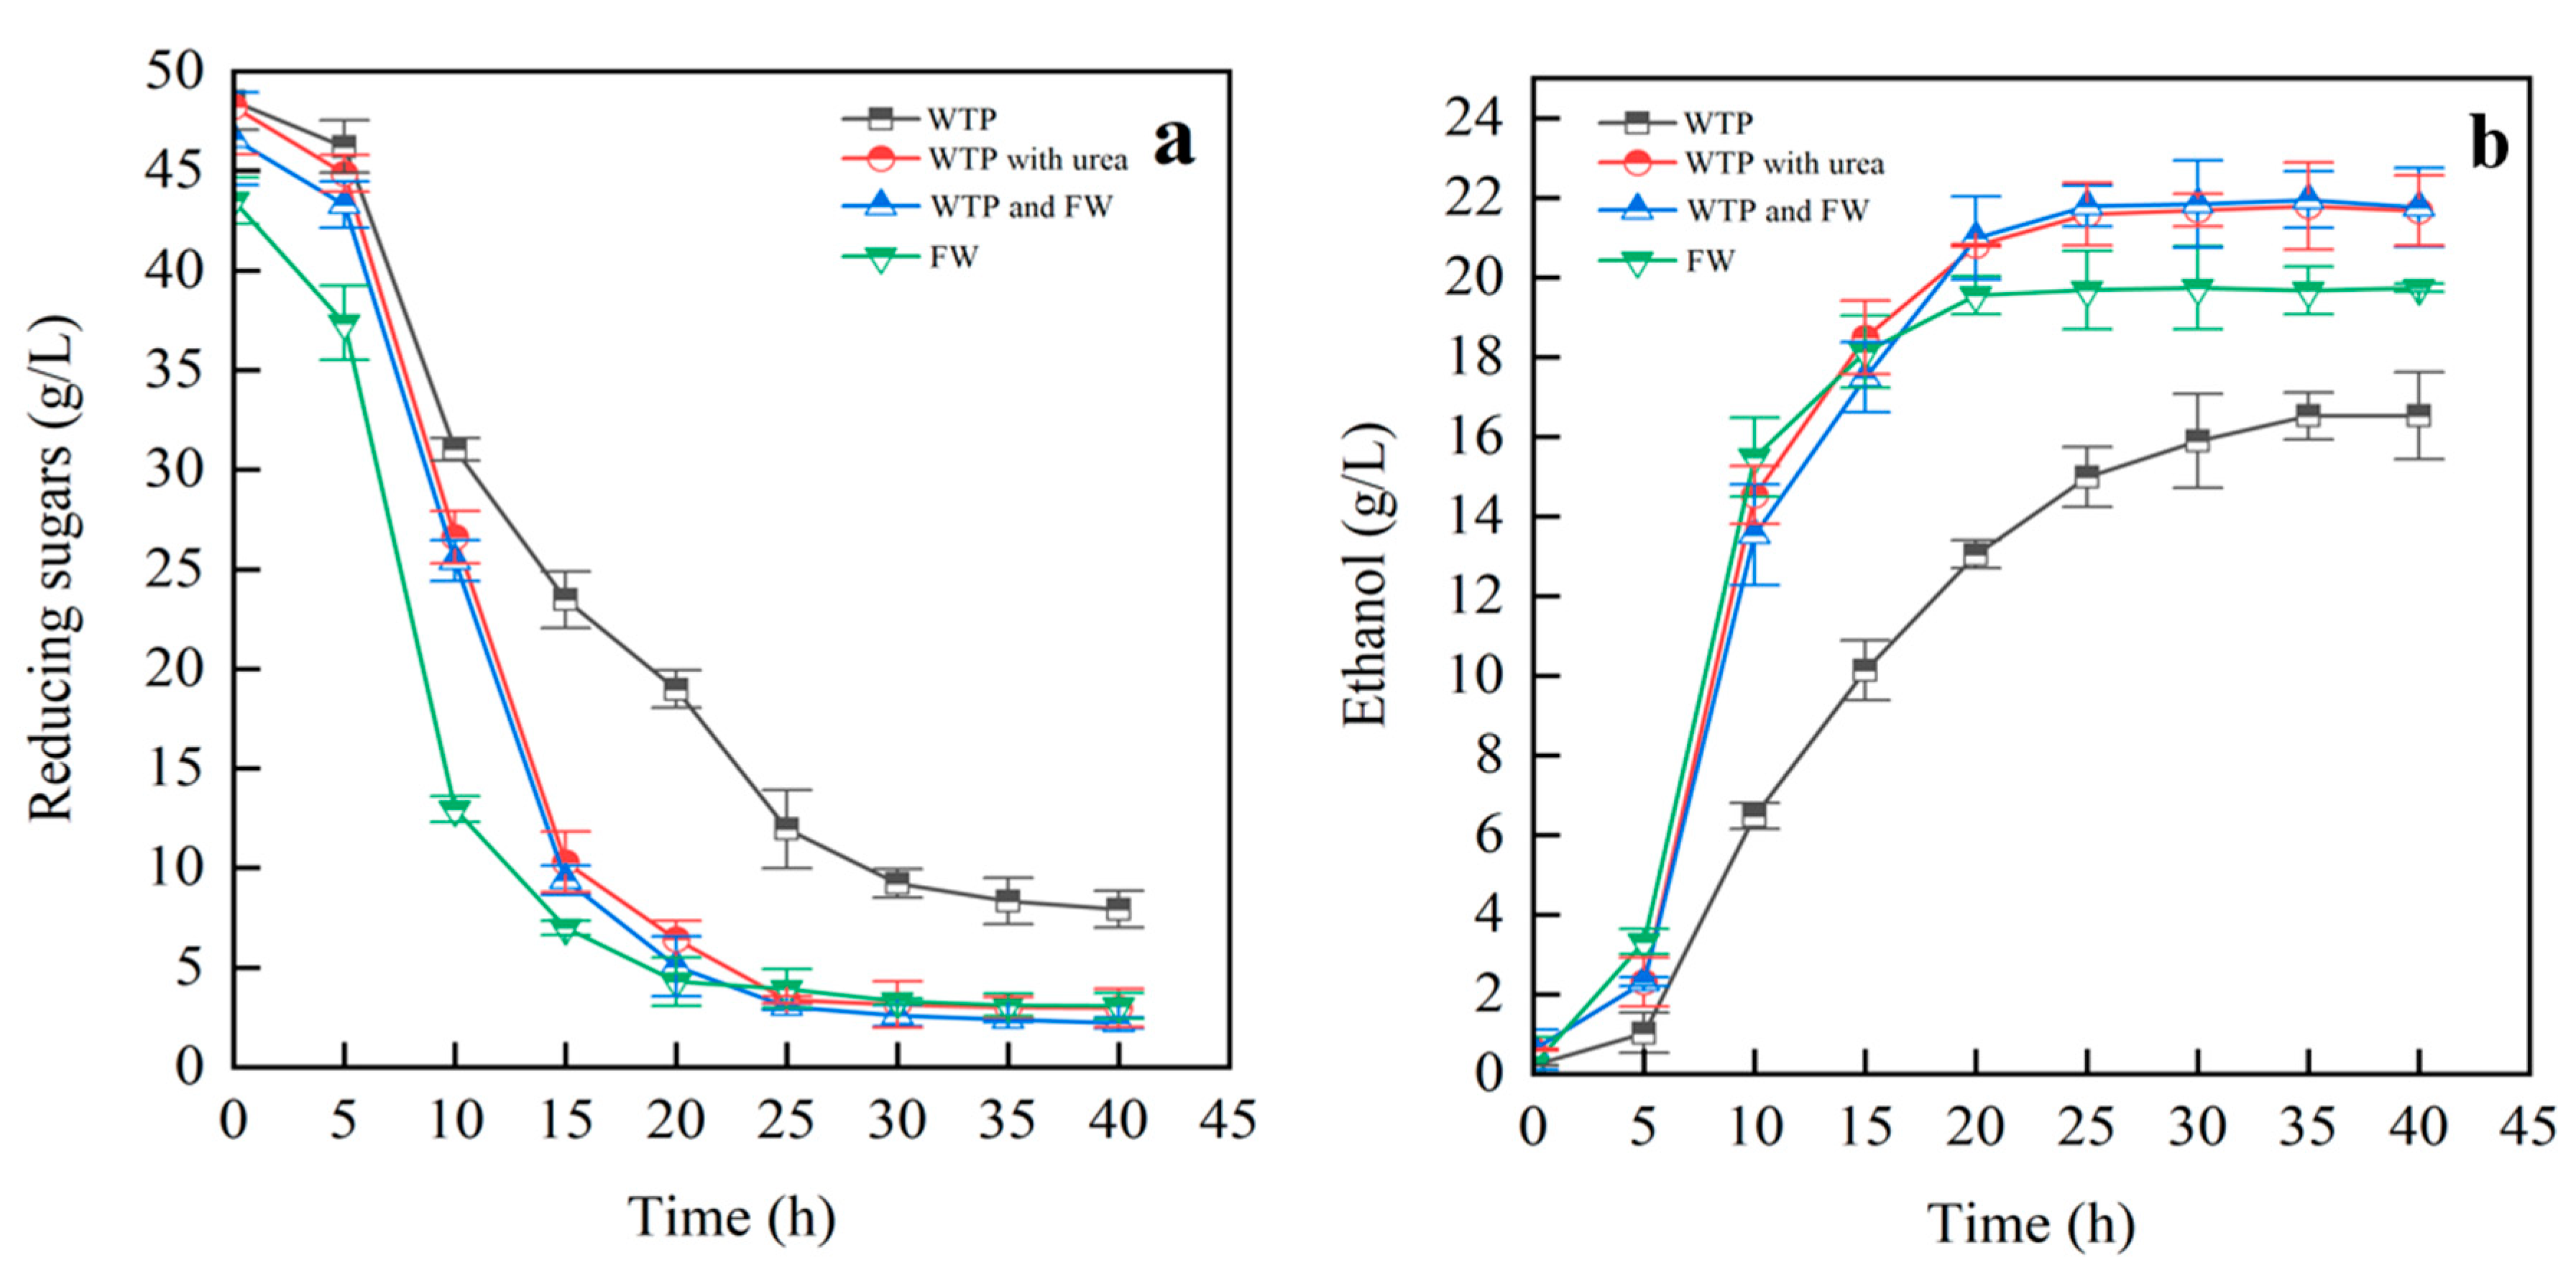
3.3.2. Impact of Mixed Substrates on Ethanol Fermentation

Through analysis using SPSS 27 on the experimental data, as detailed in Table S1, it was found that adding FW or additional nitrogen sources caused significantly different results from the other two groups and could significantly increase the ethanol yield. This is because yeast has specific nutritional requirements during ethanol fermentation, with nitrogen sources serving as endogenous nutrients and directly impacting the yeast’s life activities and biomass. Changes in the biomass alter the osmotic pressure inside and outside the cell. The significant production of NADH to maintain osmotic pressure both inside and outside the cell prompts the oxidation of ethanol to produce acetic acid.
As shown in Figure 4, it was observed that during sole fermentation of WTP, the ethanol content increased slowly, resulting in prolonged fermentation times. This is attributed to the low nitrogen content in WTP, which hinders yeast growth and reproduction. Under low-nitrogen conditions, yeast growth and reproduction are constrained by the low nitrogen concentration, resulting in slow growth and reproduction rates. Consequently, this decreases the yeast’s sugar conversion rate and ethanol synthesis rate, potentially leading to fermentation delays. However, when urea is used as a supplemental nitrogen source in WTP fermentation, a significant increase in ethanol production is observed, reaching the fermentation endpoint around 25 h with an ethanol yield of 21.78 g/L and a yield rate of 48%. Comparing this to the control group supplemented with FW, it is found that adding FW achieves a similar effect to adding an external nitrogen source. This is attributed to the acceleration of yeast growth and reproduction rates with the increasing nitrogen concentration, leading to enhanced fermentation rates and faster fermentation processes. At 25 h, the fermentation endpoint is reached with an ethanol yield of 21.94 g/L and a yield of 49.5% when kitchen waste is added as a nitrogen source. Compared to using urea as a nitrogen source, the ethanol yield increases by 1.5%. This enhancement may be attributed to the fact that FW not only serves as a nitrogen source but also provides trace elements necessary for yeast metabolism, thereby promoting yeast growth and reproduction. However, when the nitrogen source level rises to a certain threshold, the fermentation rate of yeast does not increase with the increase in nitrogen concentration. This is evident in the sole fermentation group of FW, where although the fermentation rate was initially faster, the ethanol content at the fermentation endpoint was lower, with an ethanol yield of 47.5%. There are two main reasons for this. Firstly, the low pH and high concentration of acidic substances in the sole fermentation of FW inhibit yeast growth, reproduction, and fermentation activity. Secondly, an excess of nitrogen sources and trace elements can divert sugar metabolism towards yeast cell growth, thereby detrimentally affecting ethanol fermentation. Therefore, the mixed fermentation of FW and WTP outperformed their individual fermentations. The addition of FW not only served as an external nitrogen source for WTP fermentation but also acted as a pH regulator to adjust the fermentation conditions. WTP, on the other hand, can provide a high concentration of reducing sugars for fermentation, thereby increasing the initial sugar concentration and improving the fermentation’s efficiency.

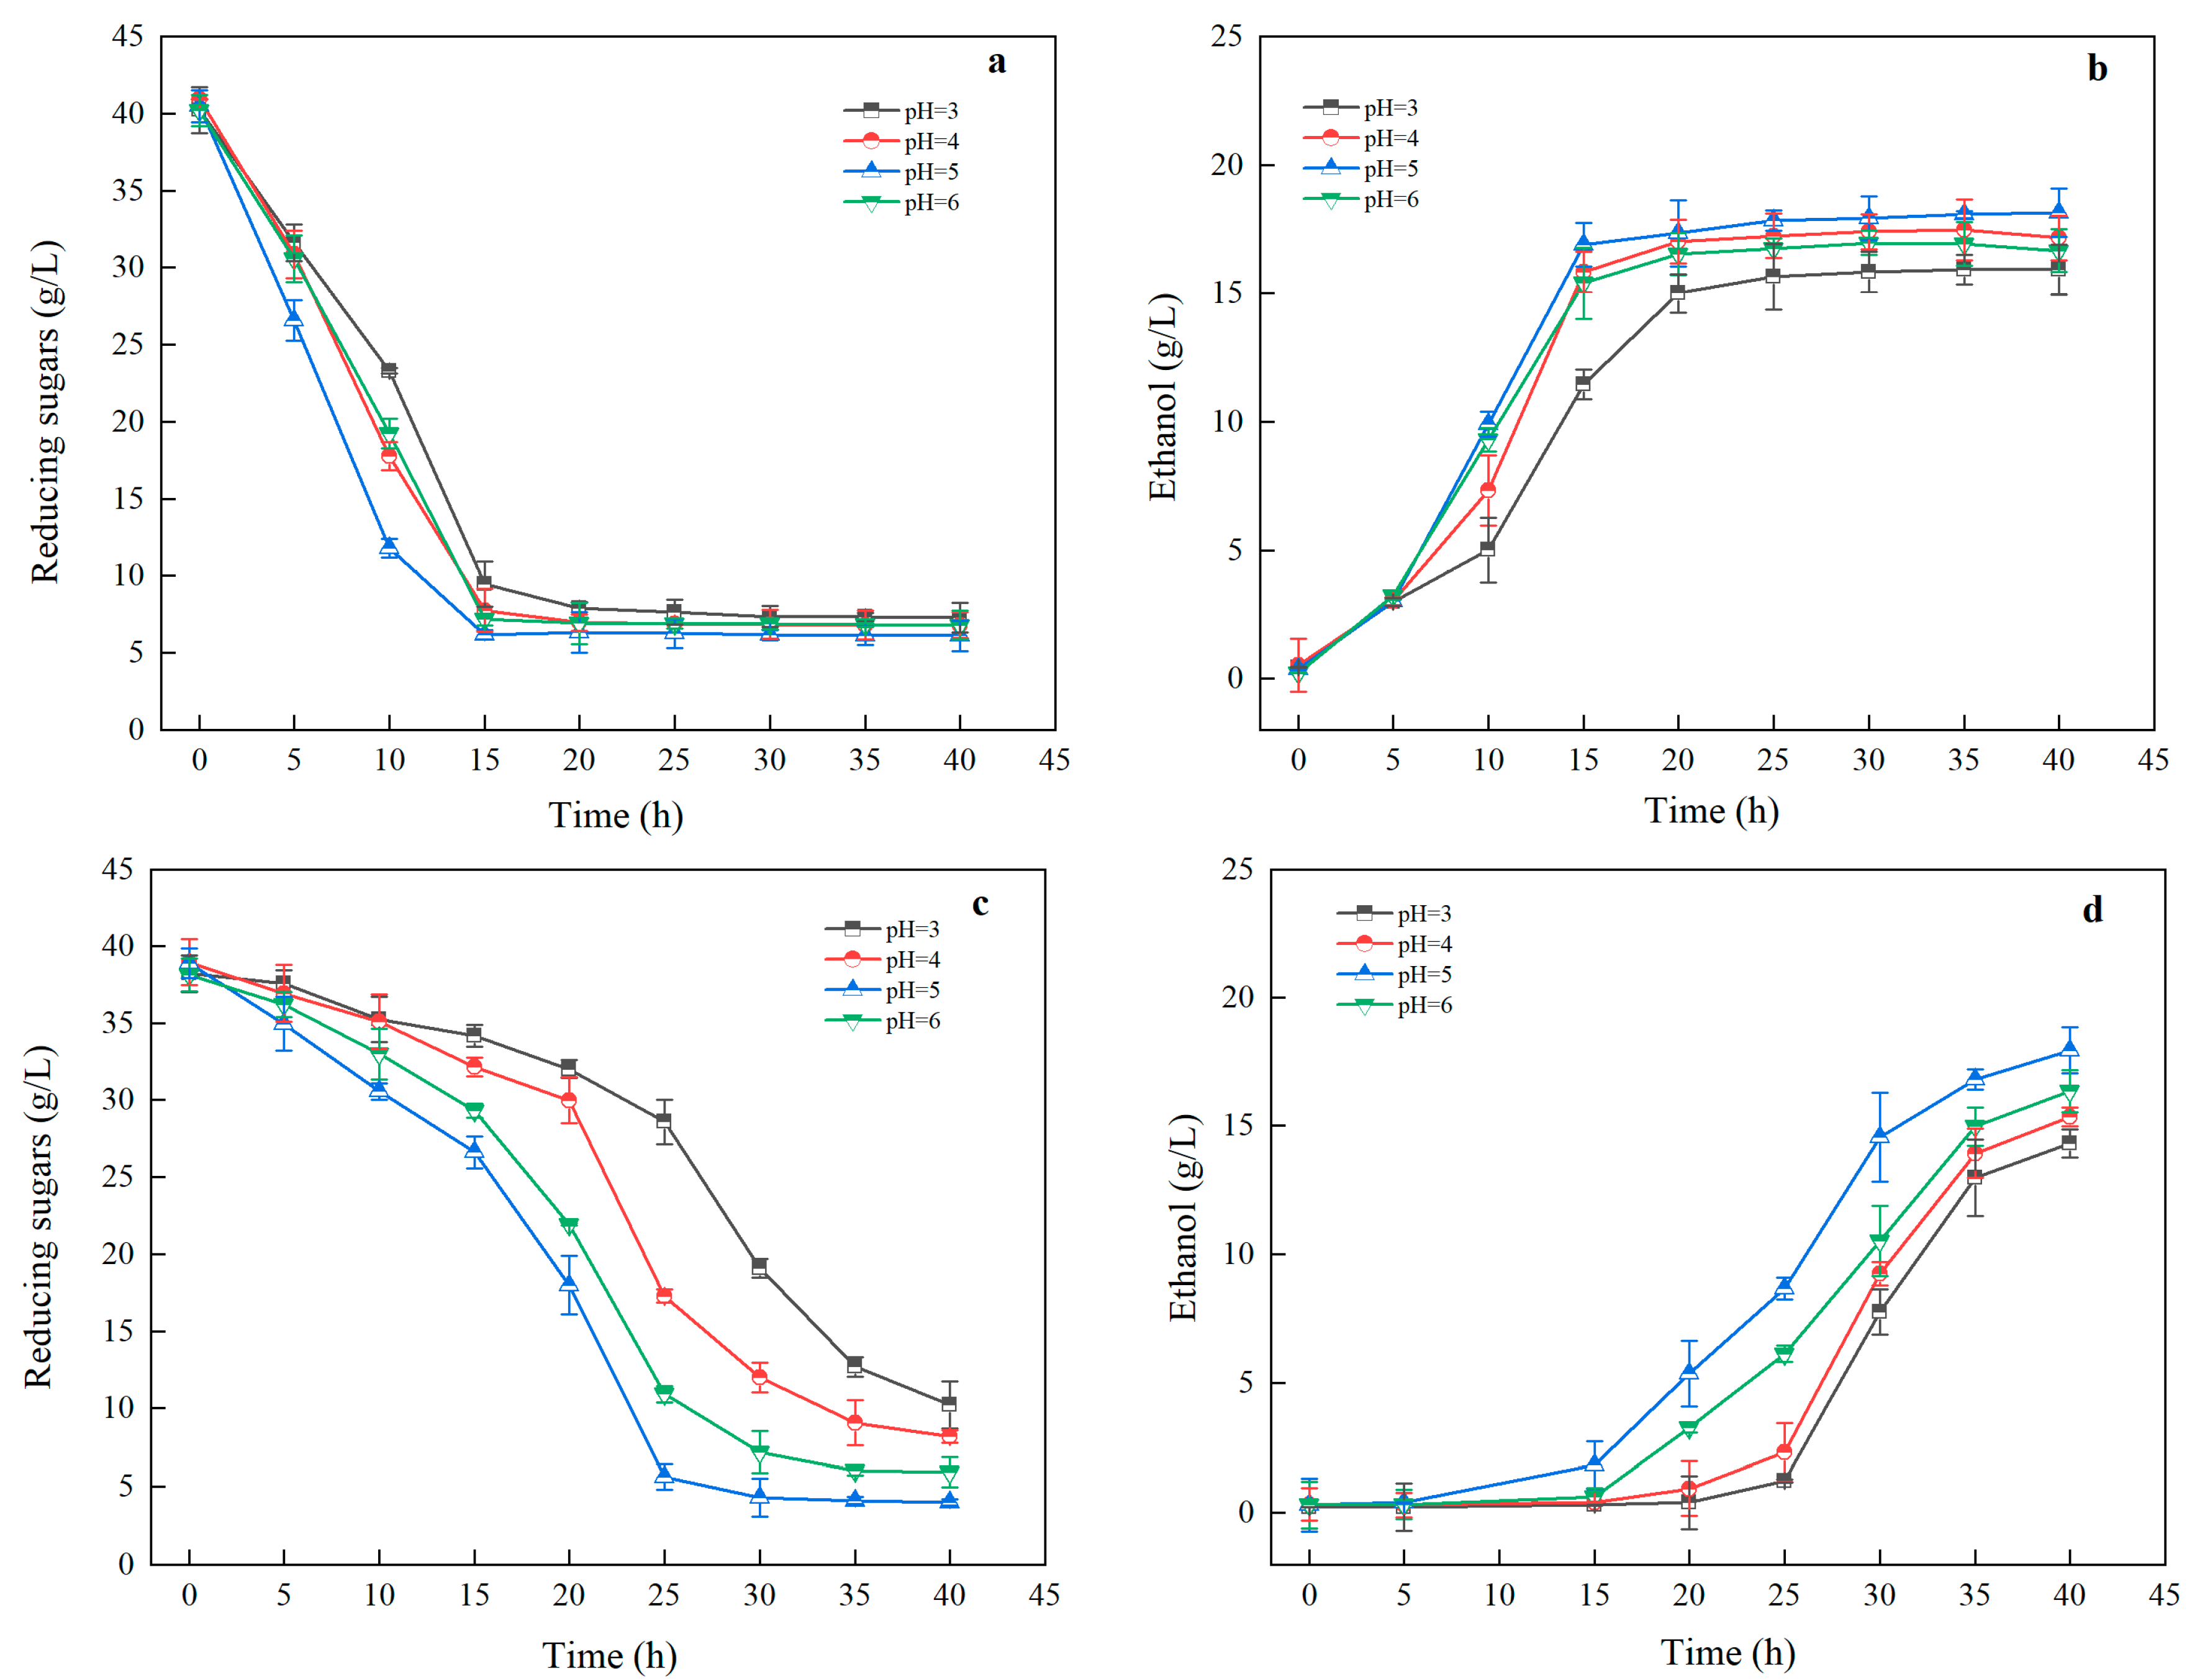
3.3.3. Impact of pH on Ethanol Fermentation

The growth and metabolic reactions of yeast cells change under different pH conditions, which will affect the efficiency of ethanol fermentation and the growth of yeast cells [21]. As shown in Figure 5, this experiment involved adjusting the optimal survival pH for the two types of yeast.
The figure shows that Saccharomyces cerevisiae exhibits a strong adaptability to changes in pH. The fermentation capability did not vary significantly between pH 4 and 6, with the residual reducing sugar concentration falling below 14 g/L, and the utilization rate of glucose being above 90%. The ethanol yield differed by only 2%. However, when the acidity was too strong, the activity of Saccharomyces cerevisiae was severely compromised, with a very low ethanol production of only 15 g/L and a yield rate of just 30%. Therefore, within a suitable pH range, changes in pH did not greatly affect the fermentation ability of Saccharomyces cerevisiae. This is because the Saccharomyces cerevisiae used in this instance was an engineered strain from Angel Yeast, which had been acclimatized to different pH levels. It might possess specific acid-resistant or alkali-resistant enzymes that remained active under different pH conditions, helping to maintain normal biochemical reactions. Its proton pumps and ion channels enable it to regulate intracellular and extracellular ion concentrations in response to environmental pH changes, thereby maintaining intracellular pH balance [22].
In contrast, Figure 5c,d indicate that Candida shehatae is more sensitive to pH changes. At lower pH levels, both the proliferation and fermentation activities of Candida shehatae were inhibited [23]. Although a low pH can suppress the growth of contaminants, it also inhibited the vital activities of Candida shehatae. A low-pH environment poses stress on the yeast cells, which may activate stress response mechanisms, leading to energy and resources being reallocated to cope with environmental pressure rather than normal growth and metabolism [24]. As the pH increased, the fermentation capability of Candida shehatae first increased and then decreased, with the optimal fermentation occurring at pH 5. After about 30 h of fermentation, the ethanol yield reached 20.09 g/L, with a yield rate of 40%. At higher pH levels, the metabolic products of the yeast did cause the pH of the fermentation broth to gradually decrease, allowing the fermentation ability of Candida shehatae to gradually recover, but this extends the fermentation time. When fermentation was prolonged to 40 h, the accumulation of metabolic products during this period also inhibited the fermentation activity of Candida shehatae, and the ethanol yield rate decreased by 5% compared to when the pH was 5. Therefore, during the fermentation process, the optimal fermentation pH for the mixed yeast culture is preliminarily determined to be 5. In the mixed-yeast fermentation system, changes in the pH primarily affected Candida shehatae, while having a lesser impact on Saccharomyces cerevisiae; the analysis using SPSS also confirmed this conclusion, and Table S2 further indicates that the changes in pH had a more significant impact on Candida shehatae. The overall fermentation capability of the mixed yeast culture was more constrained by the fermentation performance of Candida shehatae.

3.3.4. Impact of Mixed Culture Ratios on Ethanol Fermentation

During the saccharification experiments, it was observed that the pH continuously declined throughout the process, stabilizing at around 3.8 when mixed with the saccharification liquid from FW. This is attributed to the formation of inhibitors such as acetic acid during saccharification. The degradation of hemicellulose and fermentable sugars results in the production of organic acids (acetic acid, formic acid, levulinic acid), furan compounds (furfural, 5-HMF), and phenolic compounds from lignin degradation. As the intensity of pretreatment increases, the concentration of these inhibitors also rises [25]. These organic acids enter the microbial cells and alter the internal environment, leading to a decrease in the intracellular pH [26]. To maintain a stable intracellular pH, microorganisms consume excessive amounts of ATP, which can slow down cell growth or even cause cell death, resulting in a reduced fermentation efficiency and decreased ethanol production [27].
The detoxification of inhibitors could be achieved using NaOH, but an excess of Na+ ions could also affect the fermentation process. Therefore, appropriate adjustments with Ca(OH)2 were necessary to bring the pH of the saccharification liquid to 5. This could alleviate the inhibitory effects of substances such as acetic acid on fermentation to some extent. On this basis, optimal ratio experiments with Candida shehatae and Saccharomyces cerevisiae were conducted, and these experimental results are shown in the following Figure 6.
As shown in Figure 6a,c, without adjusting the pH to 3.8, the highest ethanol yield occurred when the inoculation ratio of Saccharomyces cerevisiae to Candida shehatae was 3:1. However, the yield was only 39%. The low pH inhibited the growth and fermentation capabilities of both types of yeast, extending the logarithmic growth phase and the fermentation period to 30 h. Acidic conditions can impact the integrity and functionality of yeast cell membranes. When the pH was too low, the stability and permeability of the cell membrane were compromised, interfering with the normal transport of substances and the transmission of cellular signals [28]. This could also cause conformational changes in key enzymes (such as those in metabolic pathways), reducing their activity. This decline in enzyme activity directly affects the cell’s metabolic capabilities, including carbohydrate metabolism. Figure 6b,d shows that when the pH was adjusted to 5, the logarithmic growth phase of the yeast was shortened, and the time taken for ethanol synthesis was improved, with most reaching the fermentation endpoint around 20 h. When the ratio of Saccharomyces cerevisiae to Candida shehatae was 1:3, the highest ethanol yield was achieved at 47%. Under optimal pH conditions, a small amount of Saccharomyces cerevisiae can accelerate the degradation of glucose, promoting the metabolism of xylose by Candida shehatae.
Comparing different yeast ratios also revealed that the group inoculated only with Saccharomyces cerevisiae, although faster in its fermentation rate, reached the endpoint at around 15 h and left a higher residual reducing sugar concentration with the xylose largely being unutilized, resulting in an ethanol yield of only 40%. The group inoculated only with Candida shehatae had a lower residual xylose concentration, but even after 40 h, it did not reach the fermentation endpoint. This corroborated the experimental results described in Section 3.3.1. Comparisons of Figure 6a–c also show that Candida shehatae is particularly sensitive to pH changes. At around pH 3.8, Candida shehatae had virtually no fermentation capability before 20 h of fermentation, and the growth phase was prolonged, with no ethanol synthesis occurring at 20 h. Additionally, this experiment corroborated the findings detailed in Section 3.3.3, further validating those results.

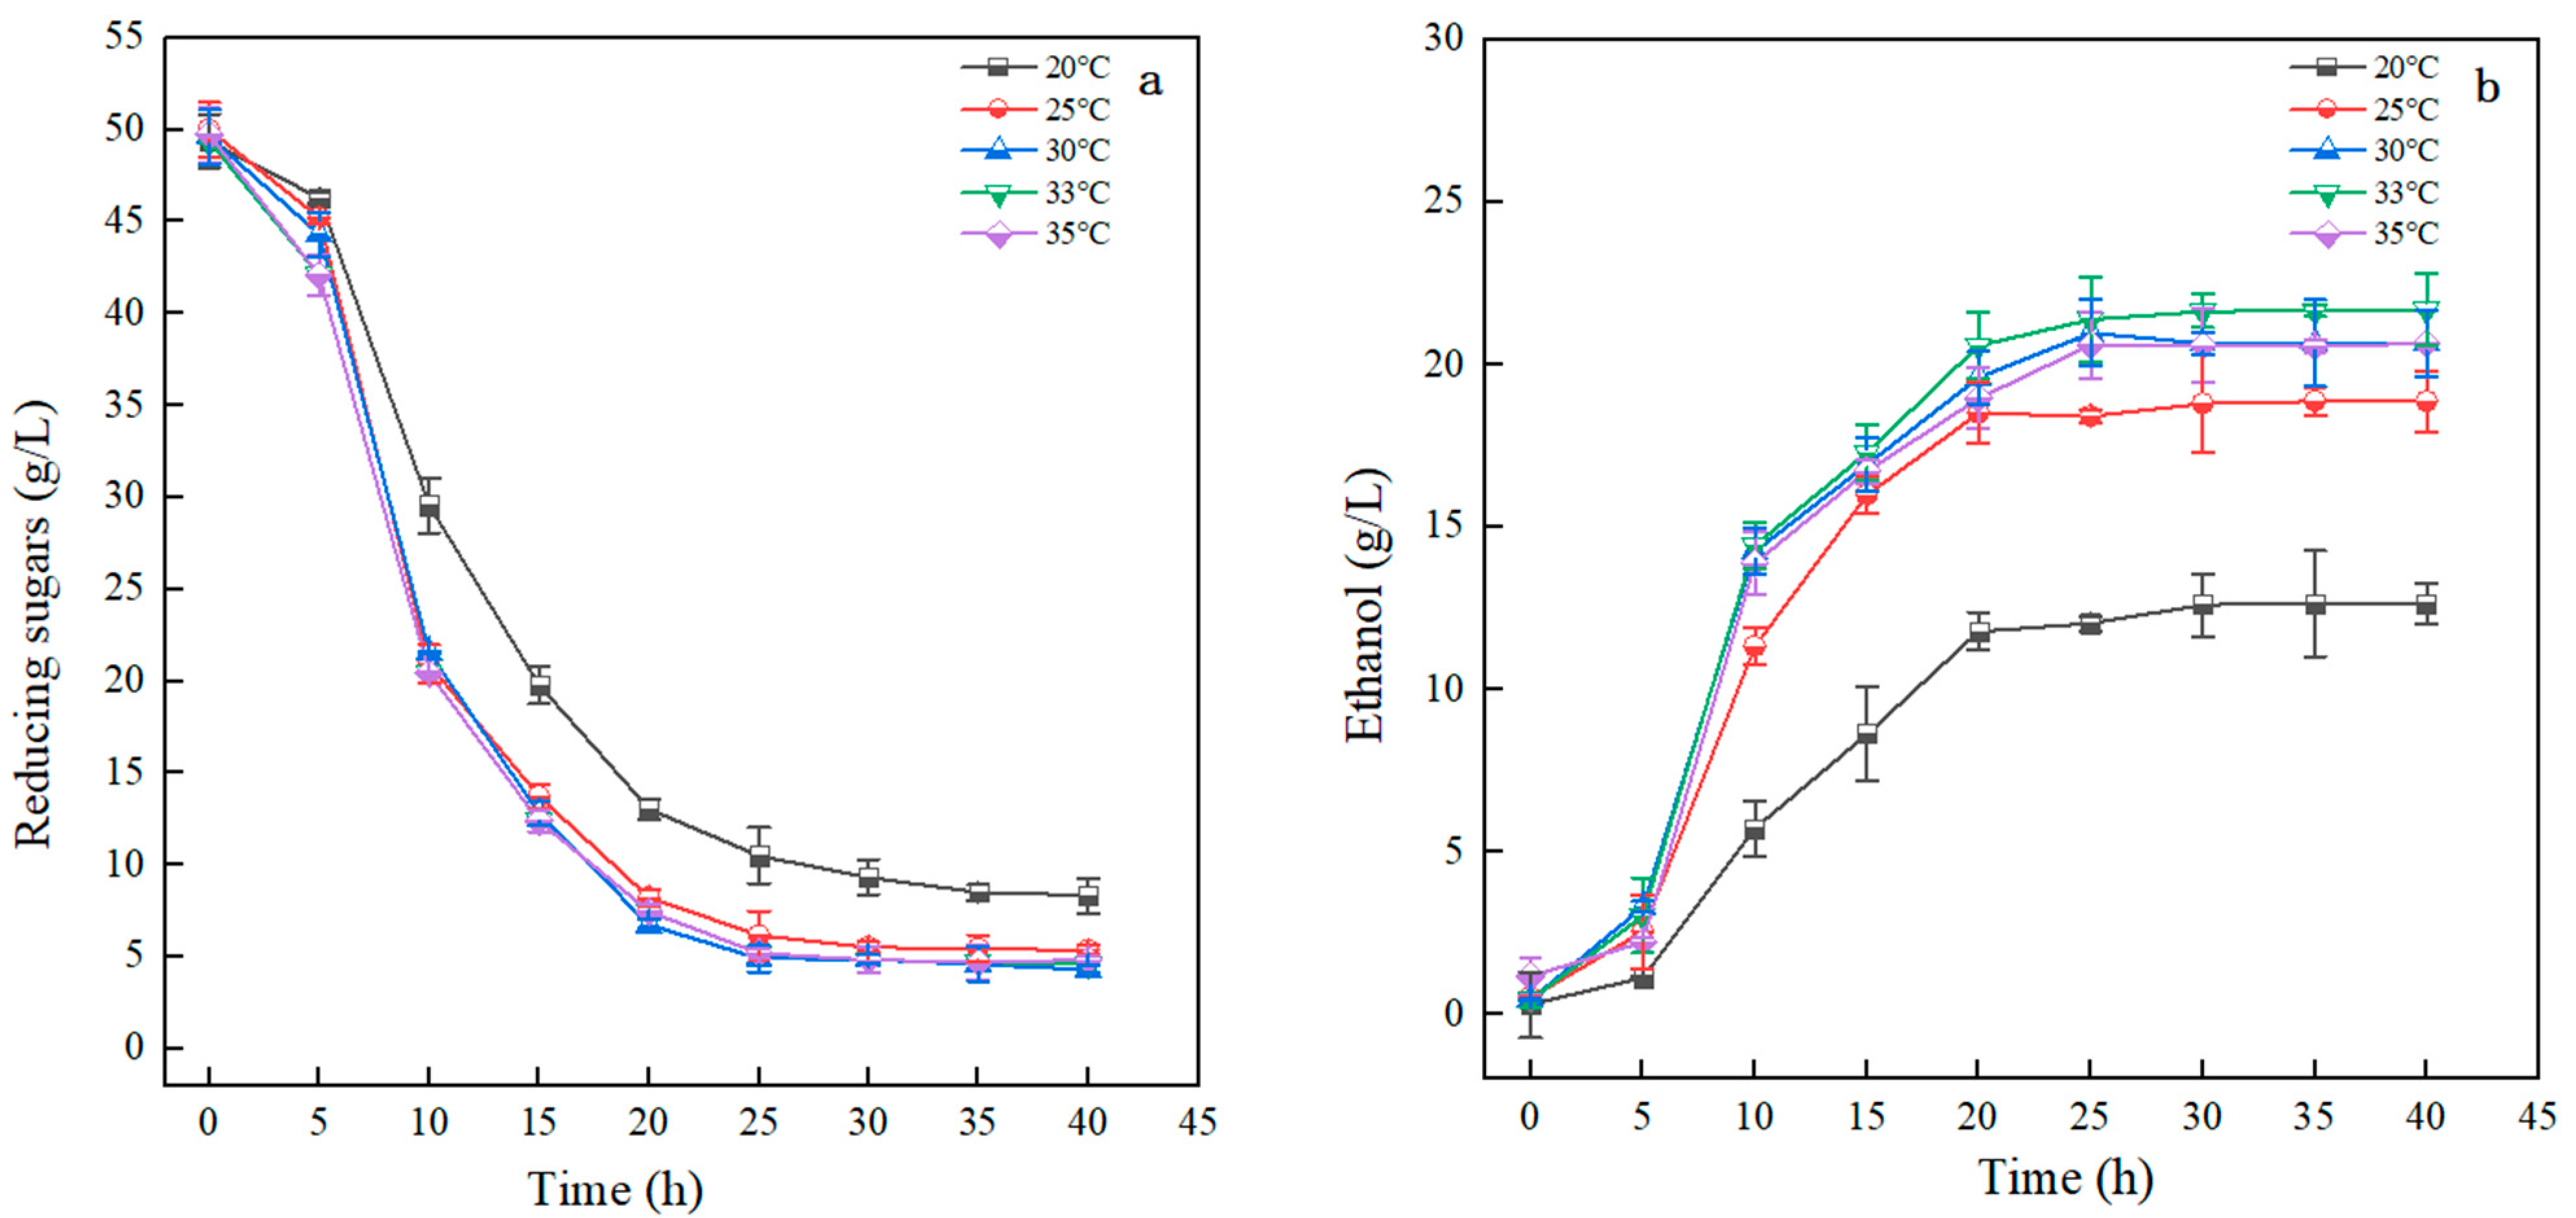
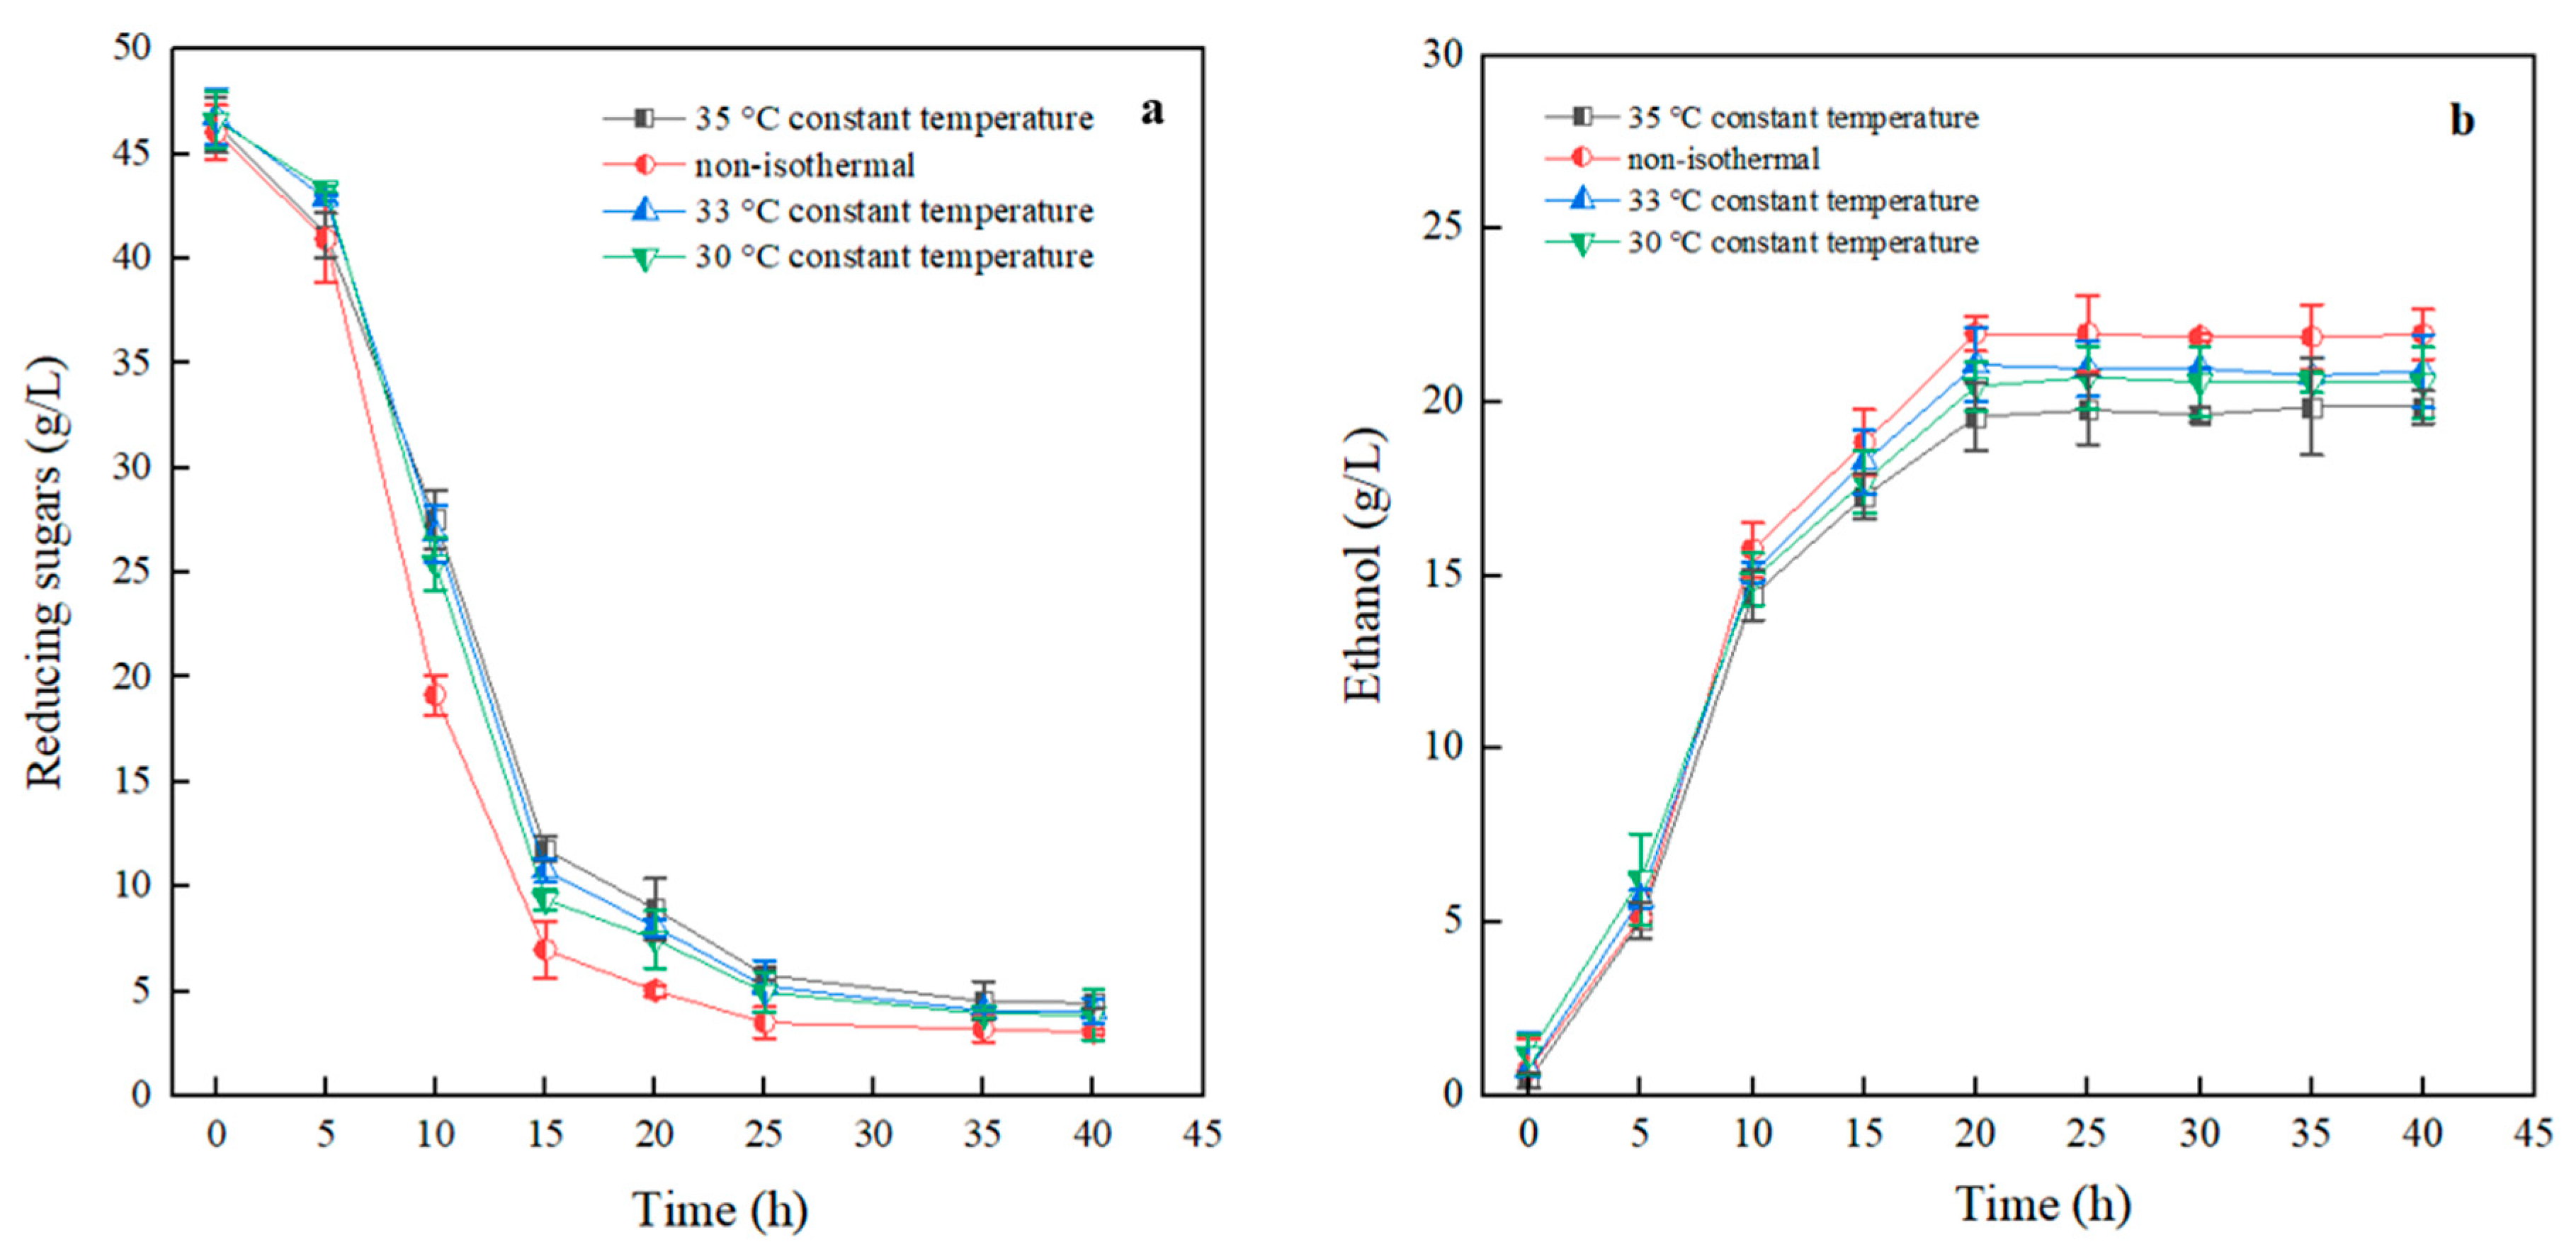
3.3.5. Impact of Temperature on Ethanol Fermentation

The fermentation capability of yeast primarily depends on the activity of enzymes within the yeast cells, and temperature is a crucial factor affecting enzyme activity [29]. Temperatures that are too low can inhibit the fermentation ability of yeast, while excessively high temperatures can damage some proteins within the yeast cells or even lead to a high mortality rate. Therefore, identifying the optimal fermentation temperature is essential. These specific experimental results are illustrated in Figure 7.
It could be observed that when temperatures were below 30 °C, the growth and reproduction rate of the yeast were relatively slow. However, at around 10 h, the fermentation rate of the yeast significantly accelerated, possibly due to the increase in temperature inside the fermentation bottle caused by the yeast’s anaerobic fermentation activity. This temporary increase in temperature enhanced the yeast’s activity and fermentation capability, leading to a rapid rise in ethanol content between 10 and 20 h. After 20 h, as the temperature decreased, yeast activity continued to be suppressed, and fermentation reached its endpoint prematurely. As the temperature increased, the growth and reproductive ability of the yeast also increased, resulting in a higher ethanol yield. This observation was consistent with the findings of research conducted by GAMERO A et al. [30].The highest ethanol production, 21.66 g/L, occurred at 33 °C, with a yield rate of 44%. However, as the temperature continued to increase, despite a higher rate of reducing sugar degradation in the initial stages of fermentation at 35 °C compared to other groups, the ethanol production at 35 °C was not higher than that in the other groups. This suggested that while 35 °C can promote yeast growth and reproduction, the accumulation of metabolic products generated during this process can inhibit fermentation. With a further increase in temperature, the yeast’s growth and reproduction were inhibited. This included an impact on various proteins, such as septins [31], which support yeast mitosis. The enzyme activity within the yeast was also suppressed, leading to a partial loss of yeast activity. Consequently, this resulted in a reduced fermentation rate and lower ethanol production [32].

3.3.6. Non-Isothermal Dynamic Fermentation

In the actual fermentation process, due to the presence of lipids in the fermentation liquid, the temperature within the system may not be consistent with the external environment. Additionally, the metabolic activity of the yeast generated a substantial amount of heat, leading to dynamic changes in the system’s internal temperature. Therefore, dynamic control of the fermentation process was necessary. Additionally, the fermentation process under controlled temperatures also varied accordingly [33].The specific experimental results are shown in Figure 8. SPSS analysis of the results, as shown in Tables S3 and S4, reveals a significant impact of the temperature on ethanol yield, with non-isothermal fermentation showing better results. When analyzing the data from Figure 8a,b, it was observed that in the constant-temperature fermentation process, the ethanol yield at the constant temperature of 30 °C was higher than that at 35 °C. The difference in yield was more significant compared to the simulated fermentation experiment. The increased gap in yield could be attributed to the presence of lipids in the actual fermentation liquid, which floated on the surface and impeded heat dissipation during the anaerobic fermentation activity of the yeast, resulting in a larger internal temperature gradient compared to the external environment.
Moreover, under the constant-temperature fermentation condition of 35 °C, the degradation rate of reducing sugars in the first 5 h was noticeably faster than in the 30 °C group, but the ethanol production did not show a significant difference. This suggested that 35 °C was more conducive to the growth and reproduction of the mixed yeast. However, as the metabolic by-products of the yeast’s growth and reproduction accumulate, they could also affect the subsequent fermentation activity of the yeast.
Comparing non-isothermal dynamic fermentation with isothermal static fermentation, it was evident that setting the temperature to 35 °C for the first 5 h significantly accelerated the degradation rate of reducing sugars, leading to rapid yeast proliferation. This shortened the logarithmic growth phase of the yeast and advanced the ethanol synthesis process [34]. During the 5–20 h period, the metabolic activities of the yeast caused an increase in the system’s temperature. However, due to the presence of lipids in the actual fermentation, this heat was not efficiently dissipated. Therefore, appropriately lowering the temperature to the optimal fermentation temperature for yeast resulted in a significantly higher ethanol synthesis rate compared to the three isothermal static fermentation groups. This increased efficiency was due to a higher yeast count in the early stages of fermentation compared to the 33 °C isothermal fermentation group, and conditions more favorable for yeast synthesis compared to the 35 °C group. Therefore, under conditions where lipids were present, a non-isothermal dynamic fermentation approach was more suitable for ethanol fermentation. With this method, ethanol production could reach 21.98 g/L, with a yield rate of 49%. This represented a 5% increase in the ethanol yield compared to the constant-temperature fermentation method. Additionally, this temperature control approach could also effectively address the impacts of seasonal temperature variations [35].

4. Conclusions

This study demonstrated that the addition of FW could enhance the ethanol fermentation of WTP. While addressing the issue of high C/N ratios in the fermentation process of WTP, it also provides advice for regulating the pH of saccharification. The hydrothermal pretreatment of the WTP in this study effectively removed lignin and increased the contact area between the cellulose and enzymes, shortening the saccharification time from 72 h to 48 h and increasing the sugar concentration in the saccharification liquid from 45 g/L to 47.7 g/L. The co-fermentation process using Saccharomyces cerevisiae and Candida shehatae could enhance the utilization rate of xylose. The optimum ratio of Saccharomyces cerevisiae to Candida shehatae was 1:3, achieving an ethanol yield of 46.5%. The optimal fermentation pH for the mixed yeast was identified as 5. The best fermentation approach involved dynamic temperature control. Under these conditions, the ethanol production could reach 21.98 g/L, with the yield increasing from 41% in single-yeast fermentation to 49% in mixed-yeast fermentation.

Supplementary Materials

The following supporting information can be downloaded at: https://www.mdpi.com/article/10.3390/fermentation10040194/s1, Table S1. Least Significant Difference Test for the results of the different substrates; Table S2. Analysis of variance for the results of the Ph; Table S3. Analysis of Variance for the results of the different Temperature; Table S4. Least Significant Difference Test for the results of the different Temperature.

Author Contributions

Conceptualization, H.M., Q.W. and Y.W.; methodology, H.M.; validation, H.M.; formal analysis, H.M., Q.W., Y.W., B.S. and P.L.; investigation, H.M., M.G. and Y.W.; data curation, Y.W., Q.W. and D.Q.; writing—original draft preparation, H.M. and Y.W.; writing—review and editing, Y.W.; resources, Q.W. and J.Z.; All authors have read and agreed to the published version of the manuscript.

Funding

This research was funded by the National Key R&D Program of China (2022YFE0105700, 2019YFC1906302, 2019YFC1906304); the Key R&D Program of Xinjiang Uygur Autonomous Region (2022B02021); and the Digital Economy Think Tank Research Institute (NGYZY-20-007).

Institutional Review Board Statement

Not applicable.

Informed Consent Statement

Not applicable.

Data Availability Statement

Data are contained within the article.

Conflicts of Interest

The authors declare no conflicts of interest.

References

  1. Vassilev, I.; Hernandez, P.A.; Batlle-Vilanova, P.; Freguia, S.; Krömer, J.O.; Keller, J.; Ledezma, P.; Virdis, B. Microbial electrosynthesis of isobutyric, butyric, caproic acids, and corresponding alcohols from carbon dioxide. ACS Sustain. Chem. Eng. 2018, 6, 8485–8493. [Google Scholar] [CrossRef]
  2. Lin, Y.; Tanaka, S. Ethanol fermentation from biomass resources: Current state and prospects. Appl. Microbiol. Biotechnol. 2006, 69, 627–642. [Google Scholar] [CrossRef]
  3. Balat, M.; Balat, H. Recent trends in global production and utilization of bio-ethanol fuel. Appl. Energy 2009, 86, 2273–2282. [Google Scholar] [CrossRef]
  4. Dubey, A.K.; Gupta, P.K.; Garg, N.; Naithani, S. Bioethanol production from waste paper acid pretreated hydrolyzate with xylose fermenting pichia stipitis. Carbohydr. Polym. 2012, 88, 825–829. [Google Scholar] [CrossRef]
  5. Zhang, Z.; Macquarrie, D.J.; De Bruyn, M.; Budarin, V.L.; Hunt, A.J.; Gronnow, M.J.; Fan, J.; Shuttleworth, P.S.; Clark, J.H.; Matharu, A.S. Low-temperature microwave-assisted pyrolysis of waste office paper and the application of bio-oil as an al adhesive. Green Chem. Int. J. Green Chem. Resour. GC 2015, 17, 260–270. [Google Scholar] [CrossRef]
  6. Ioelovich, M. Waste paper-promising feedstock for bioethanol production. J. Sci. Res. Rep. 2014, 3, 905–916. [Google Scholar]
  7. Elliston, A.; Collins, S.R.A.; Wilson, D.R.; Roberts, I.N.; Waldron, K.W. High concentrations of cellulosic ethanol achieved by fed batch semi simultaneous saccharification and fermentation of waste-paper. Bioresour. Technol. 2013, 134, 117–126. [Google Scholar] [CrossRef] [PubMed]
  8. Brummer, V.; Jurena, T.; Hlavacek, V.; Omelkova, J.; Bebar, L.; Gabriel, P.; Stehlik, P. Enzymatic hydrolysis of pretreated waste paper–source of raw material for production of liquid biofuels. Bioresour. Technol. 2014, 152, 543–547. [Google Scholar] [CrossRef] [PubMed]
  9. Pivnenko, K.; Eriksson, E.; Astrup, T.F. Waste paper for recycling: Overview and identification of potentially critical substances. Waste Manag. 2015, 45, 134–142. [Google Scholar] [CrossRef]
  10. Nishimura, H.; Tan, L.; Sun, Z.; Tang, Y.; Kida, K.; Morimura, S. Efficient production of ethanol from waste paper and the biochemical methane potential of stillage eluted from ethanol fermentation. Waste Manag. 2016, 48, 644–651. [Google Scholar] [CrossRef]
  11. Dinsdale, R.M.; Premier, G.C.; Hawkes, F.R.; Hawkes, D.L. Two-stage anaerobic co-digestion of waste activated sludge and fruit/vegetable waste using inclined tubular digesters. Bioresour. Technol. 2000, 72, 159–168. [Google Scholar] [CrossRef]
  12. Wang, Y.F.; Tan, L.; Wang, T.; Sun, Z.Y.; Tang, Y.Q.; Kida, K. Production of ethanol from kitchen waste by using flocculating saccharomyces cerevisiae kf-7. Environ. Technol. 2017, 38, 316–325. [Google Scholar] [CrossRef]
  13. Claassen, P.A.M.; van Lier, J.B.; Contreras, A.M.L.; van Niel, E.W.J.; Sijtsma, L. Utilisation of biomass for the supply of energy carriers. Appl. Microbiol. Biotechnol. 1999, 52, 741–755. [Google Scholar] [CrossRef]
  14. Lebeau, T.; Jouenne, T.; Junter, G.A. Continuous alcoholic fermentation of glucose/xylose mixtures by co-immobilized saccharomyces cerevisiae and candida shehatae. Appl. Microbiol. Biotechnol. 1998, 50, 309–313. [Google Scholar] [CrossRef]
  15. Limei, Y.; Ping, X.; Lijuan, Y.; Jing, L. Determination and analysis of reducing sugar in four kinds of fruits. Guangdong Chem. Ind. 2021, 48, 243–244, 248. [Google Scholar]
  16. Raud, M.; Tutt, M.; Olt, J.; Kikas, T. Dependence of the hydrolysis efficiency on the lignin content in lignocellulosic material. Int. J. Hydrogen Energy 2016, 41, 16338–16343. [Google Scholar] [CrossRef]
  17. Sharma, V.; Nargotra, P.; Sharma, S.; Bajaj, B.K. Efficacy and functional mechanisms of a novel combinatorial pretreatment approach based on deep eutectic solvent and ultrasonic waves for bioconversion of sugarcane bagasse. Renew. Energy 2021, 163, 1910–1922. [Google Scholar] [CrossRef]
  18. Donohoe, B.S.; Decker, S.R.; Melvin, P.T.; Himmel, M.E.; Vinzant, T.B. Visualizing lignin coalescence and migration through maize cell walls following thermochemical pretreatment. Biotechnol. Bioeng. 2008, 5, 913–925. [Google Scholar] [CrossRef] [PubMed]
  19. Hickert, L.R.; Da Cunha-Pereira, F.; de Souza-Cruz, P.B.; Rosa, C.A.; Ayub, M.A.Z. Ethanogenic fermentation of co-cultures of candida shehatae hm 52.2 and saccharomyces cerevisiae icv d254 in synthetic medium and rice hull hydrolysate. Bioresour. Technol. 2013, 131, 508–514. [Google Scholar] [CrossRef]
  20. Gírio, F.M.; Fonseca, C.; Carvalheiro, F.; Duarte, L.C.; Marques, S.; Bogel-Bukasik, R. Hemicelluloses for fuel ethanol: A review. Bioresour. Technol. 2010, 101, 4775–4800. [Google Scholar] [CrossRef]
  21. Wei, C.; Lan, S.; Xu, Z. Ultracytochemical localization and functional analysis of atpase during the endosperm development. Agric. Sci. China 2003, 2, 144–148. [Google Scholar]
  22. Liu, A.; Wang, D.; Wang, Z.; Wu, X.; Qi, H.; Deng, M.; Wang, K.; Chen, L. A saccharomyces cerevisiae strain with high tolerance:breeding by gradual acclimation and fermentation performance. Microbiol. China 2024, 51, 1018–1032. [Google Scholar]
  23. Xu, W.; Ln, C.; Fu, X.-Y.; Ma, T.-T.; Fu, D.-W.; Wang, W. Isolation of low ph resistant yeast and its adaptability to acid stress environment. Sci. Technol. Food Ind. 2019, 40, 112–117. [Google Scholar]
  24. Qin, Z.; Lai, J.; Liu, B.; Liu, J. Raman spectroscopic analysis of ethanol fermentation atvarious initial pH levels. Chin. J. Lasers 2013, 40, 0215001. [Google Scholar]
  25. Palmqvist, E.; Hahn-Hägerdal, B. Fermentation of Lignocellulosic Hydrolysates. II: Inhibitors and Mechanisms of Inhibition. Bioresour. Technol. 2000, 74, 25–33. [Google Scholar] [CrossRef]
  26. Mussatto, S.I.; Roberto, I.C. Chemical characterization and liberation of pentose sugars from brewer’s spent grain. J. Chem. Technol. Biotechnol. 2006, 81, 268–274. [Google Scholar] [CrossRef]
  27. Palmqvist, E.; Hahn-Hägerdal, B. Fermentation of lignocellulosic hydrolysates. I: Inhibition and detoxi®cation. Bioresour. Technol. 2000, 74, 17–24. [Google Scholar] [CrossRef]
  28. Tengerdy, R.P.; Szakacs, G. Bioconversion of lignocellulose in solid substrate fermentation. Biochem. Eng. J. 2003, 13, 169–179. [Google Scholar] [CrossRef]
  29. Yalcin, S.K.; Ozbas, Z.Y. Effects of ph and temperature on growth and glycerol production kinetics of two indigenous wine strains of saccharomyces cerevisiae from turkey. Braz. J. Microbiol. 2008, 39, 325–332. [Google Scholar] [CrossRef]
  30. Gamero, A.; Tronchoni, J.; Querol, A.; Belloch, C. Production of aroma compounds by cryotolerant saccharomyces species and hybrids at low and moderate fermentation temperatures. J. Appl. Microbiol. 2013, 114, 1405–1414. [Google Scholar] [CrossRef]
  31. Marquardt, J.; Yao, L.; Okada, H.; Svitkina, T.; Bi, E. The lkb1-like kinase elm1 controls septin hourglass assembly and stability by regulating filament pairing. Curr. Biol. 2020, 30, 2386–2394. [Google Scholar] [CrossRef] [PubMed]
  32. Phisalaphong, M.; Srirattana, N.; Tanthapanichakoon, W. Mathematical modeling to investigate temperature effect on kinetic parameters of ethanol fermentation. Biochem. Eng. J. 2006, 28, 36–43. [Google Scholar] [CrossRef]
  33. Peñuela-Martínez, A.E.; Moreno-Riascos, S.; Medina-Rivera, R. Influence of temperature-controlled fermentation on the quality of mild coffee (coffea arabica l.) Cultivated at different elevations. Agriculture 2023, 13, 1132. [Google Scholar] [CrossRef]
  34. Yiguan, L.I.; Qi, W.; Xuan, H.E.; Yintao, G.; Congju, C.; Qingzhen, T.; Jianxin, C. Production of sesame-flavor baijiu in pilot-scale of temperature-controlled fermentation. Food Ferment. Ind. 2020, 46, 125–130. [Google Scholar]
  35. Pan, Z. Effects of ambient temperature on the fen liquor making. Liquor. Mak. 2015, 42, 57–59. [Google Scholar]
Figure 1. Changes in waste tissue paper fibers before and after hydrothermal pretreatment: (a) untreated; (b) hydrothermally treated.
Fermentation 10 00194 g001
Figure 2. Saccharification curves of waste tissue paper before and after hydrothermal pretreatment.
Fermentation 10 00194 g002
Figure 3. Changes in glucose, xylose, and ethanol under different yeast inoculations: (a) Saccharomyces cerevisiae; (b) mixed Candida shehatae and Saccharomyces cerevisiae; (c) Candida shehatae.
Fermentation 10 00194 g003
Figure 4. Changes in Reducing Sugars and Ethanol under Different substrates: (a) Reducing Sugars; (b) Ethanol.
Fermentation 10 00194 g004
Figure 5. Changes in reducing sugars and ethanol at different pH levels: (a) reducing sugars in the Saccharomyces cerevisiae group; (b) ethanol in the Saccharomyces cerevisiae group; (c) reducing sugars in the Candida shehatae group; (d) ethanol in the Candida shehatae group.
Fermentation 10 00194 g005
Figure 6. Changes in reducing sugars and ethanol with different yeast ratios: (a) reducing sugars without pH adjustment; (b) reducing sugars with pH adjustment; (c) ethanol without pH adjustment; (d) ethanol with pH adjustment.
Fermentation 10 00194 g006
Figure 7. Changes in reducing sugars and ethanol at different constant temperatures: (a) reducing sugars; (b) ethanol.
Fermentation 10 00194 g007
Figure 8. Changes in reducing sugars and ethanol at different temperatures: (a) reducing sugars; (b) ethanol.
Fermentation 10 00194 g008
Table 1. Components of waste paper and food waste.
ComponentsContent (%)
Tissue PaperFood Waste
Moisture2.9 ± 0.675.1 ± 0.1
Dry biomass
Ash0.37 ± 0.0199.32 ± 0.27
Cellulose61.13 ± 3.0715.2 ± 1.18
Hemicellulose28.27 ± 1.85ND a
Lignin7.69 ± 1.53ND
StarchND40.3 ± 0.1
Protein1.1 ± 0.2017.4 ± 0.30
FatND2.35 ± 0.18
C41.71 ± 2.0138.97 ± 2.27
N0.106 ± 0.03.09 ± 0.1
H6.28 ± 0.306.033 ± 0.25
NaND1.59 ± 0.37
KND0.007 ± 0.0
C/N393.4912.61
a ND: not detected.
Disclaimer/Publisher’s Note: The statements, opinions and data contained in all publications are solely those of the individual author(s) and contributor(s) and not of MDPI and/or the editor(s). MDPI and/or the editor(s) disclaim responsibility for any injury to people or property resulting from any ideas, methods, instructions or products referred to in the content.

