
Autochthonous Ingredients for Craft Beer Production
by
 , and
, and
Vanesa Postigo
1,* ,
,
Luz Mauro
1,
Teresa Diaz
2,
Roberto Saiz
2,
Teresa Arroyo
1 and
Margarita García
1 1
Department of Agri-Food, Madrid Institute for Rural, Agriculture and Food Research and Development (IMIDRA), El Encín, A-2, km 38.2, 28805 Alcalá de Henares, Spain
2
Department of Applied Research and Agricultural Extension, Madrid Institute for Rural, Agriculture and Food Research and Development (IMIDRA), La Chimenea, 28300 Aranjuez, Spain
*
Author to whom correspondence should be addressed.
Fermentation 2024, 10(5), 225; https://doi.org/10.3390/fermentation10050225
Submission received: 11 February 2024
/
Revised: 15 April 2024
/
Accepted: 18 April 2024
/
Published: 24 April 2024
(This article belongs to the Special Issue Advances in Beverages, Food, Yeast and Brewing Research, 3rd Edition)
Abstract
:Innovation in the beer market focuses on research into the different ingredients that make up this popular and sought-after beverage. Some of these innovations have focused on the use of autochthonous ingredients, which bring added value to products, reduce production costs and environmental impact, and provide beers with special organoleptic characteristics. This study focuses on the use of autochthonous ingredients from the Community of Madrid and the design of four recipes that are suited to these ingredients and consumer demand. In terms of the ingredients used, the micromalting of barley grown in the CM was carried out, while hops (Cascade variety for bittering hops and wild hops Rayo verde Tajuña and Torreta Tajuña for aroma) and yeast strains (Saccharomyces cerevisiae G 520 and G 354) were selected from previous studies, which were also sourced from the CM. For the barley malt, parameters such as protein content were determined, which was at the maximum limit but did not affect the final quality of the beers. The content of α- and β-acids in the hops was also determined, being higher in the Cascade variety. Different physicochemical analyses (GC, aromatic compounds, bitterness, colour, SO2, polyphenols, and antioxidant capacity) were carried out to determine the quality of the beers obtained from the four recipes designed, as well as tastings by a panel of experts and consumers. Finally, two recipes were rated the best by a panel of experts and consumers, where the cereal, hop, and fruit flavours stood out for their aromatic profile.
1. Introduction
Beer is a globally appreciated and consumed beverage. In recent years, the beer sector has seen its market increase as consumers increasingly demand more craft beer [1]. This is why brewers have sought innovation in the revival of beer styles, the use of new ingredients, and new methods for brewing low-ethanol beer [2]. However, the growth in the industry has been influenced by the COVID-19 pandemic. Many craft breweries were affected, but the rest sought adaptive solutions, such as the use of alternative resources [3,4,5]. As part of the search for new ingredients, there is a commitment to using ingredients that are specific to a region in order to promote local agriculture, as well as the use of resources (hops and wild yeasts) that have not yet been exploited in the field of beer. With this in mind, there is a great deal of interest in the ingredients within the brewing process, namely water, barley malt, hops, and yeast. Indeed, the use of raw materials other than the usual ones or from other cultivars could bring different flavours, aromas, and sensory attributes to beer [6]. Additionally, the use of indigenous resources could reduce production and supply costs, as well as create added value to the final products.
Water is a key ingredient in brewing, and the quality of the beer depends on it, as it influences several parameters such as wort pH, yeast flocculation, α-amylase activity, hop utilisation, colour, mouthfeel, and palatability of the final product [6,7,8,9]. In order to obtain a particular style of beer that resembles those produced in their cities of origin, a number of adjustments are made to the mineral composition of the water (mainly carbonate, sulphate, iron, and manganese) to avoid undesirable sensory attributes, colours, or flavours.
One of the main ingredients in beer production is cereals, which mainly provide nutrients in the form of sugars for fermentation to take place. The sugar found in cereals is starch, but this must be hydrolysed by the action of enzymes to transform it into sugars that can be fermented by yeasts. This process is called malting and consists mainly of germinating the cereals, which are then dried and kilned. The different types of malts are obtained according to temperatures and kilning times, such as base malts (pale), special malts (caramel), and roasted malts (chocolate, coffee), in order to be able to produce different styles of beer [10]. Barley (Hordeum vulgare L.) and wheat (Triticum durum Desf. and Triticum aestivum L.) are the most widely used cereals in the malting industry, with barley malt accounting for around 90% of the world’s production [10]. Moreover, the use of regional cereal cultivars means the regionalisation of beer and the addition of value to beer.
The next indispensable ingredient in brewing beer is hops (Humulus lupulus L.), the importance of which lies in their bitterness, which contributes to the characteristic aroma and flavour of the beer. These sensory characteristics depend on the hop variety used, as well as its format (flower, pellet, or extracts) [6]. Brewers traditionally divide hops into two categories: those that are used for their bittering contribution, where the best known are Target, Admiral, Nugget, Pride of Ringwood, and Super Pride, and those that provide pleasant hop aromas, such as Fuggles, Goldings, Saaz, Willamette, Cascade, and Cluster. Hops are also geographically related, so they are divided according to their origin (American, German, British, and European) [6].
Another important ingredient in beer brewing is yeast since, during fermentation, in addition to producing CO2 and ethanol, it produces aromatic compounds that contribute to the beer organoleptic profile, as well as the production of other byproducts that can contribute antioxidant capacity to the beer, among other characteristics. Therefore, because of these characteristics that can contribute to the organoleptic profile of beers, they are considered as indigenous ingredients of certain regional beers, such as the Münchener Bier [11]. The yeasts used to brew beer are mainly divided into two groups: ale and lager. Ale beers are made mainly with yeasts of the genus Saccharomyces cerevisiae and are capable of fermenting at warmer temperatures (16–22 °C), in addition to fermenting at the top of the fermenter. In the lager group, yeasts that are the natural hybrid between the species of S. cerevisiae and Saccharomyces bayanus, known as Saccharomyces pastorianus (syn. Saccharomyces carlsbergensis), are used. These yeasts ferment at lower temperatures (6–16 °C) and carry out the process at the bottom of the fermenter [12]. Since they are a fundamental ingredient, cultivar starters are increasingly being demanded in brewing, and scientists and brewers have focused on being able to bring added value to beer.
This project aims to offer a first approach to the production of beer through the use of autochthonous raw materials from the Community of Madrid (water, barley malt, hops, and yeasts), as well as the design of recipes that enhance these ingredients and meet the demand of the regional craft beer consumer.
2. Materials and Methods
2.1. Beer Ingredients
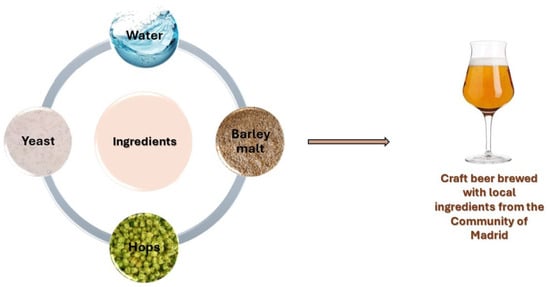
The ingredients used in brewing for the different recipes were water, malted barley, hops, and yeast, all of which were obtained in the Community of Madrid. Each of these ingredients contributes to the final taste and aroma of the beer.
2.1.1. Water
Water makes up 90% of the beer in terms of quantity. Thus, it must meet chemical and microbiological requirements, as well as certain parameters that will affect clarity, flavour, odour, the absence of colour, and, thus, the quality of the beer. Factors that can contribute to water quality, therefore, are pH, alkalinity, ion concentration, and microbial counts, as well as the absence of disinfection byproducts.
The water used for the brewing process showed the following characteristics (Table 1), as measured with CDR FoodLab kits and equipment (CDR s.r.l, Florence, Italy).
In order to obtain a pH suitable for fermentation, a total CaSO4 (Brewferm, Beverlo, Belgium) addition of 59 g was carried out during the mashing and washing of the grain.
2.1.2. Barley Malt
The cereal used for the recipe design was the barley of the two-row Beka variety. This cereal was sown in an experimental field belonging to the IMIDRA Institute in Aranjuez, which belongs to the Community of Madrid. Once collected, the basic parameters, such as germination capacity (100%), germination energy (97.5%), and total protein (14.95%), were analysed. The malting process of the barley was then carried out to promote the synthesis of enzymes necessary for the subsequent hydrolysis of starch into fermentable sugars. A micromalting process was performed, according to the following phases:
- Steeping phase: Grains were soaked with tap water at 18 °C for 7 h, followed by a water-free rest period of 17 h at 18 °C. This phase was carried out over 48 h with a final rest period of 48 h, by which time the first rootlets had appeared.
- The germination phase was carried out for 48–72 h at 18 °C, maintaining humidification and oxygenation during the entire process. This phase was finished once the roots and plumule had reached the same length, with the final water content of the barley grains being 40%.
- The kilning phase was conducted in forced-air ovens at a temperature of 52 °C for 24 h, followed by 2 h at 80 °C. In addition, part of the malt obtained was also kilned at 150 °C for 1 h. The final water content was less than 5%.
After the malting process, the malt was stored in hermetically sealed bags at 14 °C. The barley malt obtained was analysed by the AETCM Laboratories (Spanish Association of Beer and Malt Technicians, Coslada, Madrid, Spain), certified according to the UNE-EN-ISO 9001:2015 standard [13] for the following parameters: congress mash (EBC Methods 4.5.1 and 4.5.2 [14,15]), colour (EBC Method 4.7.1 [16]), β-glucans (EBC Method 4.16.3 [17]), soluble nitrogen (EBC Method 4.9.1 [18]), total nitrogen (EBC Method 4.3.1 [19]), Kolbach index (MEBACK Method R-205.12.999 [20]), and diastatic power (EBC Method 4.12.1 [21].
2.1.3. Hops
Hops are responsible for providing bitterness to the beer, as well as aromas; thus, for the design of the recipes, the Cascade variety was used as bittering hops and two wild varieties isolated from the Tajuña area (Madrid, Spain) were used as aromatic hops. Both the commercial and wild varieties were grown on an experimental field as well as the barley, in Aranjuez. These varieties were selected from previous trials to produce the best yields for cultivation in the region. After harvesting, the hops were analysed by AETCM Laboratories for the following characteristics: essential oils (EBC Method 7.10 [22]), polyphenols (EBC Method 7.14 [23], and α and β- acids (EBC Method 7.7 [24]).
2.1.4. Yeast Strains
Two S. cerevisiae yeast strains, previously selected for their adequate organoleptic profile and fermentation characteristics for brewing production [25], were used in this project:
- S. cerevisiae GENL 520: The beers brewed with this yeast were mainly characterised by a fruity profile, with a banana aroma and flavour, as well as being phenolic. The beers showed medium bitterness, high body, and persistence. The balance between aroma and flavour was high.
- S. cerevisiae GENL 354: The beers brewed with this strain were noted for their sweet, fruity taste and accentuated bitterness. They showed a medium body, as well as low persistence, which makes the beer more drinkable. The beers were balanced in aroma and flavour.
2.2. Recipes, Wort Obtention, and Fermentation 16 L
The recipes were designed to produce a pale ale beer style, which could be accepted by the general public. Four recipes were brewed, where the variations were carried out in the yeast strains and hops added for aroma (Figure 1).
The mashing conditions for obtaining the beer wort were an initial volume of 11 L at 63 °C for 1 h, and then 15 L wash water at 65 °C. The bittering hops were added from minute zero during the wort boil, whereas the aroma hops were added at minute 40. The final volume of beer wort obtained was 15–16 L, with a density of 10.34 ± 0.54 °P and a pH of 5.45 ± 0.10. After the beer wort was obtained, it was cooled and transferred to 20 L atmospheric fermenters locked with a Müller valve to allow the CO2 to escape from the system, where fermentation was performed at 18 °C with an inoculum concentration of 106 cells mL−1. The fermentations were carried out in duplicate using inoculums grown sequentially in YPD broth medium (1% bacteriological peptone, 2% yeast extract, and 2% glucose; all w/v) (Condalab, Madrid, Spain) at 28 °C for 48 h. The fermentation evolution was controlled daily by sugar density and temperature measurements until constant density values (two days in a row with the same measurement).
After fermentation was completed, 7 g L−1 of glucose (Condalab, Madrid, Spain) was added, bottled, and left at around 20 °C for carbonation for 1 week. It was then stored at 4–5 °C for at least one month for maturation.
2.3. Fermentation Control and Determination of Yeast Concentration during the Process
Triplicate samples were taken daily for every fermenter during beer elaboration trials. The samples (1 mL) for the qPCR study were centrifuged, and the pellets were immediately cryopreserved until Real-Time quantitative PCR analysis. For total cultivable yeast counts, samples correctly prediluted were spread on YPD plates using an automatic plater of Petri dishes (easySpiral®, Interscience, St. Nom, France). For colony counting, the manufacturer’s instructions were followed.
DNA Extraction and Real-Time qPCR Assays
The DNA extraction from yeast pellet samples was carried out using the DNeasy Plant mini kit (QIAGEN, Valencia, CA, USA), as described previously [26,27]. Yeast cell pellets were washed twice with sterile water. Previous to DNA extraction, the cells were subjected to physical break-down with 700 µL of AP1 buffer into 2 mL microcentrifuge tubes containing 0.5 mm diameter glass beads. The tubes were shaken at the maximum rate in a mixer mill (Retsch Gmbh, Haan, Germany) and centrifuged for 1 min. Subsequently, the supernatant was transferred to a sterile tube and purified according to the manufacturer’s manual.
The qPCR analysis was carried out on QuantStudio™ 5 (Applied Biosystems, Carlsbad, CA, USA) equipment. The PCR reactions were performed in optical-grade 96-well plates (Applied Biosystems), with 25 µL final volumes containing 5 µL of DNA template, 0.7 µM of primers (SC1 and SC2; [28]), and 12.5 µL of SYBR Green Master Mix (Roche Diagnostics Gmbh, Mannheim, Germany). Triplicate samples were used. The amplification conditions were as follows: 95 °C for 10 min, 40 cycles of 95 °C for 15 s, 60 °C for 1 min, and 72 °C for 30 s.
Previously, standard curves for each S. cerevisiae strain were created by plotting the cycle threshold (CT) values of the qPCR performed on a dilution series of yeast cells in YPD media (108 to 103 cells mL−1) against the log input cells mL−1. From the slope of standard curves, the amplification efficiency (E) was calculated using the formula E = (10−1/slope) − 1 [29].
2.4. Beer Analyses
After the maturation phase, the beers were analysed for different parameters. All beers were previously degassed to carry out the analyses using a grade 2 V (Whatman, Maidstone, UK) filter.
2.4.1. CDR FoodLab
The CDR FoodLab (BeerLab 1.6.2 software, www.cdrfoodlab.com (accessed on 15 January 2024), verified by the international reference analysis laboratory Campden BRI (www.campdenbri.co.uk, accessed on 15 January 2024), was used to determine the following parameters in beer: colour (range 1–100 EBC—European Brewing Convention), bitterness (range 5–100 IBU—International Bitterness Unit), lactic acid (d + l) (range 150–3500 mg L−1), vicinal diketones (VDKs) (range 0.05–2 mg L−1), polyphenols (range 5–550 mg L−1), and SO2 (range 1–30 mg L−1). The equipment is based on enzymatic reactions and spectrometric measurements for the determination of the different parameters.
2.4.2. Volatile Compounds
A gas chromatograph 6850 (GC-FID, Agilent Technologies, Inc., Santa Clara, CA, USA) equipped with a flame ionisation detector was used for the identification of the volatile compounds. A total of 33 major aromatic compounds were determined and grouped into families: higher alcohols, esters, acids, aldehyde-ketones, lactones, and phenols. A DB-WAX (60 m × 0.32 mm i.d. and 0.5 µm film) column was used (Agilent Technologies, Inc., Santa Clara, CA, USA). The carrier gas used was helium with a flow of 2 mL min−1. The oven temperature started at 40 °C for 5 min and was increased to 200 °C at a rate of 3 °C min−1. The splitless injection mode was used, and the temperatures of the injector and detector were set to 200 °C. The extraction of volatile compounds was carried out according to the method from Ortega et al. [30] based on liquid-phase microextraction with dichloromethane (DCM, Panreac, Barcelona, Spain). Briefly, the beer samples (2.7 mL) were shaken for 90 min at 250 rpm together with bi-distilled water (6.3 mL), ammonium sulphate (3.9 g) (Panreac-AppliChem, Barcelona, Spain), DCM (250 µL), and the internal standards (20 µL of each). Subsequently, the vials were centrifuged, and the aliquot was collected and deposited at the bottom, where the aromas were extracted. The identification and quantification of compounds were performed using four internal standards (2-butanol, 4-methyl-2-pentanol, 4-hydroxy-4-methyl-2-pentanone, and 2-octanol). The levels of the different compounds were determined by calibration lines for each compound (R2 = 0.9830–0.9999). Each sample was analysed in triplicate.
2.4.3. Residual Sugars, Glycerol, and Ethanol Determination by HPLC
Analyses (fermentable sugars: maltotriose, maltose, glucose and fructose, glycerol and ethanol) were carried out on a Thermo HPLC system consisting of a Dionex Ultimate 3000 (Thermo Scientific, Waltham, MA, USA) equipped with a quaternary pump and an autosampler, a column compartment provided with a temperature controller, and a 520 refractive index detector (ERC). Chromatographic separations were performed on an ion-exclusion column, Rezex ROA-Organic Acid H+ (8%), 150 × 7.8 mm (Phenomenex, Torrance, CA, USA) using water with hydrogen sulphide (0.005 N, HPLC grade, Panreac, Barcelona, Spain) in the mobile phase with a flow rate of 0.6 mL min−1 at 60 °C. The injection volume was 10 μL. The samples were previously filtered through a 0.22 µm filter. All calibrations produced a linear response with an R2 value > 0.9991 over the concentration range analysed.
2.4.4. Antioxidant Capacity
The antioxidant capacity of beers was measured using an e-BQC lab device (Bioquochem, Asturias, Spain, www.bioquochem.com, accessed 15 January 2024) with TEAC assay (Trolox Equivalent Antioxidant Capacity). The device measures the redox potential of the samples and expresses it in micro-Coulombs (μC) [31]. The measurements are expressed as two values: one indicating the antioxidant capacity of compounds with the highest rate of free radical scavenging (Q1) and the other one with the lower rate of free radical scavenging (Q2). For the TEAC assay, a solution of 6-hydroxy-2,5,7,8-tetrametilchroman-2-carboxylic acid (Trolox 8 mM L−1 in methanol 5% and pH 4.5) (Sigma, Aldrich, São Paulo, Brazil) was used. A Trolox calibration curve was elaborated (Q1, R2 = 0.9974; Q2, R2 = 0.9876; QT = Q1 + Q2), with the different concentrations versus the measurements obtained with the e-BQC equipment, where the antioxidant activity of the beers was expressed as millimoles of Trolox equivalents per litre (mmol TE L−1).
2.5. Organoleptic Profile
Sensory evaluation was performed by twelve trained and experienced panellists (seven male and five female). Different descriptors were used to describe their absence or presence level on a scale from 0 to 5. Three groups of attributes were evaluated on the basis of appearance (colour and foam retention), aroma (yeast, fruity, banana, phenolic, diacetyl, and hop), and taste (alcohol, sweet, salty, acidic, bitterness, astringency, effervescence, warmth, slickness, and body). The tasting tests were conducted in a suitable room, and the beer samples were kept at room temperature for 30 min prior to testing. All beer samples were numbered and anonymous. The average of the main results was plotted in a radar chart for the different attributes analysed for each beer. This analysis allows us to carry out a formal descriptive analysis of each of the beers since, by evaluating the intensity of each attribute, we can obtain an aromatic profile of the beers. In addition, and together with the overall evaluation of the beers, we can rate the overall quality of the beers (EBC Method 13.10) [32].
2.6. Consumer Analysis
A total of 110 consumers (55 male and 55 female), regular users of beer between 18 and 75 years of age (24 between 18 and 36 years, 39 between 37 and 56 years, and 47 between 57 and 75 years old), participated in the consumer tests. The consumer test was conducted in the sensory room from IMIDRA in individual booths. Beer samples (50 mL) were served at 10 °C.
Hedonic (attribute-diagnostic questionnaire) and purchase intent ratings were obtained from the consumers during the tasting session, in which consumers tasted one set of four beers. The 9-point hedonic scale was used for bitterness, acidity, and overall impression scaling (where 1 = extremely dislike, 5 = neither like nor dislike, and 9 = extremely like) and the rest of the attributes were analysed according to check-all-that-apply (CATA) questions [33]. The questionnaire was displayed to consumers using the Sensesbit 1.6.2 software (TasteLab, Galicia, Spain, www.sensesbit.com, accessed 15 January 2024).
2.7. Statistical Analysis
The data obtained from chemical analysis, aroma compounds, and antioxidant capacity were statistically analysed, and their means and standard deviations are presented. The statistical processing of data was carried out using R Studio 4.1 software (Integrated Development for R. RStudio, PBC, Boston, MA, USA). The applied methods used PCA and a correlation matrix to visualise the samples of beer in an n-dimensional space and define the samples associated with the different parameters analysed. The one-way ANOVA test with Tukey post hoc test on a significance level of p < 0.05 was also used to identify the homogenous groups between samples. The identification of significant data correlation was performed with the Pearson test.
3. Results and Discussion
3.1. Ingredient Characteristics
3.1.1. Barley Malt
Barley cereal is the main ingredient used for brewing beer, and two types of barley can be used: six-row and two-row. Their main difference is that two-row barley produces a malt with a lighter extract, lighter colour, and lower enzyme content than six-row barley [34]. In order to determine the quality of the barley, different parameters such as the hot water extract (HWE) of the kernel, kernel weight, β-glucan and protein content, friability, α-amylase activity, viscosity, and soluble nitrogen ratio (SNR) were analysed [35,36]. In order to carry out the brewing process, the barley must be malted, a process which increases enzyme activity, soluble proteins, and the availability of polysaccharides (starch) [37]. Malting is the process of incompletely germinating cereal grain, where, due to a series of enzymatic degradations of the grain endosperm, starch is obtained. During the mashing process, the starch is degraded by enzymatic reactions to the fermentable sugars necessary for the alcoholic fermentation by the yeasts. Malting consists of three phases: steeping to ensure good water absorption by the grain (between 15% and 40% moisture); germination to allow partial embryo growth, enzyme synthesis, and partial endosperm breakdown; and kilning to ensure the stability of the product. Table 2 shows the results obtained from the malting process.
The total protein of the barley was 14.95%, which is within the normal range for barley (between 8% and 15%) [37]. In general, a high protein content in barley is not desirable for brewing, as it can affect the carbohydrate content of the barley, reducing it [38,39]. Likewise, a high protein content can contribute positively to foam stability and negatively to beer haze [36]. However, both parameters were positively assessed by the tasting panel of experts, as well as the consumers. This could, therefore, be one of the reasons for the low density found after mashing. Compared to other studies [40], total protein content, germination capacity, and germination energy were found to be similar.
Regarding the parameters analysed for barley malt, in the congress mash, the filtration time was less than 1 h (considered a normal time for the modification of β-glucans [40]). Filtration times of less than 1 h can speed up the wort brewing process and make it necessary to use less time in the brewing process. For the saccharification rate (10 min), the values were between the normal range of saccharification (10–15 min [40,41]). Saccharification is the process by which the complex sugars (starch) present in barley are hydrolysed to simpler sugars by β-amylase so that they can be used by yeast to produce beer, which is why, in this case, barley malt presented a good saccharification time. The pH of the wort obtained with this malt was 5.96, which would be within the specific range of the European Beer Convention. This pH would be similar to that obtained by this variety in other locations [42]. It has been shown that pH values between 5 and 6.6 can affect the photolytic activity of malt [43]. Additionally, the pH value can affect yeast growth during fermentation, which is the reason pH adjustments were subsequently made with calcium sulphate, and as in the preliminary trials, the onset of fermentation was delayed.
The colour of the malt obtained was 4.5 EBC, despite not being a malt variety specified by the EBC. The variations in wort colour may be due to the malt kilning process but can also be influenced by non-enzymatic browning reactions; the Maillard reaction, which takes place during kilning in the malting process; and the boiling of the wort in the brewing process. Here, sugars interact with amino acids, producing a variety of odours and flavours. This reaction is the basis of the aroma industry, and the type of amino acid involved determines the resulting flavour and colour [44].
Β-glucans are an important factor in determining their water solubility, viscosity, and gelatinisation [45]. A high β-glucan content can lead to an increase in viscosity, which causes a reduction in the filtration rate and high turbidity of the beer. This is why brewers demand a β-glucan content of less than 178 mg L−1 [46]. The value obtained in this case in the micromalting was 217.15 mg L−1 of β-glucans; however, as mentioned above, the results in terms of filtration were optimal, as well as the appearance of the beer, as will be seen later in the tasting.
The soluble nitrogen content was 5.85%, which is an adequate amount of amino acids that is essential for the subsequent fermentation of proteins [47].
The Kolbach index indicates the proteolytic enzyme content of the malt as well as its disaggregation. Therefore, its importance is also related to the total nitrogen content, as it expresses the ratio between the soluble nitrogenous components determined in the wort and the total content of the nitrogenous components in the malt. The usual range of this index is from 36 to 44% [48]. The obtained value was 40.50, similar to the results shown by Bravi et al. [49]. Another study compares the Kolbach index in barley malt and buckwheat malt [50], with the value for barley malt (38%) being similar to that obtained in the present study (40.50%). In contrast, these authors concluded that in the case of the buckwheat malt samples (Kolbach index, 24–26%), there was insufficient disaggregation, and, thus, we recommend the use of exogenous proteolytic enzymes during the mashing process.
The diastatic power determines the combined activity of the enzymes β-amylase, α-amylase, dextrinase, and α-glucosidase, which hydrolyse starch to obtain fermentable sugars (maltose, maltotriose, glucose, fructose, and sucrose) [51]. The diastatic power of the malt was 399.00 °WK, which is within the optimum range of 152–500 °WK [21]. These values were also higher than those obtained in other studies where the commercial varieties were analysed with an average diastatic power of 273 °WK [52].
3.1.2. Hops
Hops are another important ingredient of beer. The unfertilised female inflorescences of this plant, which belongs to the Cannabaceae family, were used. The importance of this ingredient lies in the fact that it provides bitterness as well as contributes to the characteristic aroma and flavour of the beer. Hops also contribute other characteristics to the quality of the beer, as they improve the formation and stability of the foam and have antibacterial properties, thus protecting it from the deterioration caused by certain micro-organisms in the beer [53]. The key compounds in hops that give these characteristics to beers are resins and essential oils. Table 3 shows the values obtained for the essential oils, α-, and β-acids, as well as the polyphenols of the hops used in the recipe design. The variety that showed significant differences was Cascade hops.
Resins are classified into two main subfractions: hard and soft resins. Hard resins come from the oxidation and polymerisation of soft resinous substances, while soft resins correspond to humulones (α-acids) and lupulones (β-acids). During the wort brewing process, hops are added at the wort boiling stage, where the α-acids undergo oxidative isomerisation into iso-α-acids (iso-humulones). This isomerisation is responsible for about 70% of the bitterness of the beer [54]. The resin values that can be found in the hops ranged from 2.2% to 11.5% for α-acids and 2.2% to 11.2% for β-acids [55]. In this case, there was a noticeable difference between Cascade hops, with a total of 7.89% α-acids and 4.66% β-acids, and wild hops, with a content of 1.01–1.28% α-acids and 2.66–3.31% β-acids, which is the reason that the Cascade variety was used as a bittering hop in the recipes. On the other hand, essential oils, mainly terpenoids, are extracted during late and dry hopping and are responsible for the aroma of the beer [56]. The essential oil content of hops usually ranges between 0.5% and 3% [57], and, in particular, the oil content of the Cascade hops is between 0.7% and 1.4% [58]. In this case, the Cascade variety cultivated in the Madrid region has an oil content inferior to the minimum varietal oil content. Despite the low content of wild hops, sensory differences were observed between the beers brewed with each of these hops. The variety of hops used contributes to different sensory attributes perceived in the beer [59].
The polyphenols from hops play an important role in beer. They modify certain characteristics of beer, such as bitterness, astringency, body, and fullness, as well as imparting antioxidant capacity to the beer. During wort boiling, about 70% of the total polyphenols in the beer are extracted from the hops, although their final concentration depends on their polarity as well as their tendency to form complexes with the proteins present in the wort [60,61]. The content of polyphenols that can be found in the dry matter of hops can vary between 4.5% and 16% [55], so in this case, where the three hops were used, the concentrations found were lower (between 0.59% and 1%). In the study carried out by Rodolfi et al. [58], clear differences were observed in the production of xanthohumol (the major polyphenol found in hops with antioxidant properties), depending on the area of cultivation, with the highest concentrations found in those from German areas.
3.2. Study of Yeast Inoculated Population during Beer Fermentation
Most investigations using the qPCR application in beer had been directed at the detection of spoilage microorganisms during beer elaboration [62,63,64]. In the current work, this qPCR technique was used to monitor inoculated S. cerevisiae strains in beer fermentation in comparison with a culture-dependent method. The S. cerevisiae strain populations were monitored using YPD plates for the total cultivable cells and by qPCR for total yeast populations (Figure 2). In order to determine the sensitivity and detection limits of the qPCR, standard curves of each S. cerevisiae strain (G 520 and G 354) were performed with the same pair of primers, and Table 4 shows the slope, intersection, correlation coefficient (R2), and efficiency of the standard curves. The assays were linear over six orders of magnitude, and the detection limits for both strains were at concentrations as low as 103 cells mL−1.
The influence of the beer wort matrix on qPCR efficiency in comparison with YPD media was studied in previous works [27]. It was reported that the differences observed were not statistically significant (p < 0.05); thus, the construction of standard curves in different matrices does not substantially change the results, and YPD can be used to quantify the yeast population in beer fermentation.
The S. cerevisiae yeast strains used in the present work were isolated from the final phase of fermentation in Tempranillo (G 520) and in Garnacha (G 354) wine elaboration from wineries belonging to D.O.P. “Vinos de Madrid”. Currently, numerous studies focus on craft beer production with Saccharomyces strains from different sources, but these focus on potential capacity in brewing [25,65,66,67]. In a previous work [25], G520 and G354 strains were not able to consume all maltotriose and maltose of wort. However, both showed a good performance, with an apparent attenuation of 72% in comparison with that of the commercial strain S-04 (82.2%).
It is worth noting that the density values (Figure 2) decreased until the third day for both trials and both S. cerevisiae strains when the slow decrease in density coincided (in time) with the stabilisation of S. cerevisiae populations. During the fermentation of recipes A and B, with the difference being the aroma hops used (Rayo Verde Tajuña), the cell concentration measured by plating and qPCR was similar. However, cell growth in G 520 beer elaboration was higher than in G 354 beer, with a maximum cultivable population of 6.79 × 10⁷ cells mL−1 (day 5) with respect to 5.94 × 10⁷ cells mL−1 (day 5). In addition, its fermentative capacity also seemed to be greater, ending with a final sugar density of 2.75 °P in G 520 and 3.40 °P in G 354. In recipes C and D (aroma hop Torreta Tajuña), this could be seen, as there were greater differences in cell enumeration between plating and qPCR. In this case, it was the G 354 beer that reached the highest cultivable cell concentration, with a value of 6.69 × 10⁷ cell mL−1 (day 4) and 5.47 × 10⁷ cell mL−1 (day 3) for the G 520 beer. As for the sugar density values, there were no major differences between the final levels (3.30 °P in the G 520 beer and 3.60 °P in the G 354 beer).
In all cases (Figure 2), it was found that cell quantification was very similar for plating and for qPCR during the first day of fermentation. The exponential phase occurs until 2–3 days of fermentation, the stationary phase occurs around day 3, and the cell death phase occurs until the end of fermentation on day 5. In contrast, the qPCR analysis reported the highest values of total yeast in all subsequent days. This might be because of the viability of yeasts, and, therefore, its cultivable state is more favourable in the first 24 h. Then, the differences observed in enumeration between plating and qPCR would be due to the presence of dead cells in the sample since the qPCR technique detects both viable and dead cells. These results are in accordance with other works [68,69]. However, this behaviour is most commonly noted for recipes C and D in comparison with recipes A and B, where the cell concentration is very similar for both analysis methods. These differences may be due to a large presence of viable but non-cultivable (VBNC) populations in beers or due to the over-estimation of yeasts by the amplification of DNA from dead yeast cells, as was also reported by Hierro et al. [68] in wine elaboration. The wort has extraneous impurities and technologically important constituents that adversely influence the yeast cells. On the one hand, it was described that plant polyphenols increase the biological stability in a final beer; on the other hand, this can have a harmful effect on the physiological state of yeasts, culture growth, and fermentation evolution [70]. Other authors have studied the influence of α-acids from hops in connection with the growth inhibition of the brewer yeast (S. cerevisiae), in particular, the transition to hop-extract-induced VBNC S. cerevisiae [71]. The range of isomerised α-acids contents in hoppy beers is normally found between 20 and 80 mg L−1 [72,73]. Despite S. cerevisiae tolerance to certain concentrations of isomerised α-acids, such quantities affect the cellular metabolism of this yeast. Xiao et al. [71] observed that the treatment of the S. cerevisiae YS86 strain with isomerised hop extracts (300 mg L−1) induced the complete entry of the yeast into the VBNC state. Thus, yeast fermentation efficiency decreased, with lower alcohol production and higher residual sugars, as well as lower aromatics and esters in the final beer. In this study, the main difference between recipes A and B and recipes C and D is the hops used for the aroma. Contrary to previous observations by other authors [64], the highest population differences between the plating and qPCR analyses were observed for recipes C and D, which presented the lowest α-acids content (Table 3). In this case, they cannot be directly related to the differences in cell enumeration.
3.3. Physicochemical Characteristics of the Obtained Beers
3.3.1. CDR Beer Analysis
After the maturation of the beers obtained from the four different recipes, the different parameters were analysed, as shown in Table 5.
Lactic acid is formed from pyruvate during the fermentation process carried out by yeasts, with the main substrate being glucose. However, the physiological role of lactic acid production and the molecular mechanisms remain unknown [74]. The lactic acid concentration obtained in each of the recipes did not vary greatly between the recipes and yeast strains, with results ranging from 209.5 to 294 mg L−1. Likewise, none of the values exceeded the perception threshold for lactic acid (400 mg L−1) [75].
As seen above for malt, the colour of the beer is one of its main characteristics in terms of appearance. It depends mainly on the type of malt used and the melanoidins produced during the malting process. The colour values obtained were between 14.00 and 17.50 EBC, corresponding to the colour range of a pale ale beer. Some studies have related the colour of beers to the polyphenols produced during the brewing process [76,77]; however, in this case, there is no direct correlation between both parameters.
The hop used to impart bitterness to the beer in all four recipes was the Cascade variety, with the same quantity used in all of them; thus, there were no notable differences between the recipes. The bitterness of the beer can also be influenced by the yeast strains used during fermentation, as it has been shown that α-acid molecules can adhere to the yeast cell walls and settle at the bottom of the fermenter when the fermentation process is completed, thus reducing the bitterness of the beer [78,79,80]. In this case, the ranges obtained were 10.7 to 11.8 IBU, with no relationship between the yeast strains used.
The most important vicinal diketones (VDKs) to consider in beer quality are diacetyl and 2,3-pentanedione. They impart a strong toffee and buttery aroma and are, therefore, considered undesirable aromas for most beer styles. VDKs are formed by yeasts during the fermentation process as they excrete an intermediate of valine synthesis, α-acetolactate, which spontaneously decarboxylates to diacetyl. The total VDK value obtained in the different beers was statistically significant and ranged between 0.10 and 0.29 mg L−1, with the perception threshold for diacetyl and 2,3-pentanedione being 0.15 and 0.9 mg L−1, respectively [81]. However, none of these undesirable aromas were detected in both the expert panel tastings and the consumer tastings. When comparing these results with those previously observed using these yeasts [25], strain G 520 produces higher concentrations of VDKs. Additionally, its increased production may be due to an increase in the amount of proteins available in the beer wort, as they are the main source for yeast metabolism [82].
Yeasts also produce SO2 from the amino acids cysteine and methionine during fermentation. The importance of this lies in the fact that it is a compound that acts on the stability of beer flavour, as well as having antioxidant capacity [83]. The taste threshold for SO2 is 25 mg L−1; thus, in none of the beers was this exceeded (from 3.80 to 12.45 mg L−1). Therefore, even if it was added to the beer at a later stage to provide stability, it would still be below the threshold [84,85]. SO2 can be found either free or in the form of bisulphite when bound to carbonyl compounds, masking its bad taste and thus slowing down the oxidation process of the beer [86]. Several studies have related SO2 concentration to parameters such as fermentation temperature, wort pH, yeast composition, oxygenation composition, wort oxygenation, and the enzymes active in the sulphur metabolism pathway [86,87]. According to studies carried out by Pickerell et al. [83], lower glycogen content in the wort could lead to poor yeast growth and, thus, increase SO2 production. Further studies would be needed to determine this; however, according to the results obtained from the yeast concentration throughout the fermentation process, the yeast population was not affected. In contrast, the studies performed by Duan et al. [87] also did not give similar results to those from this project, where a high protein concentration led to an increase in SO2 production.
Polyphenols are compounds with an antioxidant character, as they are involved in the elimination of free radicals and the chelation of metals. The major contribution of polyphenols in beer comes from malt and hops. These compounds can also influence bitterness and beer astringency [57]. These compounds are also modified during beer storage, as they react with proteins and form high molecular weight species and haze. The values detected in the beers obtained (ranging from 267.5 to 327.5 mg L−1) were found to be within the average for other commercial beers (between 270 and 600 mg L−1) [88]. Likewise, according to the tasting results, bitterness and astringency were not influenced by these polyphenol values. Similarly, there was no clear correlation between polyphenols and antioxidant capacity in this study. These results are not in agreement with those reported in other works [89,90]. There were also no significant differences between the different recipes.
3.3.2. Residual Sugars, Glycerol, and Ethanol Determination Using HPLC
Table 6 shows the results obtained for the four recipes after fermentation. The data were statistically significant, with differences between the recipes. As can be seen, the apparent attenuation was similar for both yeast strains (ranging from 67.5% to 69.5%), with the expected values being the same as those in previous trials (72% for both) [25].
As for residual sugars, both strains fermented glucose and fructose completely, leaving only residual maltose and maltotriose with similar values. Similar maltose and maltotriose fermentation results were obtained when these strains were pre-selected from previous trials [25]. The presence of residual sugars can influence the physical properties of the beer, such as viscosity, thus contributing to a fuller-bodied beer, as well as a stronger mouthfeel [91,92]. Similarly, the beers obtained using the different recipes had similar ethanol values between 3.05% and 3.33% (v/v). Another parameter resulting from fermentation that was assessed was glycerol, as it also contributes to the body and mouthfeel of the beer [93,94]. The concentration of this compound in the beer is related to cell growth rate, ethanol production, and sugar utilisation. When compared to previous trials [25], where ethanol production was higher (5.07% (v/v) for both strains), the glycerol content was also higher (3.19 and 3.63 mg L−1). This fact can be contrasted with this study, as the volume of alcohol was lower, and, therefore, the glycerol values were between 1.47 and 1.72 mg L−1.
3.4. Main Volatile Compound Production
The final quality of beer is due to many factors, including the aroma compounds produced during brewing. There is a large number of aroma substances in beer, which can be categorised into different groups, such as esters, higher alcohols, fatty acids, aldehydes, ketones, hydrocarbons, ethers, sulphur compounds, alicyclic compounds, aromatic compounds, and heterocyclic compounds, among others. These compounds can individually, synergistically, or antagonistically influence both the aroma and flavour of beer [95,96,97,98,99,100]. These compounds can also come from the different ingredients used in the brewing process, either because they are part of these ingredients or because they are formed during the brewing process [54].
A total of 33 aromatic compounds were analysed, of which the main ones detected are listed in Table 7. The beers showed significant differences for all the aroma compounds analysed. Furthermore, the concentrations of the different aroma compounds were significantly higher in recipes A and C, where yeast strain G 520 was used.
Higher alcohols are the most abundant compounds in beer. There are about 80 higher alcohols in beer, the total concentration of which can be between 100 and 300 mg L−1, with their main resource being malt and yeast [54]. The same amount and type of barley malt was used for the four recipes, so the variations observed in their concentration are due to the yeast strains used. When the concentration is below 300 mg L−1, they will bring freshness and floral and pleasant notes, adding complexity to the beers [101]. The total higher alcohols produced in the beers obtained from the different recipes ranged between 104.19 and 185.40 mg L−1, with the highest concentrations produced in those recipes where the G 520 yeast strain was used (recipes A and C). The concentrations of the higher alcohols detected were similar for the four recipes, except for isobutanol, isoamyl alcohol, and β-phenylethanol, for which higher concentrations were obtained in the recipes where yeast strain G 520 was used. Likewise, only values above the perception threshold (70 mg L−1) were obtained for isoamyl alcohol [102]. This compound contributes sweet, alcoholic, and banana flavours. In general, strains selected for ale fermentations have been found to produce higher concentrations of higher alcohols than lagers [103].
The second most important group of aromatic compounds found in beer are esters because, although they are found in low concentrations, their perception thresholds are low. These compounds can come from malt, hops, or yeast and can be formed at any time during the brewing process [54]. As with the higher alcohols, the highest concentrations occurred for recipes A and C (between 3.13 and 3.60 mg L−1). As for the concentrations of the different compounds detected, isoamyl acetate and ethyl hexanoate were the ones for which values above the threshold were obtained (1.4 mg L−1 and 0.21 mg L−1, respectively) [104,105]. Isoamyl acetate contributes banana aromas, while ethyl hexanoate contributes green apple aromas. In spite of this, these aromas did not stand out in the tasting, as in the overall evaluation, other aromas stood out above these.
On the other hand, different fatty acids were also detected, the origin of which can be malt, hops, or yeast [54]. The total concentration of fatty acids that can be found in beer is around 15–30 mg L−1, with the most abundant being the short–medium-chain fatty acids (C4-C10) [106]. Among them are those that contribute the commonly called caprylic aroma (hexanoic, octanoic, and decanoic acid). It is an undesirable aroma in brewing, but it is usually found in lager beers and in 20% of ale beers [76]. However, in the beers analysed, the threshold was not exceeded for any of the three compounds (8 mg L−1 for hexanoic, 15 mg L−1 for octanoic, and 100 mg L−1 for decanoic) [107]. In addition, other short-chain fatty acids, such as butyric acid, which can increase during fermentation due to the action of yeasts, were also studied [77]. This compound contributes to “cheesy” or “sickly” off-flavours; however, it was not detected above the threshold in any of the beers (2 mg L−1) [75].
3.5. Antioxidant Activity
Beer is a globally consumed beverage that is a source of natural antioxidants, such as phenolic compounds from barley and hops [108,109,110,111]. However, yeasts can also influence the composition of phenolic compounds and, thus, the antioxidant capacity of beer [112]. Table 8 shows the results of the antioxidant activity of the beers obtained using the four different recipes. Significant differences in the data were mainly observed for slow-acting antioxidants.
The levels of total antioxidant capacity (Qt) found in the four beers were similar, ranging between 12.26 and 13.34 (mmol TE L−1), which is also within the average of those obtained with the previously tested strains (13.03 and 13.43 mmol TE L−1) [25]. In this case, as there were no major differences between the beers obtained using the different recipes, no direct relationship was found between the hops and the yeast strains used. However, it should be noted that the values obtained are higher than those observed in other studies on antioxidant capacity analysis in beer (from 424.77 to 10,508.47 μmol TE L−1) [113].
3.6. Principal Component Analysis (PCA)
Principal component analysis (PCA) was used to assess the trends of the analysed data and the different recipes used. Two principal components were analysed, where PC1 (Dim1) explained up to 59.70% of the total variance, and PC2 (Dim2) explained another 29.30%. Figure 3 shows a scatter plot, where both components are plotted against the most prominent parameters of the beers.
The beers obtained using recipes A and C were both situated in the positive region of PC2, which is associated with total higher alcohols, total esters, ethanol, and vicinal diketones; therefore, they can be considered parameters associated with the yeast strain (G 520), as they are the main producers of higher alcohols and esters. Conversely, recipes B and D, which used the same yeast strain (G 354), were in the positive zone of PC1; however, only recipe B showed a trend towards the production of fatty acids, lactic acid, and SO2. Therefore, the PCA showed a clustering of recipes that is more dependent on the yeast strains used than the hops for aroma.
3.7. Sensory Analysis
Beer is composed of numerous aromatic components, both volatile (higher alcohols, esters, sulphur compounds, and hop aroma compounds) and non-volatile (hop bittering components), as well as compounds that contribute to mouthfeel characteristics (such as alcohol, carbonation, and polyphenols). It is the interaction of all these compounds that will define the organoleptic profile of a beer.
The beers obtained from the four designed recipes were subjected to sensory analysis, the data of which are illustrated in Figure 4.
As can be seen in the graph, recipe A stands out from the rest because it has a much fruitier taste than the rest of the recipes, where it was not as noticeable. The fruity aroma is also one of the outstanding attributes in all the recipes with average values, except in recipe D. This is related to the results of the aromatic compounds analysed, as recipes A, B, and C presented higher total concentrations of esters than recipe D. Despite not exceeding the detection thresholds for the compounds analysed, the synergism between the compounds means that these are accentuated in tasting.
The sensory perception of hops can be related to the IBU values obtained; however, some beer components, such as sweetness or polyphenol content, may contribute to increasing or masking this sensation [114]. In this case, the IBU values obtained were not high, which was subsequently reflected in the tasting, as the beers were not excessively bitter in their character.
In terms of general attributes, the beers were rated as balanced and full-bodied, with the best body ratings for recipes A and C, for which the G 520 yeast was used.
The overall assessment showed that the four different recipes produced pleasant and aromatic sensory profiles with specific aromatic characteristics; however, recipes A and C (yeast strain G 520) stood out against B and C (yeast strain G 354) for their fruity aroma and flavour. It was found that, in general, consumers have a greater preference for beers with fruity profiles and bitterness that is not too pronounced [115].
3.8. Consumer Analysis
The design of a brewing recipe involves a final consumer analysis to determine consumer acceptability [116].
In order to evaluate the four beers obtained using the different recipes, 110 volunteer consumers were recruited. A prerequisite for participation in the study was to be a regular beer drinker, as the beers to be evaluated were craft beers. The panel was composed of 50% women and 50% men, aged between 18 and 75 years. In terms of frequency of beer consumption, 97.27% of the panel reported frequent beer consumption several times a week or at the weekend. Furthermore, 97.27% consumed both commercial and craft beer, while 32.73% only consumed commercial lager.
A frequency analysis of the data was conducted using CATA questions, as shown in Table 9.
In general, the beers were visually identified as having some hazy appearance, a medium-low aroma intensity, and low taste in acidity and bitterness, as well as a short aftertaste, which makes the beers more easily drinkable. The results concurred with the expert tasting panel.
The aromatic attributes (Figure 5) most detected by consumers were hops and cereal (ranging from 37.27% to 57.27%). The beers were then highlighted for their yeasty and fruity aroma. In terms of flavour attributes, hops, cereal, yeast, and fruity continued to be the most predominant, along with a roasted flavour. The hops in recipes A (Rayo Verde Tajuña aromatic) and C (Torreta Tajuña aromatic) should be highlighted, as their detection at the flavour level stood out over aroma.
When contrasting these results with those obtained by the panel of trained experts, as well as the different analyses performed, these are beers that have an aromatic profile of predominantly fruit, cereal, and hop flavours and aromas. Additionally, some studies suggest that consumers have a preference for beers with conventional flavours, such as cereal, hops, and fruit [117].
The overall rating of the four beers was very similar, with the best-rated being those from recipes A and C. The consumers were also asked about their purchase intention, which, for these recipes, ranged from 62.73% to 66.36%.
4. Conclusions
This paper evaluated the design of four pale ale beer recipes using autochthonous ingredients from the Community of Madrid. The use of indigenous ingredients (water, malt, hops, and yeast) is an important factor that helps to create important connections with the territory, attracting more consumers, as well as representing an added value to the products and favouring the agricultural sector of the region.
As regards the composition of the hops used, it was seen that the commercial variety (Cascade) could be used as a bittering hop, while the wild varieties (Rayo Verde Tajuña and Torreta Tajuña) could be used as aroma hops, as the content of α- and β-acids was much lower than in the Cascade variety. On the other hand, for the variety of barley malt used (Beka), the values obtained were similar to those of other malting barleys on the market in terms of quality and characteristics. Although the protein values found were high, it was not a negatively assessed parameter in the final beers. As far as fermentation is concerned, the yeasts used to brew the beers showed good fermentation capacities, as well as an outstanding organoleptic profile.
In general, the beers obtained were well rated by both the expert panel and the consumers, with the best rated being recipes A and C, which used the same yeast strain (G 520) but different aromatic hops. These were considered to be beers with an organoleptic profile; prominent hop, cereal, and fruit aromas and flavours; and a medium balance and body, which made the beers more drinkable. Future studies may focus on testing these recipes on an industrial scale and adjusting them if necessary, so interested brewers may then develop the recipes and launch the beers to market.
Author Contributions
Conceptualisation, V.P. and M.G.; methodology, V.P.; formal analysis, V.P.; investigation, V.P., M.G., L.M., T.D., R.S. and T.A.; writing—original draft preparation, V.P. and M.G.; writing—review and editing, V.P. and M.G.; project administration, V.P. All authors have read and agreed to the published version of the manuscript.
Funding
The project (FP22-CERVEZAM) was carried out using funding from IMIDRA.
Institutional Review Board Statement
Not applicable.
Informed Consent Statement
Not applicable.
Data Availability Statement
The original contributions presented in the study are included in the article, further inquiries can be directed to the corresponding author.
Acknowledgments
The authors are grateful for the previous project carried out with different varieties of hops (PDR18-Ecolúpulo), from which those with the best yields were selected for use in this project. Furthermore, we are grateful to Miguel Ángel Urbanos for their support during the brewing process.
Conflicts of Interest
The authors declare no conflicts of interest.
References
- Aquilani, B.; Laureti, T.; Poponi, S.; Secondi, L. Beer Choice and Consumption Determinants When Craft Beers Are Tasted: An Exploratory Study of Consumer Preferences. Food Qual. Prefer. 2015, 41, 214–224. [Google Scholar] [CrossRef]
- Basso, R.F.; Alcarde, A.R.; Portugal, C.B. Could Non-Saccharomyces Yeasts Contribute on Innovative Brewing Fermentations? Food Res. Int. 2016, 86, 112–120. [Google Scholar] [CrossRef]
- Skoglund, W.; Rennemo, Ø. Craft Breweries and the Corona Crisis–Exploring the Scandinavian Context. In INTERNATIONAL SYMPOSIUM: New Metropolitan Perspectives; Springer International Publishing: Cham, Switzerland, 2022; pp. 246–256. [Google Scholar] [CrossRef]
- Schroeder, S. Craft Entrepreneurship during a Disruptive Global Pandemic Crisis: An Ethnography of Craft Breweries in Berlin. In Cultural Entrepreneurship: New Societal Trends; Springer Nature: Singapore, 2022; pp. 153–175. [Google Scholar] [CrossRef]
- Cabras, I.; Shakina, E.; Waehning, N.; Sohns, F.; Bosworth, G. Brewing at the Time of COVID: The Impact of the Pandemic Crisis on UK Craft Breweries and Its Implications for the Sector and Local Economies. Reg. Stud. 2023, 57, 1937–1953. [Google Scholar] [CrossRef]
- Parker, D.K. Beer: Production, Sensory Characteristics and Sensory Analysis. In Woodhead Publishing Series in Food Science, Technology and Nutrition, Alcoholic Beverages; Piggot, J., Ed.; Woodhead Publishing: Cambridge, UK, 2012; pp. 133–158. [Google Scholar]
- Briggs, D.; Boulton, C.; Brookes, P.; Stevens, R. Brewing; CRC Press: Boca Raton, FL, USA, 2004; Volume 1, ISBN 978-0-8493-2547-2. [Google Scholar]
- Omari, I.O.; Charnock, H.M.; Fugina, A.L.; Thomson, E.L.; McIndoe, J.S. Magnesium-Accelerated Maillard Reactions Drive Differences in Adjunct and All-Malt Brewing. J. Am. Soc. Brew. Chem. 2021, 79, 145–155. [Google Scholar] [CrossRef]
- Bastgen, N.; Becher, T.; Titze, J. Influencing Factors on Hop Isomerization Beyond the Conventional Range. J. Am. Soc. Brew. Chem. 2019, 77, 126–133. [Google Scholar] [CrossRef]
- Mallett, J. Malt: A Practical Guide from Field to Brewhouse; Brewers Publications: Boulder, CO, USA, 2014; Volume 4, ISBN 978-1-938469-12-1. [Google Scholar]
- Capozzi, V.; Russo, P.; Spano, G. Microbial Information Regimen in EU Geographical Indications. World Pat. Inf. 2012, 34, 229–231. [Google Scholar] [CrossRef]
- Petruzzi, L.; Rosaria Corbo, M.; Sinigaglia, M.; Bevilacqua, A. Brewer’s Yeast in Controlled and Uncontrolled Fermentations, with a Focus on Novel, Nonconventional, and Superior Strains. Food Rev. Int. 2016, 32, 341–363. [Google Scholar] [CrossRef]
- UNE-EN ISO 9001:2015; Quality Management Systems. Spanish Association for Standardisation and Certification: Madrid, Spain, 2015.
- European Brewery Convention Analytica—EBC. Section 4 Extract of Malt: Congress Mash Method 4.5.1. In EBC Methods of Analysis; Fachverlag Hans Carl: Nürnberg, Germany, 2004. [Google Scholar]
- European Brewery Convention Analytica—EBC. Section 4 Extract Difference of Malt: Congress Mash Method 4.5.2. In EBC Methods of Analysis; Fachverlag Hans Carl: Nürnberg, Germany, 1997. [Google Scholar]
- European Brewery Convention Analytica—EBC. Section 4 Colour of Malt. Spectrophotometric Method (RM) Method 4.7.1. In EBC Methods of Analysis; Fachverlag Hans Carl: Nürnberg, Germany, 2000. [Google Scholar]
- European Brewery Convention Analytica—EBC. Section 4 High Molecular Weight β-Glucan Content of Malt Wort: Spectrophotometric Method Method 4.16.3. In EBC Methods of Analysis; Fachverlag Hans Carl: Nürnberg, Germany, 2005. [Google Scholar]
- European Brewery Convention Analytica—EBC. Section 4 Soluble Nitrogen of Malt: Kjeldahl Method Method 4.9.1. In EBC Methods of Analysis; Fachverlag Hans Carl: Nürnberg, Germany, 1997. [Google Scholar]
- European Brewery Convention Analytica—EBC. Section 4 Total Nitrogen of Malt: Kjeldahl Method (IM) Method 4.3.1. In EBC Methods of Analysis; Fachverlag Hans Carl: Nürnberg, Germany, 2004. [Google Scholar]
- Mitteleuropäische Brautechnische Analysen kommission (MEBAK®) e.V., Freising, BY, G. MEBAK Online. Method R-205.12.999. Ratio of Soluble Nitrogen to Total Nitrogen (Kolbach Index) in Congress Wort. Available online: https://www.mebak.org/en/methode/r-205-12-999/ratio-of-soluble-nitrogen-to-total-nitrogen-kolbach-index-in-congress-wort/2703 (accessed on 25 January 2024).
- European Brewery Convention Analytica—EBC. Section 4 Diastatic Power of Malt by Spectrophotometry (Manual Method) Method 4.12.1. In EBC Methods of Analysis; Fachverlag Hans Carl: Nürnberg, Germany, 2018. [Google Scholar]
- European Brewery Convention Analytica—EBC. Section 7 Hops and Hop Products: Hop Oil Content of Hops and Hop Products Method 7.10. In EBC Methods of Analysis; Fachverlag Hans Carl: Nürnberg, Germany, 2002. [Google Scholar]
- European Brewery Convention Analytica—EBC. Section 7 Hops and Hop Products: Total Polyphenols in Hops and Hop Pellets Method 7.14. In EBC Methods of Analysis; Fachverlag Hans Carl: Nürnberg, Germany, 2015. [Google Scholar]
- European Brewery Convention Analytica—EBC. Section 7 Hops and Hop Products: α- and β-Acids in Hops and Hop Products by HPLC Method 7.7. In EBC Methods of Analysis; Fachverlag Hans Carl: Nürnberg, Germany, 2012. [Google Scholar]
- Postigo, V.; García, M.; Cabellos, J.M.; Arroyo, T. Wine Saccharomyces Yeasts for Beer Fermentation. Fermentation 2021, 7, 290. [Google Scholar] [CrossRef]
- García, M.; Esteve-Zarzoso, B.; Crespo, J.; Cabellos, J.M.; Arroyo, T. Yeast Monitoring of Wine Mixed or Sequential Fermentations Made by Native Strains from D.O. “Vinos de Madrid” Using Real-Time Quantitative PCR. Front. Microbiol. 2017, 8, 2520. [Google Scholar] [CrossRef]
- Postigo, V.; Sanz, P.; García, M.; Arroyo, T. Impact of Non-Saccharomyces Wine Yeast Strains on Improving Healthy Characteristics and the Sensory Profile of Beer in Sequential Fermentation. Foods 2022, 11, 2029. [Google Scholar] [CrossRef]
- Zott, K.; Claisse, O.; Lucas, P.; Coulon, J.; Lonvaud-Funel, A.; Masneuf-Pomarede, I. Characterization of the Yeast Ecosystem in Grape Must and Wine Using Real-Time PCR. Food Microbiol. 2010, 27, 559–567. [Google Scholar] [CrossRef] [PubMed]
- Higuchi, R.; Fockler, C.; Dollinger, G.; Watson, R. Kinetic PCR Analysis: Real-Time Monitoring of DNA Amplification Reactions. Nat. Biotechnol. 1993, 11, 1026–1030. [Google Scholar] [CrossRef] [PubMed]
- Ortega, C.; López, R.; Cacho, J.; Ferreira, V. Fast Analysis of Important Wine Volatile Compounds—Development and Validation of a New Method Based on Gas Chromatographic-Flame Ionisation Detection Analysis of Dichloromethane Microextracts. J. Chromatogr. A 2001, 923, 205–214. [Google Scholar] [CrossRef] [PubMed]
- Vasilescu, A.; Fanjul-Bolado, P.; Titoiu, A.-M.; Porumb, R.; Epure, P. Progress in Electrochemical (Bio)Sensors for Monitoring Wine Production. Chemosensors 2019, 7, 66. [Google Scholar] [CrossRef]
- European Brewery Convention Analytica—EBC. Section 13 Sensory Analysis Method 13.10. In EBC Methods of Analysis; Fachverlag Hans Carl: Nürnberg, Germany, 1997. [Google Scholar]
- Varela, P.; Ares, G. Sensory Profiling, the Blurred Line between Sensory and Consumer Science. A Review of Novel Methods for Product Characterization. Food Res. Int. 2012, 48, 893–908. [Google Scholar] [CrossRef]
- Kim, J.H.; Kim, J.H.; Choi, E.J.; Lee, S.J.; Kwon, Y.A.; Hong, K.W.; Kim, W.J. Multivariate Analysis for Feasibility of Korean Six-Row Barleys for Beer Brewing. J. Inst. Brew. 2014, 120, 371–378. [Google Scholar] [CrossRef]
- Fox, G.P.; Panozzo, J.F.; Li, C.D.; Lance, R.C.M.; Inkerman, P.A.; Henry, R.J. Molecular Basis of Barley Quality. Aust. J. Agric. Res. 2003, 54, 1081. [Google Scholar] [CrossRef]
- Rani, H.; Bhardwaj, R.D. Quality Attributes for Barley Malt: “The Backbone of Beer”. J. Food Sci. 2021, 86, 3322–3340. [Google Scholar] [CrossRef]
- Gupta, M.; Abu-Ghannam, N.; Gallaghar, E. Barley for Brewing: Characteristic Changes during Malting, Brewing and Applications of Its By-Products. Compr. Rev. Food Sci. Food Saf. 2010, 9, 318–328. [Google Scholar] [CrossRef]
- Fox, G.P. Chemical Composition in Barley Grains and Malt Quality. In Genetics and Improvement of Barley Malt Quality; Spinger: Berlin/Heidelberg, Germany, 2009; pp. 63–98. [Google Scholar] [CrossRef]
- Howard, K.A.; Gayler, K.R.; Eagles, H.A.; Halloran, G.M. The Relationship Between D Hordein and Malting Quality in Barley. J. Cereal Sci. 1996, 24, 47–53. [Google Scholar] [CrossRef]
- Deme, G.D.; Gari, M.T.; Tessema, B. Evaluation of Malting Potential of Different Barley Varieties. J. Water Pollut. Purif. Res. 2019, 6, 24–35. [Google Scholar]
- Grujić, O. Application of a Commercial Enzyme Preparation in the Barley Malting Process. J. Inst. Brew. 1998, 104, 249–253. [Google Scholar] [CrossRef]
- Kefale, B.; Abushu, Y. Malt Quality Profile of Malt Barley Varieties Malt Quality Profile of Malt Barley Varieties Grown in the Central Highlands of Ethiopia. Acad. Res. J. Agric. Sci. Res. 2022, 5, 128–133. [Google Scholar]
- Jones, B.L.; Budde, A.D. How Various Malt Endoproteinase Classes Affect Wort Soluble Protein Levels. J. Cereal Sci. 2005, 41, 95–106. [Google Scholar] [CrossRef]
- Guerrero, B.G. Effects of Amino Acid Profile, Endoprotease Activities and Wort Quality on Fermentability under Different Malting and Brewing Conditions; University of Manitoba: Winnipeg, MB, Canada, 2009. [Google Scholar]
- Sulaiman, A.F.H. The Effect of Barley (Hordeum vulgare L.) Water Extract as a Chemolytic Agents in Cholelithiasis (Gallbladder Stone)—An In-Vitro Study. Master’s Thesis, USM-Health Campus, Universiti Sains Malaysia, Kota Bharu, Malaysia, 2017. [Google Scholar]
- Brazil, C.; Oliveira, D.F.; Duarte, R.A.; Galo, J.M.; Lucchetta, L.; Santos, E.d.C.d.; Hashimoto, E.H. β-Glucanase Addition in Brewing Malt Produced by Reduced Time of Germination. Braz. Arch. Biol. Technol. 2019, 62, 1–15. [Google Scholar] [CrossRef]
- Allosio-Ouarnier, N.; Quemener, B.; Bertrand, D.; Boivin, P. Application of High Performance Anion Exchange Chromatography to the Study of Carbohydrate Changes in Barley During Malting. J. Inst. Brew. 2000, 106, 45–52. [Google Scholar] [CrossRef]
- Psota, V. Free Amino Nitrogen in Sweet Wort Made from Barley Varieties Tested in the Czech Republic. Kvas. Prum. 2019, 65, 142–148. [Google Scholar] [CrossRef]
- Bravi, E.; Marconi, O.; Perretti, G.; Fantozzi, P. Influence of Barley Variety and Malting Process on Lipid Content of Malt. Food Chem. 2012, 135, 1112–1117. [Google Scholar] [CrossRef]
- Dabija, A.; Ciocan, M.E.; Chetrariu, A.; Mirzan, D. Comparative Evaluation of the Physico-Chemical Characteristics of Buckwheat Malt and Barley Malt. In Proceedings of the International Multidisciplinary Scientific GeoConference Surveying Geology and Mining Ecology Management, SGEM, Vienna, Austria, 6–8 December 2022; Volume 21, pp. 97–104. [Google Scholar]
- Kunze, W.; Manger, H.-J.; Pratt, S. Technology Brewing & Malting, 3rd ed.; Die Deustche Bibliothek: Berlin, Germany, 2014; p. 968. [Google Scholar]
- Evans, D.E.; Collins, H.; Eglinton, J.; Wilhelmson, A. Assessing the Impact of the Level of Diastatic Power Enzymes and Their Thermostability on the Hydrolysis of Starch during Wort Production to Predict Malt Fermentability. J. Am. Soc. Brew. Chem. 2005, 63, 185–198. [Google Scholar] [CrossRef]
- Sakamoto, K.; Konings, W.N. Beer Spoilage Bacteria and Hop Resistance. Int. J. Food Microbiol. 2003, 89, 105–124. [Google Scholar] [CrossRef]
- Buiatti, S. Beer Composition: An Overview. In Beer in Health and Disease Prevention; Academic Press: Cambridge, MA, USA, 2009; pp. 213–225. [Google Scholar] [CrossRef]
- Eßlinger, H.M.; Narziß, L. Beer. In Ullmann’s Enzyclopedia of Industrial Chemistry, 6th ed.; Wiley—VCH Verlag GmbH: Weinheim, Germany, 2002; Volume 4, ISBN 9783527306732. [Google Scholar]
- Van Opstaele, F.; De Rouck, G.; De Clippeleer, J.; Aerts, G.; De Cooman, L. Analytical and Sensory Assessment of Hoppy Aroma and Bitterness of Conventionally Hopped and Advanced Hopped Pilsner Beers. Cerevisia 2011, 36, 47–59. [Google Scholar] [CrossRef]
- Habschied, K.; Košir, I.J.; Krstanović, V.; Kumrić, G.; Mastanjević, K. Beer Polyphenols—Bitterness, Astringency, and Off-Flavors. Beverages 2021, 7, 38. [Google Scholar] [CrossRef]
- Rodolfi, M.; Chiancone, B.; Liberatore, C.M.; Fabbri, A.; Cirlini, M.; Ganino, T. Changes in Chemical Profile of Cascade Hop Cones According to the Growing Area. J. Sci. Food Agric. 2019, 99, 6011–6019. [Google Scholar] [CrossRef] [PubMed]
- Česlová, L.; Holčapek, M.; Fidler, M.; Drštičková, J.; Lísa, M. Characterization of Prenylflavonoids and Hop Bitter Acids in Various Classes of Czech Beers and Hop Extracts Using High-Performance Liquid Chromatography–Mass Spectrometry. J. Chromatogr. A 2009, 1216, 7249–7257. [Google Scholar] [CrossRef] [PubMed]
- Jerkovic, V.; Callemien, D.; Collin, S. Determination of Stilbenes in Hop Pellets from Different Cultivars. J. Agric. Food Chem. 2005, 53, 4202–4206. [Google Scholar] [CrossRef] [PubMed]
- Forster, A.; Gahr, A. On the Fate of Certain Hop Substances during Dry Hopping. Brew. Sci. 2013, 66, 93–103. [Google Scholar]
- Juvonen, R.; Koivula, T.; Haikara, A. Group-Specific PCR-RFLP and Real-Time PCR Methods for Detection and Tentative Discrimination of Strictly Anaerobic Beer-Spoilage Bacteria of the Class Clostridia. Int. J. Food Microbiol. 2008, 125, 162–169. [Google Scholar] [CrossRef] [PubMed]
- Schneiderbanger, J.; Grammer, M.; Jacob, F.; Hutzler, M. Statistical Evaluation of Beer Spoilage Bacteria by Real-Time PCR Analyses from 2010 to 2016. J. Inst. Brew. 2018, 124, 173–181. [Google Scholar] [CrossRef]
- Oldham, R.C.; Held, M.A. Methods for Detection and Identification of Beer-Spoilage Microbes. Front. Microbiol. 2023, 14, 1217704. [Google Scholar] [CrossRef]
- Marongiu, A.; Zara, G.; Legras, J.-L.; Del Caro, A.; Mascia, I.; Fadda, C.; Budroni, M. Novel Starters for Old Processes: Use of Saccharomyces cerevisiae Strains Isolated from Artisanal Sourdough for Craft Beer Production at a Brewery Scale. J. Ind. Microbiol. Biotechnol. 2015, 42, 85–92. [Google Scholar] [CrossRef]
- Rossi, S.; Turchetti, B.; Sileoni, V.; Marconi, O.; Perretti, G. Evaluation of Saccharomyces cerevisiae Strains Isolated from Non-Brewing Environments in Beer Production. J. Inst. Brew. 2018, 124, 381–388. [Google Scholar] [CrossRef]
- Cubillos, F.A.; Gibson, B.; Grijalva-Vallejos, N.; Krogerus, K.; Nikulin, J. Bioprospecting for Brewers: Exploiting Natural Diversity for Naturally Diverse Beers. Yeast 2019, 36, 383–398. [Google Scholar] [CrossRef] [PubMed]
- Hierro, N.; Esteve-Zarzoso, B.; Mas, A.; Guillamón, J.M. Monitoring of Saccharomyces and Hanseniaspora Populations during Alcoholic Fermentation by Real-Time Quantitative PCR. FEMS Yeast Res. 2007, 7, 1340–1349. [Google Scholar] [CrossRef] [PubMed]
- Hierro, N.; Esteve-Zarzoso, B.; González, A.; Mas, A.; Guillamón, J.M. Real-Time Quantitative PCR (QPCR) and Reverse Transcription-QPCR for Detection and Enumeration of Total Yeasts in Wine. Appl. Environ. Microbiol. 2006, 72, 7148–7155. [Google Scholar] [CrossRef] [PubMed]
- Permyakova, L.V.; Pomozova, V.A.; Antipova, L.V. Improvement of Brewer’s Yeast Viability by Adjusting Wort Composition. Foods Raw Mater. 2017, 5, 94–104. [Google Scholar] [CrossRef]
- Xiao, Y.; Wang, Z.; Sun, W.; Luan, Y.; Piao, M.; Deng, Y. Characterization and Formation Mechanisms of Viable, but Putatively Non-Culturable Brewer’s Yeast Induced by Isomerized Hop Extract. LWT 2022, 155, 112974. [Google Scholar] [CrossRef]
- Einfalt, D. Barley-Sorghum Craft Beer Production with Saccharomyces cerevisiae, Torulaspora delbrueckii and Metschnikowia pulcherrima Yeast Strains. Eur. Food Res. Technol. 2021, 247, 385–393. [Google Scholar] [CrossRef]
- Lafontaine, S.R.; Shellhammer, T.H. Impact of Static Dry-hopping Rate on the Sensory and Analytical Profiles of Beer. J. Inst. Brew. 2018, 124, 434–442. [Google Scholar] [CrossRef]
- Hranilovic, A.; Gambetta, J.M.; Schmidtke, L.; Boss, P.K.; Grbin, P.R.; Masneuf-Pomarede, I.; Bely, M.; Albertin, W.; Jiranek, V. Oenological Traits of Lachancea thermotolerans Show Signs of Domestication and Allopatric Differentiation. Sci. Rep. 2018, 8, 14812. [Google Scholar] [CrossRef] [PubMed]
- Engan, S. Organoleptic Threshold Values of Some Organic Acids in Beer. J. Inst. Brew. 1974, 80, 162–163. [Google Scholar] [CrossRef]
- Clapperton, J.F.; Brown, D.G.W. Caprylic Flavour as a Feature of Beer Flavour. J. Inst. Brew. 1978, 84, 90–92. [Google Scholar] [CrossRef]
- Olšovská, J.; Vrzal, T.; Štěrba, K.; Slabý, M.; Kubizniaková, P.; Čejka, P. The Chemical Profiling of Fatty Acids during the Brewing Process. J. Sci. Food Agric. 2019, 99, 1772–1779. [Google Scholar] [CrossRef] [PubMed]
- Popescu, V.; Soceanu, A.; Dobrinas, S.; Stanciu, G. A Study of Beer Bitterness Loss during the Various Stages of the Romanian Beer Production Process. J. Inst. Brew. 2013, 119, 111–115. [Google Scholar] [CrossRef]
- Bamforth, C.W. Beer and Health. In Beer; Elsevier: Amsterdam, The Netherlands, 2009; pp. 229–253. ISBN 9780126692013. [Google Scholar]
- Laws, D.R.J.; McGuinness, J.D.; Rennie, H. The Losses Of Bitter Substances During Fermentation. J. Inst. Brew. 1972, 78, 314–321. [Google Scholar] [CrossRef]
- Meilgaard, M.; Elizondo, A.; Moya, E. A Study of Carbonyl Compounds in Beer, Part II. Flavor and Flavor Thresholds of Aldehydes and Ketones Added to Beer. Tec. Q. Master Brew. Assoc. Am. 1970, 7, 143–149. [Google Scholar]
- Krogerus, K.; Gibson, B.R. 125 Th Anniversary Review: Diacetyl and Its Control during Brewery Fermentation. J. Inst. Brew. 2013, 119, 86–97. [Google Scholar] [CrossRef]
- Pickerell, A.T.W.; Hwang, A.; Axcell, B.C. Impact of Yeast-Handling Procedures on Beer Flavor Development during Fermentation. J. Am. Soc. Brew. Chem. 1991, 49, 87–92. [Google Scholar] [CrossRef]
- Bamforth, C. Beer Flavour: Sulphur Substances. Brew. Guard. 2001, 130, 20–23. [Google Scholar]
- Van Haecht, J.L.; Dufour, J.P. The Production of Sulfur Compounds by Brewing Yeast: A Review. Cerevisia Biotechnol. 1995, 20, 51–64. [Google Scholar]
- Duan, W.; Roddick, F.A.; Higgins, V.J.; Rogers, P.J. A Parallel Analysis of H2S and SO2 Formation by Brewing Yeast in Response to Sulfur-Containing Amino Acids and Ammonium Ions. J. Am. Soc. Brew. Chem. 2004, 62, 35–41. [Google Scholar] [CrossRef]
- Kaneda, H.; Kano, Y.; Sekine, T.; Ishii, S.; Takahashi, K.; Koshino, S. Effect of Pitching Yeast and Wort Preparation on Flavor Stability of Beer. J. Ferment. Bioeng. 1992, 73, 456–460. [Google Scholar] [CrossRef]
- Lugasi, A. Polyphenol Content and Antioxidant Properties of Beer. Acta Aliment. 2003, 32, 181–192. [Google Scholar] [CrossRef]
- Tefera, M.; Ayele, D. Investigation of Total Polyphenol, Antioxidant Activity, and Levels of Metals in Ethiopian Commercial Beers. Cogent Chem. 2020, 6, 1824336. [Google Scholar] [CrossRef]
- Nardini, M.; Foddai, M.S. Phenolics Profile and Antioxidant Activity of Special Beers. Molecules 2020, 25, 2466. [Google Scholar] [CrossRef] [PubMed]
- Hughes, P.S.; Baxter, E.D. Beer: Quality, Safety and Nutritional Aspects; Royal Society of Chemistry: Cambridge, UK, 2001; ISBN 0854045880. [Google Scholar]
- Langstaff, S.A.; Lewis, M.J. The Mouthfeel of Beer—A Review. J. Inst. Brew. 1993, 99, 31–37. [Google Scholar] [CrossRef]
- Parker, W.E.; Richardson, P.J. The Quantitative Determination Of Glycerol In Beer By Gas-Liquid Chromatography. J. Inst. Brew. 1970, 76, 191–198. [Google Scholar] [CrossRef]
- Langstaff, S.A.; Guinard, J.-X.; Lewis, M.J. Instrumental Evaluation of the Mouthfeel of Beer and Correlation With Sensory Evaluation. J. Inst. Brew. 1991, 97, 427–433. [Google Scholar] [CrossRef]
- Tan, Y.; Siebert, K.J. Quantitative Structure-Activity Relationship Modeling of Alcohol, Ester, Aldehyde, and Ketone Flavor Thresholds in Beer from Molecular Features. J. Agric. Food Chem. 2004, 52, 3057–3064. [Google Scholar] [CrossRef]
- Vanderhaegen, B.; Neven, H.; Daenen, L.; Verstrepen, K.J.; Verachtert, H.; Derdelinckx, G. Furfuryl Ethyl Ether: Important Aging Flavor and a New Marker for the Storage Conditions of Beer. J. Agric. Food Chem. 2004, 52, 1661–1668. [Google Scholar] [CrossRef]
- Liu, M.; Zeng, Z.; Xiong, B. Preparation of Novel Solid-Phase Microextraction Fibers by Sol-Gel Technology for Headspace Solid-Phase Microextraction-Gas Chromatographic Analysis of Aroma Compounds in Beer. J. Chromatogr. A 2005, 1065, 287–299. [Google Scholar] [CrossRef]
- Jeleń, H.H.; Wlazły, K.; Wa̧sowicz, E.; Kamiński, E. Solid-Phase Microextraction for the Analysis of Some Alcohols and Esters in Beer: Comparison with Static Headspace Method. J. Agric. Food Chem. 1998, 46, 1469–1473. [Google Scholar] [CrossRef]
- Vanderhaegen, B.; Neven, H.; Verstrepen, K.J.; Delvaux, F.R.; Verachtert, H.; Derdelinckx, G. Influence of the Brewing Process on Furfuryl Ethyl Ether Formation during Beer Aging. J. Agric. Food Chem. 2004, 52, 6755–6764. [Google Scholar] [CrossRef] [PubMed]
- Guido, L. The Impact of the Physiological Condition of the Pitching Yeast on Beer Flavour Stability: An Industrial Approach. Food Chem. 2004, 87, 187–193. [Google Scholar] [CrossRef]
- Budroni, M.; Zara, G.; Ciani, M.; Comitini, F. Saccharomyces and Non-Saccharomyces Starter Yeasts. In Brewing Technology; InTech: Rijeka, Croatia, 2017; pp. 81–100. [Google Scholar]
- Kobayashi, M.; Shimizu, H.; Shioya, S. Beer Volatile Compounds and Their Application to Low-Malt Beer Fermentation. J. Biosci. Bioeng. 2008, 106, 317–323. [Google Scholar] [CrossRef] [PubMed]
- Romano, P.; Suzzi, G.; Comi, G.; Zironi, R. Higher Alcohol and Acetic Acid Production by Apiculate Wine Yeasts. J. Appl. Bacteriol. 1992, 73, 126–130. [Google Scholar] [CrossRef]
- Piddocke, M.P.; Kreisz, S.; Heldt-Hansen, H.P.; Nielsen, K.F.; Olsson, L. Physiological Characterization of Brewer’s Yeast in High-Gravity Beer Fermentations with Glucose or Maltose Syrups as Adjuncts. Appl. Microbiol. Biotechnol. 2009, 84, 453–464. [Google Scholar] [CrossRef] [PubMed]
- Meilgaard, M.C. Flavor Chemistry in Beer: Part I: Flavor Interaction between Principal Volatiles. Master Brew. Assoc. Am. Tech. Q. 1975, 12, 107–117. [Google Scholar]
- Bamforth, C.W. Standards of Brewing: Formulas for Consistency and Excellence; Brewers Publications: Boulder, CO, USA, 2002; p. 210. [Google Scholar]
- Meilgaard, M.C. Prediction of Flavor Differences between Beers from Their Chemical Composition. J. Agric. Food Chem. 1982, 30, 1009–1017. [Google Scholar] [CrossRef]
- Humia, B.V.; Santos, K.S.; Barbosa, A.M.; Sawata, M.; Mendonça, M.D.C.; Padilha, F.F. Beer Molecules and Its Sensory and Biological Properties: A Review. Molecules 2019, 24, 1568. [Google Scholar] [CrossRef]
- Wang, C.; Xie, Y.; Wang, H.; Bai, Y.; Dai, C.; Li, C.; Xu, X.; Zhou, G. Phenolic Compounds in Beer Inhibit Formation of Polycyclic Aromatic Hydrocarbons from Charcoal-Grilled Chicken Wings. Food Chem. 2019, 294, 578–586. [Google Scholar] [CrossRef]
- Callemien, D.; Jerkovic, V.; Rozenberg, R.; Collin, S. Hop as an Interesting Source of Resveratrol for Brewers: Optimization of the Extraction and Quantitative Study by Liquid Chromatography/Atmospheric Pressure Chemical Ionization Tandem Mass Spectrometry. J. Agric. Food Chem. 2005, 53, 424–429. [Google Scholar] [CrossRef] [PubMed]
- Goupy, P.; Hugues, M.; Boivin, P.; Amiot, M.J. Antioxidant Composition and Activity of Barley (Hordeum vulgare) and Malt Extracts and of Isolated Phenolic Compounds. J. Sci. Food Agric. 1999, 79, 1625–1634. [Google Scholar] [CrossRef]
- Capece, A.; Romaniello, R.; Pietrafesa, A.; Siesto, G.; Pietrafesa, R.; Zambuto, M.; Romano, P. Use of Saccharomyces cerevisiae Var. Boulardii in Co-Fermentations with S. cerevisiae for the Production of Craft Beers with Potential Healthy Value-Added. Int. J. Food Microbiol. 2018, 284, 22–30. [Google Scholar] [CrossRef] [PubMed]
- Granato, D.; Branco, G.F.; Faria, J.D.A.F.; Cruz, A.G. Characterization of Brazilian Lager and Brown Ale Beers Based on Color, Phenolic Compounds, and Antioxidant Activity Using Chemometrics. J. Sci. Food Agric. 2011, 91, 563–571. [Google Scholar] [CrossRef] [PubMed]
- Aliani, M.; Eskin, M.N.A. (Eds.) Bitterness; John Wiley & Sons, Inc.: Hoboken, NJ, USA, 2017; ISBN 9781118590263. [Google Scholar]
- da Costa Jardim, C.; de Souza, D.; Cristina Kasper Machado, I.; Massochin Nunes Pinto, L.; de Souza Ramos, R.; Garavaglia, J. Sensory Profile, Consumer Preference and Chemical Composition of Craft Beers from Brazil. Beverages 2018, 4, 106. [Google Scholar] [CrossRef]
- Eßlinger, H.M. Handbook of Brewing Processes Technology Markets; Wiley: Weinheim, Germany, 2009; ISBN 9783527314065. [Google Scholar]
- Calvo-Porral, C.; Rivaroli, S.; Orosa-Gonzalez, J. How Consumer Involvement Influences Beer Flavour Preferences. Int. J. Wine Bus. Res. 2020, 32, 537–554. [Google Scholar] [CrossRef]
Figure 1.
Recipes designed for the preparation of the different beers using the autochthonous ingredients from the Community of Madrid.
Figure 1.
Recipes designed for the preparation of the different beers using the autochthonous ingredients from the Community of Madrid.

Figure 2.
Yeast population dynamics during the four different fermentation recipes. Results, expressed as log10 cells mL−1, were obtained using YPD culture media (columns) and qPCR analysis (blue lines) for S. cerevisiae G 520 and G 354 strains; sugar density values (grey lines) are expressed as Plato degrees (°P). All fermenters were inoculated with an initial concentration of 106 cell mL−1 (day 0).
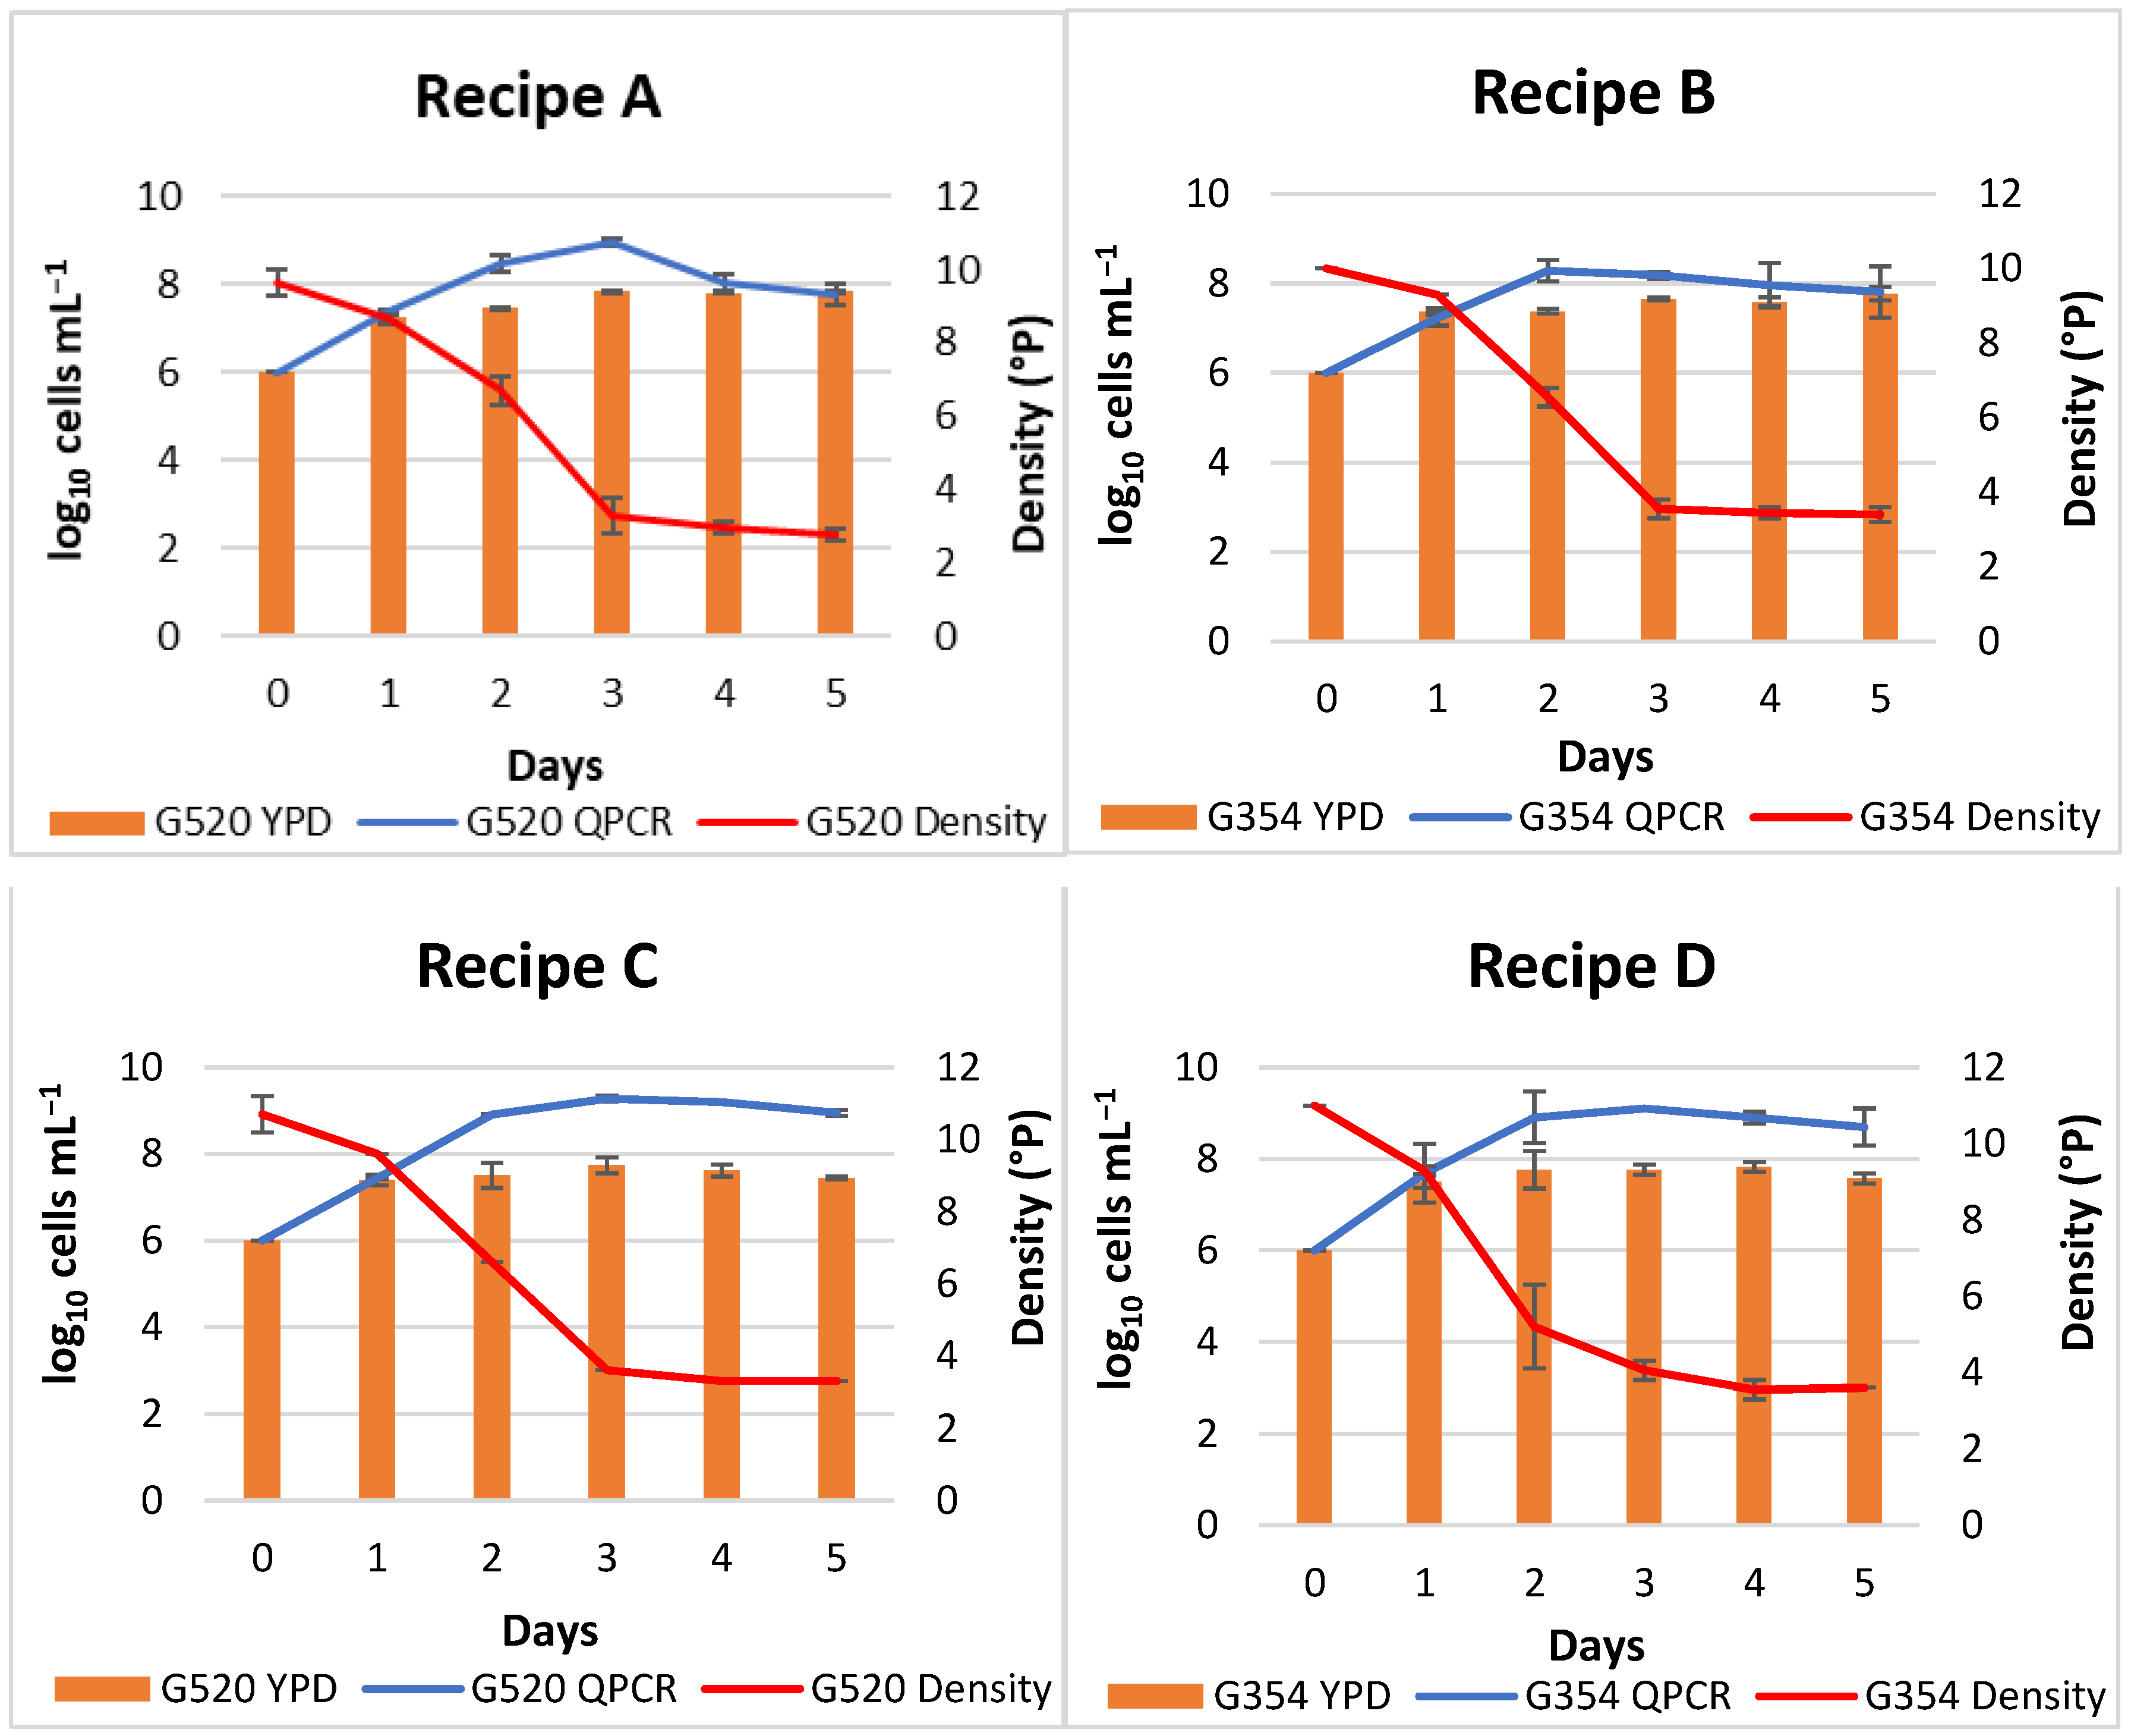
Figure 3.
Projection of the beers on the axes formed by PC1 (Dim1) and PC2 (Dim2). Each object is the average of the two corresponding experimental beers. B, bitterness; G, glycerol; AC, antioxidant capacity; Et, ethanol; A, total fatty acids; HA, total higher alcohols; E, total esters; LA, lactic acid; C, colour; VDKs, vicinal diketones; AA, apparent attenuation; P, polyphenols. G 520A: recipe A; G 354B: recipe B; G 520C: recipe C; G 354D: recipe D.

Figure 4.
Sensory analysis of the four different beers obtained (from 0 to 3). Visual attributes: foam consistency. Aroma attributes: fruity aroma, phenolic aroma, banana aroma, and hop aroma; flavour attributes: fruity, alcohol, sweet, bitter, salty, acid, and astringent; overall attributes: body and balance.
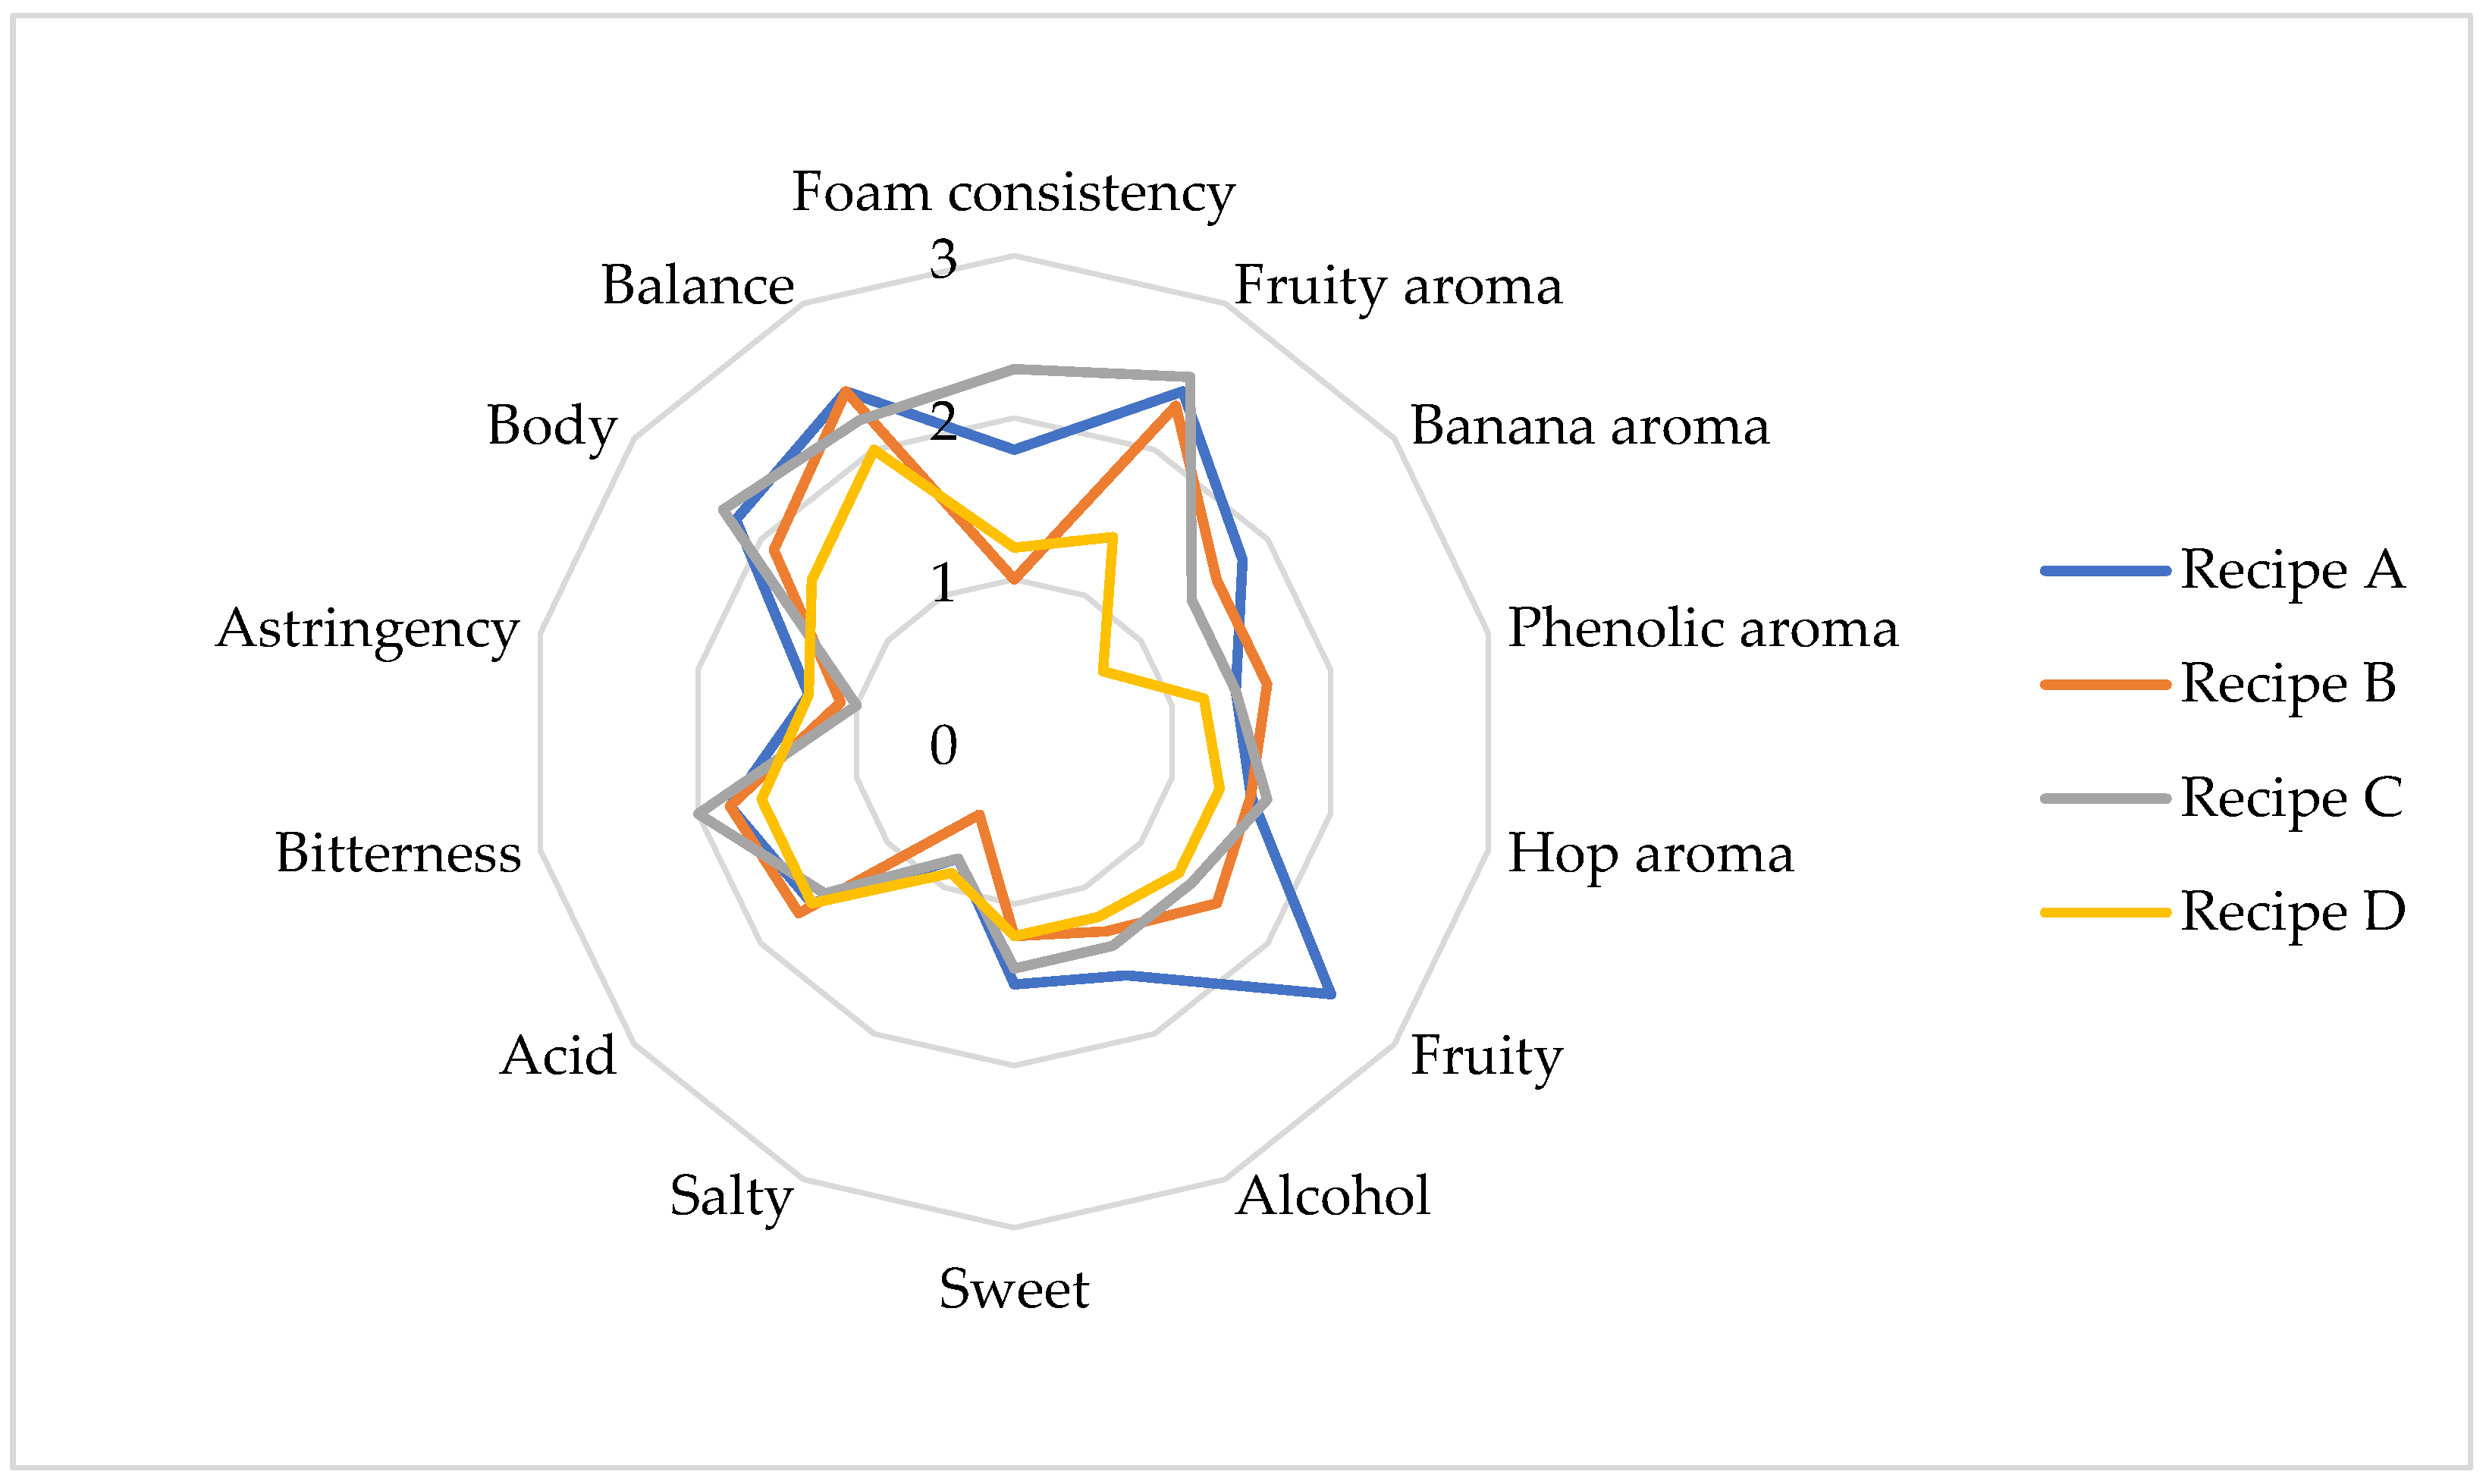
Figure 5.
Percentage of detection by consumers for each of the analysed attributes in the aroma and flavour for the four beers.
Figure 5.
Percentage of detection by consumers for each of the analysed attributes in the aroma and flavour for the four beers.


Table 1.
Analysed parameters in water using CDR FoodLab.
| Bicarbonates | Calcium | Zinc | Magnesium | Potassium | Sulphate | Chlorides | pH |
|---|---|---|---|---|---|---|---|
| 49.50 ± 0.50 | 24.50 ± 2.40 | 0.06 ± 0.01 | 4.70 ± 0.00 | <50 | <10 | <50 | 8.21 ± 0.38 |
Data are expressed in mg L−1.
Table 2.
Characteristic properties of the malt used.
| Parameters | Barley Malt |
|---|---|
| Congress Mash: | |
| Saccharification rate (min) | 10.00 ± 0.00 |
| Speed of filtration (h) | <1.00 ± 0.00 |
| Odour | normal |
| Fine–coarse difference (%) | 2.60 ± 0.28 |
| pH of wort | 5.96 ± 0.06 |
| Colour (EBC) | 4.50 ± 1.13 |
| β-glucans (mg L−1) | 217.15 ± 40.31 |
| Soluble nitrogen content (%) | 5.85 ± 1.34 |
| Total nitrogen (%) | 14.35 ± 0.92 |
| Kolbach Index | 40.50 ± 6.36 |
| Diastatic power (° WK) | 399.00 ± 24.04 |
Data are means ± standard deviations of two samples.
Table 3.
Characteristic properties of the hops used.
| Parameters | Cascade | Rayo Verde Tajuña | Torreta Tajuña |
|---|---|---|---|
| Essential oils (mL) | 0.51 ± 0.03 a | 0.05 ± 0.00 b | 0.05 ± 0.00 b |
| Polyphenols (%) | 1.00 ± 0.10 a | 0.59 ± 0.09 b | 0.90 ± 0.10 a |
| α-acids: | |||
| Cohumulone (%) | 2.06 ± 0.16 a | 0.25 ± 0.05 b | 0.21 ± 0.02 b |
| Adhumulone (%) | 5.83 ± 0.13 a | 1.03 ± 0.05 b | 0.80 ± 0.10 b |
| β-acids: | |||
| Colupulone (%) | 2.18 ± 0.18 a | 1.29 ± 0.09 b | 1.03 ± 0.03 b |
| Adlupulone (%) | 2.48 ± 0.18 a | 2.02 ± 0.02 b | 1.63 ± 0.13 c |
Data with different superscript letters within each row are significantly different (Tukey tests: p < 0.05).
Table 4.
Standard curves performed for each yeast strain.
| Yeast Strain | Slope | Intersection | R2 | Efficiency |
|---|---|---|---|---|
| S. cerevisiae G 520 | −3.17 ± 0.05 | 38.39 ± 0.32 | 0.986 ± 0.02 | 106.83 ± 2.31 |
| S. cerevisiae G 354 | −3.36 ± 0.08 | 40.03 ± 0.47 | 0.997 ± 0.00 | 98.37 ± 3.15 |
Table 5.
Main analytical characteristics of the beers obtained using four different recipes, analysed with CDR FoodLab.
Table 5.
Main analytical characteristics of the beers obtained using four different recipes, analysed with CDR FoodLab.
| Recipes | Lactic Acid mg L−1 | Colour EBC | Bitterness IBU | VDKs mg L−1 | SO2 mg L−1 | Polyphenols mg L−1 |
|---|---|---|---|---|---|---|
| A | 273.50 ± 10.50 a | 17.5 ± 0.50 a | 11.80 ± 1.10 a | 0.29 ± 0.05 a | 3.80 ± 0.20 c | 269.5 ± 6.50 a |
| B | 294.00 ± 29.00 a | 16.00 ± 0.00 ab | 11.15 ± 0.55 a | 0.17 ± 0.01 bc | 12.45 ± 0.95 a | 299.5 ± 12.50 a |
| C | 209.5 ± 21.50 b | 15.5 ± 0.50 bc | 10.80 ± 0.80 a | 0.23 ± 0.03 ab | 4.60 ± 0.90 bc | 267.5 ± 41.50 a |
| D | 282.5 ± 18.50 a | 14.0 ± 1.00 c | 10.70 ± 0.70 a | 0.10 ± 0.02 c | 6.70 ± 1.60 b | 327.5 ± 59.50 a |
Data are means ± standard deviations of two beer samples. Data with different superscript letters within each column are significantly different (Tukey tests: p < 0.05). Recipes A and C: strain G 520; recipes B and D: strain G 354. Recipes A and B: Rayo Verde Tajuña hops; recipes C and D: Torreta Tajuña hops.
Table 6.
Fermentation parameters analysed using HPLC and the apparent attenuation of the beers obtained.
Table 6.
Fermentation parameters analysed using HPLC and the apparent attenuation of the beers obtained.
| Recipes | Residual Fermentable Sugars (g L−1) | Apparent Attenuation (%) | Ethanol % (v/v) | Glycerol (g L−1) | |
|---|---|---|---|---|---|
| Maltotriose | Maltose | ||||
| A | 8.40 ± 0.44 a | 2.39 ±0.02 b | 69.5 ± 0.50 a | 3.25 ± 0.06 a | 1.72 ± 0.05 a |
| B | 8.83 ± 0.07 a | 2.50 ±0.03 a | 67.5 ± 0.50 bc | 3.21 ± 0.03 a | 1.68 ± 0.00 ab |
| C | 9.24 ± 0.66 a | 2.15 ± 0.03 c | 69.0 ± 1.00 ab | 3.33 ± 0.04 a | 1.59 ± 0.02 b |
| D | 8.90 ± 0.01 a | 2.04 ± 0.06 d | 67.0 ± 0.00 c | 3.05 ± 0.07 b | 1.47 ± 0.07 c |
Data are means ± standard deviations of two beer samples. Data with different superscript letters within each column are significantly different (Tukey tests: p < 0.05). Recipes A and C: strain G 520; recipes B and D: strain G 354. Recipes A and B: Rayo Verde Tajuña hops; recipes C and D: Torreta Tajuña hops. Initial sugar composition of the wort: glucose, 14.47 mg L−1; fructose, 3.50 mg L−1; maltose, 44.33 mg L−1; and maltotriose, 12.26 mg L−1.
Table 7.
Main volatile compounds found in the four beers obtained.
| Recipes | A | B | C | D |
|---|---|---|---|---|
| Higher alcohols | ||||
| Isobutanol | 33.72 ± 0.94 a | 13.17 ± 1.76 b | 35.24 ± 3.43 a | 12.17 ± 0.65 b |
| 1-butanol | 0.14 ± 0.00 a | 0.13 ± 0.00 b | nd | nd |
| Isoamyl alcohol | 107.80 ± 0.36 b | 82.07 ± 2.90 c | 116.85 ± 4.91 a | 76.43 ± 3.32 c |
| Methionol | 0.47 ± 0.13 a | 0.32 ± 0.00 a | 0.35 ± 0.04 a | 0.33 ± 0.01 a |
| Benzyl alcohol | 0.05 ± 0.00 b | 0.07 ± 0.01 a | 0.04 ± 0.00 b | 0.04 ± 0.00 b |
| β-phenylethanol | 26.69 ± 1.44 a | 11.04 ± 0.07 b | 32.92 ± 1.41 a | 15.23 ± 4.40 b |
| Esters | ||||
| Isoamyl acetate | 2.92 ± 0.27 a | 1.32± 0.02 b | 2.38 ± 0.11 a | 0.78 ± 0.36 b |
| Ethyl butyrate | 0.03 ± 0.03 b | 0.18 ± 0.00 a | 0.11 ± 0.00 ab | 0.09 ± 0.09 ab |
| Ethyl isovalerate | 0.15 ± 0.00 a | 0.14 ± 0.01 a | 0.14 ± 0.00 a | 0.14 ± 0.01 a |
| Ethyl hexanoate | 0.32 ± 0.00 a | 0.33 ± 0.01 a | 0.29 ± 0.00 ab | 0.20 ± 0.08 b |
| Ethyl octanoate | 0.08 ± 0.01 a | 0.10 ± 0.01 a | 0.11 ± 0.00 a | 0.09 ± 0.03 a |
| 2-phenylethyl acetate | 0.11 ± 0.00 a | 0.05 ± 0.00 c | 0.10 ± 0.00 b | 0.05 ± 0.00 c |
| Fatty acids | ||||
| Butyric acid | 0.64 ± 0.01 a | 0.58 ± 0.02 b | 0.56 ± 0.01 bc | 0.54 ± 0.00 c |
| Hexanoic acid | 3.12 ± 0.21 a | 4.43 ± 0.00 a | 3.34 ± 0.12 a | 3.26 ± 0.09 a |
| Octanoic acid | 7.70 ± 1.64 b | 13.14 ± 0.02 a | 10.44 ± 0.55 ab | 9.68 ± 3.65 ab |
| Decanoic acid | 2.74 ± 0.13 b | 8.83 ± 1.24 a | 4.10 ± 0.05 b | 4.16 ± 2.67 b |
Data, expressed as mg L−1, are means ± standard deviations of two independent experiments. nd = not detected. Compounds above their threshold levels are marked in bold. Data with different superscript letters within each row are significantly different (Tukey tests: p < 0.05).
Table 8.
Antioxidant activity of the beers obtained using different recipes.
| Recipes | Q1 | Q2 | Qt |
|---|---|---|---|
| A | 3.39 ± 0.00 a | 9.41 ± 0.13 ab | 12.81 ± 0.13 b |
| B | 3.58 ± 0.16 a | 9.75 ± 0.09 a | 13.34 ± 0.07 a |
| C | 3.36 ± 0.09 a | 9.15 ± 0.21 b | 12.51 ± 0.30 bc |
| D | 3.53 ± 0.06 a | 8.73 ± 0.18 c | 12.26 ± 0.12 c |
Data are means ± standard deviations of two independent experiments, expressed as millimoles of Trolox equivalents per litre (mmol TE L−1). Q1, fast-acting antioxidants; Q2, slow-acting antioxidants; QT, total antioxidants. Data with different superscript letters within each column are significantly different (Tukey tests: p < 0.05). Recipes A and C: strain G 520; recipes B and D: strain G 354. Recipes A and B, Rayo Verde Tajuña hops; recipes C and D: Torreta Tajuña hops.
Table 9.
Analysis of the data frequency obtained by CATA questions.
| Sensory Attributes | Response (n = 110) | |||
|---|---|---|---|---|
| Appearance | A | B | C | D |
| Visual impression | ||||
| Very hazy | 31 | 44 | 35 | 29 |
| Hazy | 17 | 14 | 35 | 29 |
| Dull | 38 | 35 | 26 | 30 |
| Clear | 15 | 13 | 9 | 15 |
| Bright | 9 | 4 | 5 | 7 |
| Aroma | ||||
| Aroma intensity | ||||
| Low | 49 | 34 | 41 | 37 |
| Low-medium | 24 | 27 | 30 | 26 |
| Medium | 32 | 35 | 29 | 38 |
| Medium-high | 4 | 11 | 10 | 8 |
| High | 1 | 3 | 0 | 1 |
| Taste | ||||
| Acidity | ||||
| Low | 35 | 40 | 48 | 46 |
| Low-medium | 43 | 49 | 40 | 44 |
| Medium | 7 | 10 | 6 | 11 |
| Medium-high | 21 | 8 | 12 | 9 |
| High | 4 | 3 | 4 | 0 |
| Bitterness | ||||
| Low | 29 | 27 | 42 | 38 |
| Low-medium | 40 | 45 | 38 | 44 |
| Medium | 26 | 26 | 20 | 16 |
| Medium-high | 12 | 7 | 8 | 10 |
| High | 3 | 5 | 2 | 2 |
| Aftertaste intensity | ||||
| Short | 54 | 49 | 42 | 45 |
| Short-medium | 9 | 9 | 19 | 24 |
| Medium | 19 | 17 | 19 | 8 |
| Medium-long | 27 | 34 | 27 | 30 |
| Long | 1 | 1 | 3 | 3 |
Disclaimer/Publisher’s Note: The statements, opinions and data contained in all publications are solely those of the individual author(s) and contributor(s) and not of MDPI and/or the editor(s). MDPI and/or the editor(s) disclaim responsibility for any injury to people or property resulting from any ideas, methods, instructions or products referred to in the content. |
© 2024 by the authors. Licensee MDPI, Basel, Switzerland. This article is an open access article distributed under the terms and conditions of the Creative Commons Attribution (CC BY) license (https://creativecommons.org/licenses/by/4.0/).
Share and Cite
MDPI and ACS Style
Postigo, V.; Mauro, L.; Diaz, T.; Saiz, R.; Arroyo, T.; García, M. Autochthonous Ingredients for Craft Beer Production. Fermentation 2024, 10, 225. https://doi.org/10.3390/fermentation10050225
AMA Style
Postigo V, Mauro L, Diaz T, Saiz R, Arroyo T, García M. Autochthonous Ingredients for Craft Beer Production. Fermentation. 2024; 10(5):225. https://doi.org/10.3390/fermentation10050225
Chicago/Turabian StylePostigo, Vanesa, Luz Mauro, Teresa Diaz, Roberto Saiz, Teresa Arroyo, and Margarita García. 2024. "Autochthonous Ingredients for Craft Beer Production" Fermentation 10, no. 5: 225. https://doi.org/10.3390/fermentation10050225
Note that from the first issue of 2016, this journal uses article numbers instead of page numbers. See further details here.