Article

Fermentation Condition and Quality Evaluation of Pineapple Fruit Wine

by
Antika Boondaeng
1,
Sumaporn Kasemsumran
1,
Kraireuk Ngowsuwan
1,
Pilanee Vaithanomsat
1,
Waraporn Apiwatanapiwat
1,
Chanaporn Trakunjae
1,2,
Phornphimon Janchai
1,
Sunee Jungtheerapanich
1 and
Nanthavut Niyomvong
3,*
1
Kasetsart Agricultural and Agro-Industrial Product Improvement Institute, Kasetsart University, Bangkok 10900, Thailand
2
School of Biological Sciences, Universiti Sains Malaysia, 11800 Penang, Malaysia
3
Department of Biology and Biotechnology, Faculty of Science and Technology, Nakhon Sawan Rajabhat University, Nakhon Sawan 60000, Thailand
*
Author to whom correspondence should be addressed.
Fermentation 2022, 8(1), 11; https://doi.org/10.3390/fermentation8010011
Submission received: 19 November 2021 / Revised: 18 December 2021 / Accepted: 25 December 2021 / Published: 29 December 2021
(This article belongs to the Section Fermentation for Food and Beverages)

Abstract

:
This research investigated the impact of the concentration of pineapple juice on the characteristics of pineapple wine during fermentation with Saccharomyces cerevisiae var. burgundy. Three ratios of fresh pineapple juice to water were mixed to obtain three treatments, which were T1—2:1, T2—1:1, and T3—1:2. The °Brix and pH of all pineapple juice and water ratios were adjusted to 25 and 4, respectively. The results showed that changes in alcohol, pH, Total Soluble Solids (TSS), Total Titratable Acidity (TAA, as citric acid), and Volatile Acidity (VA, as acetic acid) during the 10-day fermentation among three treatments were significantly different. The highest alcohol content was obtained from the 2:1 with values of 10.71% (v/v). The mixed ratio at 1:1 and 1:2 obtained the alcohol value of 9.61 and 8.35% (v/v), respectively. After ten days of fermentation, TSS, pH values, TAA, and VA were in the range of 9.7–13 °Brix, 3.56–3.82, 0.384–0.448, and 0.0013–0.0016, respectively. However, the appearance, aroma, and taste of all ratios were not significantly different. Sweetness and overall liking, wine with pineapple juice/water ratio at 2:1 had the highest score (p ≤ 0.05). The total antioxidant activities determined by DPPH and total phenolic content were 0.91 mmol/L TE and 365.80 mg/L GAE, respectively, as confirmed by FTIR spectral analyses.

Graphical Abstract

1. Introduction

Thailand is one of the largest fruit producers worldwide. However, there are also many wastes or low-grade fruits, which is a serious problem and generates losses. An alternative for reducing these problems is utilizing biotechnological processes and agroindustry to transform waste or low-grade fruit from these fruits into a viable product. The utilization of fruit juice reduces waste or low-grade fruits and creates additional value and income. For example, there are some fruits such as mulberry, mangosteen, star gooseberry, pineapple, etc. Pineapple (Ananas comosus L. Merr.) is widely consumed in Thailand and a well-known tropical fruit globally. Pineapple is mainly cultivated in Thailand, with an area of 192,675 acres, which increased by 28,728 acres, and gross yields of 1.96 million tons, an increase from previous years by 565,862 tons [1]. This can be referred to as a staple agronomic yield in Thailand, which can be used as a substrate in the wine industry. Pineapple has a moderate sugar and acid content, besides a strong aroma attractive to the senses.
Wine is an alcoholic beverage typically made with fermented grape juice. Other fruit wines are referred to by fruit juices, as in this work on pineapple wine [2]. There are several benefits to drinking a glass of wine. Many antioxidant and phenolic compounds, including anthocyanins and flavonols [3] prevent cellular damage caused by inflammation and oxidative stress.
To date, the total antioxidant capacity is analyzed through a particular mechanism, including scavenging methods, non-radical redox potential-based methods, metal chelation capacity, and total phenolic contents [4]. Although several antioxidant methods have undeniable low detection limits and increased specificity, there is still a gap in procedures with countless analytical advantages, such as time-saving and high resolution. Fourier transform infrared (FTIR) spectrometry, a simple, rapid, and non-destructive method can be recognized as a potential technique. The application of FTIR spectrometry to wine analysis is an indirect analytical method, which provides excellent results in terms of precision and accuracy [5]. However, different wines have different quantities of antioxidants and different health benefits. Wine composition, including the content of phenolic compounds, depends on the types of fruit and the winemaking process. Tropical fruit wine in Thailand produced in the home continues to be somewhat popular. However, growth in consumption of commercial fruit wine still needs to be developed. In addition, the physical and chemical properties of wine, including the clarity of the wine, total phenolic compound, volatiles, and alcohol content, are therefore important indicators of wine quality.
The physical and chemical properties of wine play an important role in wine quality, especially imported wines. However, if the local wine can be developed to achieve a certain quality to price ratio, it would compete with imported wines. Therefore, better local wines coupled with an increase in lower-priced, high-quality wine should be supported.
Currently, interest in developing pineapple wine as a valuable product for trade has increased. In this study, fresh pineapples were used as the main raw material for fermentation and inoculated with active yeast Saccharomyces cerevisiae var. burgundy as starter culture and then investigated the alcoholic beverage process and quality evaluation of pineapple fruit wine to provide certain reference data for the development of pineapple wine.

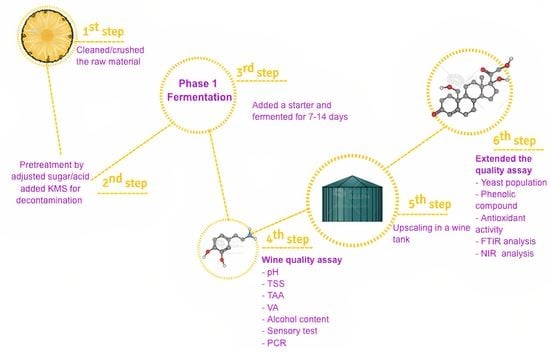
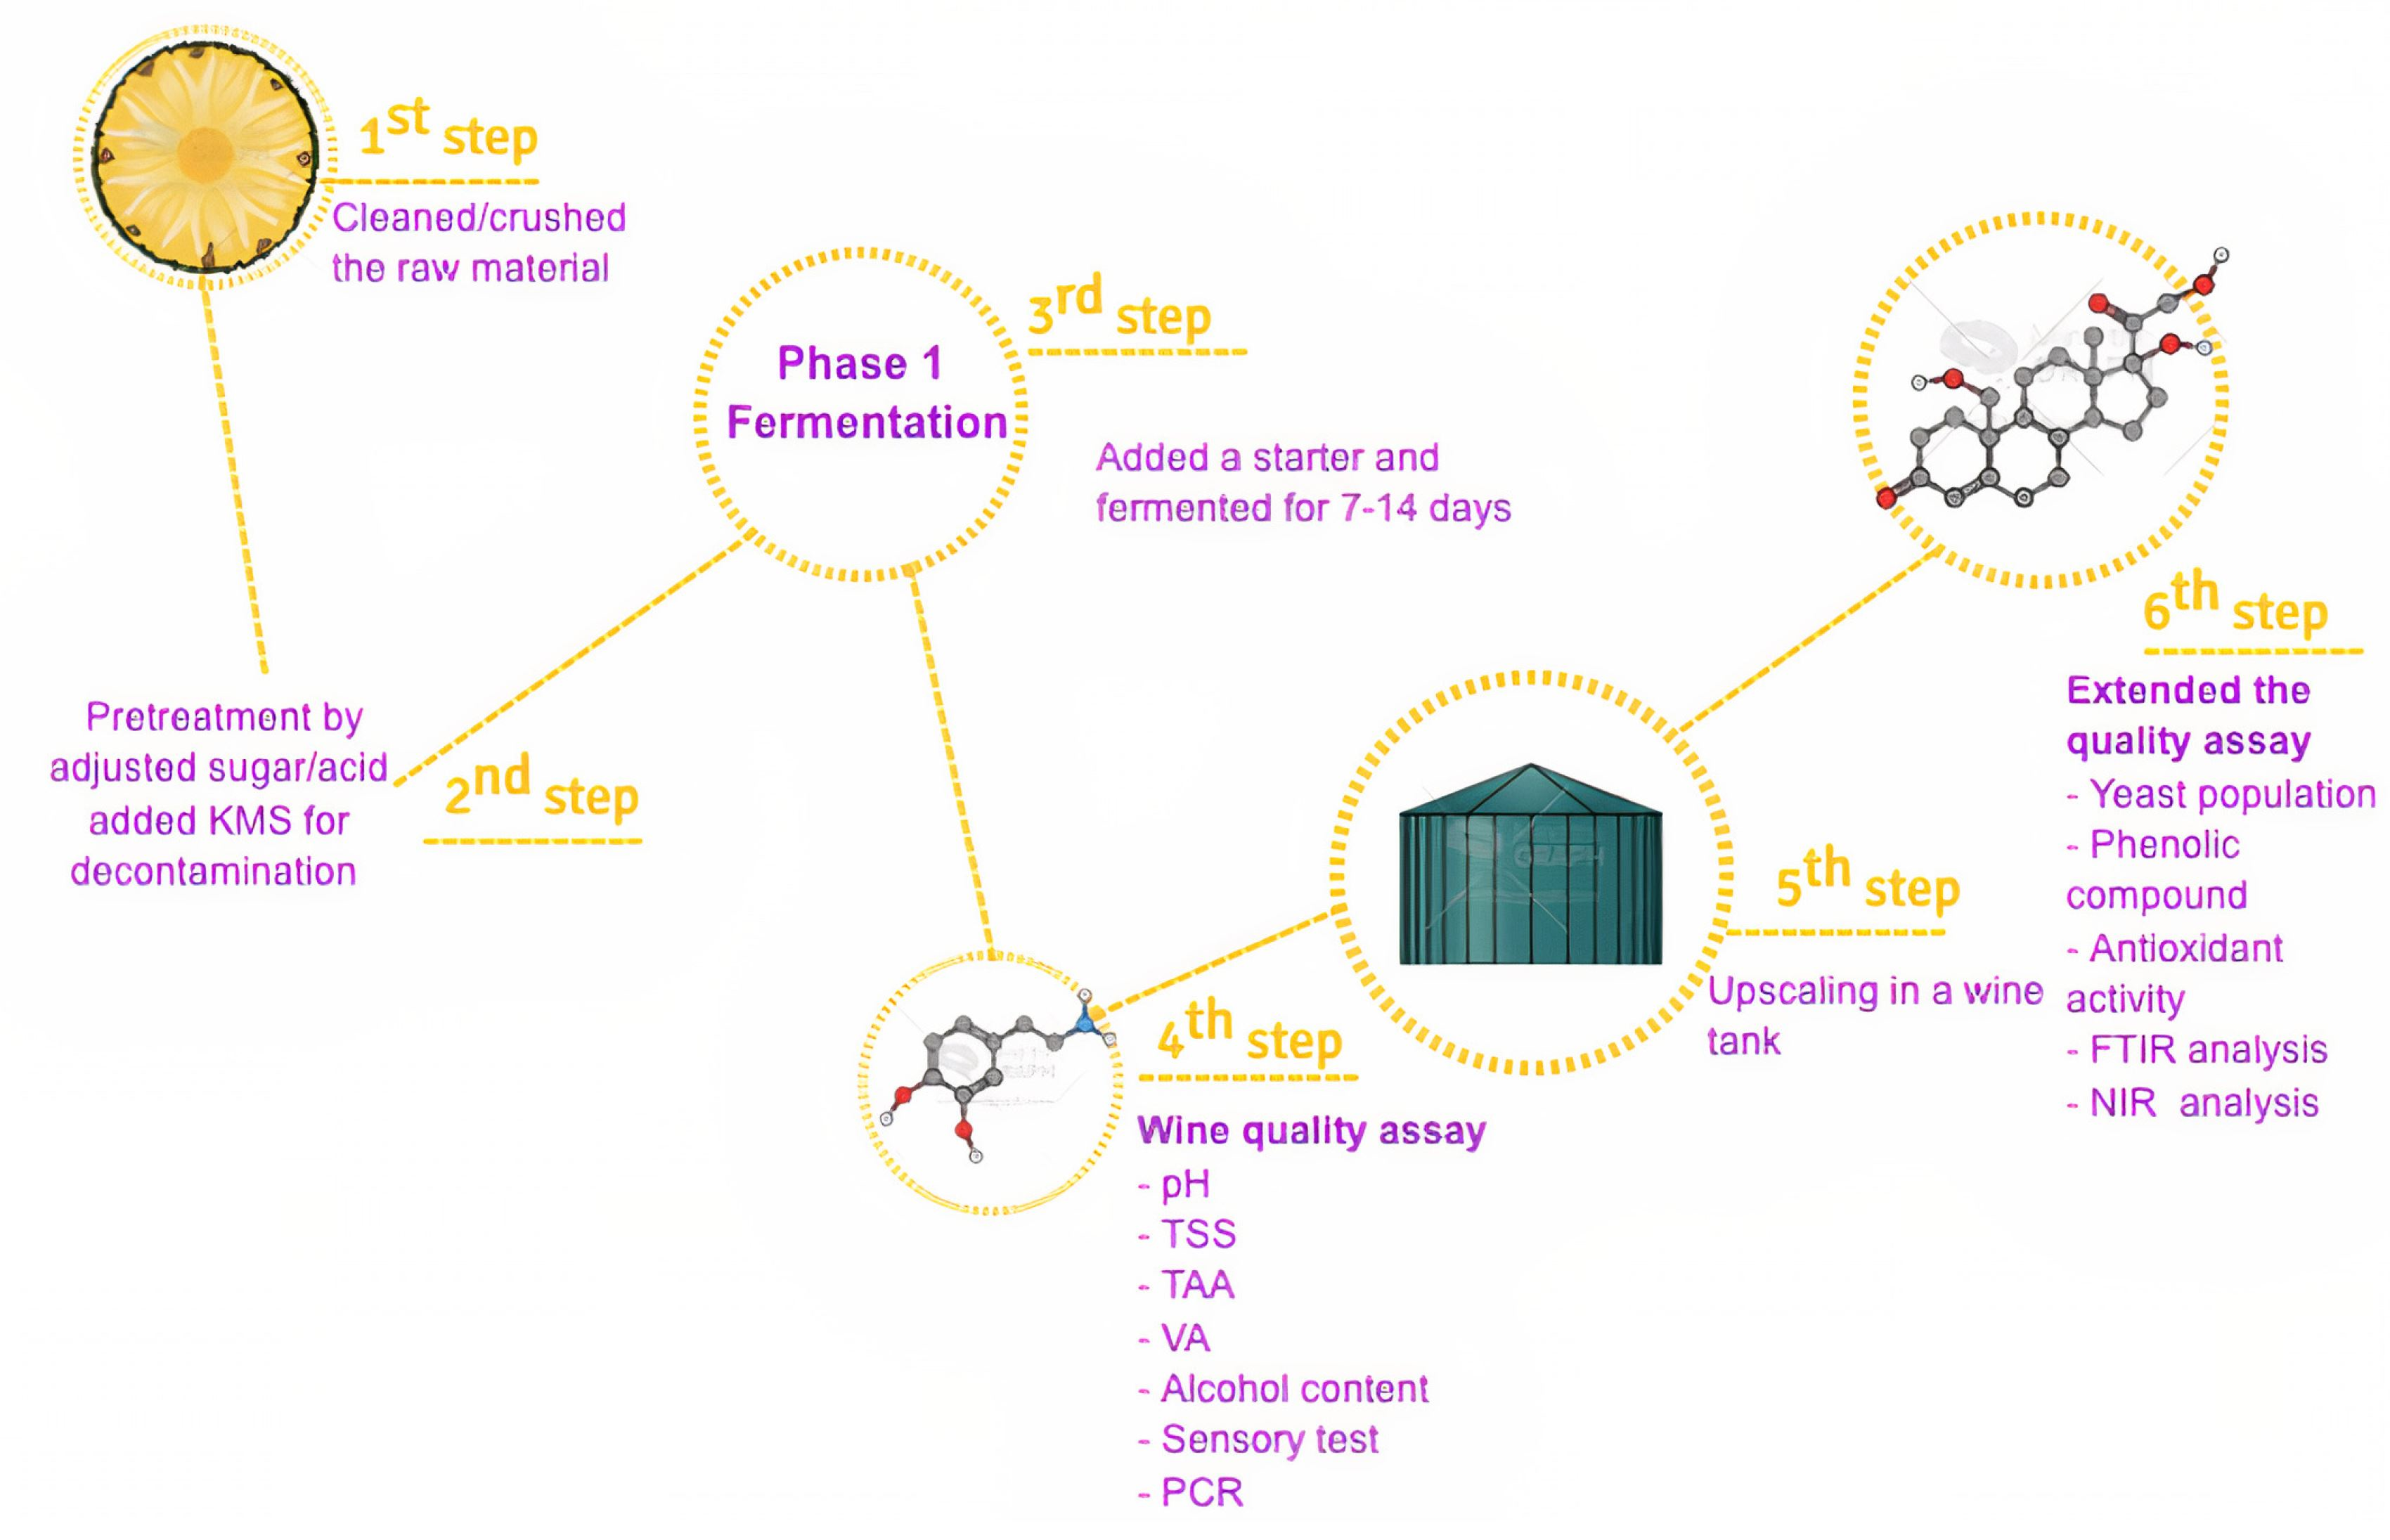
2. Materials and Methods

2.1. Preparation of Yeast Culture

Saccharomyces cerevisiae var. burgundy was used in this study. It was grown on a yeast extract peptone dextrose (YPD) agar. A loop of colonies was then transferred to 250 mL Erlenmeyer flasks containing 100 mL of YPD broth and incubated for 24 h with continuous shaking at 150 rpm for inoculum preparation with yeast cell of 1 × 10⁵ CFU/mL.

2.2. Study on the Ratio of Fresh Pineapple Juice to Water

Pineapple samples (Ananas comosus L. Merr c.v. Patavia) at a ripe stage were purchased from a local market in Bangkok, Thailand. The pineapple samples were cleaned with tap water, peeled, and freshly crushed. Three ratios of pineapple juice to water were mixed to obtain three treatments, which were T1—2:1, T2—1:1, and T3—1:2. The total soluble solids (TSS) and pH of all pineapple juice and water ratios were adjusted to 25°Brix by adding sucrose and four by adding baking soda, respectively. These mixtures were decontaminated by adding potassium metabisulphite (K2S2O5) to achieve a final concentration in the juice of 75–100 mg/L. After 24 h, 5% v/v of inoculum culture was transferred to all treatments, and fermentation was conducted at 25 °C for ten days. These fermented pineapple juices were collected for microbiological determination and chemical analysis.

2.3. Chemical Analysis

The pH, total titratable acidity (TTA) [6], total volatile acidity (VA) [7] alcohol content, TSS, and yeast population were investigated throughout the experiment.
Briefly, pH was measured using a pH meter (Model PH1200, Horiba, Japan). TTA and VA of pineapple wine samples were determined as citric acid and acetic acid, respectively, by titration with 0.1 N NaOH using phenolphthalein as an indicator. Volatile acids were separated from the wine samples by steam distillation before titration using sodium hydroxide to a pink endpoint indicated by phenolphthalein solution. All measurements were conducted in triplicate.
Alcohol concentration was assessed using gas chromatography (Chromosorb-103, GC4000; GL Sciences; Tokyo, Japan) with an HP5 capillary (30 m × 0.32 mm × 0.25 μm; JW Scientific; Folsom, CA, USA). The TSS was investigated at 20 °C using a hand refractometer (RHB-32ATC), reported as °Brix for soluble solid contents. Reducing sugar was estimated by the Nelson-Somogyi assay [8]. The nitrogen content of pineapple juice was determined by AOAC [9]. As well as the color values, L*, a*, b* [10] were determined by MiniScan EZ (MSEZ1949, HunterLab, Reston, VA, USA).
Pineapple wine samples were serially diluted in 0.1% sterile distilled water. The yeasts in each dilution were enumerated and isolated by spread inoculation of 0.1 mL on Plate Count Agar and incubation at 28 °C for 1–2 days. This analysis was done in triplicate. Yeast colonies were counted to give populations as log CFU/mL.

2.4. Determination of Total Phenolics Compounds

The content of the total phenolic compounds in the wine sample was determined using Folin–Ciocalteu colorimetric [11]. Briefly, 0.3 mL of each sample was mixed with 1.5 mL of the Folin–Ciocalteu reagent, and then 1.2 mL of 7.5% (w/v) sodium carbonate solution was added. The samples were kept in the dark for 30 min at room temperature. Percent absorbance was measured by a spectrophotometer (Thermo Fisher Scientific 4001/4 Genesys 20, Waltham, MA, USA) at a 765-nm wavelength. A calibration curve was established from a gallic acid standard solution.

2.5. Determination of Antioxidant Activity

The total antioxidant of pineapple wine was estimated using DPPH Radical scavenging capacity assay following the procedure described by Vidal-Gutiérrez et al. [12]. The scavenging activity of the free radicals was evaluated by measuring the absorbance at 517 nm, after a 30 min dark reaction, in a UV-vis spectrophotometer (Shimadzu UVmini-1240, Kyoto, Japan). Results were expressed as μmol equivalents of Trolox 100/g of fresh sample.

2.6. Fourier Transform Infrared (FTIR) Analysis

FTIR spectrometer (Nicolet IR200 FTIR, Thermo Scientific, Madison, WI, USA) were used to perform a qualitative analysis of the sample. The spectra were also scanned in the 600–4000 cm−1 range with a spectral resolution of 4 cm−1 and plotted as intensity versus wave number [13]. Each evaluated spectrum is a mean of 32 scans.

2.7. Sensory Evaluation

All treatments of pineapple wine were assessed by 40 panelists using a 9-point hedonic scale to statistically analyze differences in sensory characteristics between 3 treatments of pineapple wine samples. The sensory test assessed appearance, aroma, taste, sweetness, and overall liking.

2.8. Statistical Analysis

The samples were determined differences between the treatment means by Statistical analysis of variance followed by Duncan’s multiple range test using SPSS Software v. 20.0 (IBM Analytics, New York, NY, USA). Values were considered significant when p < 0.05.
The data set of three wine samples with different treatments consisted of the physicochemical and sensory variables (X) and an overall liking variable (Y). The principal component regression (PCR) was calculated by the Unscrambler software (version 9.8: CAMO AS, Trondheim, Norway). The optimum number of principal components (PC) with the high explained variables, nearly 100%, was chosen for the model. The plots of score and loading were obtained and interpreted to correlate the variables and overall liking of a target wine product.

3. Results and Discussion

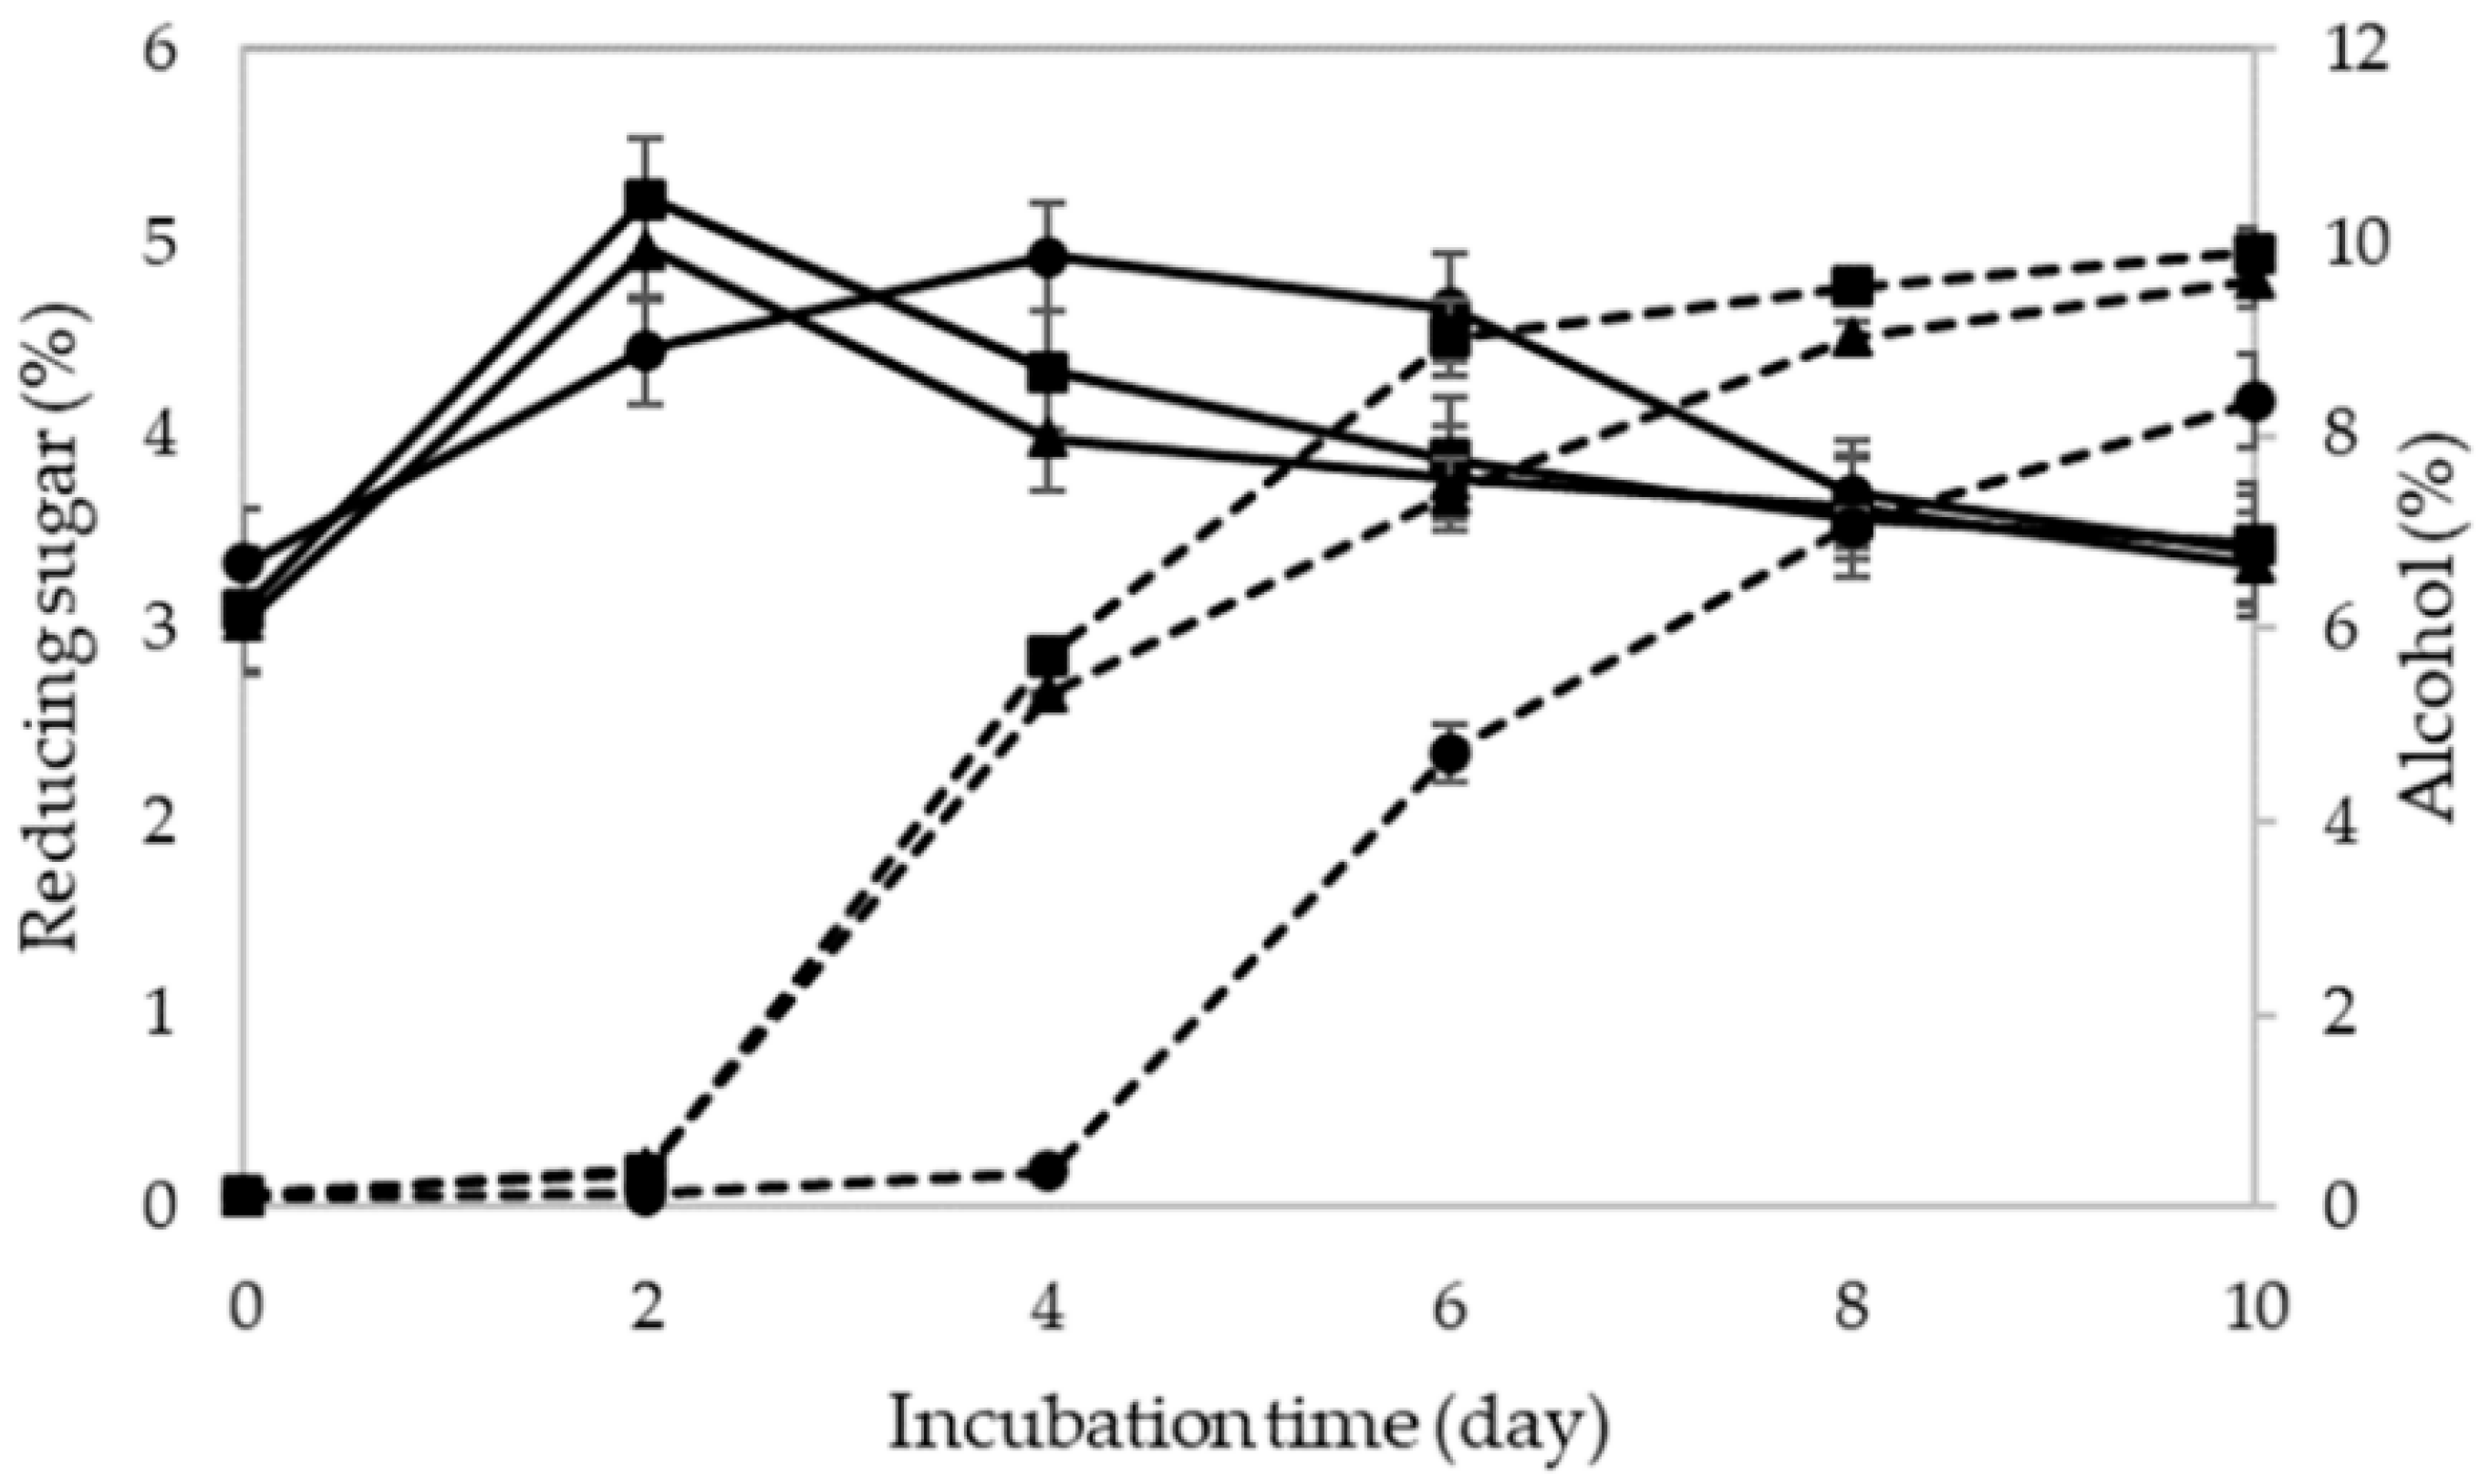
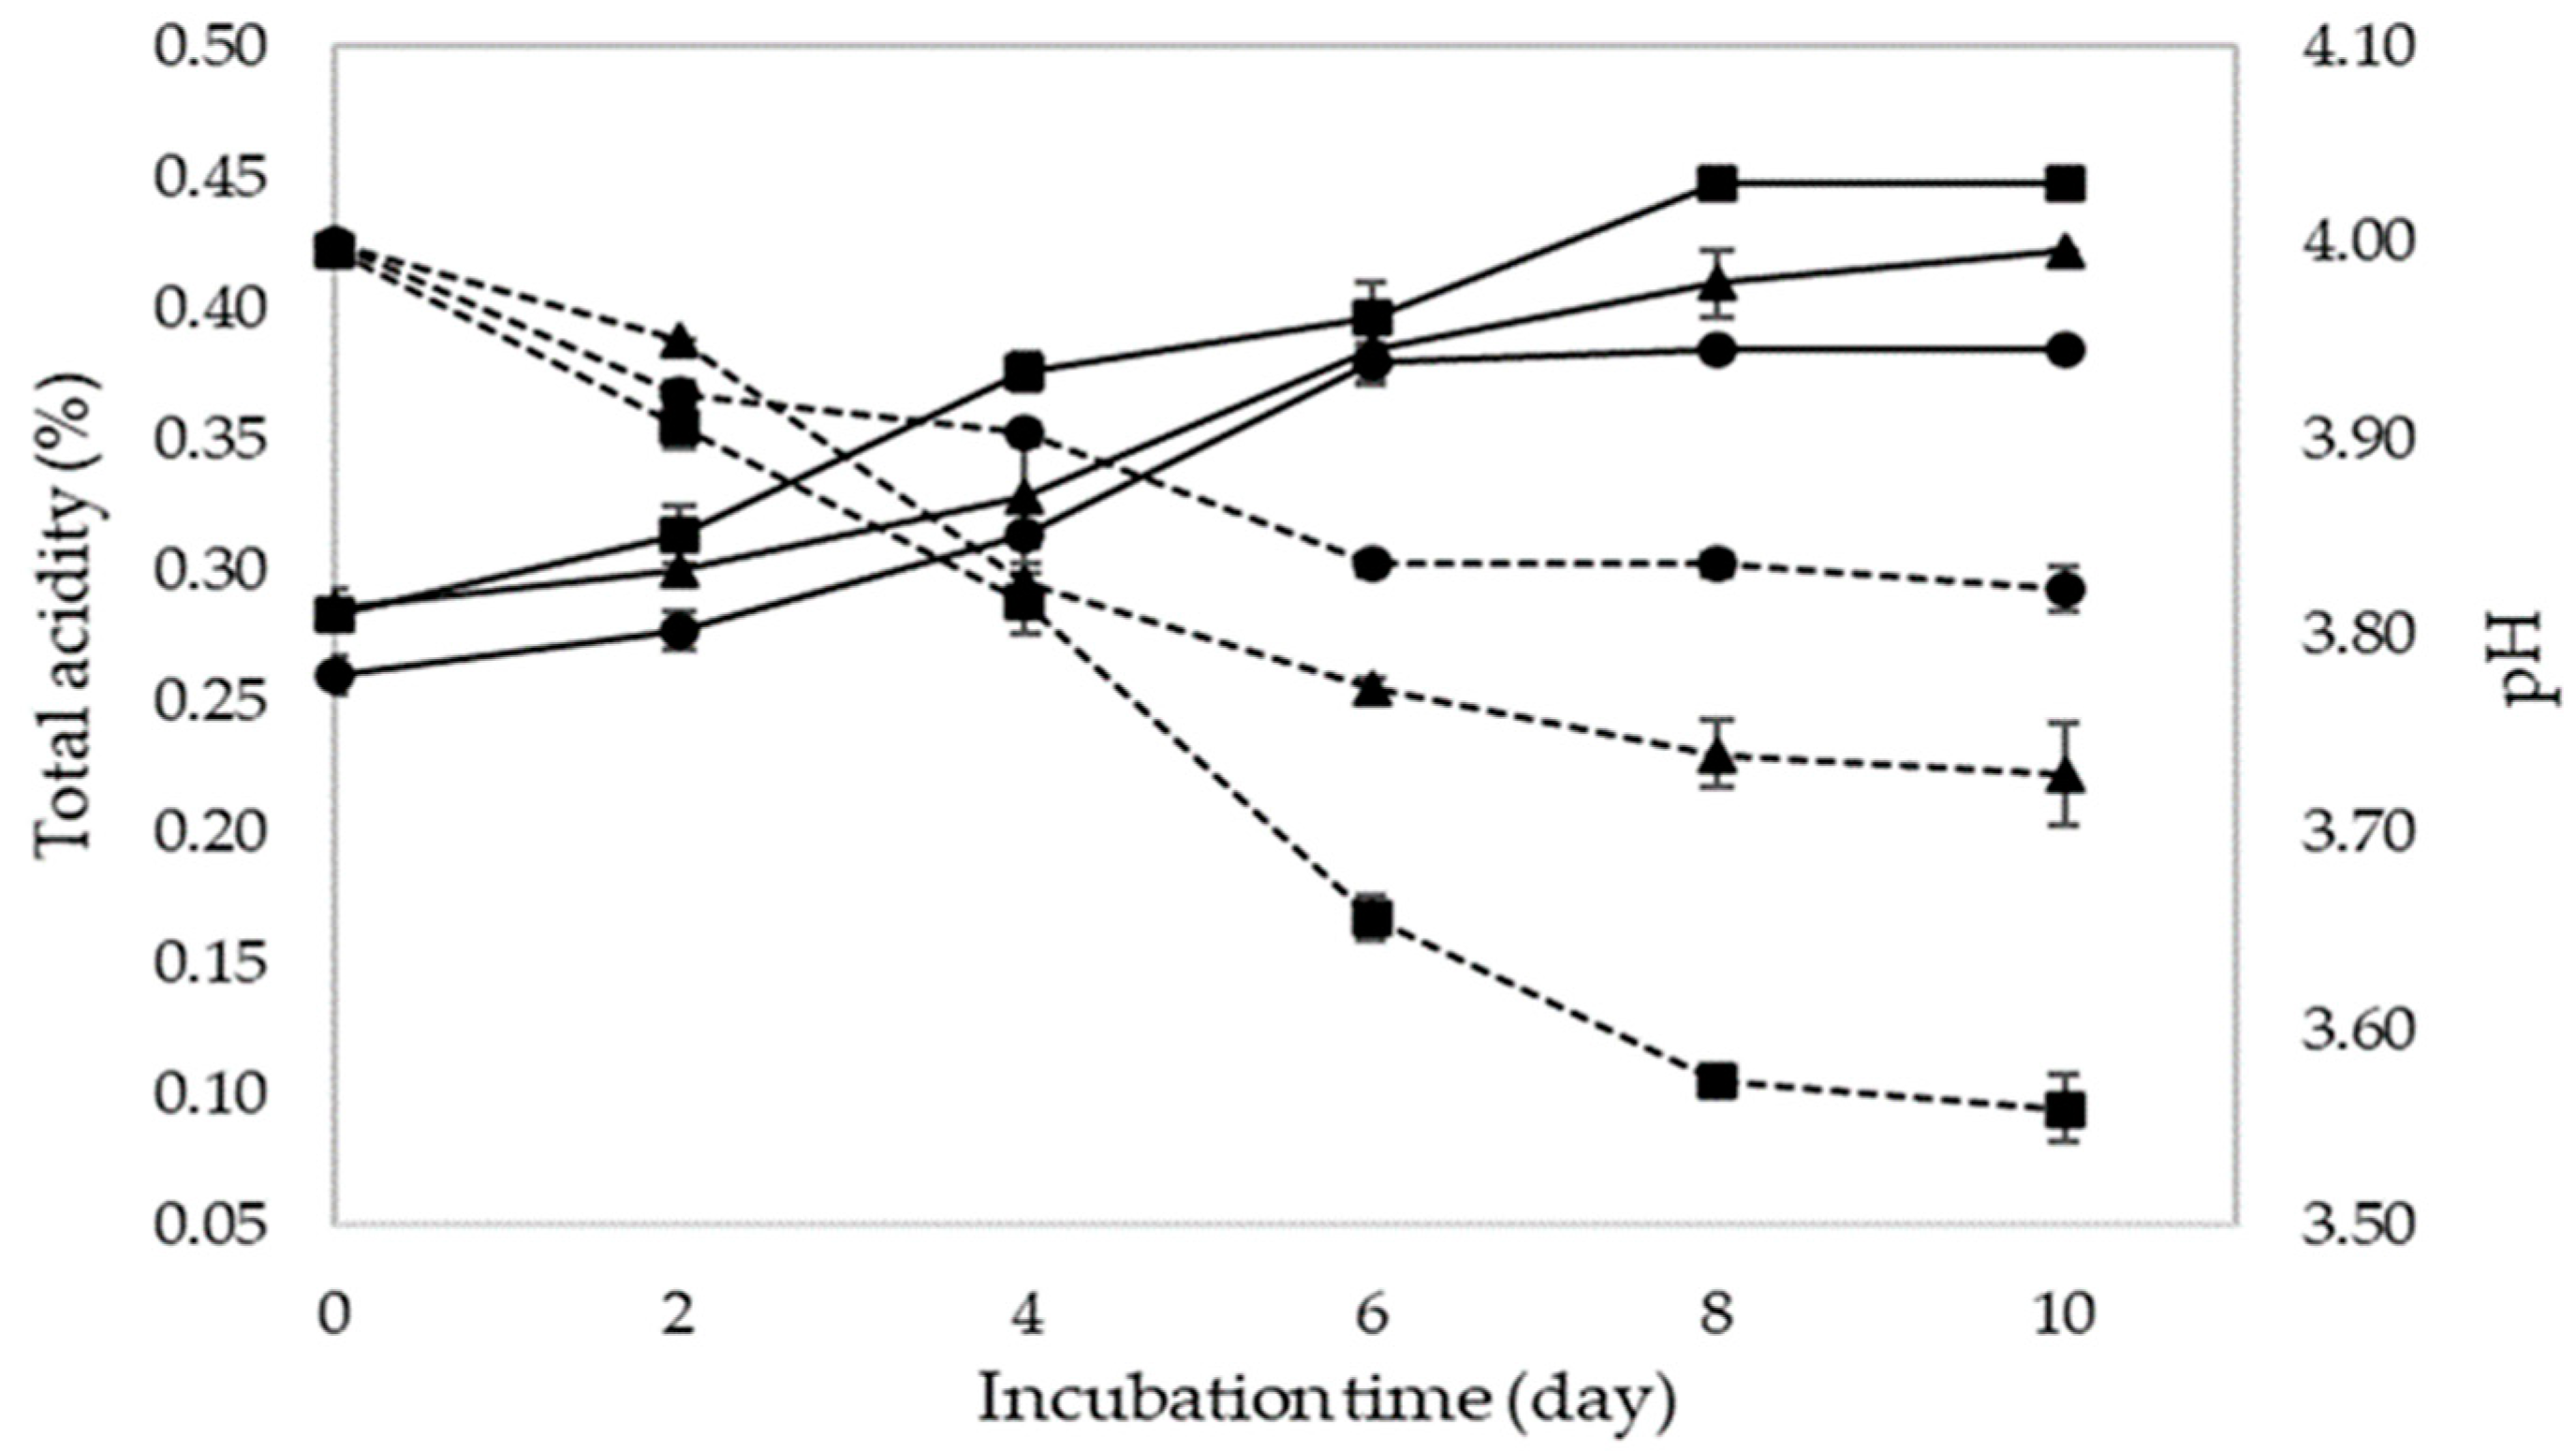
3.1. Study on the Ratio of Fresh Pineapple Juice to Water

The chemical characteristics of Patavia pineapple juice are shown in Table 1. Based on the analysis results, the pH, TTA, and TSS of pineapple juice were 3.84, 0.378 (% w/v), and 14 °Brix, respectively. The pH, TSS, and nitrogen content were similar to Queen pineapple juice and were 3.7, 18.1, and 0.08, respectively [14]. In addition, nitrogen content was sufficient for yeast growth in the initial phase of fermentation, which should be more than 0.025 g/L [15]. As yeast can grow and conduct fermentation in pineapple juice, it indicates that this juice could be used as raw material for wine fermentation.
The chemical analysis of all treatments of pineapple wine fermentation is shown in Table 2. Conversion of fermentable sugar of pineapple juice to alcohol was assessed using Saccharomyces cerevisiae var. burgundy during ten days of fermentation. Alcohol concentration of all treatments rapidly increased with increasing fermentation time. Reducing sugar concentration at a ratio of 2:1 and 1:1 increased rapidly, reached its maximum at 2 days, and then decreased. Similarly, the maximum reducing sugar concentration was found at 4 days in the ratio of 1:2. The hydrolysis of sucrose generates a mixture of fructose and glucose, which resulted in increasing of reducing sugar in the first stage of fermentation and then turning to alcohol. (Figure 1). The highest alcohol concentration was obtained at a ratio of 2:1 (10.71% v/v) was significantly different with a ratio of 1:1 (9.61% v/v) and 1:2 (8.35% v/v). However, the higher nutrients of ratio 2:1 than other ratios may increase the growth and fermentation resulting in the highest alcohol content.
The TAA at ratios 2:1, 1:1 and 1:2 was found to be 0.448, 0.422, and 0.384% v/v, respectively, with significant differences (p < 0.05) as compared to each other. At ratio 2:1 had the highest concentration of pineapple juice containing citric acid, which is the main organic acid of pineapple juice; therefore, the TAA of this ratio was the highest. Besides, acidity increased due to yeast fermentation, resulting in lower pH during fermentation (Figure 2). The standard pH of the wine was in the range of 3–4. The pH value of ratio 2:1 decreased from 4.0 to 3.57–3.84, corresponding to the increasing TAA.
Volatile acids found in wine are a group of short and medium-chain fatty acids, which measure all the steam distillable volatile acids present in wine. These VA included acetic, lactic, formic, butyric, and propionic acid [16]. Most of all VA in wine was found to be acetic acid around 90%, and the rest are other organic acids [17]. Table 2 shows that VA (as acetic acid) insignificantly increased. VA is a variable determining wine quality. VA can increase throughout wine production due to microbial activity, especially Acetobacter acetii and malolactic fermentation by lactic acid bacteria [18]. Large quantities of VA are seen as a spoilage characteristic. Generally, acetic acid should not be more than 0.7 g/L [19].
The findings from the current study are consistent with several other studies. Chalermsanyakon et al. [20] studied the impact of the concentration juice on the change of pineapple wine characterization. Three ratios of fresh pineapple juice to water at 1:0, 2:1, and 1:1 were investigated. The °Brix and pH of all treatments were adjusted to 20 and 4, respectively. The maximum alcohol content of 12.40% was obtained at a ratio of 2:1 with 4.39 °Brix and pH 3.64. Chanprasartsuk et al. [14] investigate the pineapple wine fermentation from “Queen” pineapple juice with S. cerevisiae. It was found that this strain could generate the alcohol content to 12.3% (v/v) from the initial TSS of 22 °Brix. After fermentation, pH, TSS, and TAA were 3.9, 8.4 °Brix and 0.67% (v/v), respectively. The production of alcohol was found to increase with decreasing TSSs.

3.2. Pineapple Wine Sensory Evaluation

Table 3 summarizes the mean scores of sensory evaluation of pineapple wines at ratio 2:1 based on a 9-point hedonic scale, where 1 was “dislike extremely” and 9 was “like extremely”. The findings indicated that appearance, aroma, and taste were not significantly different among these ratios. Wine with pineapple juice to water ratio at 2:1 had the highest sweetness and overall liking score. Data for the 9 descriptors from the physicochemical and sensory analysis of pineapple wine was analyzed using PCR (Figure 3). The first principal component, PC1 explained variables X and Y for 93% and 99% of the total variance, respectively. The ratio 2:1 (T1) showed the highest and positive value corresponding with all sensory attributes and the physicochemical except pH and TSS values. On the other hand, pineapple wines at ratio 1:2 (T3) correlated with pH and TSS descriptor appeared much closer to the negative values of PC1 which resulted in the lowest score in terms of sensory evaluation. These results imply that consumer acceptance decreased with increasing pH and TSS, whereas consumer acceptance increased with increased other physicochemical descriptors.

3.3. Yeast Population

Therefore, the optimal ratio for fermenting pineapple wine is a pineapple juice to water ratio at 2:1. The fermentation pattern with S. cerevisiae var. burgundy in an optimal ratio, during day 1, the yeast population increased approximately 2 log cycles (Table 4). The result was due to the availability of sugars from pineapple juice as the energy source is high enough for yeast growth in the log phase. After day two, the yeast populations were slightly decreased, approximately 4 log cycles through to the last day, which was due to yeast strain going through the stationary phase in that fermentation time. After that, the yeast went through an early death phase because the sugar contents decreased; therefore, they cannot grow without those sugars. This result corresponded with the result from previous research. Chanprasartsuk et al. [14] investigated the fermentation profile of “Queen” pineapple juice with S. cerevisiae as a starter. The fermentation profile of “Patavia” pineapple juice in this study was relatively similar to the abovementioned research. The population of S. cerevisiae was increased approximately 2 log cycles and slightly decreased after 2 days through to the last day.

3.4. Total Phenolic Content and Antioxidant Activity

The total phenolic and anthocyanin contents of pineapple wine as influenced by pineapple juice/water ratio is shown in Table 4. Pineapple wine contained total phenolics, and total antioxidant activities determined by DPPH (using diphenyl-p-picrylhydrazyl radical) were 365.80 mg/L of gallic acid equivalents (GAE) and 0.91 mmol/L of Trolox equivalents (TE), respectively. The phenolic content increases from the first to the last day of fermentation, which is contrary to the antioxidant activity. Generally, both the phenolic and antioxidant assays evaluate the reducing capacity which can lead to direct correlations between them [21]. However, this experiment revealed that phenolic concentration was inversely related to antioxidant activity. This could be due to the sulfur and sugar in pineapple juice interfering with the Folin–Ciocalteu reagent-based analytical procedure, which resulted in exaggerated phenolic value [22]. Analysis of phenolic content with Folin–Ciocalteu reagent depends on the dissociation of a phenolic proton leads to a phenolate anion, which is capable of reducing FCR. Phenolic compounds react with the Folin–Ciocalteu reagent to form a blue color. However, other non-phenolic reducing molecules, such as sugars, aromatic amines, sulfur dioxide, ascorbic acid, organic acids, and iron (II), can alter this approach, resulting in greater phenolic content [23]. Here obtained results are consistent with these works. Stratil et al. [24] reported the average contents of phenolic compounds determined by Folin–Ciocalteu reagent and total antioxidant activities determined by DPPH were 90–119 mg/L GAE and 0.61–0.81 mmol/L TE and 874–2262 mg/L GAE and 2.91–8.62 mmol/L TE for white wines and red wines, respectively. Preserova et al. [25] also studied the phenolic profile and antioxidant activity in selected Moravian wines. They found that phenolic compounds of white wine, rose wine, and red wine were 193.7, 238.0, and 1208.2 mg/L GAE, respectively. In addition, Franco-Bañuelos et al. [26] reported the antioxidant capacity with the DPPH method of non-native wine grapes grown in Zacatecas, Mexico was 0.59–0.65 and 0.51–1.74 mmol/L TE for white wine and red wine, respectively. Color description or pineapple wine is defined by the colorimetric parameters, that defines the lightness (L* = 0 black and L* = 100 colorless), a* that measures the greenness (−a*) or the redness (+a*) and b* that measures the blueness (−b*) and the yellowness (+b*). Quite high values of the L* parameter (43.87 ± 1.13) was measured for pineapple wine, thus denoting quite clear samples. The negative, near to zero, a*values (−1.19 ± 0.06, in the green region of the colorimetric space) and the positive b*values (19.31 ± 0.42, in the yellow region of the colorimetric space) indicate the clear yellow appearance of our pineapple wine.
FTIR spectra were used to confirm the presence of both phenolic and antioxidant compounds. FTIR has also been applied to evaluate the quality of pineapple wine samples. The results showed a correlation between the presence of the phenolic and antioxidant compounds measured by the conventional methods and FTIR spectroscopy. Figure 4 shows the FTIR spectra of pineapple wine in the range of 4000–600 cm−1. The sample shows the presence of some regions of interfering compounds, especially water that absorbs at 1750–1590 cm−1 and 3700–3000 cm−1. The absorption at 1045 and 1083 cm−1 and 2850–2960 cm−1 corresponds to C-O and C-H stretching for ethanol. Other bands located from 900–1100 cm−1 are due to C-O valence vibrations and C-O-C stretching vibrations of the carbohydrates, including fructose and glucose. For phenolic compounds, most bands are located at 3000–2960 cm−1 and 1543–966 cm−1, whereas most are located at 2971–2435 cm−1, 2280–1717 cm−1 and 1543–966 cm−1 are signals of antioxidant compound [24]. Similar results were reported in the work of Preserova et al. [26] who reported spectral regions used for the prediction of total phenolic content: 3000–2960 cm−1 and 1457–966 cm−1 for red wine, 1457–966 cm−1 for rose wine, and 3000–2960 cm−1 and 1543–966 cm−1 for white wine. As well as the spectral regions for the prediction of total antioxidant activity were: 2973–2434 cm−1, 2280–1717 cm−1 and 1445–966 cm−1 for red wine, 3730–1034 cm−1, 1032–627 cm−1, and 626–614 cm−1 for rose wine, and 2971–2435 cm−1, 2280–1717 cm−1 and 1543–966 cm−1 for white wine. Besides, the spectra regions prediction of pineapple wine in this research was also based on previous works, including Moreira and Santos [27]. Versari et al. [28] and Fragoso et al. [29]. This section may be divided into subheadings. It should provide a concise and precise description of the experimental results, their interpretation, as well as the experimental conclusions that can be drawn.

4. Conclusions

The results of this study indicate that the Patavia pineapple juice could be a good substrate for wine fermentation using Saccharomyces cerevisiae var. burgundy. The optimized ratio of pineapple juice to water at 2:1 had the highest overall liking and sweetness and reached the highest alcohol concentration at 10.71% (v/v) on day 10 at 25 °C. Results indicated that pineapple could be developed as a value-added product with various health functions. Pineapple wine presents an intermediate antioxidant activity of the phenolic compounds, with values between those for red and white wines. However, the local wines still turn out attractive in terms of lower-priced, high-quality.

Author Contributions

N.N., a corresponding author was supervision, writing, reviewing, editing, and the publication process. A.B. was the project leader and contributed to the conceptualization, funding acquisition, and writing—original draft preparation, while S.K. and K.N. contributed to writing—review and editing and project administration. P.V. and W.A. contributed to resources, validation, and software. C.T. and P.J. performed formal analysis and investigation. S.J. performed methodology. All authors have read and agreed to the published version of the manuscript.

Funding

This research was supported by the Kasetsart University Research and Development Institute, Thailand, under grant numbers Kurdi (FF(KU)15.64).

Institutional Review Board Statement

Not applicable.

Informed Consent Statement

Not applicable.

Data Availability Statement

All data supporting the conclusions of this article are included in the manuscript.

Acknowledgments

Deep appreciation is expressed to the Kasetsart University Research and Development Institute (KURDI) and Agro-Industrial Product Improvement Institute, Kasetsart University, Thailand for their support.

Conflicts of Interest

The authors declare no conflict of interest.

References

  1. Department of Agriculture Extension. Situation of Pineapple Production Review. 2021. Available online: https://www.oae.go.th/view/1/%E0%B8%95%E0%B8%B2%E0%B8%A3%E0%B8%B2%E0%B8%87%E0%B9%81%E0%B8%AA%E0%B8%94%E0%B8%87%E0%B8%A3%E0%B8%B2%E0%B8%A2%E0%B8%A5%E0%B8%B0%E0%B9%80%E0%B8%AD%E0%B8%B5%E0%B8%A2%E0%B8%94%E0%B8%AA%E0%B8%B1%E0%B8%9A%E0%B8%9B%E0%B8%B0%E0%B8%A3%E0%B8%94%E0%B9%82%E0%B8%A3%E0%B8%87%E0%B8%87%E0%B8%B2%E0%B8%99/TH-TH%E0%B8%B2%E0%B8%99/TH-TH (accessed on 12 August 2021).
  2. Corazza, M.L.; Rodrigues, D.G. Preparation and characterization of orange wine. Quim. Nova 2001, 24, 449–452. [Google Scholar]
  3. Jin, Z.M.; He, J.J.; Bi, H.Q.; Cui, X.Y.; Duan, C.Q. Phenolic compound profiles in berry skins from nine red wine grape cultivars in Northwest China. Molecules 2009, 14, 4922–4935. [Google Scholar] [CrossRef]
  4. Shahidi, F.; Zhong, Y. Measurement of antioxidant activity. J. Funct. Food 2015, 18, 757–781. [Google Scholar] [CrossRef]
  5. Moreira, J.L.; Marcos, A.M.; Barros, P. Proficiency test on FTIR wine analysis. Cienc. Tec. Vitivinic. 2002, 17, 41–51. [Google Scholar]
  6. IFU. Determination of Titratable Acidity. IFU Analysis No. 3. 2007. Available online: https://www.ifu-fruitjuice.com/ (accessed on 12 August 2021).
  7. IFU. Determination of Volatile Acids. IFU Analysis No. 5. 2005. Available online: https://www.ifu-fruitjuice.com/ (accessed on 12 August 2021).
  8. Somogyi, M. Notes on sugar determination. J. Biol. Chem. 1952, 195, 19–23. [Google Scholar] [CrossRef]
  9. AOAC. Official Methods of Analysis of AOAC International, 17th ed.; The Association: Gaithersburg, MD, USA, 2006. [Google Scholar]
  10. CIE. Colorimetry; Publication CIE 15.2; John Wiley & Sons: Hoboken, NJ, USA, 1986. [Google Scholar]
  11. Lim, Y.Y.; Lim, T.T.; Tee, J.J. Antioxidant properties of several tropical fruits: A comparative study. Food Chem. 2007, 103, 1003–1008. [Google Scholar] [CrossRef]
  12. Vidal-Gutiérrez, M.; Robles-Zepeda, R.E.; Vilegas, W.; Gonzalez-Aguilar, G.A.; Torres-Moreno, H.; López-Romero, J.C. Phenolic composition and antioxidant activity of Bursera microphylla A. Gray. Ind. Crops Prod. 2020, 152, 112412. [Google Scholar] [CrossRef]
  13. Augustine, S.K.; Bhavsar, S.P.; Kapadnis, B.P. A non-polyene antifungal antibiotic from Streptomyces albidoflavus PU 23. J. Biosci. 2005, 30, 201–211. [Google Scholar] [CrossRef]
  14. Chanprasartsuk, O.; Pheanudomkitlert, K.; Toonwai, D. Pineapple wine fermentation with yeasts isolated from fruit as single and mixed starter cultures. Asian J. Food Agro-Ind. 2012, 5, 104–111. [Google Scholar]
  15. Ribéreau-Gayon, P.; Dubourdieu, D.; Donéche, B.; Lonvaud, A. Handbook of Enology: The Microbiology of Wine and Vinifications; John Wiley & Sons: Chichester, UK, 2006; pp. 79–113. [Google Scholar]
  16. Zoecklein, B.; Fugelsang, K.; Gump, B.; Nury, F. Wine Analysis and Production; Springer Science & Business Media: New York, NY, USA, 1999. [Google Scholar]
  17. Pretorius, I.; Lambrechts, M. Yeast and its importance to wine aroma: A review. S. Afr. J. Enol. Vitic. 2000, 21, 97–129. [Google Scholar]
  18. Du Toit, W.J.; Pretorius, I.S. The occurrence, control and esoteric effect of acetic acid bacteria in winemaking. Ann. Microbiol. 2002, 52, 155–179. [Google Scholar]
  19. Drysdale, G.S.; Fleet, G.H. Acetic acid bacteria in winemaking: A Review. Am. J. Enol. Vitic. 1988, 39, 143–154. [Google Scholar]
  20. Chalermsanyakon, W.; Punyanunt, S.; Phadungath, C. Development of pineapple wine from pineapple waste. In Proceedings of the 6th Muban Chombueng Rajabhat University’s Nation Conference 2018, Chom Bueng, Ratchaburi, Thailand, 1 March 2018; Volume 6, pp. 433–438. (In Thai). [Google Scholar]
  21. Huang, D.; Ou, B.; Prior, R.L. The chemistry behind antioxidant capacity assays. J. Agric. Food Chem. 2005, 53, 1841–1856. [Google Scholar] [CrossRef] [PubMed]
  22. Waterhouse, A.L. Determination of total phenolics. Curr. Protoc. Food Anal. Chem. 2002, 6, I1-1. [Google Scholar]
  23. Rover, M.R.; Brown, R.C. Quantification of total phenols in bio-oil using the Folin–Ciocalteu method. J. Anal. Appl. Pyrolysis 2013, 104, 366–371. [Google Scholar] [CrossRef]
  24. Stratil, P.; Kuban, V.; Fojtova, J. Comparison of the phenolic content and total antioxidant activity in wines as determined by spectrophotometric methods. Czech J. Food Sci. 2008, 26, 242–253. [Google Scholar] [CrossRef] [Green Version]
  25. Preserova, J.; Ranc, V.; Milde, C.; Kubistova, V.; Stavek, J. Study of phenolic profile and antioxidant activity in selected Moravian wines during winemaking process by FTIR spectroscopy. J. Food Sci. Technol. 2015, 52, 6405–6414. [Google Scholar] [CrossRef] [Green Version]
  26. Franco-Bañuelos, A.; Contreras-Martínez, C.S.; Carranza-Téllez, J.; Carranza-Concha, J. Total phenolic content and antioxidant capacity of non-native wine grapes grown in Zacatecas, Mexico. Agrociencia 2017, 51, 661–671. [Google Scholar]
  27. Moreira, J.L.; Santos, L. Spectroscopic interferences in Fourier transform infrared wine analysis. Anal. Chim. Acta 2004, 513, 263–268. [Google Scholar] [CrossRef]
  28. Versari, A.; Parpinello, G.P.; Scazzina, F.; Del Rio, D. Prediction of total antioxidant capacity of red wine by Fourier transform infrared spectroscopy. Food Control 2010, 21, 786–789. [Google Scholar] [CrossRef]
  29. Fragoso, S.; Acena, L.; Guasch, J.; Busto, O.; Mestres, M. Application of FT-MIR spectroscopy for fast control of red grape phenolic ripening. J. Agric. Food Chem. 2011, 59, 2175–2183. [Google Scholar] [CrossRef] [PubMed]
Figure 1. Total reducing sugar (solid line) and alcohol content (dash line) of pineapple juice and water at a ratio of 2:1 (■), 1:1 (▲), and 1:2 (●) during wine fermentation.
Fermentation 08 00011 g001
Figure 2. Total acidity (solid line) and pH (dash line) of pineapple juice and water at a ratio of 2:1 (■), 1:1 (▲), and 1:2 (●) during wine fermentation.
Fermentation 08 00011 g002
Figure 3. The PCR biplot of scores and X-loadings for the pineapple wine data (a) and the correlation between physicochemical and sensory variables and an overall liking variable (b).
Fermentation 08 00011 g003
Figure 4. FTIR spectra of pineapple wine measured in range 4000–600 cm−1 with a resolution 2 cm−1 and 32 scans.
Fermentation 08 00011 g004
Table 1. Basic chemical characteristics of fresh pineapple juice.
Chemical CharacteristicsValue ± SD
pH3.84 ± 0.12
Total Soluble Solid (TSS, °Brix)14.0 ± 0.12
Total Titratable acidity (TTA, as citric acid) (% w/v)0.378 ± 0.01
Nitrogen content (% w/v) 0.07 ± 0.01
Table 2. Impact of the ratio of pineapple juice and water on the kinetic parameter of wine fermentation.
Incubation Time (Day)Alcohol Content (%) at Ratio of
Pineapple Juice and Water
Total Reducing Sugar (%) at Ratio of Pineapple Juice and WaterTotal Acidity (%) at Ratio of Pineapple Juice and WaterVolatile Acidity (%) at Ratio of Pineapple Juice and WaterpH at Ratio of Pineapple Juice and
Water
2:11:11:22:11:11:22:11:11:22:11:11:22:11:11:2
00 ± 0.010 ± 0.000 ± 0.003.10 e ± 0.043.03 f ± 0.143.33 d ± 0.140.284 a ± 0.000.286 a ± 0.010.260 b ± 0.010.0015 a ± 0.010.0012 b ± 0.000.0012 b ± 0.004 ± 0.014 ± 0.004 ± 0.00
20.35 a ± 0.080.41 a ± 0.020.14 b ± 0.015.22 a ± 0.064.96 a ± 0.084.44 b ± 0.110.314 a ± 0.010.301 a ± 0.010.277 b ± 0.010.0015 a ± 0.000.0012 b ± 0.000.0013 b ± 0.003.91 c ± 0.013.95 a ± 0.003.92 b ± 0.01
45.72 a ± 0.445.32 a ± 0.180.38 b ± 0.024.34 b ± 0.103.99 b ± 0.104.93 a ± 0.120.375 a ± 0.010.329 b ± 0.020.314 b ± 0.010.0015 a ± 0.000.0013 b ± 0.000.0013 b ± 0.003.82 ± 0.023.83 ± 0.013.9 ± 0.01
69.01 a ± 0.307.40 b ± 0.384.71 c ± 0.293.88 c ± 0.073.78 d ± 0.014.66 b ± 0.180.397 ± 0.010.383 ± 0.010.38 ± 0.010.0016 a ± 0.000.0013 b ± 0.000.0013 b ± 0.003.66 c ± 0.013.77 b ± 0.013.84 a ± 0.01
89.53 a ± 0.079.01 b ± 0.157.02 c ± 0.203.57 d ± 0.103.63 d ± 0.053.70 c ± 0.140.448 a ± 0.000.410 b ± 0.010.384 c ± 0.010.0016 a ± 0.000.0013 b ± 0.000.0013 b ± 0.003.57 c ± 0.013.74 b ± 0.023.84 ª ± 0.01
109.89 a ± 0.029.61 a ± 0.278.35 b ± 0.483.43 d ± 0.063.34 e ± 1.343.41 d ± 1.450.448 a ± 0.000.422 b ± 0.000.384 c ± 0.000.0016 a ± 0.000.0013 b ± 0.000.0013 b ± 0.003.56 c ± 0.023.73 b ± 0.033.82 a ± 0.01
a,b,c,e,f mean with the different letters in the same row of each kinetic parameter are significant at p ≤ 0.05. ns in the same row means are not significant at p > 0.05.
Table 3. Sensory evaluation of pineapple wine with various pineapple juices to water ratios.
Ratio of Pineapple Juice to WaterSensory Evaluation Results
Appearance nsAroma nsTaste nsSweetnessOverall Liking
2:16.93 ± 0.776.12 ± 0.986.26 ± 0.886.39 ± 0.90 a6.35 ± 0.96 a
1:16.84 ± 0.886.03 ± 0.756.03 ± 0.955.85 ± 0.98 ab6.08 ± 0.81 ab
1:26.53 ± 0.955.72 ± 0.995.72 ± 0.875.49 ± 1.06 b5.58 ± 0.81 b
a,b mean with the different letters in the same row of each kinetic parameter are significant at p ≤ 0.05. ns in the same row means are not significant at p > 0.05.
Table 4. Total phenolic content, total antioxidant activity, and total plate count of the ratio of fresh pineapple juice to water at 2:1 during wine fermentation.
Time (Days)Phenolic Content (mg/L GAE)Antioxidant Activity
(mmol/L TE)
Total Cell Count (CFU/mL)
0311.57 ± 0.851.34 ± 0.188.70 × 105
1228.07 ± 3.681.46 ± 0.411.10 × 107
2304.69 ± 2.650.92 ± 0.051.10 × 107
3307.95 ± 1.250.91 ± 0.049.50 × 106
4324.25 ± 1.060.91 ± 0.036.77 × 106
5322.01 ± 2.250.97 ± 0.101.96 × 106
6310.57 ± 3.110.82 ± 0.059.13 × 105
7337.62 ± 1.780.87 ± 0.031.55 × 105
8351.53 ± 2.520.94 ± 0.041.50 × 105
9358.73 ± 2.290.91 ± 0.015.75 × 104
10365.80 ± 2.500.91 ± 0.029.90 × 103
Publisher’s Note: MDPI stays neutral with regard to jurisdictional claims in published maps and institutional affiliations.

