

A Comprehensive Mechanistic Yeast Model Able to Switch Metabolism According to Growth Conditions

CentraleSupélec, Laboratoire de Génie des Procédés et Matériaux, SFR Condorcet FR CNRS 3417, Centre Européen de Biotechnologie et de Bioéconomie (CEBB), Université Paris-Saclay, 3 Rue des Rouges Terres, 51110 Pomacle, France
*
Author to whom correspondence should be addressed.
Fermentation 2022, 8(12), 710; https://doi.org/10.3390/fermentation8120710
Submission received: 26 October 2022
/
Revised: 23 November 2022
/
Accepted: 2 December 2022
/
Published: 6 December 2022
(This article belongs to the Topic Bioreactors: Control, Optimization and Applications)
Abstract
:This paper proposes a general approach for building a mechanistic yeast model able to predict the shift of metabolic pathways. The mechanistic model accounts for the coexistence of several metabolic pathways (aerobic fermentation, glucose respiration, anaerobic fermentation and ethanol respiration) whose activation depends on growth conditions. This general approach is applied to a commercial strain of Saccharomyces cerevisiae. Stoichiometry and yeast kinetics were mostly determined from aerobic and completely anaerobic experiments. Known parameters were taken from the literature, and the remaining parameters were estimated by inverse analysis using the particle swarm optimization method. The optimized set of parameters allows the concentrations to be accurately determined over time, reporting global mean relative errors for all variables of less than 7 and 11% under completely anaerobic and aerobic conditions, respectively. Different affinities of yeast for glucose and ethanol tolerance under aerobic and anaerobic conditions were obtained. Finally, the model was successfully validated by simulating a different experiment, a batch fermentation process without gas injection, with an overall mean relative error of 7%. This model represents a useful tool for the control and optimization of yeast fermentation systems. More generally, the modeling framework proposed here is intended to be used as a building block of a digital twin of any bioproduction process.
1. Introduction
Following the growing popularity of digital twins in bio-production [1,2,3], mechanistic modeling has received renewed attention by the scientific community. Whatever the complexity of digital twins at the plant level, mechanistic models remain important, as they provide an excellent summary of available process knowledge. Although scientists and industry experts use these models efficiently, they can be further improved by machine learning, either using data taken from online sources or existing databases. In addition, such models are useful for planning experiments and determining which critical process variables need to be monitored and controlled tightly [4]. More precisely, these mechanistic models allow a better understanding, description, and quantification of the phenomena involved in highly important and complex bioprocesses, such as alcoholic fermentation using the yeast Saccharomyces cerevisiae.
Saccharomyces cerevisiae is a Crabtree-positive yeast of great importance for various biotechnological applications, some of which date back several thousands of years [5]. This yeast strain is commonly used for its capacity to rapidly convert sugars to ethanol and carbon dioxide under both aerobic and anaerobic conditions [6]. Although the Crabtree effect has been extensively studied, much remains to be well understood about this phenomenon. Under aerobic conditions, the alcoholic fermentation process occurs when the glucose concentration exceeds 0.10–0.15 g/L [7], switching to the respiration process when the glucose concentration is below these values. Once the glucose is depleted, ethanol respiration takes place. Even under aerobic conditions, the anaerobic metabolic pathway can also be activated when the rate of biological oxygen uptake exceeds the rate of oxygen supply, which is identifiable by the production of glycerol. In the absence of molecular oxygen, S. cerevisiae carries out the anaerobic fermentation process, producing glycerol for the cytosolic redox balance [8].
The above observations confirm the complexity of yeast metabolism, and its use requires precise control of the process to obtain maximum productivity and quality products. Modeling has proven to be a powerful ally in explaining yeast metabolism and a useful tool for optimizing and controlling fermentation processes under aerobic and anaerobic conditions.
Several mechanistic yeast models have been developed using the typical Monod-type expression (). This mathematical expression considers the limiting substrates as glucose, nitrogen and oxygen. Glucose is particularly important to Saccharomyces cerevisiae, as it is by far the yeast’s preferred carbon source. Yeast cells can sense glucose and utilize it efficiently over a broad range of concentrations, from a few micromolars to even a few molars [9]. Nitrogen is also an essential element in S. cerevisiae’s composition, since it is mandatory for protein synthesis and represents 9% (w/w) of yeast biomass [10]. Oxygen is required to regenerate the NAD+ used in the glycolytic pathway of biomass formation, closing the redox balance for the co-enzyme system NAD+/NADH. The oxidation of cytosolic NADH into NAD can occur through mitochondrial respiration with external NADH dehydrogenase [8,11]. Oxygen is also important for the synthesis of yeast membrane compounds (sterols and unsaturated fatty acids) [12], though this process could be neglected since the required amount is very weak, between 0.3 and 1.5 mgO gDW [13].
Saccharomyces cerevisiae is a superb ethanol producer yet is also sensitive to higher ethanol concentrations, especially under high-gravity or very-high-gravity fermentation conditions. The term “gravity” (actually specific gravity) is commonly used in the fermentation industry to indicate the dissolved solids content of the fermentation medium. The progress of fermentation is usually monitored by measuring the specific gravity of the medium. Very-high-gravity (VHG) technology for fuel alcohol production is defined as “the preparation and fermentation to completion of mashes containing 27 or more grams of dissolved solids per 100 g mash” [14]. The application of VHG fermentation technology, i.e., the use of highly concentrated sugar substrates, for the industrial production of bioethanol has a number of benefits, including decreased process water requirements, energy costs and bacterial contamination risk, increased overall plant productivity and higher ethanol concentrations in the fermentation product that allow considerable savings in energy for distillation [15,16,17]. High contents of saccharides in fermentation medium cause an increase in the osmotic pressure, which has a detrimental effect on yeast cells. However, Saccharomyces cerevisiae, which is commonly used for ethanol production, can ferment an increased amount of sugars in the medium, when all the other required nutrients are in adequate amounts [18]. High ethanol concentrations are the major stress factor during VHG fermentation, but fortunately, many strains of S. cerevisiae are tolerant to very high ethanol concentrations even without genetic manipulation [19]. Research in yeast physiology has revealed that many strains of S. cerevisiae can potentially tolerate far higher ethanol concentration than previously believed [19,20], usually without any conditioning or genetic modifications.
Ethanol tolerance is associated with the interplay of complex networks at the genome level. Although significant efforts have been made to study the ethanol stress response in past decades, mechanisms of ethanol tolerance are not well known [21,22]. Eukaryotic cells have developed diverse strategies to combat the harmful effects of a variety of stress conditions. In the model yeast Saccharomyces cerevisiae, the increased concentration of ethanol as the primary fermentation product will influence the membrane fluidity and be toxic to membrane proteins, leading to cell growth inhibition and ultimately death [23].
These limiting substrates’ and by-products’ inhibition effect on yeast growth rate should be considered in any model describing the metabolism of this complex yeast in order to adequately describe the fermentation process under both aerobic and anaerobic conditions. Each limiting substrate can be easily included in the model with the Monod-like function, and several alternative expressions exist for the inhibiting by-products’ effects [24,25,26,27,28,29,30]. However, the Monod-like function and even the conventional expression used by computer scientists to shift from a limiting substrate to an inhibiting one () are not suitable to model the shift between aerobic fermentation and respiration in the particular case of the Crabtree effect. This phenomenon requires a more precise switching function that allows aerobic fermentation to be turned off and glucose respiration to be turned on when glucose concentration falls under 0.10–0.15 g/L. Several models have already been developed to simulate the fermentation process with Saccharomyces cerevisiae, achieving significant advances in its metabolism description [26,27,31,32,33,34,35,36]. However, much work remains to be done to increase the accuracy of the models in terms of triggering/inhibiting metabolism pathways when the environmental conditions change.
The main objective of this work is to propose an accurate mechanistic model capable of predicting the metabolic shift from glucose aerobic fermentation to glucose respiration when the glucose concentration is lower than 0.10–0.15 g/L and to ethanol respiration once glucose is depleted. This mechanistic model is developed to be as simple as possible, easy to use, and adaptable to the conditions of each system. The model can be adapted to a significant number of existing mutated yeast strains used currently in the industry. In addition, the model activates/deactivates simultaneous anaerobic fermentation in the absence/presence of dissolved oxygen, respectively. This integral model will be calibrated by combining experimental data generated using a commercial yeast strain Saccharomyces cerevisiae used for wine production and modeling in an inverse method where the metabolic pathways’ stoichiometry and kinetics are determined independently when possible.
2. Materials and Methods
2.1. Experimental Setup
A Sartorius Biostat B Plus bioreactor (Figure 1) of 5 L was used in batch mode for the experimental tests.
The yeast used in this study is a strain commercialized by the Institut Oenologique de Champagne under the name IOC Fizz+. This yeast strain is presented in the form of active dry yeast (ADY). It is a Saccharomyces cerevisiae yeast resistant to alcohol up to 14% vol. (approximately 110 g/L of ethanol) and possessing the killer factor (K2). These properties allow it to grow while blocking wild yeasts that do not possess this K2 factor. After rehydration, the number of living yeast is more than 10 billion cells/g, with a purity of less than 10 wild yeasts per million cells. The culture medium was composed of glucose (10–35 g/L), peptone (20 g/L), yeast extract (20 g/L), and silicone antifoaming. The initial temperature was set at 25 °C. The bioreactor was continuously stirred at 295 rpm. It was operated under aerobic and anaerobic conditions ensured by a continuous injection of 500 cc of sterilized air and nitrogen gas flow, respectively. A cooling finger was installed on the gas output to reduce the ethanol and water losses caused by vaporization. The pH and dissolved oxygen values in the liquid phase were continuously measured using internal Hamilton electrodes, while a Pt100 probe was used for temperature measurement.
2.2. Analytical Methods
2.2.1. Yeast, Glucose, Ethanol and Glycerol Concentration Measurements
The yeast concentration was determined using samples of known volumes taken from the bioreactor. These samples were centrifuged in a Centrifuge 5804 R Eppendorf at 2 °C and 5800× g for ten minutes, dried in a Memmert oven at 105 °C during seven days, and weighed. Glucose, ethanol, and glycerol concentrations were measured by high-pressure liquid chromatography with refractive index detection. A Thermo Scientific UltiMate 3000 (HPLC-RI) equipped with a Bio-Rad Aminex HPX-87H column performed the measurements. The mobile phase had a flowrate of 0.5 mL/min with 2 mM H2SO4, and the column temperature was controlled at 30 °C. The supernatants were filtered by HPLC-Certified Syringe Filter Whatman Spartan 0.20 µm/30 mm of regenerated cellulose before the HPLC analysis.
2.2.2. Determination of Parameter
The procedure proposed by Garcia-Ochoa and Gomez [37] was used for the determination, which consisted of filling the bioreactor with the culture medium without yeast inoculation. The dynamic technique of absorption consists of producing the elimination of oxygen in the liquid phase by means of bubbling nitrogen until the oxygen concentration is equal to zero. Bubbling was then changed to air, and the time-increase in the oxygen concentration was recorded. The value can be calculated as the slope of the resulting straight line representing the versus time:
3. Theoretical Formulation
We applied the following assumptions in our model:
- A perfectly stirred bioreactor;
- Constant yeast kinetic parameter values without considering the temperature effect;
- Constant stoichiometric parameter values;
- A constant chemical composition of yeast, independent of the metabolic process and substrate nature (glucose or ethanol). The yeast elementary composition obtained by Rieger et al. [38] expressed per mol of carbon (, in which , , and ) was used;
- Glycerol and ethanol formation pathways which are included; however, pathways for the production of other by-products, such as fusel alcohols, were not considered;
- Glycerol consumption under aerobic conditions was not considered;
- A constant oxygen transfer rate coefficient without including the influence of medium properties variation throughout the study.
3.1. Stoichiometry
In the absence of molecular oxygen, S. cerevisiae carries out anaerobic fermentation (Equation (2)), producing glycerol for the cytosolic redox balance [8].
It is well known that S. cerevisiae is a Crabtree-positive yeast that exhibits fermentation in aerobic conditions producing ethanol (Equation (3)) when the glucose concentration exceeds 0.10–0.15 g/L [7].
Once the glucose concentration reaches values below this threshold, the metabolism switches from aerobic fermentation to respiration (Equation (4)):
Even when aerobic conditions are established in our model, the anaerobic fermentation pathway is still included. In some cases, the specific respiration rate in a bioreactor is limited by low concentrations of dissolved oxygen. The anaerobic fermentation pathway is then partly activated, in which case, both ethanol and glycerol are produced. In anaerobic cultures of wild-type Saccharomyces cerevisiae, glycerol production is essential to reoxidize NADH produced in biosynthetic processes. Glycerol consequently becomes a major by-product during the anaerobic production of ethanol by S. cerevisiae, the largest fermentation process in industrial biotechnology [39,40].
Once glucose is completely depleted, the degradation of ethanol by yeast occurs under aerobic conditions:
These four metabolic pathways are included in the model shown in Figure 2. Depending on the growth conditions, each pathway can be inhibited or partially/fully activated. The following section describes the activation/deactivation of these metabolic pathways via kinetics expressions.
3.2. Kinetics
As the YPD medium used here supplies enough nitrogen, no nitrogen limitation was taken into account in the metabolic pathways. For the other substrates, the limiting effect on the specific growth rate was described as the product of the switching mathematical expressions proposed by Monod, which is represented in the first product term of Equation (6). In contrast, the inhibiting by-products’ effect and the metabolism switching from aerobic to anaerobic conditions and glucose to ethanol respiration were described as a product of a conventional mathematical expression used in most of the biological models, which is represented in the second product term of Equation (6)
where is the maximum growth rate for the process i; is the limiting substrate j; is the half-saturation coefficient for the limiting substrate ; is the inhibiting by-product of j; and is the half-saturation coefficient for the inhibiting by-product .
In the Monod-like function, is a generic substrate concentration, defines the steepness of the function near zero, and the rate is divided by 2 when .
As the Monod-like function is not suitable to model the shift between fermentation and respiration, a smoothed -stepwise function proposed by La et al. [35] was used instead:
The stepwise function is defined by two parameters: the shift value defines the concentration value at which the transition occurs, and the parameter defines the sharpness of this transition. In this case, taking and = 0.125 g/L (the mean value of the glucose transition range), the metabolism transition occurs in the interval of 0.10–0.15 g/L of glucose (Figure 3).
3.3. Matrix Model Representation
A detailed description of the stoichiometry and kinetics of the model’s biological processes is shown in Table 1.
The system of differential equations that describes the biological system is represented in matrix form, establishing the corresponding balance equations
where is the concentration of the component j, is the stoichiometric coefficient corresponding to the biological process i and the component j, and is the rate of the biological process i.
3.4. Model Calibration
The yeast stoichiometry and kinetics of each metabolic pathway were studied independently to the extent that was possible. Experiments with the injection of nitrogen or air were performed to achieve complete anaerobic fermentation (anaerobic sub-model) or aerobic conditions (aerobic sub-model), respectively (step 1, Figure 4). Six batch fermentation experiments (A–F, Table 2) with different initial glucose, ethanol and yeast concentrations were performed to observe the effects of glucose and ethanol on the yeast kinetics during calibration, while experiment G was used to test the calibrated model. The initial conditions of the batch experiments are shown in Table 2.
Most of the model parameters in this work were experimentally determined to the extent that was possible. The remaining model parameters were taken either from the literature or estimated by inverse analysis using the particle swarm optimization method. The oxygen and ethanol half-saturation coefficients were considered the same for all aerobic metabolic pathways. However, for the first time, to our knowledge, different glucose affinities and ethanol tolerances for aerobic and anaerobic conditions were applied in the model, establishing different half-saturation coefficients for glucose and ethanol inhibition. This modeling process was guided by the identification procedure and is notably different from what the literature reports, i.e., that average values of these parameters are used for all metabolic pathways and both for aerobic and anaerobic conditions. The modeling strategy used in the calibration of the developed model is explained in Figure 4. This strategy requires advancing step by step towards maximum complexity, starting with the analysis of experiments under nitrogen injection, which ensures that one single metabolic pathway exists (Equation (2)).
The procedure varies according to the specific metabolic pathway:
Anaerobic fermentation process
The stoichiometry of the anaerobic fermentation process was initially determined experimentally using three experiments (A, B, and C). Kinetics parameters (maximum growth rate and half-saturation coefficients for glucose and ethanol inhibition under anaerobic conditions) were then estimated by inverse analysis (step 2, Figure 4).
Aerobic fermentation processes
Three experiments (D, E, and F) were used to determine the stoichiometry and kinetics of the different aerobic metabolic pathways. The inverse analysis was performed, applying the previously calibrated anaerobic sub-model. This application was required since anaerobic conditions were observed during the aerobic fermentation process when the rate of biological oxygen uptake was higher than the rate of oxygen dissolution provided by the aeration process (step 3, Figure 4).
- For the aerobic fermentation process ( > 0.10–0.15 g/L), all stoichiometric coefficients were determined experimentally, with the exception of the oxygen stoichiometric coefficient determined by inverse analysis. The inverse analysis was required due to the impossibility of performing mass balances caused by the lack of information about the specific form of nitrogen assimilated by the biomass as supplied by the YPD medium. Some kinetics parameters such as oxygen and glucose half-saturation coefficients under aerobic conditions were taken from Sonnleitner and Käppeli [36] and Thierie [33], respectively (Figure 4), while the maximum growth rate and half-saturation coefficient for ethanol inhibition under aerobic conditions were determined by inverse analysis.
- The stoichiometry of the ethanol respiration process was also experimentally determined during the last stages of these three experiments, once glucose was entirely depleted. The oxygen stoichiometric coefficient is also difficult to determine experimentally; this coefficient was taken from Scheiblauer et al. [27], as was the half-saturation coefficient for ethanol [36]. The maximum growth rate was obtained by inverse analysis (step 3, Figure 4).
The inverse analysis was performed by means of an optimization procedure using the mean relative error as the objective function between the experimental data (yeast, ethanol, glycerol, and glucose concentrations) and the model prediction
where is the experimental data value k of the variable j in experiment i, and is the model output data value k of the variable j in experiment i.
The model was implemented in Python, where the ODE system was numerically solved using the solve_ivp method from the integrate SciPy package. The LSODA integration method was used for solving the ODE system; this method is a wrapper of the Fortran solver from ODEPACK that consists of an Adams/BDF method with automatic stiffness detection and switching [41,42].
The calibration process was carried out using the particle swarm optimization (PSO) method from the PySwarm package. The PSO algorithm is based on a simplified social model that is closely tied to swarming theory. A physical analogy for the PSO algorithm might be a swarm of birds searching for a food source. In this analogy, each bird (referred to as the particle) makes use of its own memory as well as knowledge gained by the swarm as a whole to find the best available food source [43]. This algorithm is mainly described by the relative weights of three different mechanisms (interia, memory and socialization), which in this case, were set to 0.6, 0.5, and 0.5, respectively, leading to fast convergence. The calibration parameter ranges were defined using the values reported in the literature.
The quality of the model in terms of experimental data fitting was also evaluated by estimating Pearson’s correlation. This correlation was computed using the pearsonr method from the stats SciPy package in Python.
4. Results and Discussion
4.1. Modeling Yeast Activity under Completely Anaerobic Conditions
Table 3 summarizes the stoichiometry and kinetics parameters of the biological model under completely anaerobic conditions (anaerobic sub-model), which were obtained from the calibration procedure. As explained above, stoichiometry was obtained experimentally under completely anaerobic conditions, while kinetics were determined by inverse analysis. The inverse analysis combined experimental data and modeling using three experimental data sets obtained for different glucose, ethanol and yeast concentrations (experiments A, B, and C).
The optimization process using the PSO method converged to a unique minimum, which is demonstrated by the low standard deviation values obtained for each parameter during the optimization process (below 0.5%, as can be seen in Table 3). Using the optimal parameters, the model was able to reproduce all the experiments, reporting a global mean relative error for all variables of 7% and with a unique set of parameters (Table 4).
Interestingly, the maximum growth rate obtained during the calibration process is the same reported by Verduyn et al. [44] (0.31 h), which validates the quality of the calibration process. On the other hand, the value of the half-saturation coefficient obtained for glucose (1.72 g/L) reveals a larger need for this source of carbon in relation to what is reported in the literature (1 × 10 to 0.5 g/L) [26,27,31,32,33,34,35,36]. Similarly, the high value obtained for the half-saturation coefficient for ethanol inhibition (202.83 g/L) indicates that S. cerevisiae has a high tolerance to ethanol under anaerobic conditions, significantly higher than those reported in the literature (10–26.97 g/L) [26,27].
The model provides very good results in the prediction of the variables’ behavior (Table 4, Figure 5); however, the half-saturation coefficient for ethanol inhibition obtained in this model might not be adequate to simulate anaerobic fermentation processes when dealing with higher ethanol concentrations. According to the inhibition function used in the model and the value of the half-saturation coefficient found for ethanol inhibition, the growth rate would be divided by a factor of two for an ethanol concentration of 202.83 g/L. However, according to Arroyo-López et al. [45], no yeast activity should be observed at this concentration.
The high value of the half-saturation coefficient for ethanol inhibition results from the combination of both the experimental range of ethanol tested here and the shape of the inhibition function, which is too loose to account for toxicity. This problem could be solved with a recalibration process using a wider ethanol concentration range and a different mathematical expression for the inhibition function. For example, applying the function (Equation (7)) would involve a critical value (the ethanol concentration value above which no yeast activity is observed) and the range of inhibitory effect (). This approach could be useful for future modeling research.
In general, the values obtained for the half-saturation coefficients for glucose and ethanol inhibition through the inverse analysis are outside the ranges reported in the literature. Yet these values describe very well the behavior of the main variables of the model. This is an interesting result since it is the first time, to our knowledge, that these parameters have been differentiated in yeast metabolic models for aerobic and anaerobic conditions. The model is consequently more accurate in describing the phenomena since it uses different substrate affinities and inhibitions for each operating condition.
The accuracy of the model for predicting the experimental data was quite good, reporting the highest MRE in predicting glucose concentration and satisfying the adequate description of the trends of all variables in the experimental data (Table 4, Figure 5).
In addition, the correlation analysis between the experimental data and the output variables of the model performed in this study is statistically significant, as its p-values are less than 1 × 10%, which is well below what is expected to achieve acceptable quality (p ≤ 5%). Figure 5 confirms that the model is able to reproduce the behavior of the main experimental variables very well, thus validating the description of the phenomena considered in the model. Even the lowest MRE value obtained for ethanol, the worst variable trend of the model reporting the lowest R-squared value, is still good (Figure 5).
In general, the agreement between the three sets of experimental data and the model outputs is very strong, reporting an overall MRE value in the prediction of all the variables studied of less than 7%. In addition, the model is able to predict yeast metabolism under fully anaerobic conditions at different concentrations of glucose, ethanol, and yeast. These results confirm the robustness of the model and the quality of the calibration method.
4.2. Modeling Yeast Activity under Aerobic Conditions
Modeling the fermentation process under aerobic conditions is more complex, since it involves different metabolic pathways, such as aerobic fermentation and respiration processes, typical of a Crabtree effect positive yeast. The anaerobic fermentation pathway could be also included: even under aerobic conditions, the oxygen uptake can be larger than the rate of dissolved oxygen, partially triggering the anaerobic pathway. This metabolic pathway is verified by the data concerning glycerol production. The dissolved oxygen deficiency also worsens with time due to the decreased oxygen solubility in the medium, which is caused by an increased temperature resulting from metabolic heat release and the increase in the yeast population. Fortunately, the model accounts for these two effects of the anaerobic pathway and the influence of temperature on dissolved oxygen. Different glucose affinity and ethanol inhibition coefficients under aerobic and anaerobic conditions were established in the model, assuming that yeast tolerance to ethanol and affinity for glucose is different under aerobic and anaerobic conditions.
Three test combinations with different initial concentrations of glucose, ethanol, and yeast were performed to consider their influence on yeast kinetics (experiments D, E, and F). Most of the model parameters were taken from the literature, so only four parameters had to be calibrated, considerably simplifying the model calibration process. This simplified calibration process demonstrates the phenomenological character of the model, its universality, and its versatility for use in production.
The optimization process used the PSO method converged to a single minimum (Table 5), reporting a standard deviation in parameter optimization of less than 0.25%.
The model was able to reproduce all experiments, reporting a global mean relative error for all variables of less than 11% (Table 6). In this case, a half-saturation coefficient for ethanol inhibition (19.70 g/L) was obtained under aerobic conditions, which was lower than the same value of the half-saturation coefficient for ethanol inhibition under anaerobic conditions. The differences between these values supports this work’s assumption, i.e., that yeast tolerance to ethanol is different under anaerobic and aerobic conditions (10-fold more tolerant under anaerobic conditions). Arroyo-López et al. [45] studied the inhibitory effect of ethanol using the Lambert and Pearson [46]’s methodology for the estimation of the minimum inhibitory concentration (MIC) and non-inhibitory concentration (NIC) of a compound using optical density (OD) measurements. The MIC is related to the resistance or tolerance of the microorganism to the compound and is the lowest concentration that results in the maintenance or reduction of an inoculum’s viability (marks the concentration above which no growth is observed). In contrast, the NIC is related to the susceptibility of the microorganism to the compound, and it is the concentration above which the inhibitor begins to have a progressive and negative effect on growth [46]. The authors studied some yeast strains, and in the particular case of S. cerevisiae, they obtained values for the NIC and MIC in the ranges of (36.7–73.9 g/L) and (95.6–141.4 g/L), respectively. In our experiments, the ethanol inhibition effect was only observed in the data set in which an initial ethanol concentration over 50 g/L concentration was used, which lies well within the inhibitory concentration ranges reported by Arroyo-López et al. [45].
According to the stoichiometry and kinetics obtained in the present study, the aerobic fermentation process has a lower ethanol production yield, a higher yeast yield, and a higher growth rate than the anaerobic fermentation process. According to Thierie [33], stoichiometry varies as a function of the specific growth rate of the yeast. In contrast, our work uses constant stoichiometric parameters corresponding to the mean values of the experiments performed for the individual metabolic pathways under aerobic and anaerobic conditions (Table 3 and Table 5). However, in all batch fermentation processes carried out in this study, the apparent stoichiometry varies due to the varying partition of the metabolic pathways. Accounting for the varying metabolic pathways partition confers a much better predictive capability on the model. Our model thus has the potential to increase ethanol yield with reduced consumption of time and resources, which would be useful for all ethanol producers.
Figure 6 summarizes the results obtained with the final set of parameters.
In most cases, the model is able to predict the concentrations over time with accuracy. The highest MRE values and the lowest R-squared values were found for glycerol (an MRE of 24.19% and an R-squared of 93.30% for the worse cases, experiment D and E, respectively) (Table 6, Figure 6). Once again, the correlation analysis between the experimental data and the output variables of the model performed in this study is statistically significant, as its p-values are less than 1 × 10%. S. cerevisiae has already been shown to grow by using glycerol as a carbon source under aerobic conditions at low specific growth rates (0.01–0.20 h) [47]. Interestingly, glycerol consumption was observed in experiments E and F beyond 6 h. Yeast growth based on glycerol under aerobic conditions was not included in the model, which might significantly affect the model balance. Improving this yeast model by including this metabolic pathway would be a novel approach and would require the identification of its main metabolites, their stoichiometry, and kinetics.
Individual Metabolic Pathway Contributions under Aerobic Conditions
As stated in Section 4.2, all metabolic pathways are always kept in the model. However, their relative importance is triggered during the culture as a function of growth conditions. The rates of all these pathways can then be obtained from the simulation. The relative rates of each metabolic pathway as integrated over time during the process are depicted in Figure 7 for glucose and ethanol consumption. In the model, ethanol production and utilization are expressed with positive and negative rate values, respectively, because ethanol is a fermentation product that becomes a carbon source for yeast when glucose is depleted. In all cases, the aerobic alcoholic fermentation process is the predominant metabolic pathway.
The highest glucose consumption rates were predicted by the model for experiment F, in which the maximum initial concentrations of glucose and yeast were used. Indeed, an increase in the initial yeast concentration with a constant air supply rate favors the anaerobic fermentation pathway because it increases oxygen consumption rates above the oxygen supply rate, generating anaerobic conditions. However, although a higher initial yeast concentration was used in experiment D than in experiment E, the anaerobic fermentation pathway was activated to a lesser extent in experiment D. These differences are explained by the higher initial ethanol concentration, which inhibits the aerobic fermentation pathway and thus reduces the rate of oxygen consumption. The glucose respiration process in our experiments was almost negligible compared to the other metabolic pathways.
4.3. Model Validation: Yeast Culture without Gas Injection
Our model was validated using a batch fermentation process without gas injection (experiment G) instead of the experiments from the learning database. In this experiment, the gas headspace of the bioreactor was maintained at a constant atmospheric pressure. Even without air injection, oxygen is still transferred from the bioreactor gas headspace to the liquid volume through the agitation process. This oxygen transfer occurs through the oxygen concentration gradient maintained by the biological oxygen consumption in the liquid phase. Consequently, both anaerobic and aerobic metabolic pathways take place simultaneously. In the simulation, the value was replaced by the oxygen transfer mass from the gas headspace, taking the value already estimated by La et al. [35] for the same installation and operation conditions ( s).
As can be seen in Table 7 and Figure 8, the model performs very nicely for this validation test. It allows all variables’ evolution to be predicted with an MRE of less than 11%, reporting a global MRE for all variables of 7%. The trends of all variables were well described, showing a very good correlation coefficient value above 99% (Figure 8), results that are statistically significant as their p-values are less than 1 × 10%. The model also provides an excellent prediction of glycerol production. These results validate the quality, applicability, and accuracy of the model, even under different operating conditions.
Figure 9 depicts the individual metabolic pathway contributions during glucose consumption and ethanol production without gas injection.
Even without gas injection, the aerobic metabolic pathway was partly activated thanks to the oxygen transfer from the gas headspace. This limited mass transfer explains the low activation of the aerobic metabolic pathway compared to the dominant metabolism of the anaerobic pathway. Most of the glucose consumption and ethanol production were associated with the anaerobic metabolic pathway (94.5% and 95.9%, respectively). No ethanol consumption was observed during the experiment, as Figure 9 confirms.
Indeed, this particular case of yeast culture without gas injection more closely resembles real-world scenarios, where alcoholic fermentation processes are partially carried out under anaerobic conditions. Certain designs of bioreactors can allow the oxygen in the gas headspace to be continuously renewed if atmospheric air is allowed to enter, for example, through filters. The line graphs in Figure 9 prove that the model is able to activate/deactivate the corresponding metabolic pathways according to the medium conditions and, more importantly, under different operating conditions than those used for model calibration. The results obtained allow a better understanding of the phenomena occurring in partial anaerobic systems in order to improve process control and optimize operating conditions according to the conditions of the medium.
4.4. Potential Application of This Model
Producers and scientists currently consider modeling to be a promising tool for enhancing bio-production. To this end, databases, mechanistic models, and machine learning need to work in synergy for online process monitoring. This approach is known as hybrid modeling and offers a promising route in the general quest of the digital twin in bio-production [1,2,3]. For this approach to be efficient, the mechanistic model needs to be as predictive as possible. The mechanistic model could be improved either inline by the real-time tuning of some key parameters or online using a dynamic learning database.
Even though the mechanistic model was applied to a specific commercial strain of Saccharomyces cerevisiae, the general modeling approach proposed in this study is a perfect brick for hybrid modeling for any application of bio-production. Our model is constructed for this commercial strain by including the main metabolic pathways of mutant and wild-type yeast strains used for ethanol or yeast production reported in the literature. The model was successfully calibrated and validated for the commercial yeast strain provided by the Institut Oenologique de Champagne under the name IOC Fizz+, thus demonstrating its applicability and universality in ethanol or yeast production systems. It is important to note that, for predicting the metabolism of other yeast strains, model calibration alone may be sufficient if the mutated yeast strain exhibits the same metabolic pathways described in the model. The structural basis of the model can allow other metabolic pathways to be easily included or removed when describing the metabolism of the microorganisms that do not exhibit the same metabolic pathways more accurately.
The predictive model proposed in this paper is valuable not only for alcoholic fermentation but also for other processes, such as the production of chemicals, fuels, foods, and pharmaceuticals, as yeast is one of the most widely used hosts for synthetic biology [48]. One of the disadvantages of the Crabtree effect is the carbon loss due to the ethanol production under aerobic conditions, which leads to a lower biomass formation and consequently a lower production of recombinant proteins [49]. Therefore, the structural base of the developed model could be adapted or serve as a basis for the modeling of other Crabtree-positive yeasts used for the production of therapeutic proteins. The model could then be used as a tool for achieving a better understanding, control, and optimization of the production process.
Beyond the huge domain of engineered yeast strains, the formulation proposed in this work can also be applied to other strains. In particular, the proposed functions that account for the activation or inhibition of pathways and sudden shifts of pathways are universal. For example, our team is currently using this framework to model the Chinese hamster ovary (CHO) cell metabolism to produce antibodies. CHO cells are analogous with the Crabtree effect in that they exhibit a phenomenon known as the Warburg effect, where glucose is fermented to produce lactate even in the presence of oxygen [50]. Even in the presence of oxygen, this first stage of lactic fermentation corresponds to a peak of exponential cell growth, followed by a metabolic shift from the net production to the net consumption of lactate (known as the stationary phase) during which proteins are produced. The similarity between the systems mentioned above suggests that our mechanistic models have the potential to predict the metabolic shift observed for CHO cells, which has the possibility of considerably improving the current state of CHO cell modeling.
Finally, bringing together mechanistic modeling and machine learning can better explain system phenomena that are traditionally difficult to describe. For instance, well-established theoretical knowledge can be formulated as explicit equations, while parameters that cannot be derived from first principles or space-time-varying (latent) states are estimated via a machine learning approach [51]. The development of online sensors using the Raman spectroscopy mechanistic and machine learning models and their hybridization variants have considerably increased their application in bioprocess retro-control, allowing maximum productivity with lower resource consumption.
5. Conclusions
In this study, a robust and predictive yeast model was developed and successfully validated with experimental data from experiments with a commercial yeast strain used for wine production. The model includes a comprehensive set of metabolic pathways that are always present in the model but are more or less activated depending on the growth conditions. A general framework is proposed for the formulation, including functions that account for the activation, inhibition, and shift of metabolic pathways.
Known parameters were taken from the literature, and the remaining parameters were estimated by inverse analysis using the particle swarm optimization method. In all cases, the optimization process using the PSO method converged to a single minimum, reporting a standard deviation in parameter optimization of less than 0.5%. The evaluation of the optimized set of stoichiometric and kinetic parameters on the model allows for the accurate prediction of concentrations over time, reporting global mean relative errors for all variables of less than 7 and 11% under completely anaerobic and aerobic conditions, respectively.
The obtained model is able to switch between aerobic fermentation and glucose-based respiration when the glucose reaches values below 0.10–0.15 g/L. It is also able to activate the anaerobic fermentation metabolic pathway even under aerobic conditions when the rate of oxygen uptake is higher than the rate of dissolved oxygen, as supplied by aeration. Once glucose is depleted under aerobic conditions, the model automatically switches to ethanol degradation.
The model quality and robustness were confirmed with an additional experiment performed without gas injection, and the model describes the main process variables with an overall mean relative error of 7%. The complete formulation and set of parameters are provided in the document so that the reader can implement them for their own needs.
The results provided in this work give new insights towards the behavior of S. cerevisiae. For example, the model better informs the emerging nature of the global stoichiometry and differences in ethanol tolerances, which depend on the evolution of yeast growth conditions over time and the active metabolic pathway. Beyond the application to the yeast strain studied here, this work gives a general framework of mechanistic modeling able to predict the coexistence of several metabolic pathways and their shift along the growth conditions. This framework can be used as a building block of a digital twin of any bio-production.
Author Contributions
Y.G.-H.: conceptualization, methodology, formal analysis, modeling, visualization, writing—original draft preparation, writing—reviewing and editing. E.M.: investigation, methodology. P.P.: conceptualization, methodology, formal analysis, modeling, writing—reviewing and editing, supervision, funding acquisition. All authors have read and agreed to the published version of the manuscript.
Funding
This research was funded by the Région Grand Est, Département de la Marne, Greater Reims (France) and the European Union along with the European Regional Development Fund (ERDF Champagne Ardenne 2014–2020).
Institutional Review Board Statement
Not applicable.
Informed Consent Statement
Not applicable.
Data Availability Statement
All research data were presented in this paper.
Acknowledgments
This study was carried out in the Centre Européen de Biotechnologie et de Bioéconomie (CEBB), supported by the Région Grand Est, Département de la Marne, Greater Reims (France) and the European Union. In particular, the authors would like to thank the Département de la Marne, Greater Reims, Région Grand Est and the European Union along with the European Regional Development Fund (ERDF Champagne Ardenne 2014–2020) for their financial support of the Chair of Biotechnology of CentraleSupélec.
Conflicts of Interest
The authors declare no conflict of interest.
Nomenclature
| Oxygen stoichiometric coefficient for biological process—i in the matrix model representation (mol) | |
| Ammonia stoichiometric coefficient for biological process—i in the matrix model representation (mol) | |
| Yeast stoichiometric coefficient for biological process—i in the matrix model representation (mol) | |
| Ethanol stoichiometric coefficient for biological process—i in the matrix model representation (mol) | |
| Glycerol stoichiometric coefficient for biological process—i in the matrix model representation (mol) | |
| Carbon dioxide stoichiometric coefficient for biological process—i in the matrix model representation (mol) | |
| Water stoichiometric coefficient for biological process—i in the matrix model representation (mol) | |
| S | Substrate concentration (g/L) |
| Half-saturation coefficient for substrate S (g/L) | |
| Saturation oxygen concentration (g/L) | |
| Dissolved oxygen concentration (g/L) | |
| Glucose concentration (g/L) | |
| Ethanol concentration (g/L) | |
| Glycerol concentration (g/L) | |
| Yeast concentration (g/L) | |
| Overall oxygen transfer rate (h) | |
| Half-saturation coefficient for glucose under anaerobic conditions (g/L) | |
| Half-saturation coefficient for glucose under aerobic conditions (g/L) | |
| Half-saturation coefficient for ethanol inhibition under anaerobic conditions (g/L) | |
| Half-saturation coefficient for ethanol inhibition under aerobic conditions (g/L) | |
| Half-saturation coefficient for ethanol (g/L) | |
| Half-saturation coefficient for oxygen (mg/L) | |
| Concentration of the component j in the matrix model representation (g/L) | |
| Specific growth rate of the biological process i in the matrix model representation (g/L/h) | |
| Oxygen partial pressure in the air (atm) | |
| Henry constant at temperature T (mol/L/atm) | |
| Maximum growth rate for process i in the matrix model representation (h) | |
| Limiting substrate j in the matrix model representation (g/L) | |
| Half-saturation coefficient for the limiting substrate in the matrix model representation (g/L) | |
| Inhibiting by-product j in the matrix model representation (g/L) | |
| Half-saturation coefficient for the inhibiting by-product in the matrix model representation (g/L) | |
| Critical glucose concentration for switching from aerobic fermentation to respiration (g/L) | |
| Maximum growth rate for process i in the matrix model representation (h) | |
| Water density at temperature T (mol/L) | |
| Safety factor of switching function for the ethanol respiration process activation | |
| Experimental data value of variable j in experiment i | |
| Model output data value of variable j in experiment i | |
| Stoichiometric coefficient corresponding to the biological process i and the component j | |
| Glucose molar mass (g/mol) | |
| Oxygen molar mass (g/mol) | |
| Ethanol molar mass (g/mol) | |
| Glycerol molar mass (g/mol) | |
| Yeast molar mass (g/mol) |
Appendix A. Biological Rate Expressions
Anaerobic fermentation based on glucose:
Aerobic fermentation based on glucose:
Respiration based on glucose:
Respiration based on ethanol:
where is a safety coefficient to guarantee low values of the mean saturation coefficient in the switching function for the activation of the ethanol respiration process without conditioning the value of the glucose saturation coefficient with a value of 1 × 10.
Aeration
The constant Henry’s value as a function of temperature is estimated using Equation (A6):
where X is the mole fraction of the oxygen dissolved in water when the oxygen partial pressure is 1 atm and where X was estimated using a correlation (Equation (A7)) for the temperature range of 273 to 333 K taken from [52]:
References
- Muldbak, M.; Gargalo, C.; Krühne, U.; Udugama, I.; Gernaey, K.V. Digital Twin of a pilot-scale bio-production setup. In Computer Aided Chemical Engineering; Elsevier: Amsterdam, The Netherlands, 2022; Volume 49, pp. 1417–1422. [Google Scholar]
- Sokolov, M.; von Stosch, M.; Narayanan, H.; Feidl, F.; Butté, A. Hybrid modeling—A key enabler towards realizing digital twins in biopharma? Curr. Opin. Chem. Eng. 2021, 34, 100715. [Google Scholar] [CrossRef]
- Babi, D.K.; Griesbach, J.; Hunt, S.; Insaidoo, F.; Roush, D.; Todd, R.; Staby, A.; Welsh, J.; Wittkopp, F. Opportunities and challenges for model utilization in the biopharmaceutical industry: Current versus future state. Curr. Opin. Chem. Eng. 2022, 36, 100813. [Google Scholar] [CrossRef]
- Lencastre Fernandes, R.; Bodla, V.K.; Carlquist, M.; Heins, A.L.; Eliasson Lantz, A.; Sin, G.; Gernaey, K.V. Applying mechanistic models in bioprocess development. Adv. Biochem. Engin./Biotechnol. 2012, 132, 137–166. [Google Scholar] [CrossRef]
- Parapouli, M.; Vasileiadis, A.; Afendra, A.S.; Hatziloukas, E. Saccharomyces cerevisiae and its industrial applications. AIMS Microbiol. 2020, 6, 1. [Google Scholar] [CrossRef]
- Hagman, A.; Säll, T.; Piškur, J. Analysis of the yeast short-term Crabtree effect and its origin. FEBS J. 2014, 281, 4805–4814. [Google Scholar] [CrossRef] [Green Version]
- Verduyn, C.; Zomerdijk, T.P.; van Dijken, J.P.; Scheffers, W.A. Continuous measurement of ethanol production by aerobic yeast suspensions with an enzyme electrode. Appl. Microbiol. Biotechnol. 1984, 19, 181–185. [Google Scholar] [CrossRef]
- Bakker, B.M.; Overkamp, K.M.; van Maris, A.J.; Kötter, P.; Luttik, M.A.; van Dijken, J.P.; Pronk, J.T. Stoichiometry and compartmentation of NADH metabolism in Saccharomyces cerevisiae. FEMS Microbiol. Rev. 2001, 25, 15–37. [Google Scholar] [CrossRef]
- Johnston, M.; Kim, J.H. Glucose as a hormone: Receptor-mediated glucose sensing in the yeast Saccharomyces cerevisiae. Biochem. Soc. Trans. 2005, 33, 247–252. [Google Scholar] [CrossRef] [PubMed] [Green Version]
- Verduyn, C.; Postma, E.; Scheffers, W.A.; Van Dijken, J.P. Energetics of Saccharomyces cerevisiae in anaerobic glucose-limited chemostat cultures. Microbiology 1990, 136, 405–412. [Google Scholar] [CrossRef] [Green Version]
- Overkamp, K.M.; Bakker, B.M.; Kötter, P.; van Tuijl, A.; de Vries, S.; van Dijken, J.P.; Pronk, J.T. In Vivo Analysis of the Mechanisms for Oxidation of Cytosolic NADH by Saccharomyces cerevisiae Mitochondria. J. Bacteriol. 2000, 182, 2823–2830. [Google Scholar] [CrossRef]
- Sablayrolles, J.M.; Barre, P. Evaluation des besoins en oxygène de fermentations alcooliques en conditions oenologiques simulées. Sci. Des. Aliment. 1986, 6, 373–383. [Google Scholar]
- Rosenfeld, E.; Beauvoit, B.; Blondin, B.; Salmon, J.M. Oxygen consumption by anaerobic Saccharomyces cerevisiae under enological conditions: Effect on fermentation kinetics. Appl. Environ. Microbiol. 2003, 69, 113–121. [Google Scholar] [CrossRef] [Green Version]
- Thomas, K.; Hynes, S.; Jones, A.; Ingledew, W. Production of fuel alcohol from wheat by VHG technology. Appl. Biochem. Biotechnol. 1993, 43, 211–226. [Google Scholar] [CrossRef]
- Wang, F.Q.; Gao, C.J.; Yang, C.Y.; Xu, P. Optimization of an ethanol production medium in very high gravity fermentation. Biotechnol. Lett. 2007, 29, 233–236. [Google Scholar] [CrossRef]
- Tao, X.; Zheng, D.; Liu, T.; Wang, P.; Zhao, W.; Zhu, M.; Jiang, X.; Zhao, Y.; Wu, X. A novel strategy to construct yeast Saccharomyces cerevisiae strains for very high gravity fermentation. PLoS ONE 2012, 7, e31235. [Google Scholar] [CrossRef] [Green Version]
- Singh, A.; Singhania, R.R.; Soam, S.; Chen, C.W.; Haldar, D.; Varjani, S.; Chang, J.S.; Dong, C.D.; Patel, A.K. Production of bioethanol from food waste: Status and perspectives. Bioresour. Technol. 2022, 360, 127651. [Google Scholar] [CrossRef]
- Bafrncová, P.; Sláviková, I.; Pátková, J.; Dömény, Z. Improvement of very high gravity ethanol fermentation by media supplementation using Saccharomyces cerevisiae. Biotechnol. Lett. 1999, 21, 337–341. [Google Scholar] [CrossRef]
- Casey, G.P.; Ingledew, W.M. Ethanol tolerance in yeasts. Crit. Rev. Microbiol. 1986, 13, 219–280. [Google Scholar] [CrossRef]
- Thomas, K.; Ingledew, W. Production of 21% (v/v) ethanol by fermentation of very high gravity (VHG) wheat mashes. J. Ind. Microbiol. 1992, 10, 61–68. [Google Scholar] [CrossRef]
- Ma, M.; Liu, Z.L. Mechanisms of ethanol tolerance in Saccharomyces cerevisiae. Appl. Microbiol. Biotechnol. 2010, 87, 829–845. [Google Scholar] [CrossRef]
- Sostaric, N.; Arslan, A.; Carvalho, B.; Plech, M.; Voordeckers, K.; Verstrepen, K.J.; van Noort, V. Integrated multi-omics analysis of mechanisms underlying yeast ethanol tolerance. J. Proteome Res. 2021, 20, 3840–3852. [Google Scholar] [CrossRef] [PubMed]
- Ding, J.; Huang, X.; Zhang, L.; Zhao, N.; Yang, D.; Zhang, K. Tolerance and stress response to ethanol in the yeast Saccharomyces cerevisiae. Appl. Microbiol. Biotechnol. 2009, 85, 253–263. [Google Scholar] [CrossRef] [PubMed]
- Ghose, T.; Tyagi, R. Rapid ethanol fermentation of cellulose hydrolysate. II. Product and substrate inhibition and optimization of fermentor design. Biotechnol. Bioeng. 1979, 21, 1401–1420. [Google Scholar] [CrossRef]
- Carteni, F.; Occhicone, A.; Giannino, F.; Vincenot, C.E.; de Alteriis, E.; Palomba, E.; Mazzoleni, S. A General Process-Based Model for Describing the Metabolic Shift in Microbial Cell Cultures. Front. Microbiol. 2020, 11, 2332. [Google Scholar] [CrossRef]
- Pham, H.T.B.; Larsson, G.; Enfors, S.O. Growth and energy metabolism in aerobic fed-batch cultures of Saccharomyces cerevisiae: Simulation and model verification. Biotechnol. Bioeng. 1998, 60, 474–482. [Google Scholar] [CrossRef]
- Scheiblauer, J.; Scheiner, S.; Joksch, M.; Kavsek, B. Fermentation of Saccharomyces cerevisiae–Combining kinetic modeling and optimization techniques points out avenues to effective process design. J. Theor. Biol. 2018, 453, 125–135. [Google Scholar] [CrossRef]
- Veloso, I.I.; Rodrigues, K.C.; Sonego, J.L.; Cruz, A.J.; Badino, A.C. Fed-batch ethanol fermentation at low temperature as a way to obtain highly concentrated alcoholic wines: Modeling and optimization. Biochem. Eng. J. 2019, 141, 60–70. [Google Scholar] [CrossRef]
- Amenaghawon, N.; Okieimen, C.; Ogbeide, S. Kinetic modelling of ethanol inhibition during alcohol fermentation of corn stover using Saccharomyces cerevisiae. Int. J. Eng. Res. Appl. 2012, 2, 798–803. [Google Scholar]
- Luong, J. Kinetics of ethanol inhibition in alcohol fermentation. Biotechnol. Bioeng. 1985, 27, 280–285. [Google Scholar] [CrossRef]
- Hanly, T.J.; Henson, M.A. Dynamic metabolic modeling of a microaerobic yeast co-culture: Predicting and optimizing ethanol production from glucose/xylose mixtures. Biotechnol. Biofuels 2013, 6, 44. [Google Scholar] [CrossRef] [PubMed] [Green Version]
- Sulieman, A.K.; Putra, M.D.; Abasaeed, A.E.; Gaily, M.H.; Al-Zahrani, S.M.; Zeinelabdeen, M.A. Kinetic modeling of the simultaneous production of ethanol and fructose by Saccharomyces cerevisiae. Electron. J. Biotechnol. 2018, 34, 1–8. [Google Scholar] [CrossRef]
- Thierie, J. Modeling threshold phenomena, metabolic pathways switches and signals in chemostat-cultivated cells: The Crabtree effect in Saccharomyces cerevisiae. J. Theor. Biol. 2004, 226, 483–501. [Google Scholar] [CrossRef]
- Thierie, J. Two Way Crabtree-Effect Model Enhancement by Maintenance Considerations Addition. J. Theor. Comput. Sci. 2019, 5, 2. [Google Scholar] [CrossRef]
- La, A.; Du, H.; Taidi, B.; Perré, P. A predictive dynamic yeast model based on component, energy, and electron carrier balances. Biotechnol. Bioeng. 2020, 117, 2728–2740. [Google Scholar] [CrossRef]
- Sonnleitner, B.; Käppeli, O. Growth of Saccharomyces cerevisiae is controlled by its limited respiratory capacity: Formulation and verification of a hypothesis. Biotechnol. Bioeng. 1986, 28, 927–937. [Google Scholar] [CrossRef]
- Garcia-Ochoa, F.; Gomez, E. Bioreactor scale-up and oxygen transfer rate in microbial processes: An overview. Biotechnol. Adv. 2009, 27, 153–176. [Google Scholar] [CrossRef]
- Rieger, M.; Käppeli, O.; Fiechter, A. The role of limited respiration in the incomplete oxidation of glucose by Saccharomyces cerevisiae. Microbiology 1983, 129, 653–661. [Google Scholar] [CrossRef] [Green Version]
- Nissen, T.L.; Hamann, C.W.; Kielland-Brandt, M.C.; Nielsen, J.; Villadsen, J. Anaerobic and aerobic batch cultivations of Saccharomyces cerevisiae mutants impaired in glycerol synthesis. Yeast 2000, 16, 463–474. [Google Scholar] [CrossRef]
- Medina, V.G.; Almering, M.J.; van Maris, A.J.; Pronk, J.T. Elimination of glycerol production in anaerobic cultures of a Saccharomyces cerevisiae strain engineered to use acetic acid as an electron acceptor. Appl. Environ. Microbiol. 2010, 76, 190–195. [Google Scholar] [CrossRef] [Green Version]
- Hindmarsh, A.C. Volume 1 of IMACS Transactions on Scientific Computation; Stepleman, R.S., Carver, M., Peskin, R., Ames, W.F., Vichnevetsky, R., Eds.; TNorth-Holland: Amsterdam, The Netherlands, 1983; pp. 55–64. [Google Scholar]
- Petzold, L. Automatic selection of methods for solving stiff and nonstiff systems of ordinary differential equations. SIAM J. Sci. Comput. 1983, 4, 136–148. [Google Scholar] [CrossRef]
- Venter, G.; Sobieszczanski-Sobieski, J. Particle swarm optimization. AIAA J. 2003, 41, 1583–1589. [Google Scholar] [CrossRef] [Green Version]
- Verduyn, C.; Postma, E.; Scheffers, W.A.; van Dijken, J.P. Physiology of Saccharomyces cerevisiae in anaerobic glucose-limited chemostat culturesx. Microbiology 1990, 136, 395–403. [Google Scholar] [CrossRef]
- Arroyo-López, F.N.; Salvadó, Z.; Tronchoni, J.; Guillamón, J.M.; Barrio, E.; Querol, A. Susceptibility and resistance to ethanol in Saccharomyces strains isolated from wild and fermentative environments. Yeast 2010, 27, 1005–1015. [Google Scholar] [CrossRef] [Green Version]
- Lambert, R.; Pearson, J. Susceptibility testing: Accurate and reproducible minimum inhibitory concentration (MIC) and non-inhibitory concentration (NIC) values. J. Appl. Microbiol. 2000, 88, 784–790. [Google Scholar] [CrossRef]
- Ochoa-Estopier, A.; Lesage, J.; Gorret, N.; Guillouet, S. Kinetic analysis of a Saccharomyces cerevisiae strain adapted for improved growth on glycerol: Implications for the development of yeast bioprocesses on glycerol. Bioresour. Technol. 2011, 102, 1521–1527. [Google Scholar] [CrossRef]
- Vieira Gomes, A.M.; Souza Carmo, T.; Silva Carvalho, L.; Mendonça Bahia, F.; Parachin, N.S. Comparison of yeasts as hosts for recombinant protein production. Microorganisms 2018, 6, 38. [Google Scholar] [CrossRef] [Green Version]
- Mattanovich, D.; Branduardi, P.; Dato, L.; Gasser, B.; Sauer, M.; Porro, D. Recombinant Protein Production in Yeasts. In Recombinant Gene Expression. Methods in Molecular Biology (Methods and Protocols); Lorence, A., Ed.; Humana Press: Totowa, NJ, USA, 2012; pp. 329–358. [Google Scholar] [CrossRef]
- Potter, M.; Newport, E.; Morten, K.J. The Warburg effect: 80 years on. Biochem. Soc. Trans. 2016, 44, 1499–1505. [Google Scholar] [CrossRef] [Green Version]
- Reichstein, M.; Ahrens, B.; Kraft, B.; Camps-Valls, G.; Carvalhais, N.; Gans, F.; Gentine, P.; Winkler, A.J. Combining System Modeling and Machine Learning into Hybrid Ecosystem Modeling. In Knowledge-Guided Machine Learning; Chapman and Hall/CRC: Boca Raton, FL, USA, 2022; pp. 327–352. [Google Scholar]
- Green, D.W.; Perry, R.H. Perry’s Chemical Engineers’ Handbook, 8th ed.; The McGraw-Hill Companies, Inc.: New York, NY, USA, 2008. [Google Scholar] [CrossRef]
Figure 1.
Experimental setup of the bioreactor.

Figure 2.
Metabolic pathways of Saccharomyces cerevisiae considering the Crabtree effect. (1) Anaerobic fermentation. (2) Aerobic fermentation (glucose concentration > 0.10–0.15 g/L). (3) Respiration based on glucose (glucose concentration < 0.10–0.15 g/L). (4) Respiration based on ethanol.
Figure 2.
Metabolic pathways of Saccharomyces cerevisiae considering the Crabtree effect. (1) Anaerobic fermentation. (2) Aerobic fermentation (glucose concentration > 0.10–0.15 g/L). (3) Respiration based on glucose (glucose concentration < 0.10–0.15 g/L). (4) Respiration based on ethanol.

Figure 3.
Shift function used to obtain a metabolism transition between aerobic fermentation and respiration processes over the glucose concentration range of 0.10–0.15 g/L.
Figure 3.
Shift function used to obtain a metabolism transition between aerobic fermentation and respiration processes over the glucose concentration range of 0.10–0.15 g/L.

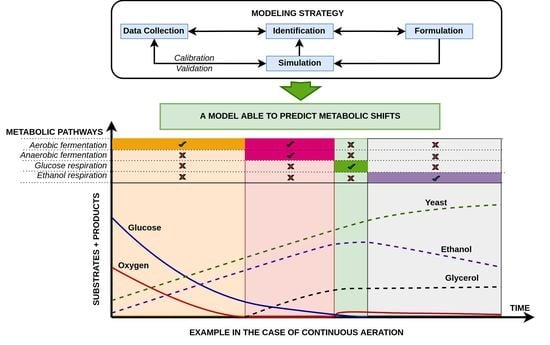
Figure 4.
Modeling strategy.

Figure 5.
Yeast activity simulation under complete anaerobic conditions. Comparison between model output and experimental data.
Figure 5.
Yeast activity simulation under complete anaerobic conditions. Comparison between model output and experimental data.

Figure 6.
Yeast activity simulation under aerobic conditions. Comparison between model output and experimental data.
Figure 6.
Yeast activity simulation under aerobic conditions. Comparison between model output and experimental data.

Figure 7.
Contribution of individual metabolic pathways to glucose utilization and ethanol production: temporal evolution during fermentation (line graphs) and time−average of the stoichiometric ratios (pie graphs). Ethanol consumption by respiration once glucose is depleted is not considered in the time−average of the stoichiometric ratios for ethanol production.

Figure 8.
Model validation: yeast activity simulation without gas injection. Comparison between model output and experimental data.
Figure 8.
Model validation: yeast activity simulation without gas injection. Comparison between model output and experimental data.

Figure 9.
Contribution of individual metabolic pathways to glucose utilization and ethanol production: temporal evolution during fermentation in the absence of gas injection (line graphs) and time−average of the stoichiometric ratios (pie graphs). Ethanol consumption by respiration once glucose is depleted is not considered in the time−average of the stoichiometric ratios for ethanol production (/dt and /dt are the glucose utilization and ethanol production and utilization rates, respectively).


Table 1.
Matrix representation of the biological model.
| j | 1 | 2 | 3 | 4 | 5 | ||
|---|---|---|---|---|---|---|---|
| i ↓ | Rate | ||||||
| 1 | Anaerobic fermentation based on glucose | 1 | |||||
| 2 | Aerobic fermentation based on glucose | 1 | |||||
| 3 | Respiration based on glucose | 1 | |||||
| 4 | Respiration based on ethanol | 1 | |||||
| 5 | Aeration | 1 |
The process expression rates are shown in Appendix A.
Table 2.
Initial conditions of batch fermentation experiments performed under anaerobic and aerobic conditions.
Table 2.
Initial conditions of batch fermentation experiments performed under anaerobic and aerobic conditions.
| Exp. | S (g/L) | S (mg/L) | S (g/L) | S (g/L) | X (g/L) | T (°C) | Conditions |
|---|---|---|---|---|---|---|---|
| A | 13.75 | - | 52.13 | 0.26 | 2.43 | 26.10 | N injection |
| B | 15.37 | - | 10.60 | 0.12 | 0.30 | 25.20 | N injection |
| C | 31.06 | - | 10.99 | 0.15 | 0.81 | 26.50 | N injection |
| D | 10.24 | 6.08 | 49.44 | 0.16 | 0.81 | 24.60 | Air injection |
| E | 15.93 | 5.84 | 9.11 | 0.10 | 0.50 | 26.10 | Air injection |
| F | 30.79 | 2.86 | 9.84 | 0.25 | 1.31 | 25.20 | Air injection |
| G | 12.41 | - | 1.27 | 0.15 | 0.40 | 23.80 | - |
Table 3.
Stoichiometry and kinetics parameters of the biological model under complete anaerobic conditions.
Table 3.
Stoichiometry and kinetics parameters of the biological model under complete anaerobic conditions.
| Parameter Name | Symbol | Value | Source |
|---|---|---|---|
| Yeast stoichiometric coefficient in anaerobic fermentation process (mol) | 1.05 ± 0.04 | Experimental | |
| Ethanol stoichiometric coefficient in anaerobic fermentation process (mol) | 1.70 ± 0.01 | Experimental | |
| Glycerol stoichiometric coefficient in anaerobic fermentation process (mol) | 0.10 ± 0.00 | Experimental | |
| Half-saturation coefficient for glucose under anaerobic conditions (g/L) | 1.72 ± 0.01 | Calibrated | |
| Half-saturation coefficient for ethanol inhibition under anaerobic conditions (g/L) | 202.83 ± 0.97 | Calibrated | |
| Maximum growth rate for anaerobic fermentation process (h) | 0.31 ± 0.00 | Calibrated |
Table 4.
Mean relative errors reported between model output and experimental data under completely anaerobic conditions.
Table 4.
Mean relative errors reported between model output and experimental data under completely anaerobic conditions.
| No. | Experiment | Mean Value (%) | ||||
|---|---|---|---|---|---|---|
| 1 | A | 21.37 | 1.14 | 0.96 | 2.65 | 6.53 |
| 2 | B | 9.76 | 3.55 | 5.19 | 7.94 | 6.61 |
| 3 | C | 17.44 | 3.74 | 4.07 | 4.32 | 7.39 |
| Mean value (%) | 16.19 | 2.81 | 3.41 | 4.97 | 6.84 |
Table 5.
Stoichiometry and kinetics parameters of the biological model under aerobic conditions.
| Parameter Name | Symbol | Value | Source |
|---|---|---|---|
| Oxygen stoichiometric coefficient in aerobic fermentation process (mol) | 0.37 ± 0.00 | Calibrated | |
| Yeast stoichiometric coefficient in aerobic fermentation process (mol) | 1.40 ± 0.25 | Experimental | |
| Ethanol stoichiometric coefficient in aerobic fermentation process (mol) | 1.26 ± 0.20 | Experimental | |
| Oxygen stoichiometric coefficient in glucose respiration process (mol) | 2.50 ± 0.06 | [33] | |
| Yeast stoichiometric coefficient in glucose respiration process | 3.33 ± 0.06 | [33] | |
| Oxygen stoichiometric coefficient in ethanol respiration process (mol) | 1.61 ± 0.10 | [27] | |
| Yeast stoichiometric coefficient in ethanol respiration process (mol) | 1.17 ± 0.29 | Experimental | |
| Half-saturation coefficient for oxygen (mg/L) | 0.10 | [36] | |
| Half-saturation coefficient for glucose under aerobic conditions (g/L) | 1 × 10 | [33] | |
| Half-saturation coefficient for ethanol (g/L) | 0.10 | [36] | |
| Half-saturation coefficient for ethanol inhibition under aerobic conditions (g/L) | 19.70 ± 0.01 | Calibrated | |
| Maximum growth rate for aerobic fermentation process (h) | 0.51 ± 0.00 | Calibrated | |
| Maximum growth rate for glucose respiration process (h) | 0.20 | [33] | |
| Maximum growth rate for ethanol respiration process (h) | 0.11 ± 0.00 | Calibrated | |
| Overall oxygen transfer rate (h) | 27.27 ± 0.42 | Experimental |
Stoichiometric parameters for the respiration process were taken as the mean values reported by [33] using three glucose concentrations values (5, 15 and 30 g/L) for the respiration process at the maximum growth rate of 0.20 h−1.
Table 6.
Mean relative errors reported between model output and experimental data under aerobic conditions.
Table 6.
Mean relative errors reported between model output and experimental data under aerobic conditions.
| No. | Experiment | (%) | Mean Value (%) | ||||
|---|---|---|---|---|---|---|---|
| 1 | D | 7.77 | 9.95 | 0.83 | 24.19 | 4.56 | 9.46 |
| 2 | E | 11.13 | 17.19 | 3.87 | 10.96 | 7.36 | 10.10 |
| 3 | F | 9.23 | 14.27 | 4.70 | 22.70 | 7.09 | 11.60 |
| Mean value (%) | 9.38 | 13.80 | 3.13 | 19.28 | 6.34 | 10.39 |
Table 7.
Model validation: mean relative errors reported between model output and experimental data for fermentation without gas injection.
Table 7.
Model validation: mean relative errors reported between model output and experimental data for fermentation without gas injection.
| No. | Experiment | (%) | Mean Value (%) | |||
|---|---|---|---|---|---|---|
| 1 | G | 10.69 | 5.19 | 8.60 | 3.65 | 7.03 |
Publisher’s Note: MDPI stays neutral with regard to jurisdictional claims in published maps and institutional affiliations. |
© 2022 by the authors. Licensee MDPI, Basel, Switzerland. This article is an open access article distributed under the terms and conditions of the Creative Commons Attribution (CC BY) license (https://creativecommons.org/licenses/by/4.0/).
Share and Cite
MDPI and ACS Style
González-Hernández, Y.; Michiels, E.; Perré, P. A Comprehensive Mechanistic Yeast Model Able to Switch Metabolism According to Growth Conditions. Fermentation 2022, 8, 710. https://doi.org/10.3390/fermentation8120710
AMA Style
González-Hernández Y, Michiels E, Perré P. A Comprehensive Mechanistic Yeast Model Able to Switch Metabolism According to Growth Conditions. Fermentation. 2022; 8(12):710. https://doi.org/10.3390/fermentation8120710
Chicago/Turabian StyleGonzález-Hernández, Yusmel, Emilie Michiels, and Patrick Perré. 2022. "A Comprehensive Mechanistic Yeast Model Able to Switch Metabolism According to Growth Conditions" Fermentation 8, no. 12: 710. https://doi.org/10.3390/fermentation8120710
Note that from the first issue of 2016, this journal uses article numbers instead of page numbers. See further details here.