
Recent Progress in Electronic Noses for Fermented Foods and Beverages Applications


1
Department of Physics, Faculty of Science and Technology, Kanchanaburi Rajabhat University, Kanchanaburi 71190, Thailand
2
Department of Physics, Faculty of Science, Kasetsart University, Bangkok 10900, Thailand
*
Author to whom correspondence should be addressed.
Fermentation 2022, 8(7), 302; https://doi.org/10.3390/fermentation8070302
Submission received: 13 June 2022
/
Revised: 22 June 2022
/
Accepted: 23 June 2022
/
Published: 26 June 2022
(This article belongs to the Special Issue Smart Production and Assessment of Fermented Foods and Beverages Using Digital Technologies)
Abstract
:Fermented foods and beverages have become a part of daily diets in several societies around the world. Emitted volatile organic compounds play an important role in the determination of the chemical composition and other information of fermented foods and beverages. Electronic nose (E-nose) technologies enable non-destructive measurement and fast analysis, have low operating costs and simplicity, and have been employed for this purpose over the past decades. In this work, a comprehensive review of the recent progress in E-noses is presented according to the end products of the main fermentation types, including alcohol fermentation, lactic acid fermentation, acetic acid fermentation and alkaline fermentation. The benefits, research directions, limitations and challenges of current E-nose systems are investigated and highlighted for fermented foods and beverage applications.
1. Introduction
Due to uncertainties and unpredictable crisis situations (e.g., war conflicts) and global pandemics, the demand for fermented food and beverages has been significantly increasing because they are easy to cook and have a long shelf life [1]. In the production of fermented foods and beverages, different types of microorganisms, such as bacteria, yeast and mold, have been used to modify the chemical composition, resulting in changes in taste, smell, color and nutrients. For example, fermentation with probiotic microorganisms such as a lactic acid bacterium in products such as yogurt, kefir and kimchi can increase the nutritional value, for example, by reducing cholesterol and promoting healthy digestive function [2]. In countries, the fermentation technique has been developed specifically from local wisdom to large-scale manufacturing industries by selecting pure microbial strains, resulting in unique fermented foods and beverage products, such as pla ra (fermented fish) in Thailand, Chinese kombucha, Indonesian tempeh, natto and miso in Japan, Korean kimchi, etc. In the fermentation process, microorganisms can produce a variety of enzymes to modify food precursors. For example, the fermentation of natto employs bacteria of the genus Bacillus to create a fibrous texture that is sticky and stretchy [3]. The fermentation of coconut water (nata de coco) is produced via the bacterium Acetobacter xylinum [4]. Fermented tofu employs Monascus purpureus [5]. Different microorganisms make products with distinctive flavor compounds, nutrients and shelf lives.
To assess the quality of fermented food and beverages, such as the physical quality, nutrition value, microbiological quality, safety and sensory quality, there have been several types of equipment and techniques developed, ranging from spectroscopies to sensory evaluation techniques [6,7,8,9,10]. Equipment and methods enabling non-destructive measurement, rapid analysis and on-site testing with low operating costs and simplicity have received great interest in recent years. One of the effective tools for qualitative food and beverage identification meeting these criteria is an electronic nose (E-nose). There is a global trend in the development of E-nose systems instead of standard equipment such as GC, GC/MS, SPME/GC-TOFMS, GC-IMS, etc., in the qualitative analysis of food and beverages [11,12,13,14,15,16,17,18,19,20]. Although there are a set of review articles on the E-nose in food and beverage applications, comprehensive reviews focusing on fermented food and beverages based on E-nose technology are still limited.
In this review, the advancement of E-nose technologies for fermented food and beverage applications is presented. Fermented food and beverages can be classified according to the end product into four major groups as follows: (I) alcoholic fermentation, such as beer, sourdough, makgeolli, vodka, whiskey, wine, brandy and cider [21,22]; (II) lactic acid fermentation, such as yogurt, fermented milk, cheese, kefir, sour pork, sour sausage, salami, pepperoni, kimchi, sauerkraut and pickles (olives and cucumbers) [23,24]; (III) acetic acid fermentation, such as vinegar, kombucha, and pu-er tea [25,26]; and (IV) alkaline fermentation, such as fish sauce, jeotgal, fesikh, soy sauce, soy paste, miso, natto and tempeh [27,28]. In addition, each major group can be split into subcategories according to the main raw ingredients of each type of fermented food and beverage, such as cereals, fruits, herbs, milk, meat, vegetables, legumes, etc. An overview of the entire literature review in this article is displayed in Figure 1.
2. History and Basic Principle of E-Nose
One of the first reports on the E-nose was in 1982, originated by Dodd, G. H. and Persaud, K. from the University of Warwick, England [29]. They employed three Figaro semiconducting gas sensors as transducers. The results showed fine discriminations between odors according to the mammalian olfactory system. This pioneering work has inspired several research groups to develop E-nose systems for various applications [30,31]. The concept of the E-nose is based on mimicking the human olfactory system, as shown in Figure 2. The mechanisms, odor recognition and limitations of human olfactory perception at a molecular level were first investigated by Buck and Axel from Columbia University, USA, in 1991 [32]. Their discovery helped to establish new ways/ideas to develop an E-nose system instead of using complex human olfactory perception for multifunctional purposes. The human olfactory system can be considered to consist of three main parts: (I) the odor-receiving part, consisting of olfactory receptor glands and scent delivery systems [33], (II) the nervous system for the transmission of signals between the brain and the rest of the body and (III) a decision system that is able to recognize, identify and act on the sense of smell experienced via the brain. The mechanism of smell perception is very complex. On the basis of psychophysical testing, humans are able to discriminate > 1 trillion olfactory stimuli [34]. However, the emotions and age of humans have a significant effect on odor recognition and classification [35,36,37]. Moreover, toxic agents in the sample and testing time are crucial obstacles in the ability to identify smells via the human olfactory system. The E-nose has thus become one of the powerful tools as an alternative to human evaluation of scent in samples.
A comparison between an E-nose system and the biological olfactory system is displayed in Figure 2. In the E-nose system, the olfactory receptor section consists of the odor delivery unit (including the pipes, pumps and valves), which creates a path for aroma delivery into the sensor chamber. Numerous gas sensors, a so-called sensor array, are the heart and most important component of the olfactory receptor. Various sensing materials, such as conducting polymers [38,39], carbon-based nanomaterials [40,41,42], metal oxides [43,44,45,46] and nanocomposites [47,48], have been used to adsorb odor molecules based on both physisorption and chemisorption. When the odor molecules adsorb on the sensing material surface, they lead to charge transfers, volume expansion, ion exchange or interaction with ion species that can cause changes in the electrical conductivity/resistivity of the sensing materials. The electrical signals generated by various sensors are converted from analog to digital via an A/D converter and modified via signal processing, such as noise reduction or signal amplification. The data are stored on a local computer/online platform for further analysis. Due to the multivariate data obtained from the gas sensor array of the E-nose system, data analysis is usually performed via supervised/unsupervised machine learning algorithms with statistical methods such as principal component analysis (PCA) [49,50,51], hierarchical cluster analysis (CA) [52,53], analysis of variance (ANOVA) [54], linear discriminant analysis (LDA) [55], partial least squares discriminant analysis (PLS-DA) [56], simple visualization techniques [57], multivariate data analysis [58], artificial neural networks (ANNs) [59,60,61], artificial intelligence (AI) [62] and F-test [63]. A photograph and schematic diagram of a prototype portable E-nose system are displayed in Figure 3.
Nowadays, E-nose systems based on a diversity of gas sensor arrays are applied in all major sectors, such as agriculture and forestry [64,65,66], industrial processes [67], environmental toxin/pollutant analysis [68,69,70], space stations [71,72], medical/healthcare [73,74,75,76], authentication of a person [77], medicine/pharmaceuticals [78], forensic science [79], military [80], toxicology/security [81,82] and the food and beverage industry [83,84,85]. Another emerging direction in the field could be to develop mobile and affordably priced devices for people who suffer from anosmia (loss of smell) [86,87]. With a focus on applications in the food and beverage industry, E-nose systems have been used for both direct/indirect identification via odor analysis for multiple purposes, such as product quality inspection [88], batch-to-batch uniformity studies [89], contamination detection [90], spoilage detection [91,92,93], adulteration detection [13,94], the detection of pathogenic bacteria [95,96], the study of storage conditions/shelf life [97,98,99,100] and the creation of specific sensory profiles [101,102]. In terms of food business competition, they have been used to analyze aromas and compare them with competitor products [103,104], evaluate the impact of changes in the production process and components that affect organoleptic characteristics [105,106] and compare different food formulations [84,107]. Moreover, E-nose systems have showed high performance in identifying the quality of many products, including wine [108], beer [109], coffee [110], carbonated drinks [111], dairy products [112,113], pork [114], beef [115,116], chicken [117], fish [118,119,120] and shrimp [121,122]. However, the sensors in E-nose systems may have a drift effect. Due to the aging of the sensors, measurements performed at different time intervals have a slight bias [123,124,125]. From the past to the present, research is still ongoing for the development of E-noses with high precision and accuracy, on online platforms, and for quantitative identification.
3. E-Nose for Alcoholic Fermentation
Alcoholic fermentation is the anaerobic transformation of fructose and glucose into mainly ethanol and carbon dioxide. Microorganisms associated with the fermentation of alcoholic beverages, such as yeast, play an important role in the fermentation process of sugar to produce alcohol, especially species in the genus Saccharomyces, which is commonly used in the production of alcoholic beverages from various carbohydrates, i.e., the production of beer using Saccharomyces cerevisiae and S. carlbergensis and the production of whiskey, wine, vodka, brandy and bread using S. cerevisiae [126].
Currently, the E-nose has been mainly used for quality evaluation in the production of alcoholic products, starting from the fermentation/incubation process to the storage of the end product. For example, 13 MOS gas sensors were used to detect the concentration of ethanol in seven types of beers of various brands. The results from four types of ANN models (MLR, MNLR, RF and ELM) showed good performance of the E-nose for detecting the levels of alcohol contained in beverages [127]. Viejo et al. reported the early detection of beer faults by using nine MOS gas sensors integrated with AI [60]. Different beer flavor profiles based on the E-nose showed a comparable accuracy to that of a standard expensive method, namely, near-infrared spectroscopy (NIR). Berna et al. presented an E-nose application for wine spoilage prediction. Twelve MOS gas sensors were selected to detect 4-ethylphenol (4EP) and 4-ethylguaiacol (4EG), which are taints produced by Brettanomyces yeasts [128]. The results showed that the E-nose was effective in screening wines for ethylphenol taints. Bread and bakery products can be considered a group of alcoholic fermentation products. There are many key aroma compounds, such as acetaldehyde, methanol, 1-propanol and 3-methyl-1-butanol that can be used for the identification of bread freshness [129,130,131,132,133]. However, the challenge of the E-nose is still the quantitative identification of VOCs. Therefore, the quantitative analysis of E-noses has usually been compared with standard spectroscopies, such as UV-Vis, GC and GC-MS [134,135,136,137,138]. The combination of the E-nose and GC-MS for qualitative and quantitative analysis during the wheat bread-making process is displayed in Figure 4. The variety of E-nose applications to detect odors from food and beverage products caused by alcoholic fermentation is summarized in Table 1.
4. E-Nose for Lactic Acid Fermentation
Lactic acid bacteria are a group of Gram-positive, non-sporulating bacteria that play an important role in food fermentation in anaerobic, carbohydrate-containing environments [144]. The production of fermented food with lactic acid bacteria results in different aroma compounds according to the type of raw material and the duration of the fermentation process. For example, fermented milk products such as yogurt, fermented milk and cheese give the specific odor properties characteristic of acidic flavor and other substances, including carbon dioxide, acetic acid, diacetyl and acetaldehyde, during the fermentation process [145]. The metabolic pathway of VOC generation during milk fermentation by Lactobacillus pentosus is displayed in Figure 5. However, insufficient or abnormal flavor may occur during the fermentation process with lactic acid bacteria due to changes in pH. The quantity of lactic acid strongly affects the flavor. During the fermentation process, unpleasant flavors, including maltiness, metallic flavor, methyl sulfide flavor, green flavor and fishy flavor, can frequently occur and need to be monitored.
Finding a correlation between different odors in multiple product conditions and the duration of the lactic acid fermentation process has become a common way to develop a new product and control the quality standard. There are many lactic bacteria in different groups associated with fermented food processing, such as Lactobacilli, Lactococci, Leuconostoc, Pediococci and Streptococci [146], that can give specific flavors. Most studies on E-noses aim to detect the characteristic odor alteration according to a distinct change in the growth of bacteria during the fermentation process. For example, an E-nose based on MOS was used to identify four yeast species (Pichia anomala, Pichia kluyveri, Hanseniaspora uvarum and Debaryomyces hansenii) in white fresh soft cheese [147]. The results showed a good prediction of cheese spoilage by using PLS models. The Heracles E-nose with LDA models was employed to monitor odor changes during milk fermentation with Lactobacillus species [148]. An E-nose with a mass spectrometer showed good differentiation of aged cheddar cheese aromas [149]. Odor measurement was performed using an E-nose with two FID detectors to investigate the characterization of steamed cheese and to assess the quality decay of steamed cheese during storage [150]. A POLFA odor sensor and Tukey’s HSD test were selected to classify cheese types, production areas and cheese ages [106]. Most of the odors could be readily distinguished using an E-nose based on MOS to detect the ripening of Danish blue cheese [151], to analyze stirred yogurt with cheddar cheese added to milk [152] and to detect unsatisfactory products for the quality control of yogurt [153].
In fermented meat products such as fermented pork, sour sausage and salami, it has been found that VOCs released from these foods are usually acetic acid, ethyl butanoate, hexanal, methional, 1-octen-3-ol, benzeneacetaldehyde and 4-methyl-phenol [154]. The vast majority of research studies have used MOS in the E-nose system for a variety of purposes, including the manufacturing evaluation process to evaluate the lipid oxidation of Chinese-style sausage during processing and storage [155], the detection of the flavor substances in Ningxiang pork [156], the identification of the flavor profile for dry fermented sausages with different NaCl substitutes [157], the construction of volatile profiles and taste properties of Harbin red sausages [158] and the discrimination of different Mediterranean salami [159].
In products fermented from fruits and vegetables, such as kimchi, sauerkraut and pickled fruit, a GC-MS odor analysis revealed several VOCs related to different salt concentrations in the fermentation process. For the first stage of sauerkraut fermentation, VOCs such as esters, aldehydes and ketones were found at low salt concentrations. Acids, alcohols, isothiocyanates and hydrocarbons became dominant when the salt concentration was higher [160]. Many applications of E-noses for lactic acid fermentation have been found, i.e., the detection of the bacterial diversity during the fermentation process and the flavor quality of zha-chili samples [161], assessments of the abnormal fermentation defects of Spanish-style table olives [162], investigation of the lactic acid bacteria in the fermentation of Chinese northeast sauerkraut [163], the classification of the geographical origin of kimchi [164] and the detection of saponin in submerged fermentation with Tremella aurantialba (T. aurantialba) [165]. A list of E-nose systems for lactic acid fermentation applications is summarized in Table 2.
5. E-Nose for Acetic Acid Fermentation
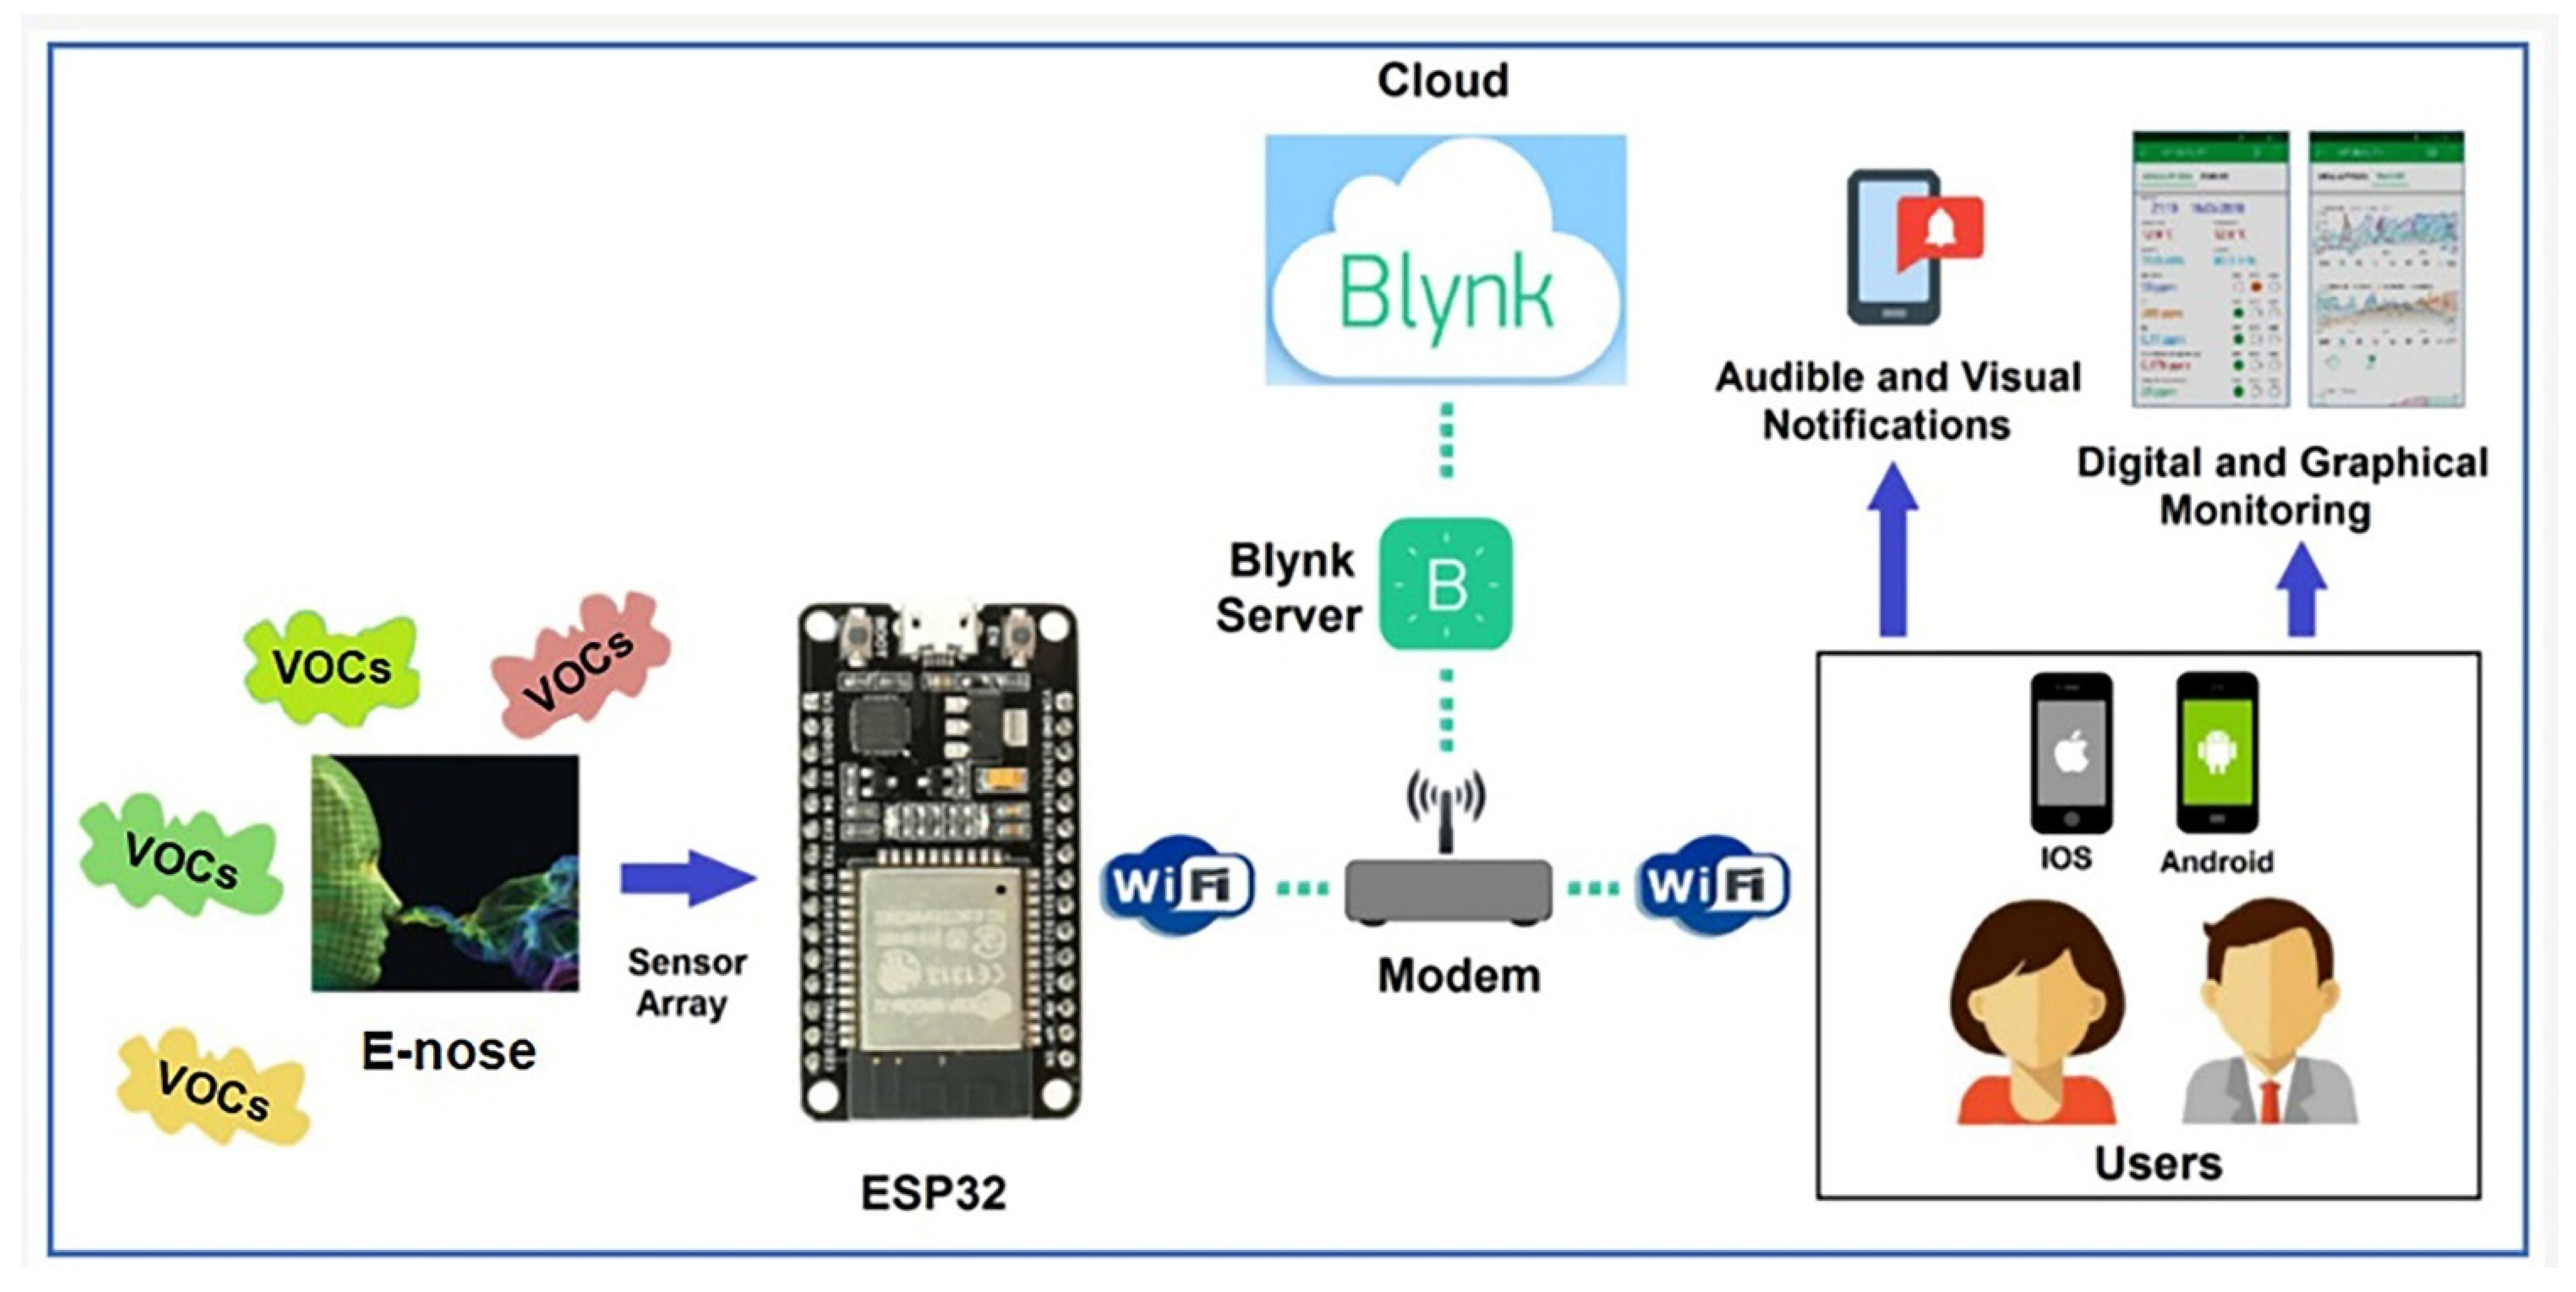
The majority of bacteria for fermented food in this group are acetic acid bacteria, which can oxidize ethyl alcohol and other organic matters to acetic acid, especially Acetobacter aceit, A. xylinum, A. peroxidans and A. pasteurianus strains. Acetic acid bacteria are commonly used in the production of vinegar, nata and tea fungus. Among the foods fermented in the acetic acid fermentation process, vinegar is one of the most popular for quality grading via odor testing. In the vinegar production process, the most dramatic changes in VOCs during the fermentation process were ethanol, 3-methyl-1-butanol, acetic acid and ethyl acetate [167]. Therefore, gas sensors that can detect these key VOCs play an important role in the application of acetic acid fermentation. The nano-ZnO thick film is a popular MOS for sensing these VOCs. The E-nose based on this gas sensor array was used to establish a fingerprint database of Chinese vinegars [168] and identify them individually for their quality control [169]. A surface acoustic wave (SAW) sensor array that relies on the resonance frequency-sensing mechanism was also used for acetic acid monitoring and can determine the volatile profiles of cider vinegars [170]. However, the most popular MOS gas sensors are still those that are able to detect, discriminate and recognize different kinds of vinegars and herb products in online/offline platforms [171,172,173,174,175,176,177]. A schematic diagram of an IoT-based E-nose system for VOC detection is shown in Figure 6. To detect VOCs emitted from fermentation, the MOS is still a popular sensing material in E-nose systems. Based on PCA coupled with CA, they were used to analyze odor substances for quality control in black tea during the fermentation process [178,179] and monitor the fermentation process of Sri Lankan low-country tea [89,180]. Not only MOS but also polymer/CNT gas sensors can be integrated into an E-nose for tracking odors of Thai sweet fermented rice (Khao Mak) during the fermentation process [181]. A list of E-nose applications for acetic acid fermentation is summarized in Table 3.
6. E-Nose for Alkaline Fermentation
Alkaline fermented foods play an important role in many local food cultures around the world. Bacillus spp. bacteria are a major group of microorganisms that react with protein-rich raw materials to produce alkaline fermented food [27]. Additionally, other secondary microorganisms, such as LAB, staphylococci and micrococci, are also involved in this process [185]. Alkaline fermentation involves the breakdown of proteins that release essential peptides and amino acids. Amino acids are broken down into alkaline compounds, such as ammonia, that can raise the pH level (8–10) of the fermented foods. Soybeans are considered one of the common precursors for traditional alkaline fermentation, which can be found in different foods, including Thua-nao of Thailand, Japanese Natto, Indonesian tempeh, Nepalese and Indian Kinema, Chungkookjang of Korea and Chinese Douchi. Generally, in alkaline fermented foods and seasoning agents, it has been found that the released VOCs have distinctive aromas, such as caramel, floral, smoky, malt and the aroma of boiled sweet potato [186]. Volatile substances emitted as gas molecules from each fermented food sample are used to assess the chemical diversity of these molecules, such as acids, alcohols, aldehydes, ketones, esters, furanones, pyrazines and S-compounds [187]. The origin of VOCs generated by the entire fermentation process involves both the raw material and the initial culture used, as well as the parameters used during production. Therefore, odor measurements can be focused on the targeted VOCs released by specific raw materials in each category. For example, MOS sensor arrays were made to analyze ethanol content in soy sauce for halal food certification [188], to investigate the sensory profile of fermented soybean paste (doenjang) [189] and to monitor the fermentation process of tempeh [190]. In addition, odor detection was carried out to determine the quantity and quality of volatile compounds in soybean varieties [191] and to select Chinese soybean paste based on flavor profiles [192] by using HS-SPME-GC/MS with an E-nose.
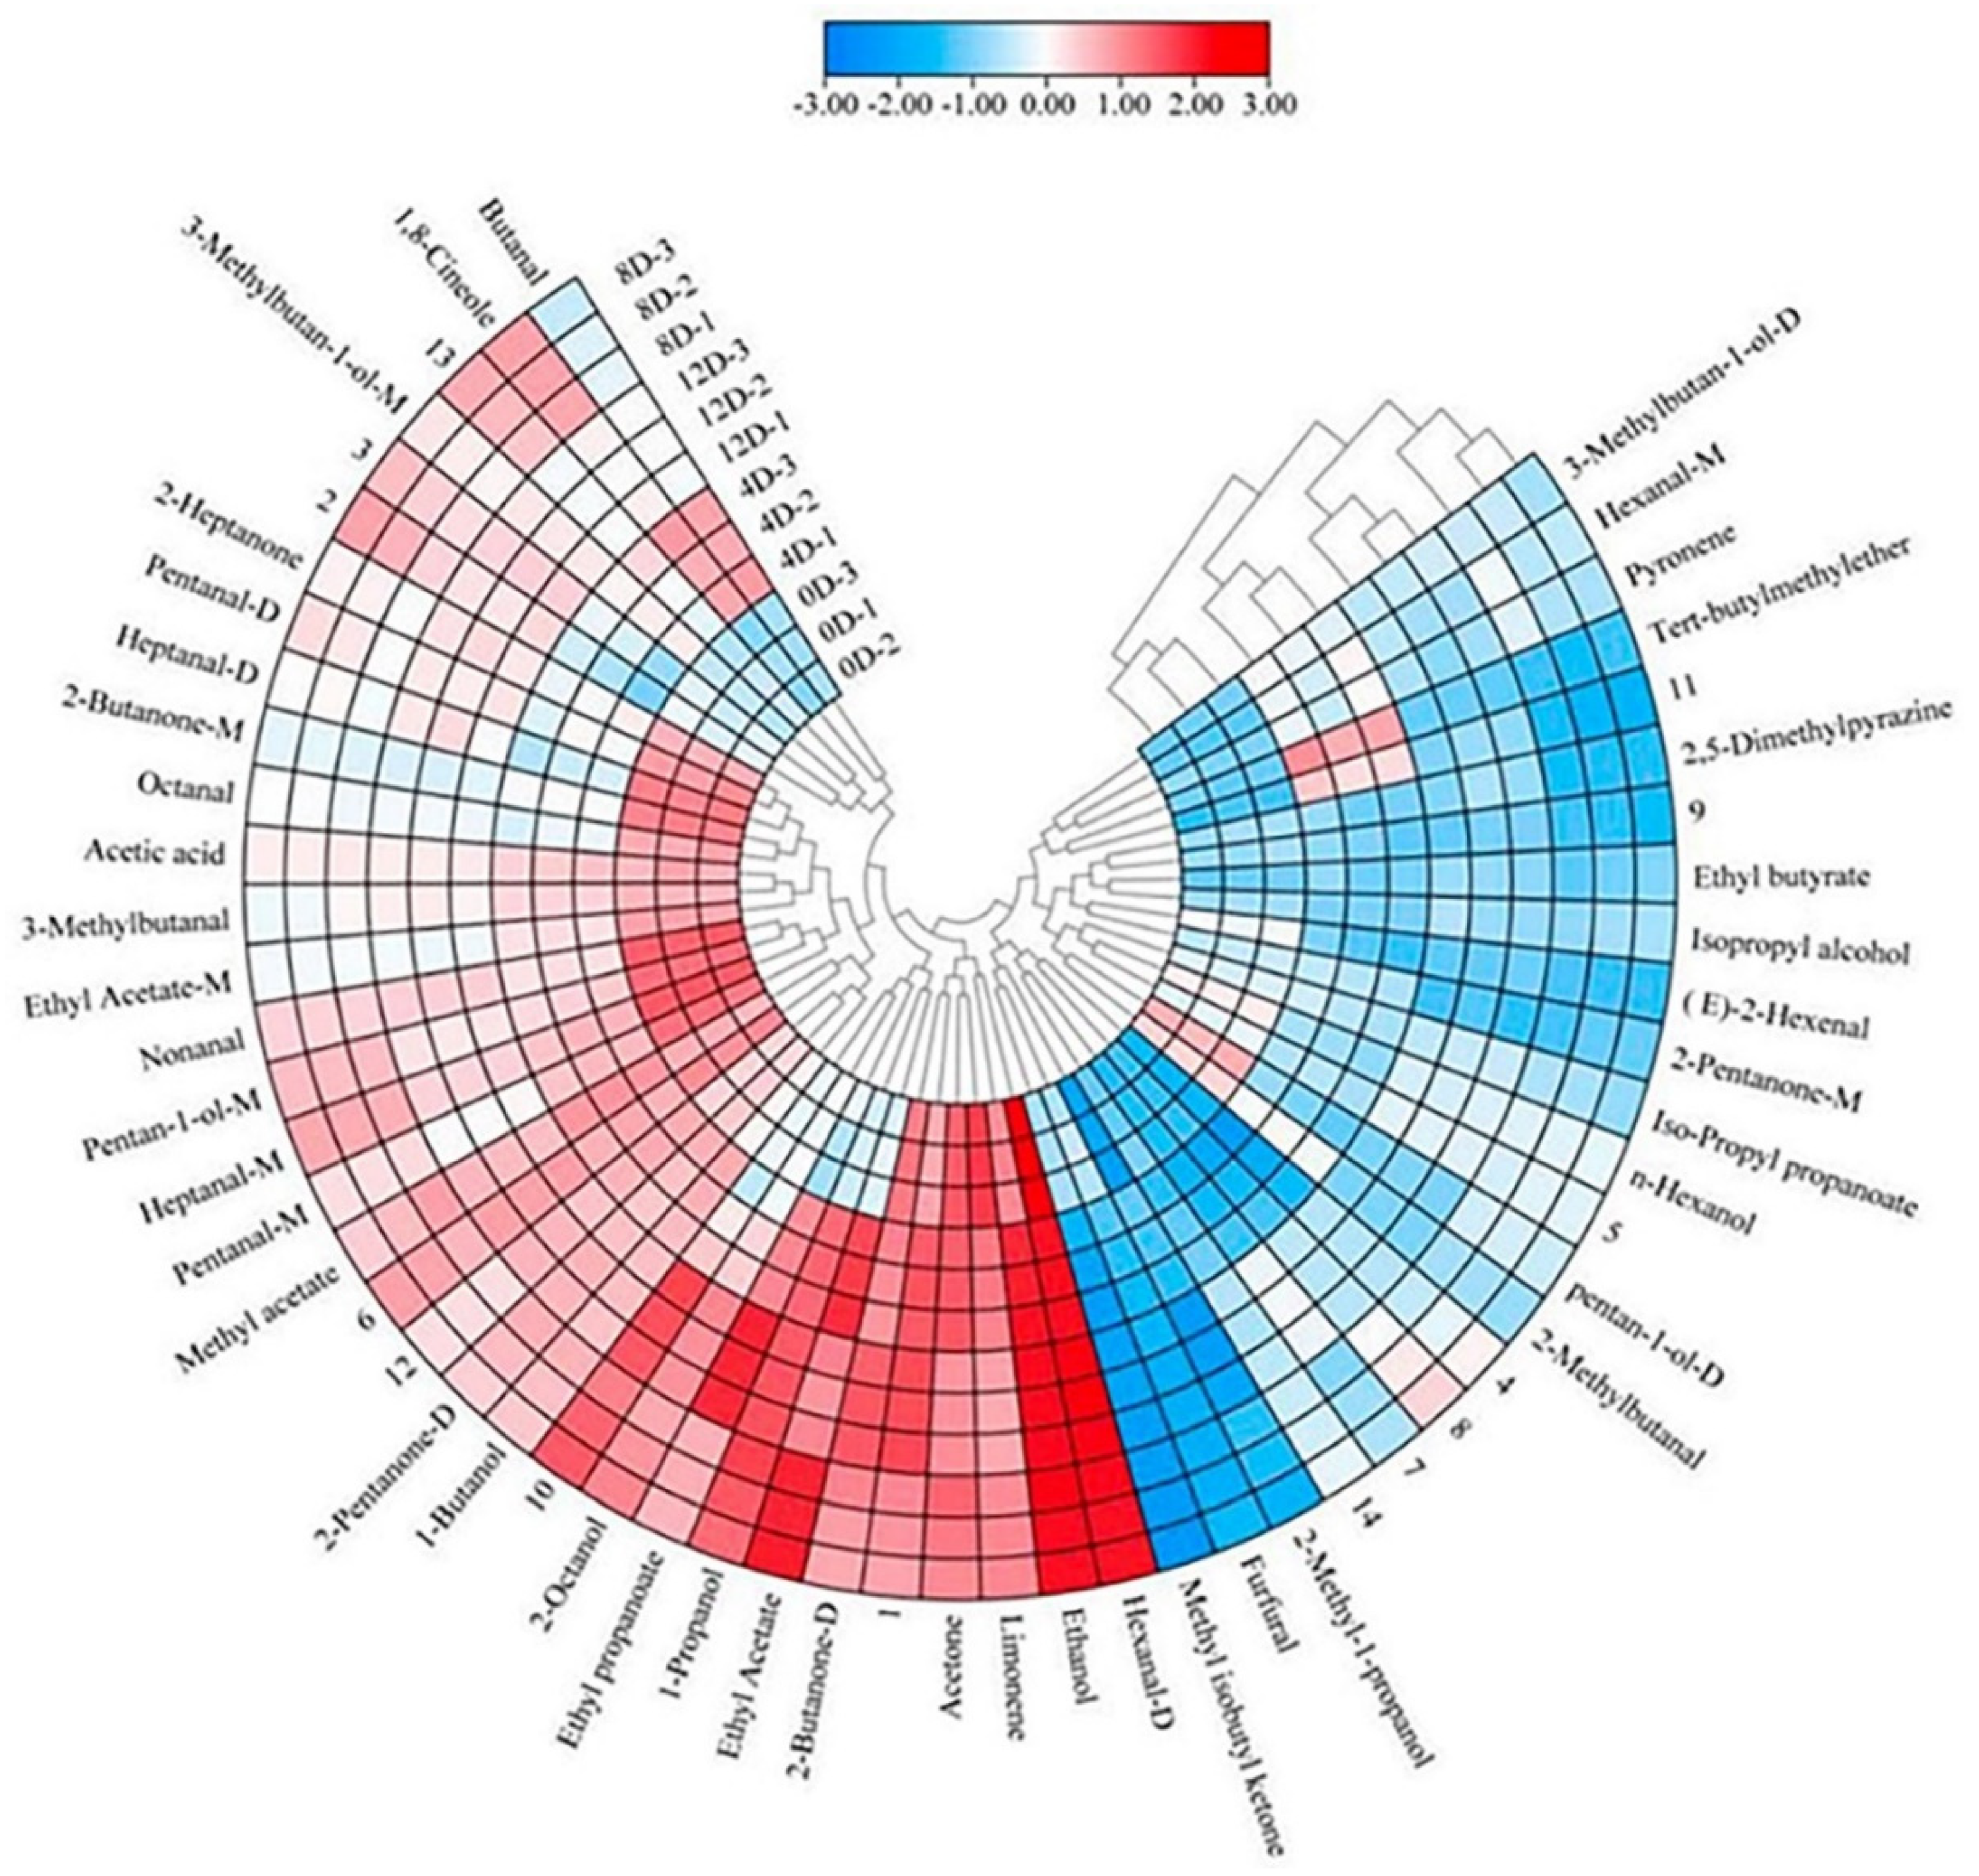
In addition to the fermented foods mentioned above, there are also alkaline fermented foods from another group of raw materials, such as fish sauce and fermented fish [193]. In the fermentation of fish sauce, enzymes in the body and the intestines of solid fish are gradually activated and changed to liquid, where salt acts as a preservative to prevent the spoilage of the fish. The odor of fish sauce is caused by protein digestion by the digestive juices in fish into peptides, which may be further broken down into amines, ketoacids, ammonia, carbon dioxide, fatty acids, ketones and aldehydes. The amounts of alkalis and acids gradually increase over the fermentation period until approximately nine months, after which they decrease rapidly when the chemical change in fish muscle ends [194]. The amounts of volatile acids and bases still remain after the completion of fermentation. The major characteristics of fish sauce are the unique smell and taste obtained from bacterial activity in the fermentation process. Researchers thus focus on these compounds in their studies on the process of fish sauce production to meet standards, including those for the unique features of each fish sauce. Several studies have shown that the MOS E-nose can classify odors that occur in each stage of fermentation, such as the analysis of traditional fermented fish flavor [195] and the identification of the volatile fingerprint of fermented mandarin fish at different fermentation stages [196], as shown in Figure 7. In the commercial fish sauce industry, the control of total nitrogen content is very crucial for the quality of fish sauce during the fermentation process. Studies have shown the classification of fish sauce based on the level of total nitrogen content [197], which will be useful in selecting the quality of fish sauce. Although there are many different brands of the product, the flavor may be similar; i.e., the 46 commercially available fish sauce products can be grouped into only three major groups [198]. Therefore, the E-nose is still necessary for quality control and the design of new flavors. A list of E-nose applications for alkaline fermentation is summarized in Table 4.
7. Summary and Future Trends
In summary, E-nose systems have been successfully applied in fermented food and beverage applications. Combined with machine learning algorithms, E-nose systems can be effectively used in qualitative identification for multipurpose objectives. Most gas sensors used in E-nose systems for fermented food and beverage applications are MOS sensors due to their low cost, ease of use, long-term stability and commercial availability. However, the challenge of the E-nose is its limitation in quantitative analysis. E-nose systems have always been coupled with spectroscopies such as GC-MS for both qualitative and quantitative identification in fermented foods and beverages. This is an expensive method, causing the limitation of real-time and online E-nose usage. Nowadays, there are some commercially available E-nose systems, such as Heracles Neo (Flash GC/E-nose), that are able to identify chemical compounds composing the smell and to perform quantitative analysis. In the field of fermented food and beverage applications, most researchers have focused on the development of prototype E-noses by altering the size, delivery system, online/offline platform and algorithms for classification/prediction, not gas sensors. Actually, the gas sensor is the heart of the E-nose instrument because it is sensitive to/selective for functional groups emitted from fermented foods and beverages. Therefore, the integration of highly selective gas sensors, such as electrochemical gas sensors, optical gas sensors and nanocomposite-based gas sensors, with MOS sensors in E-noses may be useful and enable qualitative and quantitative identification of compounds in fermented foods and beverages. The development of highly selective gas sensors for key VOCs emitted from fermented food and beverage products is one of the interesting future trends, as well as the use of a cloud platform that allows researchers to put the huge datasets of signals from MOS sensors into an international database. It will be very useful for both qualitative and quantitative identification by E-noses and for creating and transferring aroma data via the internet (Internet of Smell, IoS) in the future.
Author Contributions
Conceptualization, T.S. and C.W.; methodology, T.S. and C.W.; validation, C.W.; formal analysis, T.S. and C.W.; investigation, T.S. and C.W.; resources, C.W.; data curation, T.S.; writing—original draft preparation, T.S.; writing—review and editing, C.W.; visualization, T.S.; supervision, C.W.; funding acquisition, C.W. All authors have read and agreed to the published version of the manuscript.
Funding
This project is funded by National Research Council of Thailand (NRCT) under the grant number (N42A650234).
Institutional Review Board Statement
Not applicable.
Informed Consent Statement
Not applicable.
Data Availability Statement
Not applicable.
Acknowledgments
T.S. acknowledges Kanchanaburi Rajabhat University for any support. C.W. acknowledges a Research Grant for Talented Mid-Career Researchers from the National Research Council of Thailand (NRCT) and Kasetsart University for any support of this work.
Conflicts of Interest
The authors declare no conflict of interest.
References
- Moretti, A.F.; Moure, M.C.; Quiñoy, F.; Esposito, F.; Simonelli, N.; Medrano, M.; León-Peláez, A. Water kefir, a fermented beverage containing probiotic microorganisms: From ancient and artisanal manufacture to industrialized and regulated commercialization. Future Foods 2022, 5, 100123. [Google Scholar] [CrossRef]
- Kesika, P.; Thangaleela, S.; Sivamaruthi, B.S.; Bharathi, M.; Chaiyasut, C. Fermented foods and their role in respiratory health: A mini-review. Fermentation 2022, 8, 162. [Google Scholar] [CrossRef]
- Song, Y.; Yu, J.; Song, J.; Wang, S.; Cao, T.; Liu, Z.; Gao, X.; Wei, Y. The antihypertensive effect and mechanisms of bioactive peptides from Ruditapes philippinarum fermented with Bacillus natto in spontaneously hypertensive rats. J. Funct. Foods 2021, 79, 104411. [Google Scholar] [CrossRef]
- Zhang, J.; Yang, Y.; Deng, J.; Wang, Y.; Hu, Q.; Li, C.; Liu, S. Dynamic profile of the microbiota during coconut water pre-fermentation for nata de coco production. LWT-Food Sci. Technol. 2017, 81, 87–93. [Google Scholar] [CrossRef]
- Tachibana, S.; Yasuda, M. Purification and characterization of heterogeneous glucoamylases from Monascus purpureus. Biosci. Biotechnol. Biochem. 2007, 71, 2573–2576. [Google Scholar] [CrossRef] [Green Version]
- Sarkar, T.; Salauddin, M.; Kirtonia, K.; Pati, S.; Rebezov, M.; Khayrullin, M.; Panasenko, S.; Tretyak, L.; Temerbayeva, M.; Kapustina, N.; et al. A review on the commonly used methods for analysis of physical properties of food materials. Appl. Sci. 2022, 12, 2004. [Google Scholar] [CrossRef]
- Md Noh, M.F.; Gunasegavan, R.D.N.; Khalid, N.M.; Balasubramaniam, V.; Mustar, S.; Rashed, A.A. Recent techniques in nutrient analysis for food composition database. Molecules 2020, 25, 4567. [Google Scholar] [CrossRef]
- Bukhari, M.A.; Banasser, T.M.; El-Bali, M.; Bulkhi, R.A.; Qamash, R.A.; Trenganno, A.; Khayyat, M.; Kurdi, M.A.; Majrashi, A.A.; Bahewareth, F. Assessment of microbiological quality of food preparation process in some restaurants of Makkah city. Saudi J. Biol. Sci. 2021, 28, 5993–5997. [Google Scholar] [CrossRef]
- Mihafu, F.D.; Issa, J.Y.; Kamiyango, M.W. Implication of sensory evaluation and quality assessment in food product development: A review. Curr. Res. Nutr. Food Sci. 2020, 8, 690–702. [Google Scholar] [CrossRef]
- Drake, M.A. Encyclopedia of Dairy Sciences, 3rd ed.; Elsevier Science: Cambridge, MA, USA, 2022; pp. 572–576. [Google Scholar]
- Putri, S.; Malikul Ikram, M.M.; Sato, A.; Dahlan, H.D.; Rahmawati, D.; Ohto, Y.; Fukusaki, E. Application of gas chromatography-mass spectrometry-based metabolomics in food science and technology. J. Biosci. Bioeng. 2022, 133, 425–435. [Google Scholar] [CrossRef]
- Adebo, O.A.; Oyeyinka, S.A.; Adebiyi, J.A.; Feng, X.; Wilkin, J.D.; Kewuyemi, Y.O.; Abrahams, A.M.; Tugizimana, F. Application of gas chromatography–mass spectrometry (GC-MS)-based metabolomics for the study of fermented cereal and legume foods: A review. Food Sci. Technol. 2021, 56, 1514–1534. [Google Scholar] [CrossRef]
- Roy, M.; Yadav, B.K. Electronic nose for detection of food adulteration: A review. J. Food Sci. Technol. 2022, 59, 84–858. [Google Scholar] [CrossRef] [PubMed]
- Timsorn, K.; Wongchoosuk, C. Inkjet printing of room-temperature gas sensors for identification of formalin contamination in squids. J. Mater. Sci. Mater. Electron. 2019, 30, 4782–4791. [Google Scholar] [CrossRef]
- Timsorn, K.; Lorjaroenphon, Y.; Wongchoosuk, C. Identification of adulteration in uncooked Jasmine rice by a portable low-cost artificial olfactory system. Measurement 2017, 108, 67–76. [Google Scholar] [CrossRef]
- Timsorn, K.; Thoopboochagorn, T.; Lertwattanasakul, N.; Wongchoosuk, C. Evaluation of bacterial population on chicken meats using a briefcase electronic nose. Biosyst. Eng. 2016, 151, 116–125. [Google Scholar] [CrossRef]
- Wongchoosuk, C.; Wisitsoraat, A.; Tuantranont, A.; Kerdcharoen, T. Portable electronic nose based on carbon nanotube-SnO2 gas sensors and its application for detection of methanol contamination in whiskeys. Sens. Actuators B Chem. 2010, 147, 392–399. [Google Scholar] [CrossRef]
- Hernández-Mesa, M.; Ropartz, D.; García-Campaña, A.M.; Rogniaux, H.; Dervilly-Pinel, G.; Bizec, B.L. Ion mobility spectrometry in food analysis: Principles, current applications and future trends. Molecules 2019, 24, 2706. [Google Scholar] [CrossRef] [Green Version]
- Wang, S.; Chen, H.; Sun, B. Recent progress in food flavor analysis using gas chromatography–ion mobility spectrometry (GC–IMS). Food Chem. 2020, 315, 126158. [Google Scholar] [CrossRef]
- Yang, X.; Zhang, T.; Yang, D.; Xie, J. Application of gas chromatography-ion mobility spectrometry in the analysis of food volatile components. Acta Chromatogr. 2022, 46, e13840. [Google Scholar] [CrossRef]
- Buratti, S.; Benedetti, S. Chapter 28—Alcoholic fermentation using electronic nose and electronic tongue. In Electronic Noses and Tongues in Food Science, 1st ed.; Rodríguez Méndez, M.L., Ed.; Academic Press: San Diego, CA, USA, 2016; pp. 291–299. [Google Scholar]
- Malakar, S.; Paul, S.K.; Jolvis Pou, K.R. The Science of Beverages. In Biotechnological Progress and Beverage Consumption, 1st ed.; Grumezescu, A.M., Holban, A.M., Eds.; Elsevier: Cambridge, MA, USA, 2020; Volume 19, pp. 1–37. [Google Scholar]
- Malo, P.; Urquhart, E.A. Fermented foods: Use of starter cultures. In Encyclopedia of Food and Health, 2nd ed.; Caballero, B., Finglas, P.M., Toldrá, F., Eds.; Academic Press: San Diego, CA, USA, 2016; pp. 681–685. [Google Scholar]
- Taylor, J.R.N.; Emmambux, M.N. 13-Products containing other speciality grains: Sorghum, the millets and pseudocereals. In Technology of Functional Cereal Products, 1st ed.; Hamaker, B.R., Ed.; Woodhead Publishing: Shaston, UK, 2008; pp. 281–335. [Google Scholar]
- Gomes, R.J.; Borges, M.D.F.; Rosa, M.D.F.; Castro-Gómez, R.J.H.; Spinosa, W.A. Acetic acid bacteria in the food industry: Systematics, characteristics and applications. Food Technol. Biotechnol. 2018, 56, 139–151. [Google Scholar] [CrossRef]
- Roos, J.D.; Vuyst, L.D. Acetic acid bacteria in fermented foods and beverages. Curr. Opin. Biotechnol. 2018, 49, 115–119. [Google Scholar] [CrossRef] [PubMed]
- Wang, J.; Fung, D.Y.C. Alkaline-fermented foods: A review with emphasis on pidan fermentation. Crit. Rev. Microbiol. 1996, 22, 101–138. [Google Scholar] [CrossRef] [PubMed]
- Parkouda, C.; Nielsen, D.S.; Azokpota, P.; Ouoba, L.I.I.; Amoa-Awua, W.K.; Thorsen, L.; Hounhouigan, J.D.; Jensen, J.S.; Tano-Debrah, K.; Diawara, B.; et al. The microbiology of alkaline-fermentation of indigenous seeds used as food condiments in Africa and Asia. Crit. Rev. Microbiol. 2009, 35, 139–156. [Google Scholar] [CrossRef] [PubMed]
- Persaud, K.; Dodd, G. Analysis of discrimination mechanisms in the mammalian olfactory system using a model nose. Nature 1982, 299, 352–355. [Google Scholar] [CrossRef]
- Gardner, J.W.; Bartlett, P.N. A brief history of electronic noses. Sens. Actuators B Chem. 1994, 18, 211–220. [Google Scholar] [CrossRef]
- Wilson, A.D.; Baietto, M. Applications and advances in electronic-nose technologies. Sensors 2009, 9, 5099–5148. [Google Scholar] [CrossRef]
- Buck, L.; Axel, R. A novel multigene family may encode odorant receptors: A molecular basis for odor recognition. Cell 1991, 65, 175–187. [Google Scholar] [CrossRef]
- Dunkel, A.; Steinhaus, M.; Kotthoff, M.; Nowak, B.; Krautwurst, D.; Schieberle, P.; Hofmann, T. Nature’s chemical signatures in human olfaction: A foodborne perspective for future biotechnology. Angew. Chem. Int. Ed. 2014, 53, 7124–7143. [Google Scholar] [CrossRef]
- Bushdid, C.; Magnasco, M.O.; Vosshall, L.B.; Keller, A. Humans can discriminate more than 1 trillion olfactory stimuli. Science 2014, 343, 1370–1372. [Google Scholar] [CrossRef] [Green Version]
- Calvi, E.; Quassolo, U.; Massaia, M.; Scandurra, A.; D’Aniello, B.; D’Amelio, P. The scent of emotions: A systematic review of human intra- and interspecific chemical communication of emotions. Brain Behav. 2020, 10, e01585. [Google Scholar] [CrossRef]
- Vieillard, S.; Ronat, L.; Baccarani, A.; Schaal, B.; Baudouin, J.Y.; Brochard, R. Age differences in olfactory affective responses: Evidence for a positivity effect and an emotional dedifferentiation. Aging Neuropsychol. Cogn. 2021, 28, 570–583. [Google Scholar] [CrossRef] [PubMed]
- Freemantle, A.W.J.; Stafford, L.D.; Wagstaff, C.R.D.; Akehurst, L. The relationship between olfactory function and emotional contagion. Chem. Percept. 2021, 1–11. [Google Scholar] [CrossRef]
- Seesaard, T.; Lorwongtragool, P.; Kerdcharoen, T. Development of fabric-based chemical gas sensors for use as wearable electronic noses. Sensors 2015, 15, 1885–1902. [Google Scholar] [CrossRef] [PubMed] [Green Version]
- Seekaew, Y.; Lokavee, S.; Phokharatkul, D.; Wisitsoraat, A.; Kerdcharoen, T.; Wongchoosuk, C. Low-cost and flexible printed graphene–PEDOT:PSS gas sensor for ammonia detection. Org. Electron. 2014, 15, 2971–2981. [Google Scholar] [CrossRef]
- Kondee, S.; Arayawut, O.; Pon-On, W.; Wongchoosuk, C. Nitrogen-doped carbon oxide quantum dots for flexible humidity sensor: Experimental and SCC-DFTB study. Vacuum 2022, 195, 110648. [Google Scholar] [CrossRef]
- Seekaew, Y.; Arayawut, O.; Timsorn, K.; Wongchoosuk, C. Chapter nine—Synthesis, characterization, and applications of graphene and derivatives. In Carbon-Based Nanofillers and Their Rubber Nanocomposites, 1st ed.; Yaragalla, S., Mishra, R., Thomas, S., Kalarikkal, N., Maria, H.J., Eds.; Elsevier: Cambridge, MA, USA, 2019; pp. 259–283. [Google Scholar]
- Kerdcharoen, T.; Wongchoosuk, C. 11-Carbon nanotube and metal oxide hybrid materials for gas sensing. In Semiconductor Gas Sensors, 1st ed.; Jaaniso, R., Tan, O.K., Eds.; Woodhead Publishing: Shaston, UK, 2013; pp. 386–407. [Google Scholar]
- Traiwatcharanon, P.; Timsorn, K.; Wongchoosuk, C. Flexible room-temperature resistive humidity sensor based on silver nanoparticles. Mater. Res. Express 2017, 4, 085038. [Google Scholar] [CrossRef]
- Arayawut, O.; Kerdcharoen, T.; Wongchoosuk, C. Structures, electronic properties, and gas permeability of 3D pillared silicon carbide nanostructures. Nanomaterials 2022, 12, 1869. [Google Scholar] [CrossRef]
- Traiwatcharanona, P.; Siriwatcharapiboonb, W.; Jongprateep, O.; Wongchoosuk, C. Electrochemical paraquat sensor based on lead oxide nanoparticles. RSC Adv. 2022, 12, 16079–16092. [Google Scholar] [CrossRef]
- Chaloeipote, G.; Prathumwan, R.; Subannajui, K.; Wisitsoraat, A.; Wongchoosuk, C. 3D printed CuO semiconducting gas sensor for ammonia detection at room temperature. Mater. Sci. Semicond. Processing 2021, 123, 105546. [Google Scholar] [CrossRef]
- Chaloeipote, G.; Samarnwong, J.; Traiwatcharanon, P.; Kerdcharoen, T.; Wongchoosuk, C. High-performance resistive humidity sensor based on Ag nanoparticles decorated with graphene quantum dots. R. Soc. Open Sci. 2021, 8, 210407. [Google Scholar] [CrossRef]
- Seekaew, Y.; Pon-On, W.; Wongchoosuk, C. Ultrahigh selective room-temperature ammonia gas sensor based on tin–titanium dioxide/reduced graphene/carbon nanotube nanocomposites by the solvothermal method. ACS Omega 2019, 4, 16916–16924. [Google Scholar] [CrossRef] [PubMed] [Green Version]
- Seesaard, T.; Thippakorn, C.; Kerdcharoen, T.; Kladsomboon, S. A hybrid electronic nose system for discrimination of pathogenic bacterial volatile compounds. Anal. Methods 2020, 12, 5671–5683. [Google Scholar] [CrossRef] [PubMed]
- Kladsomboon, S.; Thippakorn, C.; Seesaard, T. Development of organic-inorganic hybrid optical gas sensors for the non-invasive monitoring of pathogenic bacteria. Sensors 2018, 18, 3189. [Google Scholar] [CrossRef] [PubMed] [Green Version]
- Grane, A.; Jach, A. Applications of principal component analysis (PCA) in food science and technology. In Mathematical and Statistical Methods in Food Science and Technology, 1st ed.; Granato, D., Ares, G., Eds.; John Wiley & Sons, Ltd.: Hoboken, NJ, USA, 2014; pp. 55–85. [Google Scholar]
- Ferraz da Silva Torres, E.A.; Garbelotti, M.L.; Moita Neto, J.M. The application of hierarchical clusters analysis to the study of the composition of foods. Food Chem. 2006, 99, 622–629. [Google Scholar] [CrossRef]
- Thanh-Blicharz, J.L.; Lewandowicz, J. Functionality of native starches in food systems: Cluster analysis grouping of rheological properties in different product matrices. Foods 2020, 9, 1073. [Google Scholar] [CrossRef]
- Kuti, T.; Hegyi, A.; Kemény, S. Analysis of sensory data of different food products by ANOVA. Chemom. Intell. Lab. Syst. 2004, 72, 253–257. [Google Scholar] [CrossRef]
- Kiselev, I.; Sysoev, V.; Kaikov, I.; Koronczi, I.; Adil Akai Tegin, R.; Smanalieva, J.; Sommer, M.; Ilicali, C.; Hauptmannl, M. On the temporal stability of analyte recognition with an e-nose based on a metal oxide sensor array in practical applications. Sensors 2018, 18, 550. [Google Scholar] [CrossRef] [Green Version]
- Huang, M.; Li, Y.; Zhan, P.; Liu, P.; Tian, H.; Fan, J. Correlation of volatile compounds and sensory attributes of Chinese traditional sweet fermented flour pastes using hierarchical cluster analysis and partial least squares-discriminant analysis. J. Chem. 2017, 2017, 3213492. [Google Scholar] [CrossRef]
- Mazalan, N.M.; Idrus, Z.; Abdullah, N.A.S.; Ibrahim, Z. An overview of visualization techniques: A survey of food-related research. In Soft Computing in Data Science, 1st ed.; Berry, M., Yap, B., Mohamed, A., Köppen, M., Eds.; Springer: Singapore, 2019; Volume 1100, pp. 91–104. [Google Scholar]
- Buvé, C.; Saeys, W.; Rasmussen, M.A.; Neckebroeck, B.; Hendrickx, M.; Grauwet, T.; Loey, A.V. Application of multivariate data analysis for food quality investigations: An example-based review. Food Res. Int. 2022, 151, 110878. [Google Scholar] [CrossRef]
- Gonzalez Viejo, C.; Fuentes, S. Digital detection of olive oil rancidity levels and aroma profiles using near-infrared spectroscopy, a low-cost electronic nose and machine learning modelling. Chemosensors 2022, 10, 159. [Google Scholar] [CrossRef]
- Gonzalez Viejo, C.; Fuentes, S.; Hernandez-Brenes, C. Smart detection of faults in beers using near-infrared spectroscopy, a low-cost electronic nose and artificial intelligence. Fermentation 2021, 7, 117. [Google Scholar] [CrossRef]
- Summerson, V.; Gonzalez Viejo, C.; Torrico, D.D.; Pang, A.; Fuentes, S. Digital smoke taint detection in pinot grigio wines using an e-nose and machine learning algorithms following treatment with activated carbon and a cleaving enzyme. Fermentation 2021, 7, 119. [Google Scholar] [CrossRef]
- Gonzalez Viejo, C.; Fuentes, S. Low-cost methods to assess beer quality using artificial intelligence involving robotics, an electronic nose, and machine learning. Fermentation 2020, 6, 104. [Google Scholar] [CrossRef]
- Al-Marshadi, A.H.; Aslam, M. Statistical analysis for food quality in the presence of vague information. J. Food Qual. 2021, 2021, 7373620. [Google Scholar] [CrossRef]
- Wilson, A.D. Diverse applications of electronic-nose technologies in agriculture and forestry. Sensors 2013, 13, 2295–2348. [Google Scholar] [CrossRef] [Green Version]
- Seesaard, T.; Goel, N.; Kumar, M.; Wongchoosuk, C. Advances in gas sensors and electronic nose technologies for agricultural cycle applications. Comput. Electron. Agric. 2022, 193, 106673. [Google Scholar] [CrossRef]
- Jia, W.; Liang, G.; Jiang, Z.; Wang, J. Advances in electronic nose development for application to agricultural products. Food Anal. Methods 2019, 12, 2226–2240. [Google Scholar] [CrossRef]
- Deshmukh, S.; Bandyopadhyay, R.; Bhattacharyya, N.; Pandey, R.A.; Jana, A. Application of electronic nose for industrial odors and gaseous emissions measurement and monitoring—An overview. Talanta 2015, 144, 329–340. [Google Scholar] [CrossRef]
- Wongchoosuk, C.; Subannajui, K.; Wang, C.; Yang, Y.; Güder, F.; Kerdcharoen, T.; Cimalla, V.; Zacharias, M. Electronic nose for toxic gas detection based on photostimulated core–shell nanowires. RSC Adv. 2014, 4, 35084–35088. [Google Scholar] [CrossRef]
- Wilson, A.D. Review of electronic-nose technologies and algorithms to detect hazardous chemicals in the environment. Procedia Technol. 2012, 1, 453–463. [Google Scholar] [CrossRef] [Green Version]
- Capelli, L.; Sironi, S.; Rosso, R.D. Electronic noses for environmental monitoring applications. Sensors 2014, 14, 19979–20007. [Google Scholar] [CrossRef]
- Young, R.C.; Buttner, W.J.; Linnell, B.R.; Ramesham, R. Electronic nose for space program applications. Sens. Actuators B 2003, 93, 7–16. [Google Scholar] [CrossRef]
- Ryan, M.A.; Manatt, K.S.; Gluck, S.; Shevade, A.V.; Kisor, A.K.; Zhou, H.; Lara, L.M.; Homer, M.L. The JPL electronic nose: Monitoring air in the U.S. Lab on the international space station. In Proceedings of the IEEE Sensors 2010, Waikoloa, HI, USA, 1–4 November 2010; pp. 1242–1247. [Google Scholar]
- Farraia, M.V.; Rufo, J.C.; Paciência, I.; Mendes, F.; Delgado, L.; Moreira, A. The electronic nose technology in clinical diagnosis: A systematic review. Porto Biomed. J. 2019, 4, e42. [Google Scholar] [CrossRef] [PubMed]
- Wojnowski, W.; Dymerski, T.; Gębicki, J.; Namieśnik, J. Electronic noses in medical diagnostics. Curr. Med. Chem. 2019, 26, 197–215. [Google Scholar] [CrossRef] [PubMed]
- Siyang, S.; Wongchoosuk, C.; Kerdcharoen, T. Diabetes diagnosis by direct measurement from urine odor using electronic nose. In Proceedings of the 5th 2012 Biomedical Engineering International Conference, Muang, Thailand, 5–7 December 2012; pp. 1–4. [Google Scholar]
- Wu, W.; Liu, T.; Haick, H. Electronic nose sensors in healthcare. In Reference Module in Biomedical Sciences, 1st ed.; Elsevier: Cambridge, MA, USA, 2021. [Google Scholar]
- Wongchoosuk, C.; Lutz, M.; Kerdcharoen, T. Detection and classification of human body odor using an electronic nose. Sensors 2009, 9, 7234–7249. [Google Scholar] [CrossRef] [Green Version]
- Wasilewski, T.; Migon, D.; Gebicki, J.; Kamysz, W. Critical review of electronic nose and tongue instruments prospects in pharmaceutical analysis. Anal. Chim. Acta 2019, 1077, 14–29. [Google Scholar] [CrossRef] [PubMed]
- Wilson, A.D. Electronic-nose applications in forensic science and for analysis of volatile biomarkers in the human breath. J. Forensic Sci. Criminol. 2014, 1, 1–21. [Google Scholar]
- Nagappan, P.G.; Subramaniam, S.; Wang, D.Y. Olfaction as a soldier– a review of the physiology and its present and future use in the military. Mil. Med. Res. 2017, 4, 9. [Google Scholar] [CrossRef] [Green Version]
- Lim, S.H.; Feng, L.; Kemling, J.W.; Musto, C.J.; Suslick, K.S. An optoelectronic nose for the detection of toxic gases. Nat. Chem. 2009, 1, 562–567. [Google Scholar] [CrossRef] [Green Version]
- Jońca, J.; Pawnuk, M.; Arsen, A.; Sówka, I. Electronic noses and their applications for sensory and analytical measurements in the waste management plants—A review. Sensors 2022, 22, 1510. [Google Scholar] [CrossRef]
- Loutfi, A.; Coradeschi, S.; Mani, G.K.; Shankar, P.; Balaguru Rayappan, J.B. Electronic noses for food quality: A review. J. Food Eng. 2015, 144, 103–111. [Google Scholar] [CrossRef]
- Mamat, M.; Samad, S.A.; Hannan, M.A. An electronic nose for reliable measurement and correct classification of beverages. Sensors 2011, 11, 6435–6453. [Google Scholar] [CrossRef] [PubMed] [Green Version]
- Ghasemi-Varnamkhasti, M.; Mohtasebi, S.S.; Rodriguez-Mendez, M.L.; Lozano, J.; Razavi, S.H.; Ahmadi, H. Potential application of electronic nose technology in brewery. Trends Food Sci. Technol. 2011, 22, 165–174. [Google Scholar] [CrossRef]
- Pinger, M.; Draf, J.; Lakner, T.; Ferdenzi, C.; Rouby, C.; Hummel, T.; Bensafi, M. Perceived utility of electronic noses in patients with loss of smell. Eur. Arch. Oto-Rhino-Laryngol. 2021, 278, 2155–2156. [Google Scholar] [CrossRef]
- Ramírez, H.L.; Soriano, A.; Gómez, S.; Iranzo, J.U.; Briones, A.I. Evaluation of the food sniffer electronic nose for assessing the shelf life of fresh pork meat compared to physicochemical measurements of meat quality. Eur. Food Res. Technol. 2018, 244, 1047–1055. [Google Scholar] [CrossRef]
- Ali, M.M.; Hashim, N.; Aziz, S.A.; Lasekan, O. Principles and recent advances in electronic nose for quality inspection of agricultural and food products. Trends Food Sci. Technol. 2020, 99, 1–10. [Google Scholar]
- Sharmilan, T.; Premarathne, I.; Wanniarachchi, I.; Kumari, S.; Wanniarachchi, D. Application of electronic nose to predict the optimum fermentation time for low-country Sri Lankan tea. J. Food Qual. 2022, 2022, 7703352. [Google Scholar] [CrossRef]
- Sanaeifar, A.; ZakiDizaji, H.; Jafari, A.; Guardia, M.D.L. Early detection of contamination and defect in foodstuffs by electronic nose: A review. Trends Anal. Chem. 2017, 97, 257–271. [Google Scholar] [CrossRef]
- Andre, R.S.; Facure, M.H.M.; Mercante, L.A.; Correa, D.S. Electronic nose based on hybrid free-standing nanofibrous mats for meat spoilage monitoring. Sens. Actuators B Chem. 2022, 353, 131114. [Google Scholar] [CrossRef]
- Feng, H.; Zhang, M.; Liu, P.; Liu, Y.; Zhang, X. Evaluation of IoT-enabled monitoring and electronic nose spoilage detection for salmon freshness during cold storage. Foods 2020, 9, 1579. [Google Scholar] [CrossRef]
- Vajdi, M.; Varidi, M.J.; Varidi, M.; Mohebbi, M. Using electronic nose to recognize fish spoilage with an optimum classifier. J. Food Meas. Charact. 2019, 13, 1205–1217. [Google Scholar] [CrossRef]
- Peris, M.; Escuder-Gilabert, L. Electronic noses and tongues to assess food authenticity and adulteration. Trends Food Sci. Technol. 2016, 58, 40–54. [Google Scholar] [CrossRef] [Green Version]
- Falasconi, M.; Concina, I.; Gobbi, E.; Sberveglieri, V.; Pulvirenti, A.; Sberveglieri, G. Electronic nose for microbiological quality control of food products. Int. J. Electrochem. 2012, 2012, 715763. [Google Scholar] [CrossRef]
- Abdallah, S.A.; Al-Shatti, L.A.; Alhajraf, A.F.; Al-Hammad, N.; Al-Awadi, B. The detection of foodborne bacteria on beef: The application of the electronic nose. SpringerPlus 2013, 2, 687. [Google Scholar] [CrossRef] [PubMed] [Green Version]
- Xing, M.; Sun, K.; Liu, Q.; Pan, L.; Tu, K. Development of novel electronic nose applied for strawberry freshness detection during storage. Int. J. Food Eng. 2018, 14, 20180111. [Google Scholar] [CrossRef]
- Cozzolino, R.; Cefola, M.; Laurino, C.; Pellicano, M.P.; Palumbo, M.; Stocchero, M.; Pace, B. Electronic-nose as non-destructive tool to discriminate “Ferrovia” sweet cherries cold stored in air or packed in high CO2 modified atmospheres. Front. Nutr. 2021, 8, 720092. [Google Scholar] [CrossRef]
- Modesti, M.; Taglieri, I.; Bianchi, A.; Tonacci, A.; Sansone, F.; Bellincontro, A.; Venturi, F.; Sanmartin, C. E-nose and olfactory assessment: Teamwork or a challenge to the last data? The case of virgin olive oil stability and shelf life. Appl. Sci. 2021, 11, 8453. [Google Scholar] [CrossRef]
- Liu, L.; Li, X.; Li, Z.; Shi, Y. Application of electronic nose in detection of fresh vegetables freezing time considering odor identification technology. Chem. Eng. Trans. 2018, 68, 265–270. [Google Scholar]
- Sipos, L.; Kovacs, Z.; Szollosi, D.; Kókai, Z.; Dalmadi, I.; Fekete, A. Comparison of novel sensory panel performance evaluation techniques with e-nose analysis integration. J. Chemom. 2011, 25, 275–286. [Google Scholar] [CrossRef]
- Rizzolo, A.; Bianchi, G.; Vanoli, M.; Lurie, S.; Spinelli, L.; Torricelli, A. Electronic nose to detect volatile compound profile and quality changes in ‘Spring Belle’ peach (Prunus persica L.) during cold storage in relation to fruit optical properties measured by time-resolved reflectance spectroscopy. J. Agric. Food Chem. 2013, 61, 1671–1685. [Google Scholar] [CrossRef]
- Aleixandre, M.; Lozano, J.; Gutierrez, J.; Sayago, I.; Fernandez, M.J.; Horrillo, M.C. Portable e-nose to classify different kinds of wine. Sens. Actuators B 2008, 131, 71–76. [Google Scholar] [CrossRef]
- Men, H.; Shi, Y.; Fu, S.; Jiao, Y.; Qiao, Y.; Liu, J. Discrimination of beer based on e-tongue and e-nose combined with SVM: Comparison of different variable selection methods by PCA, GA-PLS and VIP. Preprints 2017, 2017050054. [Google Scholar]
- Quarto, A.; Soldo, D.; Di Lecce, F.; Giove, A.; Di Lecce, V.; Castronovo, A. Electronic nose for evaluating water use in beer production. In Proceedings of the 2017 ISOCS/IEEE International Symposium on Olfaction and Electronic Nose (ISOEN), Montreal, QC, Canada, 28–31 May 2017; pp. 1–3. [Google Scholar]
- Fujioka, K. Comparison of cheese aroma intensity measured using an electronic nose (e-nose) non-destructively with the aroma intensity scores of a sensory evaluation: A pilot study. Sensors 2021, 21, 8368. [Google Scholar] [CrossRef] [PubMed]
- Romano, A.; Cuenca, M.; Makhoul, S.; Biasioli, F.; Martinello, L.; Fugatti, A.; Scampicchio, M. Comparison of e-noses: The case study of honey. Ital. J. Food Sci. 2019, 28, 326–337. [Google Scholar]
- Rodríguez-Méndez, M.L.; De Saja, J.A.; González-Antón, R.; García-Hernández, C.; Medina-Plaza, C.; García-Cabezón, C.; Martín-Pedrosa, F. Electronic noses and tongues in wine industry. Front. Bioeng. Biotechnol. 2016, 4, 81. [Google Scholar] [CrossRef] [Green Version]
- Nimsuk, N. Improvement of accuracy in beer classification using transient features for electronic nose technology. J. Food Meas. Charact. 2018, 13, 656–662. [Google Scholar] [CrossRef]
- Rodríguez, J.; Durán, C.; Reyes, A. Electronic nose for quality control of Colombian coffee through the detection of defects in “Cup Tests”. Sensors 2010, 10, 36–46. [Google Scholar] [CrossRef]
- Yang, Y.; Xu, W.; Wu, M.; Mao, J.; Sha, R. Application of e-nose combined with ANN modelling for qualitative and quantitative analysis of benzoic acid in cola-type beverages. J. Food Meas. Charact. 2021, 15, 5131–5138. [Google Scholar] [CrossRef]
- Gomes, M.T.S.R. Chapter 3—Electronic nose in dairy products. In Electronic Noses and Tongues in Food Science, 1st ed.; Rodríguez Méndez, M.L., Ed.; Academic Press: San Diego, CA, USA, 2016; pp. 21–30. [Google Scholar]
- Yakubu, H.G.; Kovacs, Z.; Toth, T.; Bazar, G. Trends in artificial aroma sensing by means of electronic nose technologies to advance dairy production—A review. Crit. Rev. Food Sci. Nutr. 2021, 1–15. [Google Scholar] [CrossRef]
- Li, H.; Chen, Q.; Zhao, J.; Ouyang, Q. Non-destructive evaluation of pork freshness using a portable electronic nose (E-nose) based on a colorimetric sensor array. Anal. Methods 2014, 6, 6271–6277. [Google Scholar] [CrossRef]
- Górska-Horczyczak, E.; Guzek, D.; Molęda, Z.; Wojtasik-Kalinowska, I.; Brodowska, M.; Wierzbicka, A. Applications of electronic noses in meat analysis. Food Sci. Technol. 2016, 36, 389–395. [Google Scholar] [CrossRef] [Green Version]
- Wojnowski, W.; Majchrzak, T.; Dymerski, T.; Gębicki, J.; Namieśnik, J. Electronic noses: Powerful tools in meat quality assessment. Meat Sci. 2017, 131, 119–131. [Google Scholar] [CrossRef] [PubMed]
- Raudiene, E.; Gailius, D.; Vinauskiene, R.; Eisinaite, V.; Balčiunas, G.; Dobiliene, J.; Tamkute, L. Rapid evaluation of fresh chicken meat quality by electronic nose. Czech J. Food Sci. 2018, 36, 420–426. [Google Scholar]
- Grassi, S.; Benedetti, S.; Opizzio, M.; Nardo, E.D.; Buratti, S. Meat and fish freshness assessment by a portable and simplified electronic nose system (Mastersense). Sensors 2019, 19, 3225. [Google Scholar] [CrossRef] [PubMed] [Green Version]
- Güney, S.; Atasoy, A. Freshness classification of horse mackerels with e-nose system using hybrid binary decision tree structure. Int. J. Pattern Recognit. Artif. Intell. 2020, 34, 2050003. [Google Scholar] [CrossRef]
- Radi, R.; Wahyudi, E.; Adhityamurti, M.D.; Yuroto Putro, J.P.L.; Barokah, B.; Rohmah, D.N. Freshness assessment of Tilapia fish in traditional market based on an electronic nose. Bull. Electr. Eng. Inform. 2021, 10, 2466–2476. [Google Scholar] [CrossRef]
- Jiang, J.; Li, J.; Zheng, F.; Lin, H.; Hui, G. Rapid freshness analysis of mantis shrimps (Oratosquilla oratoria) by using electronic nose. Food Meas. 2016, 10, 48–55. [Google Scholar] [CrossRef]
- Srinivasan, P.; Robinson, J.; Geevaretnam, J.; Rayappan, J.B.B. Development of electronic nose (Shrimp-Nose) for the determination of perishable quality and shelf-life of cultured Pacific white shrimp (Litopenaeus Vannamei). Sens. Actuators B. Chem. 2020, 317, 128192. [Google Scholar] [CrossRef]
- Zhang, L.; Tian, F.; Liu, S.; Dang, L.; Peng, X.; Yin, X. Chaotic time series prediction of E-nose sensor drift in embedded phase space. Sens. Actuators B Chem. 2013, 182, 71–79. [Google Scholar] [CrossRef]
- Zhang, L.; Liu, Y.; He, Z.; Liu, J.; Deng, P.; Zhou, X. Anti-drift in E-nose: A subspace projection approach with drift reduction. Sens. Actuators B Chem. 2017, 253, 407–417. [Google Scholar] [CrossRef]
- Romain, A.C.; Nicolas, J. Long term stability of metal oxide-based gas sensors for e-nose environmental applications: An overview. Sens. Actuators B Chem. 2010, 146, 502–506. [Google Scholar] [CrossRef] [Green Version]
- Walker, G.M.; Stewart, G.G. Saccharomyces cerevisiae in the production of fermented beverages. Beverages 2016, 2, 30. [Google Scholar] [CrossRef]
- Jordan Voss, H.G.; Mendes Júnior, J.J.A.; Farinelli, M.E.; Stevan, S.L., Jr. A prototype to detect the alcohol content of beers based on an electronic nose. Sensors 2019, 19, 2646. [Google Scholar] [CrossRef] [Green Version]
- Berna, A.Z.; Trowell, S.; Cynkar, W.; Cozzolino, D. Comparison of metal oxide-based electronic nose and mass spectrometry-based electronic nose for the prediction of red wine spoilage. J. Agric. Food Chem. 2008, 56, 3238–3244. [Google Scholar] [CrossRef]
- Yan, B.; Sadiq, F.A.; Cai, Y.; Fan, D.; Zhang, H.; Zhao, J.; Chen, W. Identification of key aroma compounds in type I sourdough-based chinese steamed bread: Application of untargeted metabolomics analysis. Int. J. Mol. Sci. 2019, 20, 818. [Google Scholar] [CrossRef] [PubMed] [Green Version]
- Farahmand, E.; Razavi, S.H.; Mohtasebi, S.S. Investigating effective variables to produce desirable aroma in sourdough using e-nose and sensory panel. J. Food Process Preserv. 2020, 45, e15157. [Google Scholar] [CrossRef]
- Taneyo Saa, D.L.; Nissen, L.; Gianotti, A. Metabolomic approach to study the impact of flour type and fermentation process on volatile profile of bakery products. Food Res. Int. 2019, 119, 510–516. [Google Scholar]
- Botre, B.A.; Gharpure, D. Analysis of volatile bread aroma for evaluation of bread freshness using an electronic nose (E-nose). Mater. Manuf. Processes 2006, 21, 279–283. [Google Scholar] [CrossRef]
- Rusinek, R.; Gancarz, M.; Nawrocka, A. Application of an electronic nose with novel method for generation of smellprints for testing the suitability for consumption of wheat bread during 4-day storage. LWT-Food Sci. Technol. 2020, 117, 108665. [Google Scholar] [CrossRef]
- Prieto, N.; Rodriguez-Méndez, M.L.; Leardi, R.; Oliveri, P.; Hernando-Esquisabel, D.; Iniguez-Crespo, M.; de Saja, J.A. Application of multi-way analysis to UV–visible spectroscopy, gas chromatography and electronic nose data for wine ageing evaluation. Anal. Chim. Acta 2012, 719, 43–51. [Google Scholar] [CrossRef]
- Kang, B.S.; Lee, J.E.; Park, H.J. Qualitative and quantitative prediction of volatile compounds from initial amino acid profiles in Korean rice wine (makgeolli) model. J. Food Sci. 2014, 79, C1106–C1116. [Google Scholar] [CrossRef] [PubMed]
- Wiśniewska, P.; Śliwińska, M.; Namieśnik, J.; Wardencki, W.; Dymerski, T. The verification of the usefulness of electronic nose based on ultra-fast gas chromatography and four different chemometric methods for rapid analysis of spirit beverages. J. Anal. Methods Chem. 2016, 2016, 8763436. [Google Scholar] [CrossRef] [PubMed] [Green Version]
- Gancarz, M.; Malaga-Toboła, U.; Oniszczuk, A.; Tabor, S.; Oniszczuk, T.; Gawrysiak-Witulska, M.; Rusinek, R. Detection and measurement of aroma compounds with the electronic nose and a novel method for MOS sensor signal analysis during the wheat bread making process. Food Bioprod. Processing 2021, 127, 90–98. [Google Scholar] [CrossRef]
- Wiśniewska, P.; Śliwińska, M.; Dymerski, T.; Wardencki, W.; Namieśnik, J. Comparison of an electronic nose based on ultrafast gas chromatography, comprehensive two-dimensional gas chromatography, and sensory evaluation for an analysis of type of whisky. J. Chem. 2017, 2017, 2710104. [Google Scholar] [CrossRef]
- Phetchakul, T.; Sutthinet, C. Monitoring of draft beer fermentation process by electronic nose. Adv. Mater. Res. 2014, 911, 297–301. [Google Scholar] [CrossRef]
- Gonzalez Viejo, C.; Fuentes, S.; Godbole, A.; Widdicombe, B.; Unnithan, R.R. Development of a low-cost e-nose to assess aroma profiles: An artificial intelligence application to assess beer quality. Sens. Actuators B Chem. 2020, 308, 127688. [Google Scholar] [CrossRef]
- Blanco-Rodríguez, A.; Campo, F.; Morales, O.M.; Valiente, R.; Lambert, B.; Becherán, L.; Garcia-Ramirez, A.; Lisboa, H.D.M.; Durán, A. Development of an electronic nose to identify and classify odours from spirits beverages. Chem. Eng. Trans. 2016, 54, 337–342. [Google Scholar]
- Summerson, V.; Gonzalez Viejo, C.; Pang, A.; Torrico, D.D.; Fuentes, S. Assessment of volatile aromatic compounds in smoke tainted cabernet sauvignon wines using a low-cost e-nose and machine learning modelling. Molecules 2021, 26, 5108. [Google Scholar] [CrossRef] [PubMed]
- Gonzalez Viejo, C.; Fuentes, S. Digital assessment and classification of wine faults using a low-cost electronic nose, near-infrared spectroscopy and machine learning modelling. Sensors 2022, 22, 2303. [Google Scholar] [CrossRef]
- Rombouts, J.L.; Kranendonk, E.M.M.; Regueira, A.; Weissbrodt, D.G.; Kleerebezem, R.; Maria van Loosdrecht, M.C. Selecting for lactic acid producing and utilising bacteria in anaerobic enrichment cultures. Biotechnol Bioeng. 2020, 117, 1281–1293. [Google Scholar] [CrossRef]
- Pan, D.D.; Wu, Z.; Peng, T.; Zeng, X.Q.; Li, H. Volatile organic compounds profile during milk fermentation by Lactobacillus pentosus and correlations between volatiles flavor and carbohydrate metabolism. J. Dairy Sci. 2014, 97, 624–631. [Google Scholar] [CrossRef] [PubMed] [Green Version]
- Stiles, M.E.; Holzapfel, W.H. Lactic acid bacteria of foods and their current taxonomy. Int. J. Food Microbiol. 1997, 36, 1–29. [Google Scholar] [CrossRef]
- Abu-Khalaf, N.; Masoud, W. Electronic nose for differentiation and quantification of yeast species in white fresh soft cheese. Appl. Bionics Biomech. 2022, 2022, 8472661. [Google Scholar] [CrossRef] [PubMed]
- Kovacs, Z.; Bodor, Z.; Zinia Zaukuu, J.L.; Kaszab, T.; Bazar, G.; Tóth, T.; Mohácsi-Farkas, C. Electronic nose for monitoring odor changes of Lactobacillus species during milk fermentation and rapid selection of probiotic candidates. Foods 2020, 9, 1539. [Google Scholar] [CrossRef]
- Drake, M.A.; Gerard, P.D.; Kleinhenz, J.P.; Harper, W.J. Application of an electronic nose to correlate with descriptive sensory analysis of aged Cheddar cheese. LWT-Food Sci. Technol. 2003, 36, 13–20. [Google Scholar] [CrossRef]
- Štefániková, J.; Nagyová, V.; Hynšt, M.; Vietoris, V.; Martišová, P.; Nagyová, L. Application of electronic nose for determination of Slovak cheese authentication based on aroma profile. Potravinarstvo Slovak. J. Food Sci. 2019, 13, 262–267. [Google Scholar]
- Trihaas, J.; Vognsen, L.; Nielsen, P.V. Electronic nose: New tool in modelling the ripening of Danish blue cheese. Int. Dairy J. 2005, 15, 679–691. [Google Scholar] [CrossRef]
- Li, S.; Ma, C.; Liu, Z.; Gong, G.; Xu, Z.; Xu, A.; Hua, B. Flavour analysis of stirred yoghurt with Cheddar cheese adding into milk. Food Sci. Technol. Res. 2014, 20, 939–946. [Google Scholar] [CrossRef]
- Tian, H.; Liu, H.; He, Y.; Chen, B.; Xiao, L.; Fei, Y.; Wang, G.; Yu, H.; Chen, C. Combined application of electronic nose analysis and back-propagation neural network and random forest models for assessing yogurt flavor acceptability. J. Food Meas. Charact. 2020, 14, 573–583. [Google Scholar] [CrossRef]
- Olivares, A.; Navarro, J.L.; Flores, M. Characterization of volatile compounds responsible for the aroma in naturally fermented sausages by gas chromatography-olfactometry. Food Sci. Technol. Int. 2015, 21, 110–123. [Google Scholar] [CrossRef] [Green Version]
- Gu, X.; Sun, Y.; Tu, K.; Pan, L. Evaluation of lipid oxidation of Chinese-style sausage during processing and storage based on electronic nose. Meat Sci. 2017, 133, 1–9. [Google Scholar] [CrossRef] [PubMed]
- Yang, F.; Gao, H.; Zhang, Y.; Liao, Y.; Zeng, Q.; He, X.; Xu, K.; He, J. Optimizing conditions of electronic nose for rapid detection of flavor substances in Ningxiang pork. J. Food Process Eng. 2021, 44, e13758. [Google Scholar] [CrossRef]
- Chen, Q.; Hu, Y.; Wen, R.; Wang, Y.; Qin, L.; Kong, B. Characterisation of the flavour profile of dry fermented sausages with different NaCl substitutes using HS-SPME-GC-MS combined with electronic nose and electronic tongue. Meat Sci. 2021, 172, 108338. [Google Scholar] [CrossRef]
- Yin, X.; Lv, Y.; Wen, R.; Wang, Y.; Chen, Q.; Kong, B. Characterization of selected Harbin red sausages on the basis of their flavour profiles using HS-SPME-GC/MS combined with electronic nose and electronic tongue. Meat Sci. 2021, 172, 108345. [Google Scholar] [CrossRef]
- Taurino, A.M.; Dello Monaco, D.; Capone, S.; Epifani, M.; Rella, R.; Siciliano, P.; Ferrara, L.; Maglione, G.; Basso, A.; Balzarano, D. Analysis of dry salami by means of an electronic nose and correlation with microbiological methods. Sens. Actuators B Chem. 2003, 95, 123–131. [Google Scholar] [CrossRef]
- Yang, X.; Hu, W.; Xiu, Z.; Jiang, A.; Yang, X.; Sarengaowa; Ji, Y.; Guan, Y.; Feng, K. Microbial dynamics and volatilome profiles during the fermentation of Chinese northeast sauerkraut by Leuconostoc mesenteroides ORC 2 and Lactobacillus plantarum HBUAS 51041 under different salt concentrations. Food Res. Int. 2020, 130, 108926. [Google Scholar] [CrossRef]
- Cai, W.; Tang, F.; Wang, Y.; Zhang, Z.; Xue, Y.; Zhao, X.; Guo, Z.; Shan, C. Bacterial diversity and flavor profile of Zha-Chili, a traditional fermented food in China. Food Res. Int. 2021, 141, 110112. [Google Scholar] [CrossRef]
- Sánchez, R.; Martín-Tornero, E.; Lozano, J.; Boselli, E.; Arroyo, P.; Meléndez, F.; Martín-Vertedor, D. E-nose discrimination of abnormal fermentations in Spanish-style green olives. Molecules 2021, 26, 5353. [Google Scholar] [CrossRef] [PubMed]
- Hu, W.; Yang, X.; Ji, Y.; Guan, Y. Effect of starter cultures mixed with different autochthonous lactic acid bacteria on microbial, metabolome and sensory properties of Chinese northeast sauerkraut. Food Res. Int. 2021, 148, 110605. [Google Scholar] [CrossRef] [PubMed]
- Lee, W.H.; Oh, I.M.; Choi, S.; Park, J.T. Classification of geographical origin of kimchi by volatile compounds analysis using an electronic nose. Food Sci. Biotechnol. 2021, 30, 1313–1319. [Google Scholar] [CrossRef]
- Dai, C.; Huang, X.; Sun, J.; Tian, X.; Aheto, J.H.; Niu, S. Development of a portable electronic nose for in-situ detection of submerged fermentation of Tremella aurantialba. J. Food Saf. 2021, 41, e12902. [Google Scholar] [CrossRef]
- Štefániková, J.; Martišová, P.; Árvay, J.; Jankura, E.; Kačániová, M.; Gálová, J.; Vietoris, V. Comparison of electronic systems with sensory analysis for the quality evaluation of parenica cheese. Czech J. Food Sci. 2020, 38, 273–279. [Google Scholar] [CrossRef]
- Guan, B.; Zhao, J.; Cai, M.; Lin, H.; Yao, L.; Sun, L. Analysis of volatile organic compounds from Chinese vinegar substrate during solid-state fermentation using a colorimetric sensor array. Anal. Methods 2014, 6, 9383–9391. [Google Scholar] [CrossRef]
- Zhang, Q.; Zhang, S.; Xie, C.; Zeng, D.; Fan, C.; Li, D.; Bai, Z. Characterization of Chinese vinegars by electronic nose. Sens. Actuators B Chem. 2006, 119, 538–546. [Google Scholar] [CrossRef]
- Zhang, Q.; Zhang, S.; Xie, C.; Fan, C.; Bai, Z. ‘Sensory analysis’ of Chinese vinegars using an electronic nose. Sens. Actuators B Chem. 2008, 128, 586–593. [Google Scholar] [CrossRef]
- Jo, D.; Kim, G.R.; Yeo, S.H.; Jeong, Y.J.; Noh, B.S.; Kwon, J.H. Analysis of aroma compounds of commercial cider vinegars with different acidities using SPME/GC-MS, electronic nose, and sensory evaluation. Food Sci. Biotechnol. 2013, 22, 1559–1565. [Google Scholar] [CrossRef]
- Zhou, H.B. Identification of vinegar flavor using electronic nose. Res. J. Appl. Sci. Eng. Technol. 2017, 13, 154–160. [Google Scholar] [CrossRef]
- Taştan, M.; Gökozan, H. Real-Time Monitoring of Indoor Air Quality with Internet of Things-Based E-Nose. Appl. Sci. 2019, 9, 3435. [Google Scholar] [CrossRef]
- Huang, M.; Zhang, J.; Wu, J.; Sun, B.; Zhang, Y.; Lan, X. Evaluation of Chinese vinegar by electronic nose. Appl. Mech. Mater. 2014, 490–491, 1497–1502. [Google Scholar] [CrossRef]
- Men, H.; Wang, L.; Zhang, H. Electronic nose for the vinegar quality evaluation by an incremental RBF network. J. Comput. 2012, 7, 2276–2282. [Google Scholar] [CrossRef]
- Wu, X.H.; Zhu, J.; Wu, B.; Huang, D.P.; Sun, J.; Dai, C.X. Classification of Chinese vinegar varieties using electronic nose and fuzzy Foley–Sammon transformation. J. Food Sci. Technol. 2020, 57, 1310–1319. [Google Scholar] [CrossRef] [PubMed]
- Wang, L.; Huang, X.; Wang, C.; Aheto, J.H.; Chang, X.; Yu, S.; Zhang, X.; Wang, Y. Coupling electronic nose with GC–MS improves flavor recognition and grade differentiation of Zhenjiang aromatic vinegar. J. Food Process Eng. 2021, 44, e13806. [Google Scholar] [CrossRef]
- Jo, Y.; Chung, N.; Park, S.W.; Noh, B.S.; Jeong, Y.J.; Kwon, J.H. Application of E-tongue, E-nose, and MS-E-nose for discriminating aged vinegars based on taste and aroma profiles. Food Sci. Biotechnol. 2016, 25, 1313–1318. [Google Scholar] [CrossRef] [PubMed]
- Tozlu, B.H.; İbrahim Okumuş, H. A new approach to automation of black tea fermentation process with electronic nose. Automatika 2018, 59, 373–381. [Google Scholar] [CrossRef]
- Zheng, X.Q.; Li, Q.S.; Xiang, L.P.; Liang, Y.R. Recent advances in volatiles of teas. Molecules 2016, 21, 338. [Google Scholar] [CrossRef]
- Park, J.; Thomasson, J.A.; Gale, C.C.; Sword, G.A.; Lee, K.M.; Herrman, T.J.; Suh, C.P.C. Adsorbent-SERS technique for determination of plant VOCs from live cotton plants and dried teas. ACS Omega 2020, 5, 2779–2790. [Google Scholar] [CrossRef] [Green Version]
- Siyang, S.; Seesaard, T.; Lorwongtragool, P.; Kerdcharoen, T. E-nose based on metallo-tetraphenylporphyrinl SWNT-COOH for alcohol detection. In Proceedings of the 2013 IEEE International Conference of Electron Devices and Solid-State Circuits (EDSSC), Hong Kong, China, 3–5 June 2013. [Google Scholar]
- Chen, Q.; Zhao, J.; Chen, Z.; Lin, H.; Zhao, D.A. Discrimination of green tea quality using the electronic nose technique and the human panel test, comparison of linear and nonlinear classification tools. Sens. Actuators B Chem. 2011, 159, 294–300. [Google Scholar] [CrossRef]
- Torri, L.; Rinaldi, M.; Chiavaro, E. Electronic nose evaluation of volatile emission of Chinese teas: From leaves to infusions. Int. J. Food Sci. Technol. 2014, 49, 1315–1323. [Google Scholar] [CrossRef]
- Wu, X.; Zhu, J.; Wu, B.; Zhao, C.; Sun, J.; Dai, C. Discrimination of Chinese liquors based on electronic nose and fuzzy discriminant principal component analysis. Foods 2019, 8, 38. [Google Scholar] [CrossRef] [Green Version]
- Anal, A.K. Quality ingredients and safety concerns for traditional fermented foods and beverages from Asia: A review. Fermentation 2019, 5, 8. [Google Scholar] [CrossRef] [Green Version]
- Diez-Simon, C.; Eichelsheim, C.; Mumm, R.; Hall, R.D. Chemical and sensory characteristics of soy sauce: A review. J. Agric. Food Chem. 2020, 68, 11612–11630. [Google Scholar] [CrossRef] [PubMed]
- Chukeatirote, E.; Eungwanichayapant, P.D.; Kanghae, A. Determination of volatile components in fermented soybean prepared by a coculture of Bacillus subtilis and Rhizopus oligosporus. Food Res. 2017, 1, 225–233. [Google Scholar] [CrossRef]
- Park, S.W.; Lee, S.J.; Sim, Y.S.; Choi, J.Y.; Park, E.Y.; Noh, B.S. Analysis of ethanol in soy sauce using electronic nose for halal food certification. Food Sci. Biotechnol. 2017, 26, 311–317. [Google Scholar] [CrossRef] [PubMed]
- Jung, H.Y.; Kwak, H.S.; Kim, M.J.; Kim, Y.; Kim, K.O.; Kim, S.S. Comparison of a descriptive analysis and instrumental measurements (electronic nose and electronic tongue) for the sensory profiling of Korean fermented soybean paste (doenjang). J. Sens. Stud. 2017, 32, e12282. [Google Scholar] [CrossRef]
- Hidayat, S.N.; Nuringtyas, T.R.; Triyana, K. Electronic nose coupled with chemometrics for monitoring of Tempeh fermentation process. In Proceedings of the 2018 4th International Conference on Science and Technology (ICST), Yogyakarta, Indonesia, 7–8 August 2018. [Google Scholar]
- Ravi, R.; Taheri, A.; Khandekar, D.; Millas, R. Rapid profiling of soybean aromatic compounds using electronic nose. Biosensors 2019, 9, 66. [Google Scholar] [CrossRef] [Green Version]
- Yu, S.; Huang, X.; Wang, L.; Ren, Y.; Zhang, X.; Wang, Y. Characterization of selected Chinese soybean paste based on flavor profiles using HS-SPME-GC/MS, E-nose and E-tongue combined with chemometrics. Food Chem. 2022, 375, 131840. [Google Scholar] [CrossRef]
- Narzary, Y.; Das, S.; Goyal, A.K.; Lam, S.S.; Sarma, H.; Sharma, D. Fermented fish products in South and Southeast Asian cuisine: Indigenous technology processes, nutrient composition, and cultural significance. J. Ethn. Foods 2021, 8, 33. [Google Scholar] [CrossRef]
- Shivanne Gowda, S.G.; Narayan, B.; Gopal, S. Bacteriological properties and health-related biochemical components of fermented fish sauce: An overview. Food Rev. Int. 2016, 32, 203–229. [Google Scholar] [CrossRef]
- Yang, X.; Xie, W.; Zhang, C.; Wu, H.; Li, S.; Yang, L. Identification of sensory quality of rapid fermented fish using electronic nose. In Proceedings of the 2009 International Conference on Information Engineering and Computer Science, Wuhan, China, 19–20 December 2009. [Google Scholar]
- Wang, Y.; Wu, Y.; Shen, Y.; Li, C.; Zhao, Y.; Qi, B.; Li, L.; Chen, Y. Metabolic footprint analysis of volatile organic compounds by gas chromatography-ion mobility spectrometry to discriminate Mandarin fish (Siniperca chuatsi) at different fermentation stages. Front. Bioeng. Biotechnol. 2021, 9, 805364. [Google Scholar] [CrossRef]
- Nimsuk, N. Application of electronic nose for classification of fish sauces using transient responses and learning vector quantization algorithm. Adv. Mater. Res. 2014, 931–932, 1582–1586. [Google Scholar] [CrossRef]
- Nakano, M.; Sagane, Y.; Koizumi, R.; Nakazawa, Y.; Yamazaki, M.; Ikehama, K.; Yoshida, K.; Watanabe, T.; Takano, K.; Sato, H. Clustering of commercial fish sauce products based on an e-panel technique. Data Brief 2018, 16, 515–520. [Google Scholar] [CrossRef] [PubMed]
Figure 1.
Applications of E-nose for fermented food and beverage.
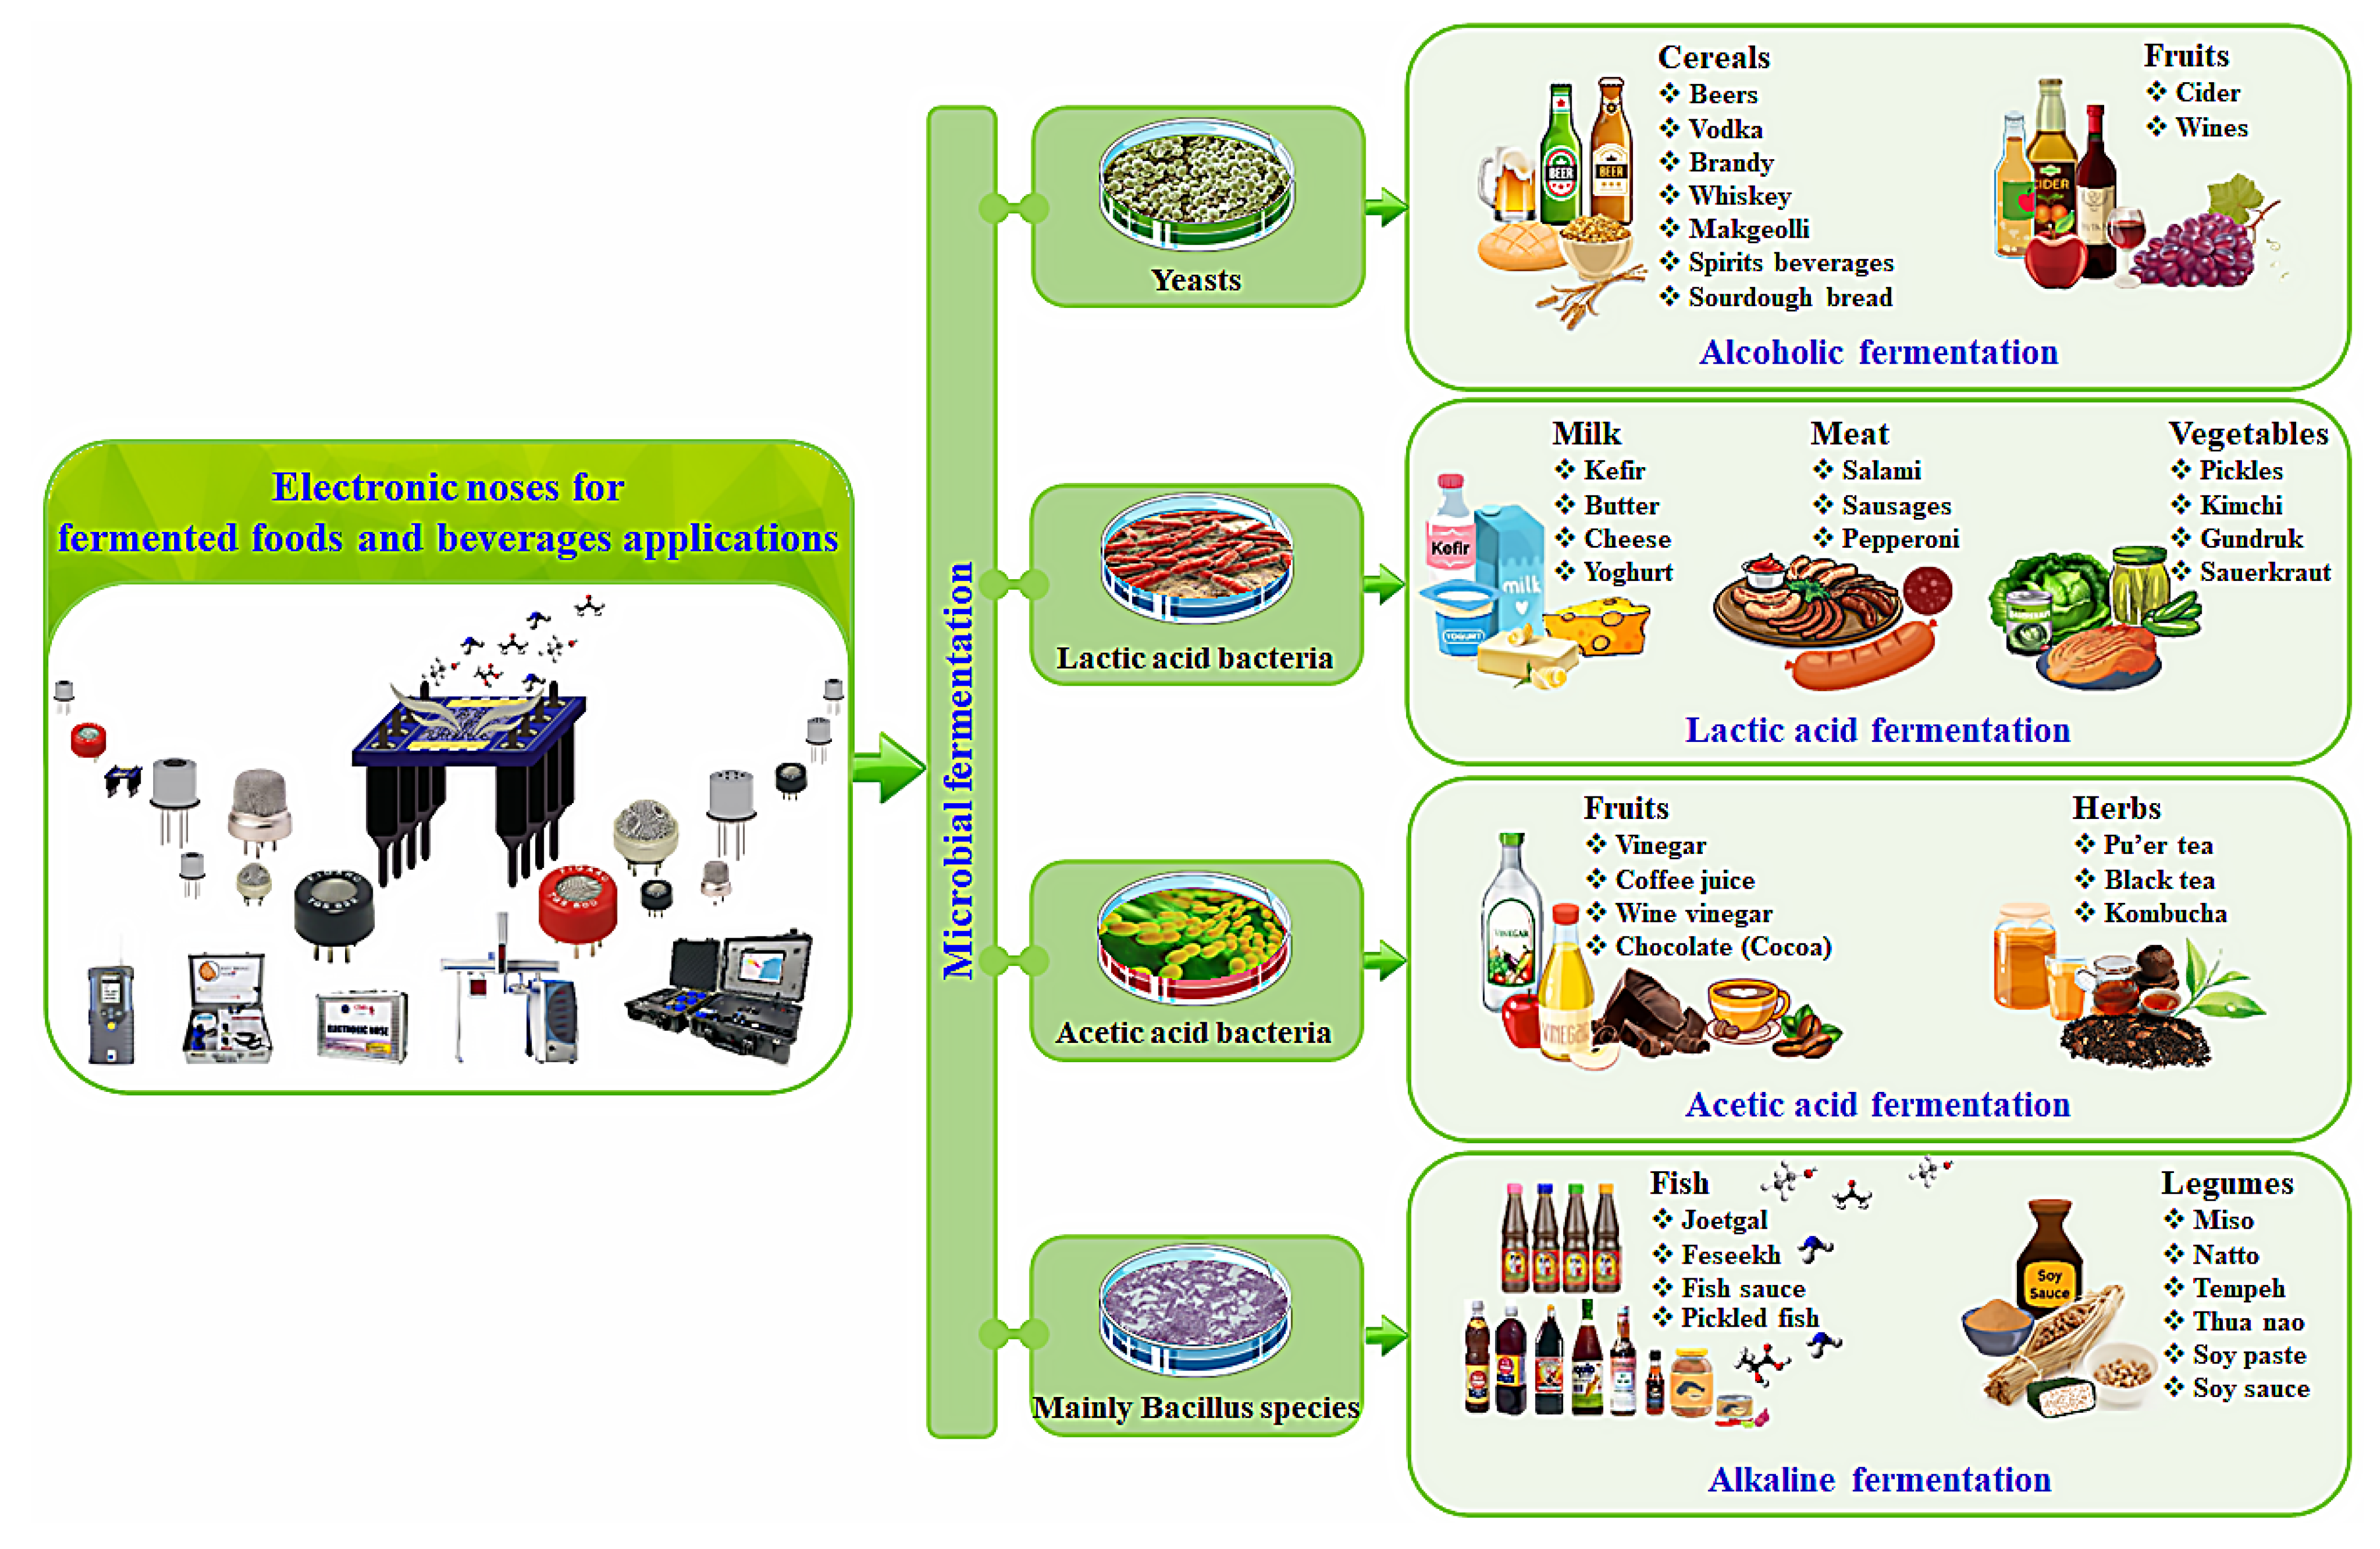
Figure 2.
Schematic diagram of E-nose device versus biological olfactory system.
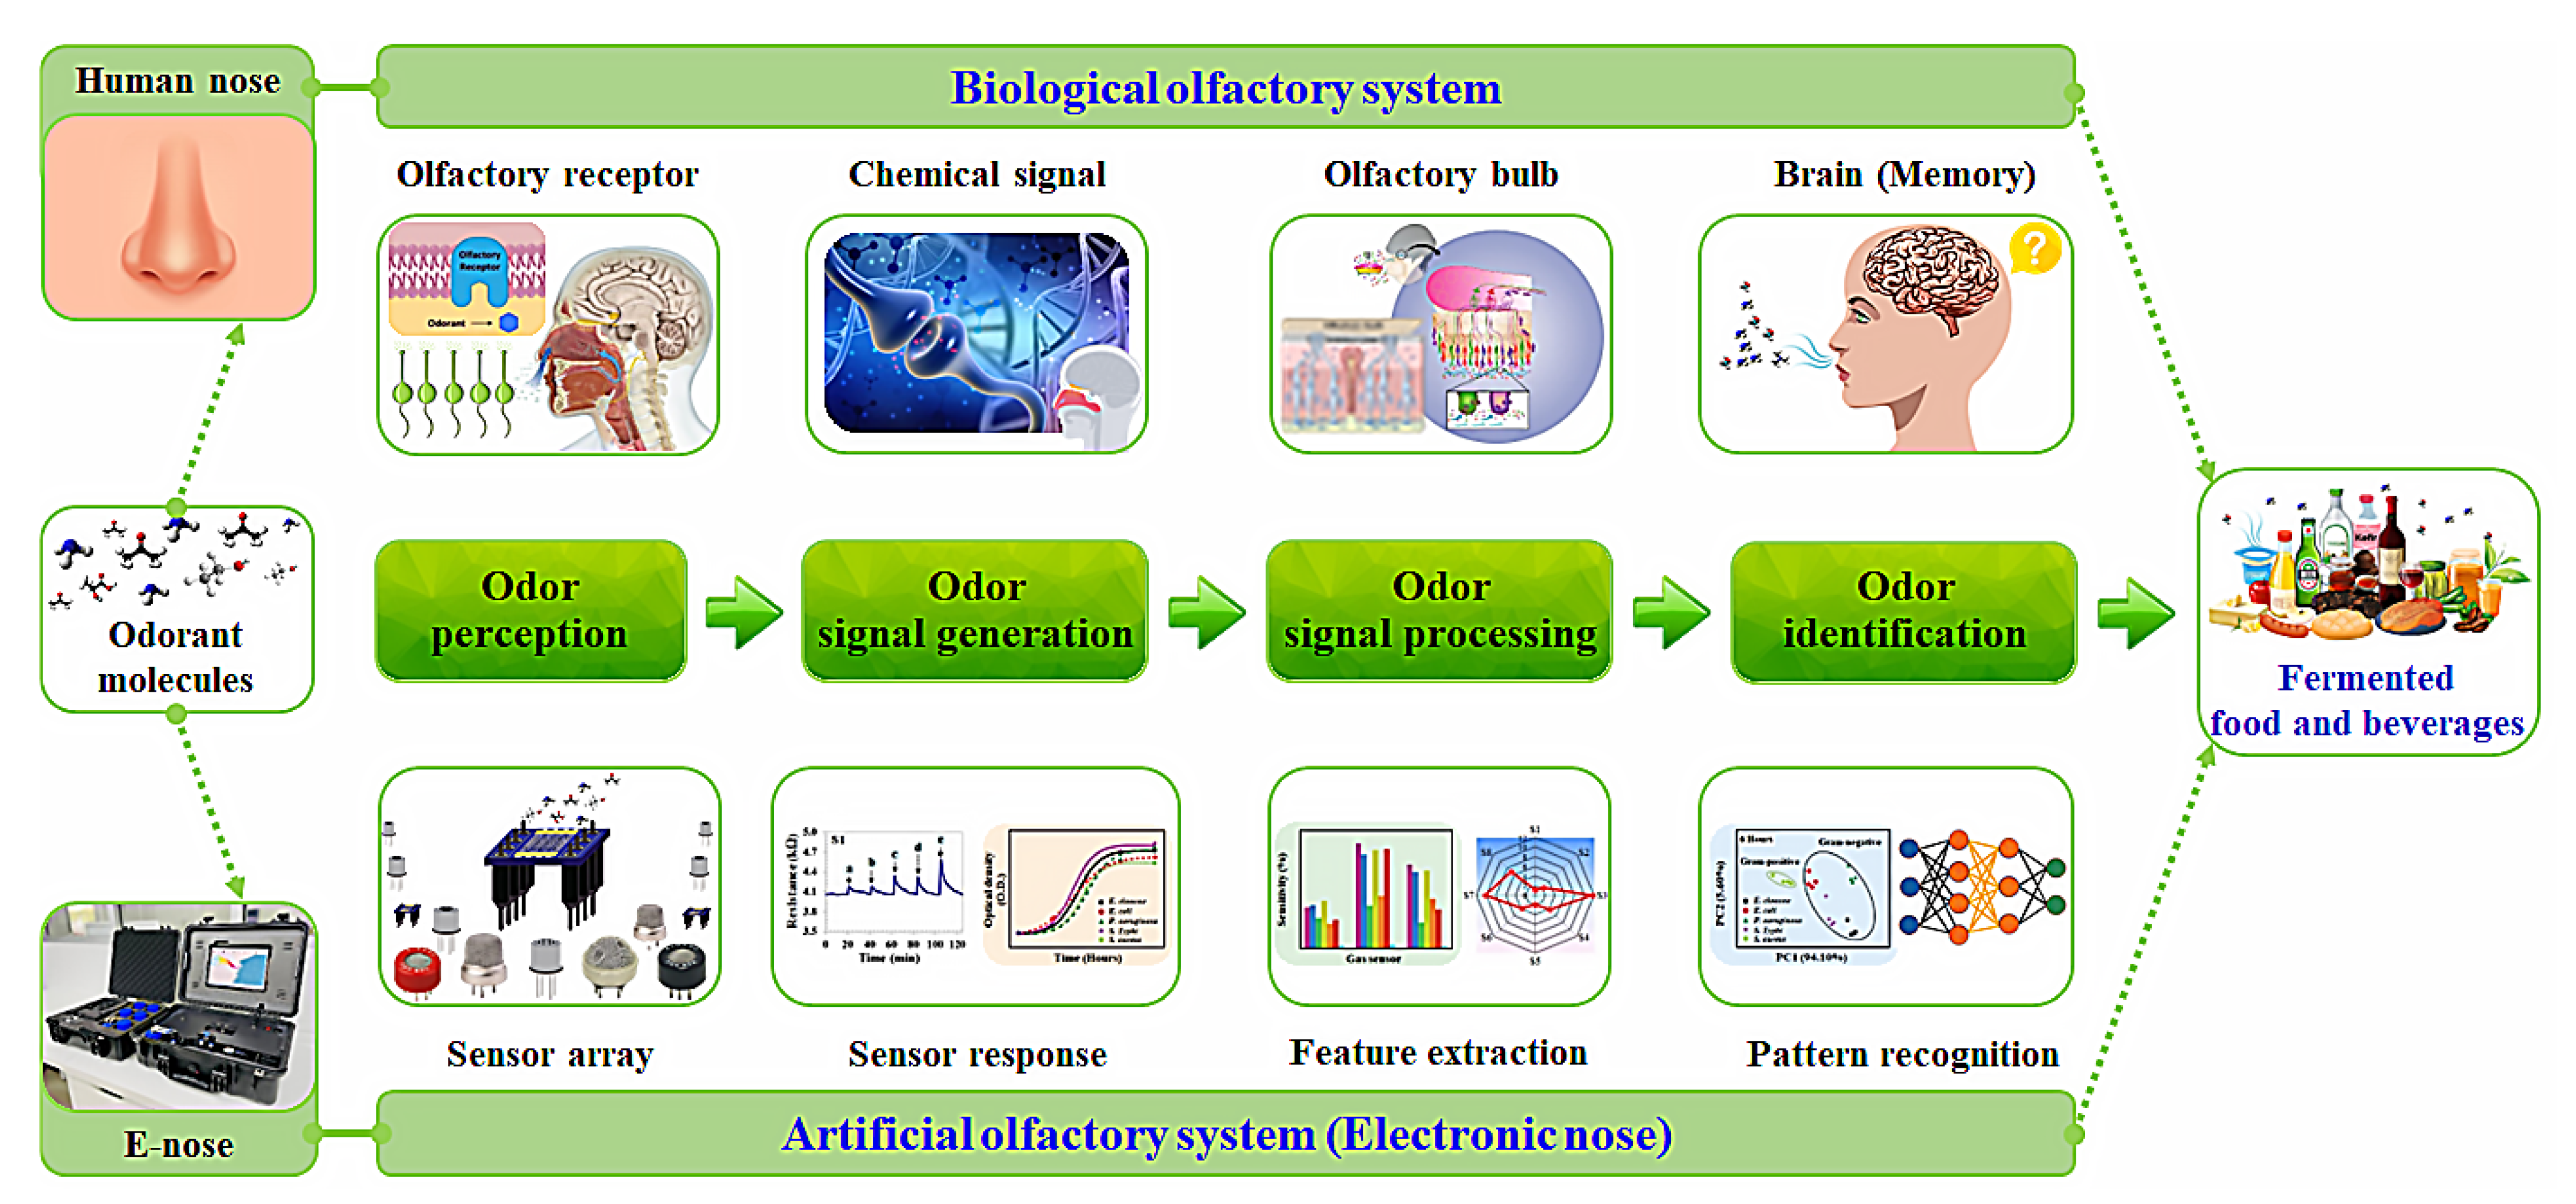
Figure 3.
Photograph and schematic diagram of a prototype portable E-nose system. (Reproduced with permission from Elsevier [16]).
Figure 3.
Photograph and schematic diagram of a prototype portable E-nose system. (Reproduced with permission from Elsevier [16]).
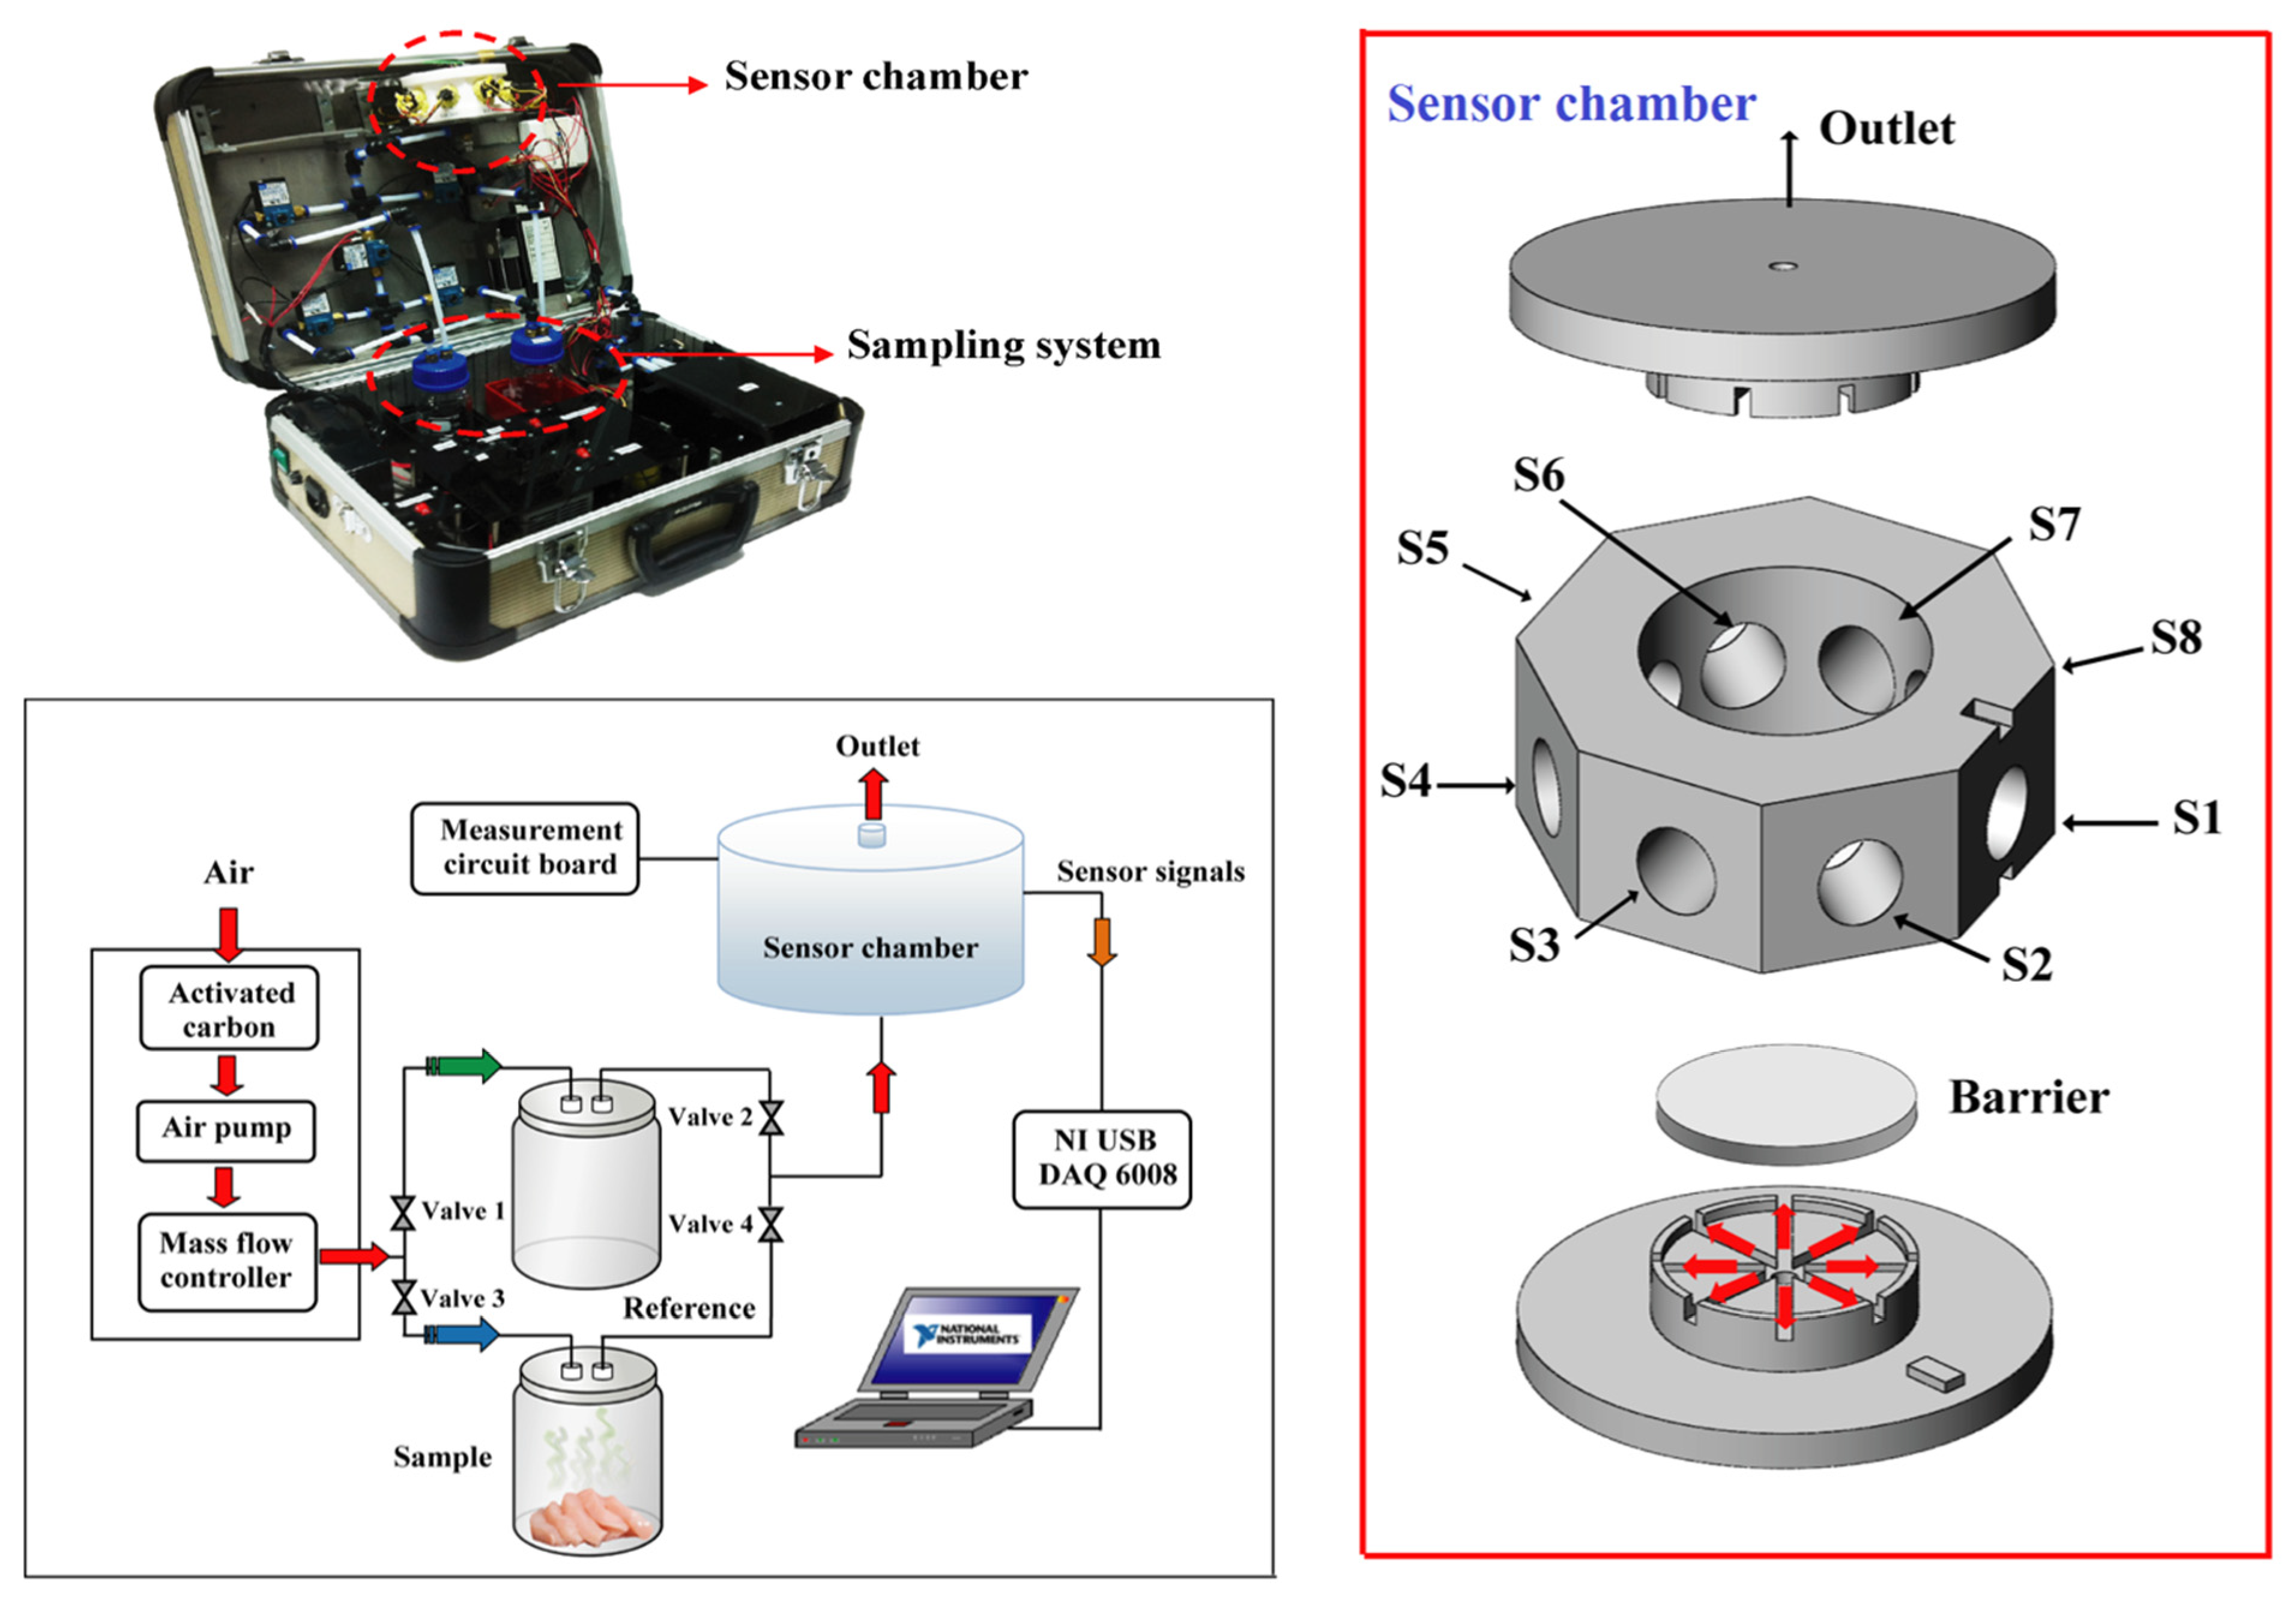
Figure 4.
Schematic diagram of E-nose system combined with GC-MS for monitoring VOC emissions during the bread production process. (Reproduced with permission from Elsevier [137]).
Figure 4.
Schematic diagram of E-nose system combined with GC-MS for monitoring VOC emissions during the bread production process. (Reproduced with permission from Elsevier [137]).
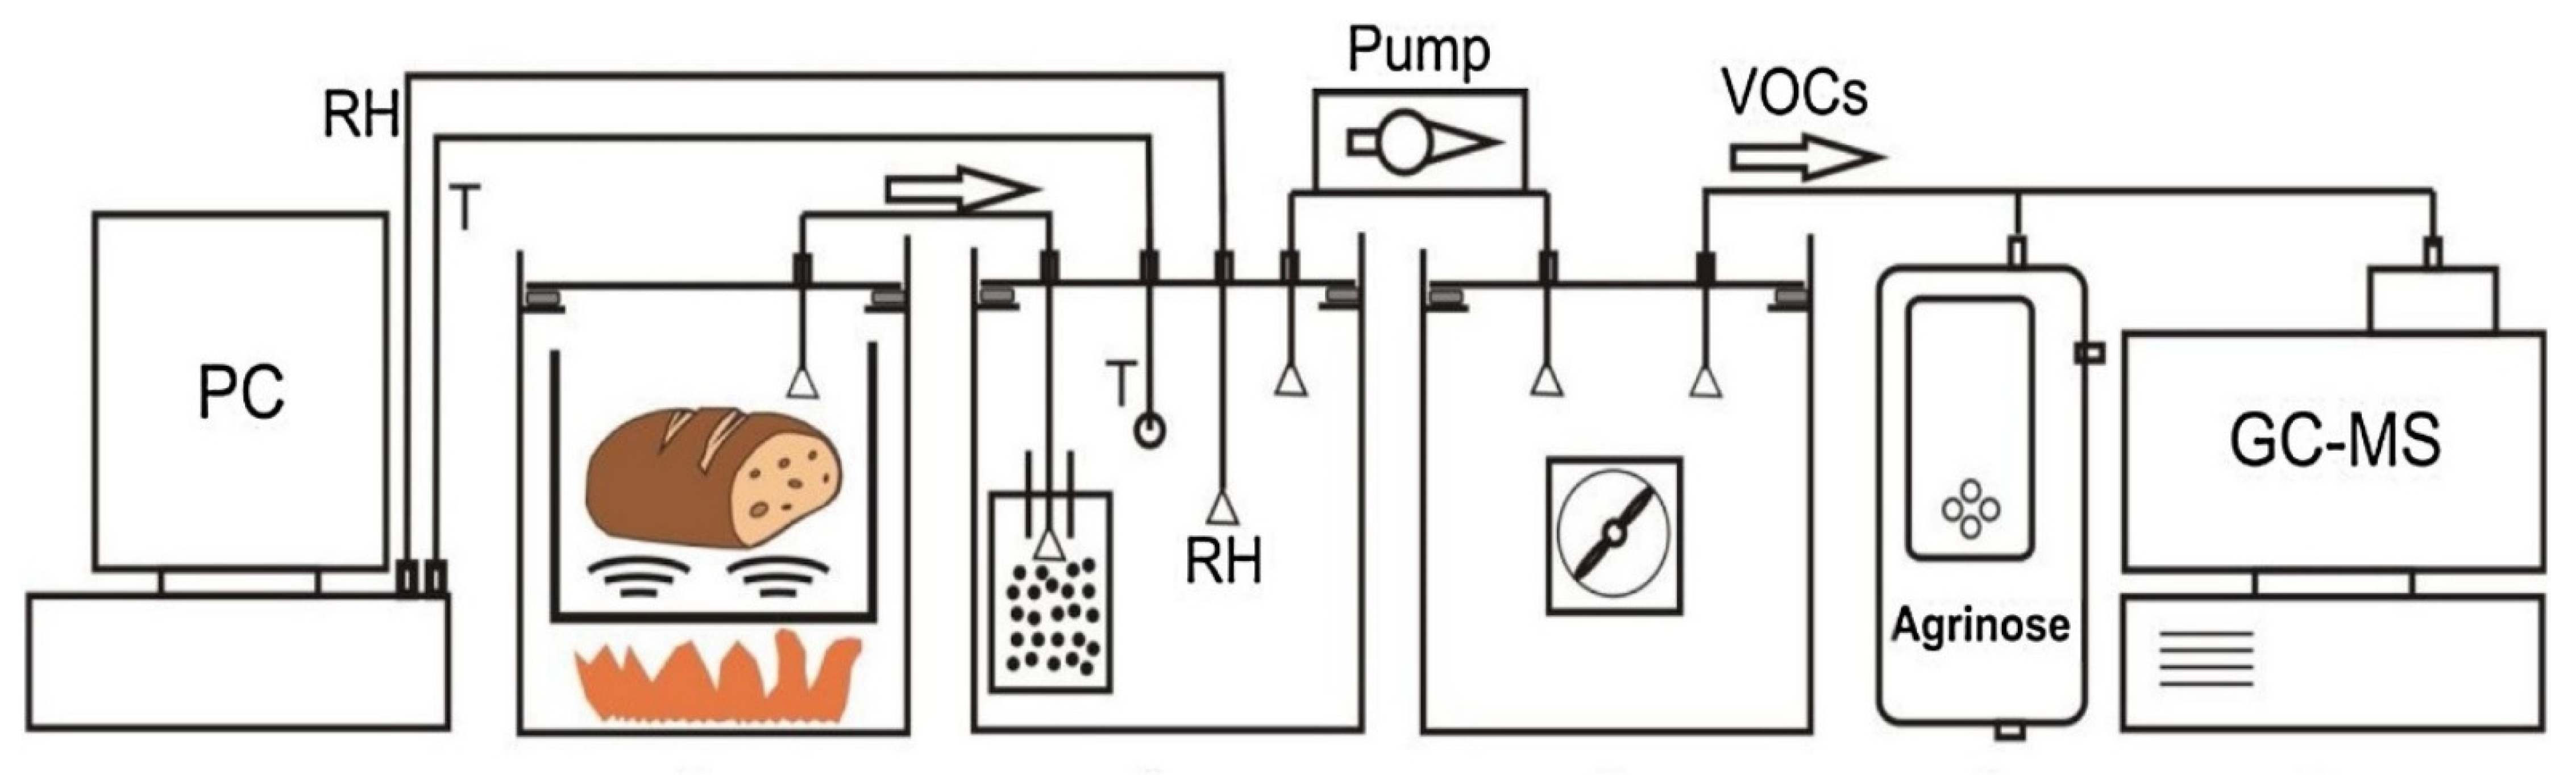
Figure 5.
Generation of VOCs in carbohydrate metabolism during milk fermentation by Lactobacillus pentosus. (Reproduced with permission from Elsevier [145]).
Figure 5.
Generation of VOCs in carbohydrate metabolism during milk fermentation by Lactobacillus pentosus. (Reproduced with permission from Elsevier [145]).
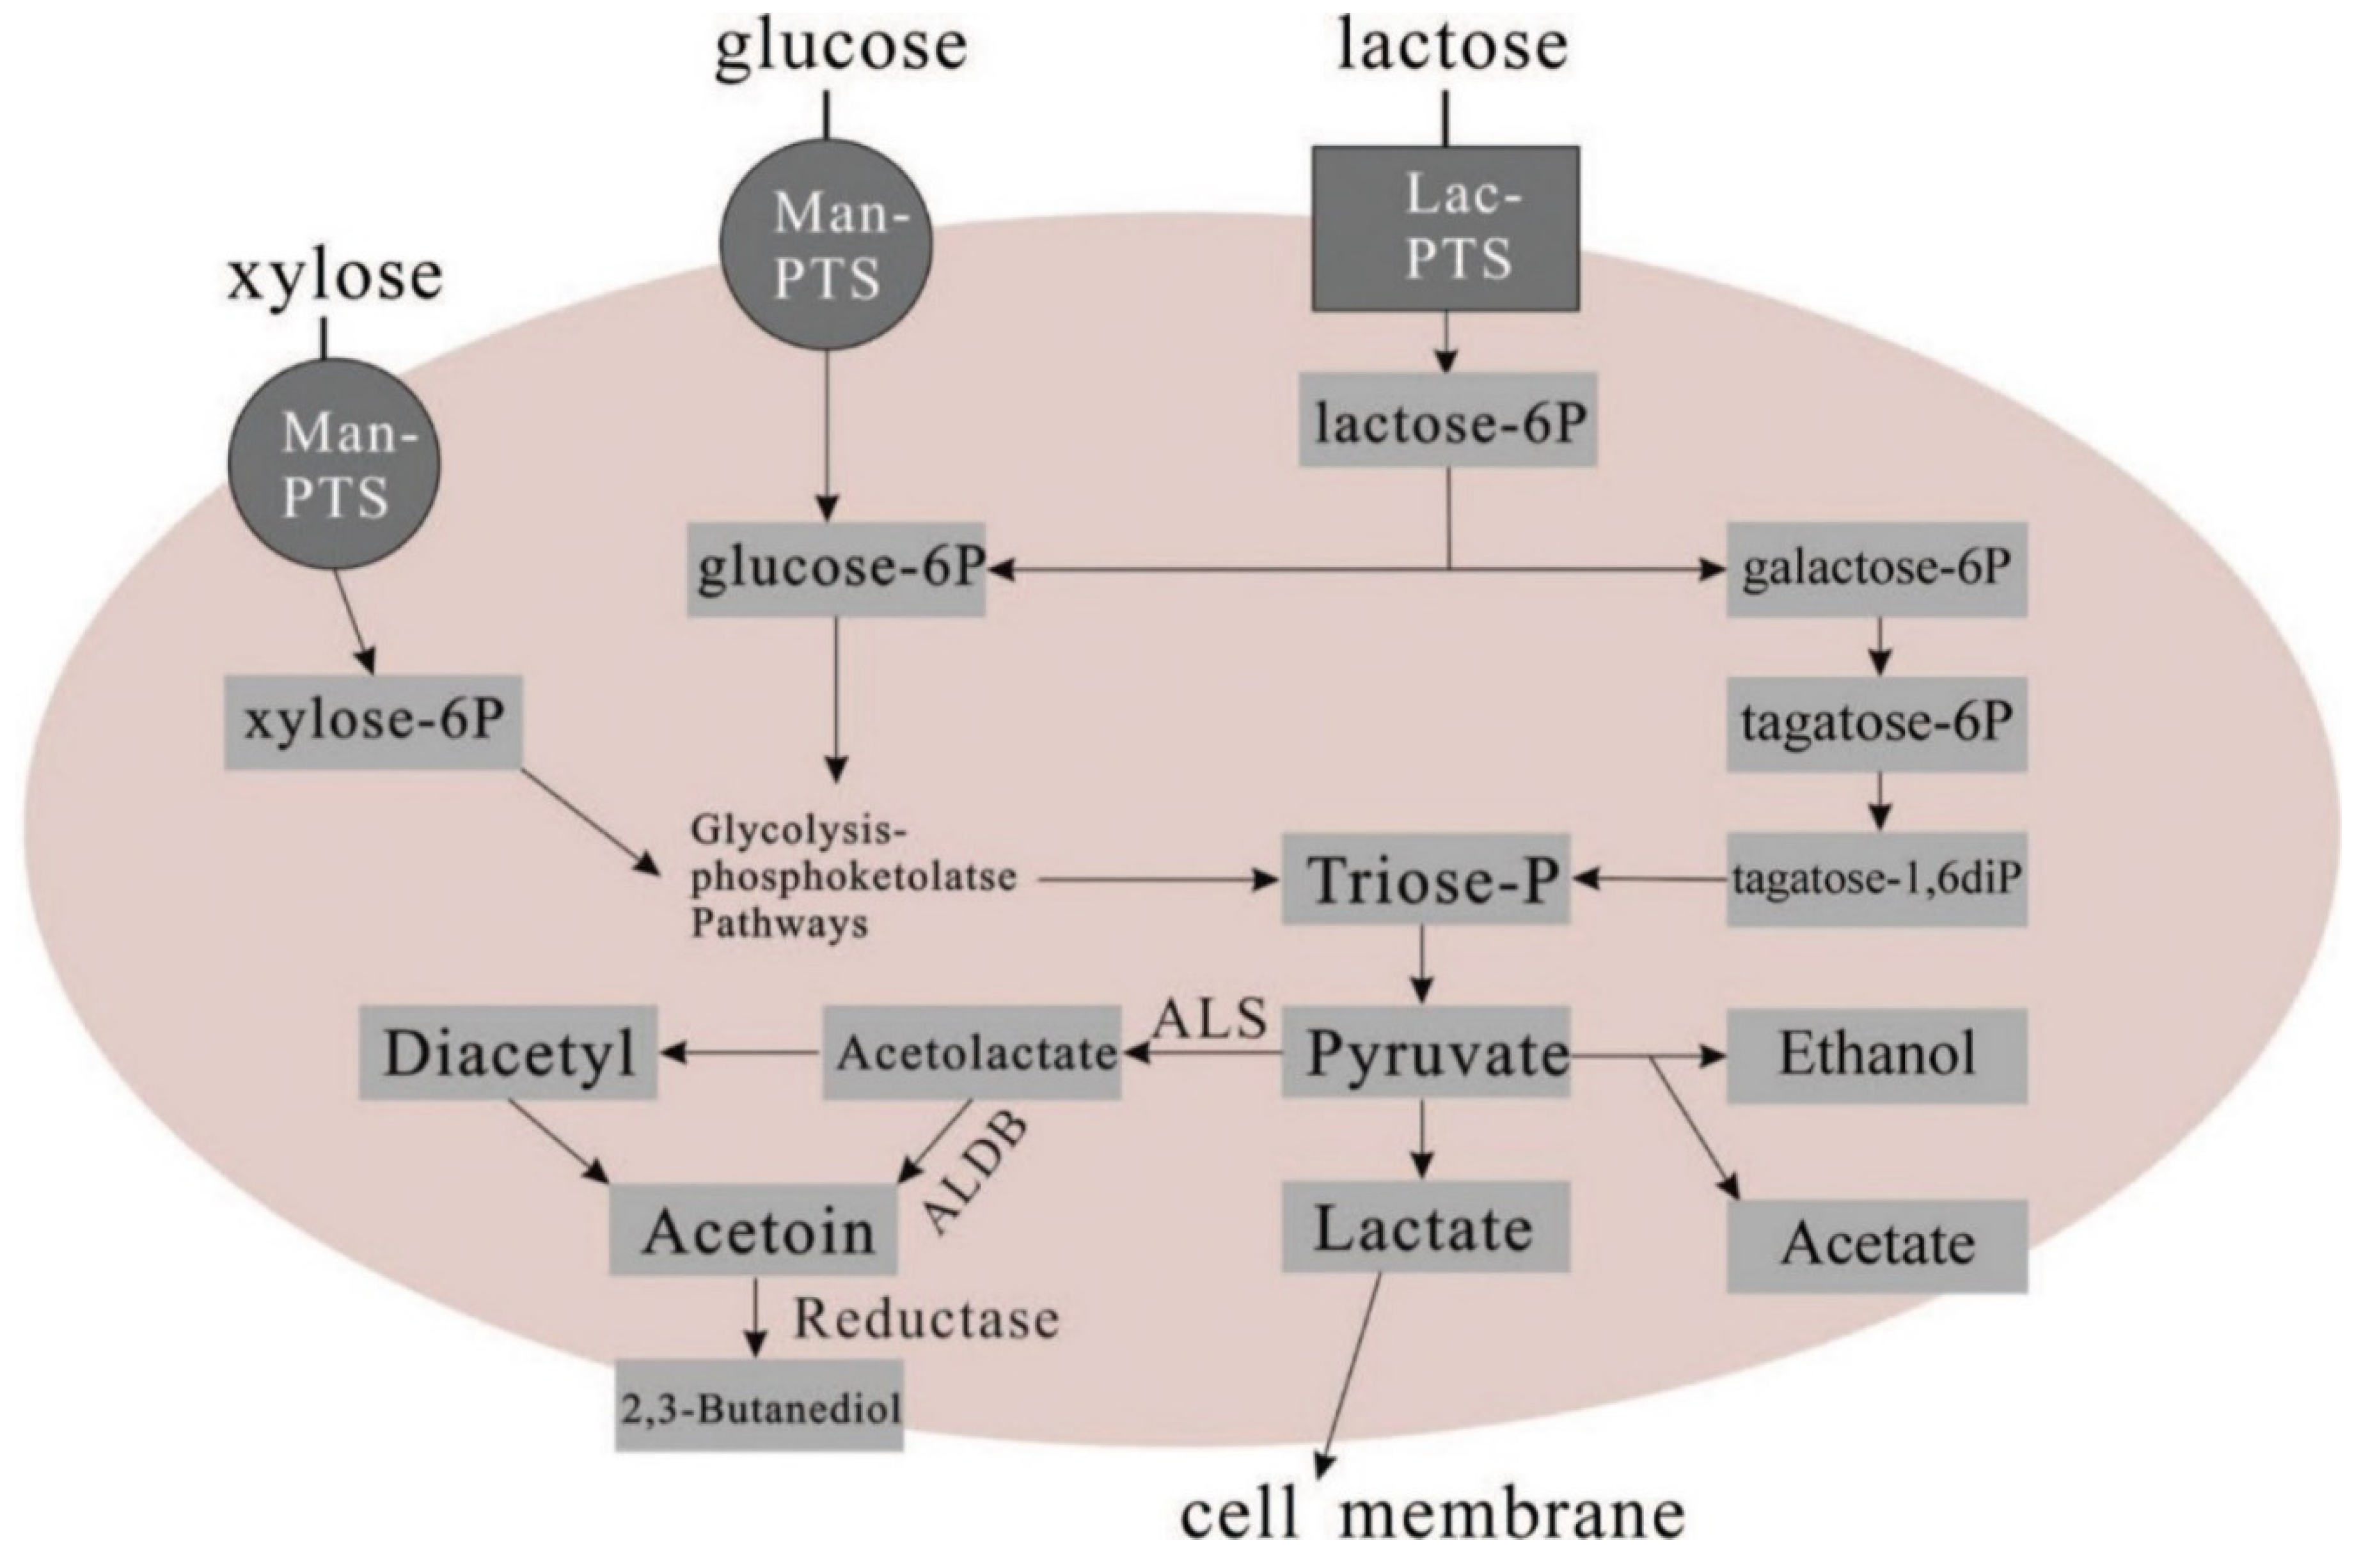
Figure 6.
Schematic diagram of IoT E-nose system [172].
Figure 6.
Schematic diagram of IoT E-nose system [172].

Figure 7.
VOC profiles of fermented Mandarin fish samples [196].
Figure 7.
VOC profiles of fermented Mandarin fish samples [196].

Table 1.
The E-nose for alcoholic fermentation.
| Time | Country | Local Name (Objectives) | Type of E-nose (Pattern Recognition) | Target VOCs | Ref. |
|---|---|---|---|---|---|
| Fermented cereal and grain products | |||||
| 2014 | Thailand | Draft beer (To monitor the draft beer fermentation process) | 7 MOS Model: Lab-made E-nose (PCA) | General combustible, alcohol, natural, methane, LPG, propane, carbon monoxide, air contaminants | [139] |
| 2019 | Brazil | Beer (To detect the alcohol content of beers) | 13 MOS Model: Lab-made E-nose (MLR, ELM, RF, MNLR) | Ethanol, propane, butane, methane, isobutane, benzene, NH3, toluene, CH4, hexane, LPG, CO, H2, H2S, methyl mercaptan, trimethylamine | [127] |
| 2020 | Australia | Beer (To assess beer quality) | 9 MOS Model: Lab-made E-nose (ANN) | Ethanol, methane, carbon monoxide, hydrogen, hydrogen sulfide, ammonia, benzene/alcohol/ammonia, carbon dioxide | [140] |
| 2021 | Australia | Beer (To detect beer faults in the brewing process) | 9 MOS Model: Lab-made E-nose (ANN) | Alcohol, methane (CH4), carbon monoxide (CO), hydrogen (H2), ammonia/alcohol/benzene, hydrogen sulfide (H2S), ammonia, carbon dioxide (CO2) | [60] |
| 2014 | Korea | Korean rice wine (makgeolli) (To detect volatile compounds from initial amino acid profiles in Korean rice wine (makgeolli) model) | MS-EN Model: SMart Nose 300 (PCA, PLSR) | Isobutanol, isoamyl alcohol, 2-methyl butanol, 2-phenylethanol, isobutyl acetate, isoamyl acetate, 2-methylbutyl acetate, 2-phenylethyl acetate, ethyl caproate, ethyl caprylate, ethyl caprate | [135] |
| 2016 | Brazil | Spirit beverages (To classify odors from alcoholic beverages, as well as butanol and methanol vapors) | 5 MOS Model: Lab-made E-nose (PCA, MLP, SOM, CA) | Aguardiente, butanol, tequilas, vodkas, whiskey, methanol | [141] |
| 2016 | Poland | Spirit beverages (To discriminate raw spirits, vodkas and whisky samples) | Fast GC e-nose Model: Alpha MOS (PCA, DFA, SIMCA) | tert-Butylmethylether, ethyl acetate, 2-methyl-1-butanol, 2-methyl-1- propanol, n-butanol, 2,3-pentanedione, methyl butanoate, pentanol, 1-hexanol, (Z)-4-heptenal | [136] |
| 2017 | Poland | Whisky (To analyze and evaluate type of whisky) | MOS Model: Alpha MOS (PLS-DA) | 2-Propanol, n-butanol, furfural, ethyl isovalerate, alpha-pinene, decanal, eugenol, geosmin, gamma-decalactone, 12-methyltridecanal | [138] |
| 2006 | India | Bread (To cluster bread odor data according to the state of freshness of bread) | 4 MOS Model: Lab-made E-nose (SOM network) | Methane, butane, propane, alcohol, toluene, xylene, LP-gas/propane, CO, CO2, H | [132] |
| 2019 | Italy | Bakery products (To investigate the volatilome of different bakery products, obtained from mature and immature grains and transformed by sourdough) | 10 MOS Model: PEN2 (CAP analysis) | Ethyl alcohol, 3-hydroxy-2-butanone, acetic acid, octanoic acid, heptanoic acid, 3-methyl butanoic acid, heptanal, acetophenone, ethylbenzene, 2-methyl-3-decen-5-one, 2,4-bis (1-methylethyl) phenol, heptanal | [131] |
| 2019 | China | Sourdough-based Chinese steamed bread (To identify a key aroma compound in type I sourdough-based Chinese steamed bread) | 14 MOS Model: ISENSO INTELLIGENT (PCA, PLS-DA) | Ethyl acetate (fruity), ethyl lactate (caramel-like), hexyl acetate (fruity), (E)-2-nonenal (fatty) and 2-pentylfuran (fruity), acetic acid, 2-methyl-1-propanol, ethanol, 1-pentanol, pentanal, (E)-2-octenal, hexanal | [129] |
| 2020 | Iran | Sourdough (To investigate effective variables to produce desirable aroma in sourdough) | 6 MOS Model: Lab-made E-nose (LSD test) | Alcohol, LPG, natural gas, carbon monoxide, ammonia, sulfide, benzene, H2S, toluene, acetone, hydrogen | [130] |
| 2020 | Poland | Bread (To test the suitability of bread for consumption during four-day storage) | 8 MOS Model: Lab-made E-nose (PCA) | Ketones, acids, aromatic comp., terpenoids, sulfur comp., esters, alcohols, hydrocarbons | [133] |
| Fermented fruit products | |||||
| 2008 | Australia | Wine (To predict red wine spoilage) | 12 MOS Model: FOX-3000, Alpha MOS (PLS regression, RMSECV) | Ethanol, 3-methylbutanol, 4-ethylphenol, 4-ethylguaiacol | [128] |
| 2012 | Spain | Wine (To identify the aging of red wines) | 9 MOS Model: Lab-made E-nose (PCA, Tucker3 analysis) | 2-Furaldehyde, guaiacol, eugenol, cis- and trans-whiskeylactone | [134] |
| 2021 | Australia | Wine (To assess volatile aromatic compounds in smoke-taintedcabernet sauvignon wines) | 9 MOS Model: Lab-made E-nose (LSD, PCA, ANN) | Ethanol, methane, carbon monoxide, hydrogen sulfide, ammonia, alcohol, benzene, carbon dioxide, hydrogen | [142] |
| 2021 | Australia | Wine (To detect smoke taint in Pinot Grigio wines) | 9 MOS Model: Lab-made E-nose (LSD, PCA, ANN) | Ammonia, alcohol, benzene, carbon dioxide, hydrogen, ethanol, methane, carbon monoxide, hydrogen sulfide, | [61] |
| 2022 | Australia | Wine (To assess and classify flaws and faults in wine) | 9 MOS Model: Lab-made E-nose (HSD, SE) | Alcohol, methane, hydrogen, ammonia, benzene, carbon dioxide, hydrogen sulfide | [143] |
Table 2.
E-noses for lactic acid fermentation.
| Time | Country | Local Name (Objectives) | Type of E-nose (Pattern Recognition) | Target VOCs | Ref. |
|---|---|---|---|---|---|
| Fermented milk products | |||||
| 2003 | USA | Cheddar cheese (To evaluate the differentiation of aged Cheddar cheese aroma) | E-nose based on GC (Kenner, LA, USA) Model: Lab-made E-nose (CA, PCA) | 4-Mercapto-4-methyl-pentan-2-one | [149] |
| 2005 | Denmark | Danish blue cheese (To detect the ripening of Danish blue cheese) | 12 MOS Model: FOX-3000, Alpha MOS (PCA, PLS-R) | 2-Methyl ketones, benzaldehyde, 3-methyl-butanal, 2-hexanol | [151] |
| 2014 | China | Yogurt (To analyze stirred yogurt with cheddar cheese added to milk) | 18 MOS Model: FOX-4000, Alpha MOS (PCA) | Pentanal, dimethyl trisulfide, ethyl butanoate, methanethiol, dimethyl disulfide | [152] |
| 2019 | Slovakia | Slovak cheese (To characterize steamed cheese and assess quality decay of steamed cheese during storage) | E-nose with two FID detectors Model: Heracles II, Alpha M.O.S. (PCA) | Acetaldehyde, 1-propanal, propanoic acid, ethyl hexanoate, furfural, butan-2-one, isovaleric acid, 1-hexanol or α-pinene | [150] |
| 2020 | China | Yogurt (To detect unsatisfactory products for the quality control of yogurt) | 18 MOS Model: FOX-4000, Alpha MOS (PCA, BPNN, RF) | Satisfactorily favored yogurt samples and three subsets of yogurt samples with unsatisfactory favors (cooked, lack of yogurt favor, vinegarish) | [153] |
| 2020 | Hungary | Milk (To monitor odor changes during milk fermentation with Lactobacillus species) | Heracles GC e-nose Model: Heracles Neo 300 ultra-fast GC analyzer (LDA, ANOVA tests, Tukey HSD test) | 2-octanol (expressing fatty or oily aroma), decane (sweet aroma), 2,4-heptadienal (fatty aroma), compound of pyridine, 2-pentyl (fatty and tallowy aroma) | [148] |
| 2020 | Slovakia | Parenica cheese (To investigate the quality of smoked and unsmoked Parenica cheeses after seven days of storage) | GC-FID e-nose Model: Heracles II; Alpha M.O.S. (PCA) | Carboxylic acids, alcohols, aldehydes, ketones, esters, sulfur compounds, furans/furanones, phenols, terpenes | [166] |
| 2021 | Japan | Cheese (To classify cheese types, production areas and cheese ages) | POLFA odor sensor Model: POLFA, Karumoa Co., Ltd. (Tukey’s HSD test) | VOCs from five kinds of processed cheeses (two types of normal processed cheese, one type containing aged cheese, two types containing blue cheese, one type of natural cheese) | [106] |
| 2022 | Palestine | White fresh soft cheese (To identify and quantify four yeast species in white fresh soft cheese) | 8 MOS Model: Lab-made E-nose (PCA, PLS) | Four species of yeast (Pichia anomala, Pichia kluyveri, Hanseniaspora uvarum, and Debaryomyces hansenii) | [147] |
| Fermented meat products | |||||
| 2003 | Italy | Salami (To analyze and discriminate different Mediterranean salami) | 5 sensors based on SnO2 sol–gel thin films Model: Lab-made E-nose (PCA) | β-Pinene, α-pinene, limonene, hexanal, benzaldehyde, 1-hexanol, 2-ethyl, 2-heptanone | [159] |
| 2017 | China | Chinese-style sausage (To evaluate lipid oxidation of Chinese-style sausage during processing and storage) | 10 MOS Model: PEN3 (SVM, ANN, HCA) | Aromatic compounds, nitrogen oxides, ammonia, benzene, hydrogen, methane, sulfur compound, alcohols | [155] |
| 2021 | China | Ningxiang pork (To detect flavor substances in Ningxiang pork) | 10 MOS Model: PEN3 (PCA, LDA) | Aldehydes, alcohols, ketones, olefins, nitrogen oxides, methyl compounds, aldol, sulfur compounds, aromatic hydrocarbons | [156] |
| 2021 | China | Dry fermented sausage (To detect the flavor profiles of dry fermented sausages with different NaCl substitutes) | 10 MOS Model: PEN3 (PCA, HCA) | Aldehydes, ketones, alcohols, acids, esters, terpenes | [157] |
| 2021 | China | Harbin red sausages (To study volatile profiles and taste properties of Harbin red sausages prepared with traditional and conventional processing methods) | 10 MOS Model: PEN3 (PCA, PLS) | Hexanol, furfuryl alcohol, hexanal, furfural, 5-methyl furfural, 2-methyl-2-cyclopenten-1-one, 3-methyl-2-cyclopenten-1-one, 3-ethyl-2-hydroxy-2-cyclopenten-1-one, 1-indanone, guaiacol, 2-methoxy-4-methylphenol, 2,3,5-trimethyphenol, o-cresol, 4-ethyl-2-methoxyphenol, 2,5-dimethylphenol, 2,4-dimethylphenol, 2-methoxy-4-propylphenol, octane, naphthalene, heptanoic acid, 1-octen-3-ol, 2-nonanone, methyl 2-furoate | [158] |
| Fermented vegetable products | |||||
| 2021 | China | Zha-chili (To detect the bacterial diversity during fermentation process and flavor quality of zha-chili samples) | 10 MOS Model: PEN3 (PCA, PCoA, CA, ANOSIM) | Ammonia, aromatic compounds, aldehydes, ketones, methane, sulfur compounds, terpenes, organic sulfur compounds, alcohols, ketones | [161] |
| 2021 | Spain | Green olives (To assess abnormal fermentation defects of Spanish-style table olives) | 11 MOS Model: Lab-made E-nose (PCA, PLS-DA) | VOCs from five types of table olives (control, zapateria, putrid, butyric and musty), carboxylic acids, alcohols, phenols, esters | [162] |
| 2021 | Korea | Kimchi (To classify geographical origin of kimchi by volatile compound analysis) | Smart Nose SA, Marin-Epagnier, Switzerland Model: Lab-made E-nose (PCA, DFA) | Total of 69 kinds of kimchi samples (Korean and Chinese kimchi) | [164] |
| 2021 | China | Chinese northeast sauerkraut (To investigate lactic acid bacteria for fermentation of Chinese northeast sauerkraut) | 10 MOS Model: PEN3 (PCA, HCA) | 2-Ethylhexanol, 3,5-dimethylbenzaldehyde, 3,5-ditert-butylphenol, alcohols (2-nonanol, 2-heptanol), esters (ethyl crotonate, ethyl butanoate, ethyl lactate, ethylhexanoate, ethyl 3-phenylpropanoate and ethyl acetate), terpenes (geraniol, nerolidol, dihydrocarveol), polyphenols, nitriles, lactones, isobutanol, methyl acetate, 2-methylpentaldehyde | [163] |
| 2021 | China | Tremella aurantialba (To detect saponin in submerged fermentation with Tremellaaurantialba (T. aurantialba)) | 8 MOS Model: Lab-made E-nose (PLSR) | Saponin compounds, aldehydes, esters, alcohols, heterocyclic, aromatic compounds, ketones | [165] |
Table 3.
E-noses for acetic acid fermentation.
| Time | Country | Local Name (Objectives) | Type of E-nose (Pattern Recognition) | Target VOCs | Refs. |
|---|---|---|---|---|---|
| Fermented fruits products | |||||
| 2006 | China | Chinese vinegars (To establish a gas-sensing fingerprint database of Chinese vinegars for quality control) | Nine nano ZnO thick film gas sensors Model: Lab-made E-nose (PCA, CA, LVQ) | Acetic acid and vinegar samples (aromatic vinegar, mature vinegar, rice vinegar, white vinegar, fruit vinegar) | [168] |
| 2008 | China | Chinese vinegars (To establish a gas-sensing fingerprint database of Chinese vinegars and identify them individually for their quality control) | Nine doped nano-ZnO thick film gas sensors Model: Lab-made E-nose (BP-ANNs, KNN) | Aromatic vinegar (Hengshun Xiangcu, Beigushan Xiangcu, Yanhui Xiangcu, Jinyou Xiangcu, ZhengjiangXiangcu, Longmen Xiangcu and Weichunyun Xiangcu), maturevinegar (Shuita Chencu, Donghu Chencu, Beigushan Chencu, Zhengjiang Chencu and Weichunyuan Chencu), Rice vinegar (Jinbiao Micu and Longmen Micu), white vinegar (Meiweixia Baicu and Longmen Baicu), fruit vinegar (Haitian Pingguocu) | [169] |
| 2012 | China | Vinegar (To identify vinegar online) | 6 MOS Model: Lab-made E-nose (RBF, K-means) | Five kinds of Chinese vinegar (vinegarriver white city, river city rice vinegar, Liubiju vinegar, apple vinegar, Zilin old vinegar | [174] |
| 2013 | Korea | Cider vinegars (To determine the volatile profiles of cider vinegars) | Surface acoustic wave (SAW) sensor Model: zNose (PCA) | Acetic acid, ethyl alcohol, 1-hexanol, furfural, benzaldehyde, ethyl acetate, n-butyl acetate, isobutyl acetate, isoamyl acetate, hexyl acetate | [170] |
| 2014 | China | Vinegar (To evaluate the aroma of vinegars and control their quality) | 10 MOS Model: PEN3 (La, LDA, PCA) | Volatile components in vinegars (acids, esters, aromatics compounds, alcohols, sulfur compounds, alkenes) | [173] |
| 2016 | Korea | Vinegar (To discriminate aged vinegars based on taste and aroma profiles) | MS-E-nose Model: SMart Nose300; Alpha M.O.S. (PCA) | Aroma profiles of aged vinegars (Chinese Shanxi extra-aged vinegar, Japanese black vinegar, Italian balsamic vinegar) | [177] |
| 2017 | China | Vinegar (To discriminate different flavors of vinegar) | 8 MOS Model: Lab-made E-nose (PCA, LDA, MLP) | Five different flavors of vinegar (white vinegar, mature vinegar, rice vinegar, balsamic vinegar and apple vinegar) | [171] |
| 2020 | China | Chinese vinegar (To identify Chinese vinegar varieties) | 10 MOS Model: Lab-made E-nose (PCA, SNV, LDA, KNN) | VOCs from five different kinds of Chinese vinegars (Zhenjiangxiangcu, Zhenjiangchencu, Baoningcu, Hengshunxiangcu and Shanxichencu) | [175] |
| 2021 | China | Zhenjiang aromatic vinegar (To differentiate different grades of Zhenjiang aromatic vinegar (ZAV)) | 10 MOS Model: PEN3 (PCA, PLS-DA) | Furfural, acetic acid, tetramethylpyrazine, phenethyl acetate, phenylethyl alcohol, acetic acid, isobutyric acid, ethyl phenylacetate, 3-hydroxy-2-butanone, 2,3-butanedione, 2-acetylfuran | [176] |
| Fermented herb products | |||||
| 2011 | China | Green tea (To discriminate the green tea quality) | 8 MOS Model: Lab-made E-nose (PCA, KNN, ANN) | Hexenols, pentanal, hexanol, pinene | [182] |
| 2014 | Italy | Chinese teas (To discriminate the tealeaf quality) | 10 MOS Model: Win Muster v.16 (PCA, CA, LSD) | Aromatic compounds, broad-range compounds, polar compounds, nitrogen oxides and ozone, ammonia, aromatic compounds, aldehydes, ketones, hydrogen, alkanes, less polar compounds, methane, sulfur compounds, terpenes, alcohols | [183] |
| 2016 | China | Pu-erh teas (To discriminate two types of Pu-erh teas) | 12 MOS Model: Agrinose (PCA) | Alcohol, methoxyphenlic compounds, | [137] |
| 2018 | Turkey | Black tea (To monitor the quality control in black tea during fermentation process) | 13 MOS Model: Lab-made E-nose (LDA, Bayes, KNN-3 methods) | (E)-2-hexenal, hexenal, (E)-geraniol, linalool, linalool oxide II (cis, furanoid), benzeneacetaldehyde, linalool oxide I (trans, furanoid), 3,7-dimethyl-1,5,7-octatrien-3-ol, benzaldehyde, methyl salicylate | [178,179] |
| 2019 | China | Chinese liquors (To discriminate Chinese liquors) | 10 MOS Model: Lab-made E-nose (FDPCA, DPCA, PCA, KNN) | Six types of Chinese liquors (Maotai, Gujinggongjiu, Yingjiagongjiu, Haizhilan, Fenjiu, Kouzijiao) | [184] |
| 2022 | Sri Lanka | Sri Lankan tea (To monitor the fermentation process of Sri Lankan low-country tea) | 4 MOS Model: Digi-Nose (PCA, SVM) | Diethyl phthalate, dimethyl phthalate, Diisononyl phthalate, 2-hydroxyisobutyric acid, 3-penten-2-ol | [89,180] |
Table 4.
E-noses for alkaline fermentation.
| Time | Country | Local Name (Objectives) | Type of E-nose (Pattern Recognition) | Target VOCs | Ref. |
|---|---|---|---|---|---|
| Fermented fish products | |||||
| 2009 | China | Fermented fish (To analyze traditional fermented fish flavor) | 18 MOS Model: FOX-4000, Alpha MOS (PCA, SQC) | VOCs from traditional fermented fish | [195] |
| 2014 | Thailand | Fish sauce (To classify fish sauce based on the level of total nitrogen content) | 6 MOS Model: Lab-made E-nose (PCA, LVQ) | Nitrogen content from fish sauce | [197] |
| 2018 | Japan | Fish sauce (To classify different smells from 46 commercially available fish sauce products) | 18 MOS Model: FOX-4000, Alpha MOS (CA) | VOCs from 46 fish sauce products in several countries (Japan, Thailand, Vietnam, China, Philippines, Italy) | [198] |
| 2021 | China | Chinese fermented Mandarin fish (To establish the volatile fingerprint of fermented mandarin fish at different fermentation stages) | 18 MOS Model: FOX-4000, Alpha MOS (PCA, PLS-DA, HCA) | Hexanal-D, nonanal, limonene | [196] |
| Fermented legumes products | |||||
| 2018 | Indonesia | Tempeh (To monitor the fermentation process of tempeh) | 8 MOS Model: Lab-made E-nose (PCA, LDA, SVM, KNN) | CO, methane, ethanol, propane, isobutane, hydrogen, ethanol, ammonia, ethanol, toluene, hydrogen sulfide | [190] |
| 2017 | Korea | Soy sauce (To analyze ethanol content in soy sauce for halal food certification) | Model: Smart Nose 300 (DFA) | Ethanol in 24 different kinds of soy sauce | [188] |
| 2017 | Korea | Soybean paste (To investigate the sensory profiling of fermented soybean paste (doenjang)) | Model: Heracles II, Alpha MOS (PCA) | Ethanol, ethyl acetate, ethyl iso-butyrate, pyridine, ethyl 2-methylbutyrate, 1-hydroxy-2-propanone, 1-penten-3-one, 2-ethylfuran, ethyl furan, ethyl butyrate, ethyl isovalerate, 2-methyl-1-butano | [189] |
| 2019 | USA | Soybean (To determine the quantity and quality of volatile compounds in soybean varieties) | Model: HERCALES GC Flash electronic nose (PCA) | Ethyl-2-methyl butyrate, 2-methyl propanal, 2-propanol | [191] |
| 2022 | China | Chinese soybean paste (To select Chinese soybean paste based on flavor profiles) | Model: HS-SPME-GC/MS with E-nose (LDA, PLSR, SVR) | Esters, total acids, reducing sugar, salinity, amino acid nitrogen | [192] |
Publisher’s Note: MDPI stays neutral with regard to jurisdictional claims in published maps and institutional affiliations. |
© 2022 by the authors. Licensee MDPI, Basel, Switzerland. This article is an open access article distributed under the terms and conditions of the Creative Commons Attribution (CC BY) license (https://creativecommons.org/licenses/by/4.0/).
Share and Cite
MDPI and ACS Style
Seesaard, T.; Wongchoosuk, C. Recent Progress in Electronic Noses for Fermented Foods and Beverages Applications. Fermentation 2022, 8, 302. https://doi.org/10.3390/fermentation8070302
AMA Style
Seesaard T, Wongchoosuk C. Recent Progress in Electronic Noses for Fermented Foods and Beverages Applications. Fermentation. 2022; 8(7):302. https://doi.org/10.3390/fermentation8070302
Chicago/Turabian StyleSeesaard, Thara, and Chatchawal Wongchoosuk. 2022. "Recent Progress in Electronic Noses for Fermented Foods and Beverages Applications" Fermentation 8, no. 7: 302. https://doi.org/10.3390/fermentation8070302
Note that from the first issue of 2016, this journal uses article numbers instead of page numbers. See further details here.