Article

Glycerol Utilization as a Sole Carbon Source Disrupts the Membrane Architecture and Solventogenesis in Clostridium beijerinckii NCIMB 8052

Fermentation Science and Metabolic Engineering Group, Department of Food Science, Babcock Hall, University of Wisconsin-Madison, 1605 Linden Drive, Madison, WI 53706, USA
*
Author to whom correspondence should be addressed.
Fermentation 2022, 8(7), 339; https://doi.org/10.3390/fermentation8070339
Submission received: 9 June 2022 / Revised: 8 July 2022 / Accepted: 13 July 2022 / Published: 19 July 2022
(This article belongs to the Section Microbial Metabolism, Physiology & Genetics)

Abstract

:
Efficient bioconversion of abundant waste glycerol to value-added chemicals calls for a wider range of fermentative workhorses that can catabolize glycerol. In this study, we used quantitative gene expression and solvent profiling, qualitative metabolite analysis, and enzyme activity assays to investigate the factors that limit glycerol utilization as a sole carbon source by Clostridium beijerinckii NCIMB 8052. C. beijerinckii NCIMB 8052 did not produce acetate, acetone and butanol on glycerol. Congruently, the genes encoding the coenzyme A transferase subunits (ctfAB) and bifunctional acetaldehyde-CoA/alcohol dehydrogenase (adhE) were down-regulated up to 135- and 21-fold, respectively, at 12 h in glycerol-grown cells compared to glucose-grown cells. Conversely, NADH-dependent butanol dehydrogenase A (bdhA) was upregulated 2-fold. Glycerol dehydrogenase (gldA) and dihydroxyacetone kinase (subunit dhaK) were upregulated up to 5- and 881-fold, respectively. Glyceraldehyde-3-phosphate dehydrogenase (gapdh) showed mostly similar expression profiles at 12 h on glucose and glycerol. At 24 h, gapdh was downregulated 1.5-fold, while NADP+-dependent gapdh was upregulated up to 1.9-fold. Glycerol-grown cells showed higher or similar activity profiles for all solventogenic enzymes studied, compared to glucose-grown cells. Butyraldehyde (3 g/L) supplementation led to the production of ~0.1 g/L butanol, whilst butyrate (3.5 g/L) supplementation produced 0.7 and 0.5 g/L acetone and butanol, respectively, with glycerol. Further, the long chain saturated fatty acids cyclopentaneundecanoic acid, methyl ester and hexadecanoic acid, butyl ester were detected in glucose- but not in glycerol-grown cells. Collectively, growth on glycerol appears to disrupt synthesis of saturated long chain fatty acids, as well as solventogenesis in C. beijerinckii NCIMB 8052.

1. Introduction

Due to its availability and low cost, glycerol represents an attractive feedstock for largescale fermentative production of fuels and chemicals [1,2,3,4,5]. Whereas glucose—the predominant feedstock in fermentative biomanufacturing—sells for up to $3.37/kg [6], crude glycerol (80–90% purity) sells for $0.00 to $0.11/kg [7,8]. Glycerol glut stemming from the expanding biodiesel industry accounts for the low cost of glycerol [1,2,3,4,5,6,7,8,9,10]. During biodiesel production, 45.4 kg of fats and oils generate 4.54 kg of waste glycerol [1,2]. In theory, the higher degree of reduction of the carbon atoms in glycerol (κ = 4.67 as opposed to 4.0 for each of glucose and xylose) makes glycerol an ideal substrate for fermentative production of reduced chemicals [1,3]. However, to date, only a narrow group of microorganisms has been shown to efficiently ferment glycerol to target products under anaerobic condition. This is largely because the catabolism of one molecule of glycerol generates double the amount of reducing equivalents (NADH) produced by the catabolism of one molecule of glucose [1,3,4,11,12]. Consequently, efficient glycerol catabolism under anaerobic condition requires an additional electron acceptor to re-oxidize the resulting excess reducing equivalents (i.e., NADH; [1,13]). As a result, expanding the range of fermentative organisms that can efficiently convert glycerol to a wider range of bio-derived chemicals is an important prerequisite for the successful establishment of a glycerol-based biorefinery—either as a single feedstock or in combination with lignocellulosic sugars.
Butanol is an important industrial bulk chemical, which also has excellent characteristics as a fuel. In addition to fossil-derived butanol, obligately anaerobic Gram-positive solventogenic Clostridium species also produce butanol. Despite its enormous potential, largescale bio-production of butanol remains elusive largely due to higher operating costs and low yield, when compared to fossil-derived butanol. Thus, a glycerol-based process has the potential to reduce the cost of producing butanol via acetone-butanol-ethanol (ABE) fermentation. Previously, we showed that a mixture of glucose and glycerol (1:1 molar ratio) enhanced butanol production by Clostridium beijerinckii NCIMB 8052 (hereafter referred to as C. beijerinckii) in the presence of furfural, by tethering the excess NADH resulting from glycerol catabolism to furfural reduction [4]. Furfural is the major inhibitory compound produced during the pretreatment of a lignocellulosic biomass [4,14,15,16]. However, in the glucose-glycerol mixture, 20 g/L glycerol remained in the medium post fermentation, which renders this approach economically unfeasible for co-fermentation of glycerol and lignocellulosic sugars to butanol by C. beijerinckii. High residual glycerol in the medium after fermentation is as a result of the inability of C. beijerinckii to utilize glycerol as a sole carbon source, even though the genome contains the full repertoire of glycerol catabolic genes. Consequently, when C. beijerinckii is grown in glucose–glycerol mixture, upon glucose depletion, glycerol metabolism ceases. Therefore, understanding the basis for the inability of C. beijerinckii to utilize glycerol as a sole carbon source is central to engineering this fermentative workhorse to metabolize glycerol to butanol. In fact, Clostridium acetobutylicum ATCC 824 and C. beijerinckii (NCIMB 8052), which are the model microorganisms for studying the ABE pathway do not efficiently utilize glycerol as a sole carbon source, and to date, there is no study detailing the behavior of C. beijerinckii (NCIMB 8052) on glycerol as a sole carbon source. Although Clostridium pasteurianum can utilize glycerol as a sole carbon source, butanol yield is lower than the concentrations produced on glucose [2]. Furthermore, butanol production by C. pasteurianum on glycerol is accompanied by 1,3-propanediol (1,3-PDO), in addition to acetone, ethanol, acetate and butyrate [2]. As a result, the cost of recovering low amounts of butanol from such a complex broth is not economically feasible.
Because of the reduced nature of glycerol, most microorganisms capable of anaerobic glycerol utilization as a sole carbon source produce 1,3-PDO and/or 1,2-propanediol (1,2-PDO), both of which are more reduced than glycerol, thereby, providing a metabolic outlet for redox balance [1,17,18]. Consequently, the ability to produce 1,2-PDO and/or 1,3-PDO was long considered the basis for glycerol utilization as a sole carbon source under anaerobic condition [1,17,18]. However, recently, Xin et al. [2] showed that Clostridium sp. strain CT7 efficiently utilizes both refined and crude glycerol as a sole carbon source to produce butanol under anaerobic conditions, without concomitant production of 1,2-PDO or 1,3-PDO. Moreover, we have engineered a constitutive 1,2-PDO biosynthetic pathway in C. beijerinckii (unpublished data), with a view to establishing an artificial outlet for NADH re-oxidation during growth on glycerol as a sole carbon source. However, this did not abolish the inability of this organism to utilize glycerol as a sole carbon source. Further, cloning and expressing genes encoding the glycerol catabolic enzymes of C. pasteurianum [glycerol dehydrogenases (dhaD1 and gldA1) and dihydroxyacetone kinase] in C. beijerinckii failed to engender glycerol catabolism as a sole carbon source by this organism [19]. These findings, therefore, suggest that additional roadblocks to glycerol metabolism (beyond the inability to achieve redox balance via biosynthesis of 1,2-PDO or 1,3-PDO) exist in C. beijerinckii. Towards unravelling the mechanisms that account for the inability of C. beijerinckii to utilize glycerol as a sole carbon source, in this study, we (a) conducted a detailed investigation of the solvent profiles of C. beijerinckii grown on glycerol as a sole carbon source (relative to glucose-grown cultures), (b) profiled the activities and expression levels of important glycerol catabolic and ABE enzymes and genes in glycerol-grown cultures, (c) assessed the likelihood of using artificially supplied external electron acceptors in the forms of furfural and butyraldehyde to overcome likely redox imbalance in glycerol-grown cultures, and (d) evaluated whether accumulation of toxic metabolic intermediates such as 3-hydroxypropionaldehyde or methylglyoxal in glycerol-grown cells might account for the poor growth of C. beijerinckii on glycerol as a sole carbon source.

2. Materials and Methods

2.1. Microorganisms and Culture Conditions

Clostridium beijerinckii NCIMB 8052 was procured from the American Type Culture Collection (Manassas, VA, USA). Clostridium beijerinckii was maintained in the laboratory as spore suspensions in sterile double-distilled water at 4 °C. All cultures were grown at 35 ± 1 °C in an anaerobic chamber (Coy Laboratory Products Inc., Grass Lake, MI, USA) with a modified atmosphere of 82% N2, 15% CO2, and 3% H2. The preculture was grown in a tryptone-glucose-yeast extract (TGY) broth containing 30, 20, and 10 g/L tryptone, glucose, and yeast extract, respectively. To inoculate TGY, a total of 2 mL of spore suspension (200 μL in each 1.5 mL tube) was heat-shocked at 75 °C for 10 min in a compact digital dry bath/block heater (ThermoFisher Scientific, Waltham, MA, USA), cooled on ice for 3 min, and then inoculated into 100 mL of TGY broth, which was then grown overnight. After 12 h, the fermentation medium was inoculated with the preculture (6%, v/v; [20]). Fermentation was conducted in a P2 medium (100 mL) containing 60 g/L glycerol or glucose (as a control where appropriate) and yeast extract (1 g/L) in loosely capped 250-mL Pyrex culture bottles. The P2 medium was supplemented with 1 mL each of pre-filter-sterilized mineral, buffer and vitamin stocks. The buffer stock comprised of (in g/L): K2HPO4 (50), KH2PO4 (50) and ammonium acetate (220), whereas the mineral stock contained (in g/L): MgSO4·7H2O (20) MnSO4·H2O (1), FeSO4·7H2O (1), and NaCl (1). The vitamin stock contained (in g/L): p-amino-benzoic acid (0.1), thiamine (0.1), and biotin (0.001).
To determine if stresses stemming from the accumulation of the toxic metabolic intermediates 3-hydroxypropionaldehyde and/or methylglyoxal [12,21,22,23,24,25,26,27,28,29] might account for the poor growth of C. beijerinckii on glycerol as a sole carbon source, gas chromatography-mass spectrometry (GC-MS) and fresh inoculation of C. beijerinckii into glycerol broth in which the same organism had previously grown for 24 h were used to assay for the presence of these and other toxic compounds. First, cells were grown on glycerol as a sole carbon source for 24 h. Afterwards, the cells were aseptically separated by centrifugation and the resulting supernatant (culture broth) was supplemented with glucose (40 g/L) and 0.5 mL of the buffer, mineral and vitamin stocks. Subsequently, C. beijerinckii preculture (6%, v/v) was inoculated into the glucose-supplement glycerol-rich broth and incubated as described earlier. The culture broth of C. beijerinckii pre-grown on glucose for 24 h and supplemented with glucose (40 g/L), buffer, mineral and vitamin stocks (0.5 mL each) was inoculated with C. beijerinckii as a control. The procedure for GC-MS is described under the analytical methods below.
Cysteine and furfural were tested to evaluate their capacity to mitigate 3-hydroxypronionaldehyde-mediated stresses and to enhance NADH re-oxidation, respectively. To evaluate the effects of cysteine and furfural on the growth of C. beijerinckii on glycerol as a sole carbon source, cultures (described above) were supplemented with 2 and 4 g/L cysteine and 1 g/L furfural. Un-supplemented glycerol-based P2 medium was used as a control. To assess the possibility of artificially triggering solventogenesis in glycerol-grown cells of C. beijerinckii, acetic and butyric acids were supplemented to the glycerol-based P2 medium at 6 and 3.5 g/L, respectively. The cultures were adjusted to a pH of 6.5 using NH4OH before inoculation. Glucose-based P2 medium supplemented with the same concentrations of acetic and butyric acids and pH-adjusted with NH4OH was used as a control. To further test the likelihood of artificially inducing solventogenesis in glycerol-grown cells of C. beijerinckii, butyraldehyde (3 g/L) was added to cultures grown on glycerol as a sole carbon source. Cultures of C. beijerinckii grown in glycerol-based P2 medium un-supplemented with butyraldehyde were used as a control.
We tested lower concentrations of glycerol (12, 20 and 36.1 g/L) relative to fermentations containing 60 g/L glycerol (control). The goal was to ascertain whether lower concentrations of glycerol might relieve glycerol-mediated inhibitory effects that limit growth on glycerol as a sole carbon source. Further, C. beijerinckii was grown in P2 medium as described earlier with glycerol as the sole carbon source without the addition of acetate. The P2 medium was supplemented with a buffer stock devoid of ammonium acetate. Cultures grown in glycerol-based P2 medium [supplemented with ammonium acetate (220 g/L)-containing buffer stock] were used as control.

2.2. Quantitative Gene Expression Profiling

2.2.1. Total RNA Isolation

C. beijerinckii preculture was cultivated in TGY broth as described above. Afterwards, the preculture was used to inoculate P2 medium supplemented with glucose (60 g/L) or glycerol (60 g/L), with and without the acetate (2.2 g/L) addition, and then the cultures were grown anaerobically at 35 ± 1 °C. Samples were collected at 12 h and 24 h and cells were harvested by centrifugation at 13,000× g for 5 min at 4 °C. Total RNA was extracted from the samples as per the procedures described by Ujor et al. [20] and Gangwar et al. [30]. After centrifugation, cell pellets were washed with an ice-cold 25 mM Tris-Cl buffer in water and re-suspended to reach an optical density (OD) of ~1.0 (at 600 nm). Cell suspensions of equal OD at 600 nm were centrifuged as above and the cell pellets were stored at −80 °C for subsequent RNA isolation. Samples were thawed on ice and lysed by adding Lysozyme (10 mg/mL) and incubating for 1 h at 37 °C. Total RNA was then isolated using TRIzol™ Reagent (ThermoFisher Scientific, Waltham, MA, USA), according to the manufacturer’s instructions. The extracted RNA was subjected to DNase I treatment for 1 h at 37 °C to remove DNA contaminants as per manufacturer’s instructions (NEB, Ipswich, MA, USA). The qualities and concentrations of the RNA samples were assessed on 1.2% agarose gel and by using a NanoDrop One UV-Vis Spectrophotometer (ThermoFisher Scientific, Waltham, MA, USA).

2.2.2. Real-Time Quantitative PCR (RT-qPCR)

The relative expression profiles of 13 genes were assessed by RT-qPCR using a CFX Connect RT-qPCR Systems (Bio-Rad Inc., Hercules, CA, USA) and the iTaq Universal SYBR Green Supermix (Bio-Rad, Hercules, CA, USA). Total RNA (500 ng) was used for cDNA synthesis using iScriptTM Reverse Transcription Supermix RT-qPCR kit (Bio-Rad, Hercules, CA, USA), according to the following conditions: 25 °C for 5 min, 46 °C for 20 min, and 95 °C for 1 min. Each reaction mixture contained 100 ng of cDNA and 0.5 µM gene specific primers (Table 1). The RT-qPCR reaction conditions were as follows: 95 °C for 2 min; 40 cycles of 95 °C for 10 s and 57 °C for 15 s, followed by 95 °C for 10 s and melt curve analysis at 65–95 °C with increment of 0.5 °C for 5 s. Data analysis was performed using the mean Cq values obtained for each sample. The relative expression level of each gene was calculated in reference to the glucose-grown samples using the 2−ΔΔCt method, with the 16S rRNA (housekeeping) gene of C. beijerinckii as an internal control to normalize the expression of each gene [30]. All RT-qPCR analyses were performed in triplicate using total RNA from 3 biological culture replicates. The relative expression of each gene is presented as an average of three biological replicates.

2.3. Enzyme Activity Assays

Cell extracts of C. beijerinckii grown in glycerol- and glucose-based P2 media were assayed for butanol dehydrogenase (BDH), butyraldehyde dehydrogenase (BDDH), acetoacetate decarboxylase (ACDC), and Co-A transferase (CoAT) activities, according to previously described methods with modifications [31,32,33]. After 12 h of fermentation, cells were collected by centrifuging at 10,000× g at 4 °C for 10 min and washed with 10 mM potassium phosphate buffer (pH 7.5). Subsequently, the cells were collected by centrifugation and re-suspended in 1 mL of lysis buffer containing a 10 mM phosphate buffer (pH 7.5), 1 mM PMSF, and 10 mg/mL lysozyme and incubated for 1 h at 37 °C. Cell debris was removed by centrifugation at 16,000× g at 4 °C for 10 min, and the supernatant was collected in a fresh sterile tube for use in subsequent assays. Protein concentrations of cell extracts were measured with a Pierce™ Protein Assay Reagent (ThermoFisher Scientific, Waltham, MA, USA). The protein concentration of each sample was calculated using a BSA standard curve.
BDH activity assay was performed at room temperature with 50 µL of cell extract added to the reaction mixture containing 50 mM MES buffer (pH 6.0), 100 mM KCl, 0.15 mM NADH, and 35 mM butyraldehyde. Decrease in NADH was measured at 345 nm with an Evolution 260 Bio UV/Visible spectrophotometer (ThermoFisher Scientific, Waltham, MA, USA). BDDH activity was measured in a reaction mixture containing 50 µL cell extract, 50 mM MES buffer (pH 6.0), 100 mM KCl, 1 mM NADH, and 0.5 mM butyryl-CoA. Decrease in NADH was measured as previously described for the BDH assay. Acetoacetate decarboxylase assay mixture consisted of 50 µL cell extract, 50 mM potassium phosphate and 300 mM lithium acetoacetate (pH 5.9). The enzyme activity was measured by monitoring the decline in the absorbance of acetoacetate at 290 nm. The CoA-transferase assay mixture contained 100 mM Tris-Cl (pH 7.5), 150 mM sodium butyrate, 0.1 mM acetoacetyl-CoA, 40 mM MgCl2, and 50 µL of enzyme solution. Enzyme activity was measured by monitoring decrease in absorbance at 310 nm (i.e., disappearance of acetoacetyl-CoA). In all cases, assays without cell extract/substrates were used as negative controls.

2.4. Analytical Methods

Culture pH was measured using Orion Star A214 pH meter (ThermoFisher Scientific, Waltham, MA, USA). Optical density (OD600 nm) was measured with an Evolution 260 Bio UV/Visible spectrophotometer (ThermoFisher Scientific, Waltham, MA, USA). Acetone, butanol, ethanol, acetic acid and butyric acid concentrations were quantitated using a Shimadzu GC-2010 Plus gas chromatography (Shimadzu, Columbia, MD, USA) unit equipped with a fame ionization detector (FID), a Shimadzu AOC-20i auto injector, and a Shimadzu SH-PolarWax crossbond carbowax polyethylene glycol column [30 m (length), 0.25 mm (internal diameter), and 0.25 μm (film thickness)]. Helium was used as the carrier gas, and the inlet and detector temperatures were maintained at 250 and 300 °C, respectively. The oven temperature was set to span from 50 to 200 °C with increments of 15 °C/min, and a 2-min hold at 200 °C. One microliter of each sample was injected into the gas chromatography with a split ratio of 10:1. Gas chromatography data was analyzed using Labsolutions software (version 5.81 SP1; Shimadzu, Columbia, MD, USA). The concentrations of glycerol and glucose in the culture broth was analyzed by high performance liquid chromatography (HPLC). The analytical system consisted of an Agilent 1260 infinity HPLC equipped with a quaternary pump, chilled (4 °C) autosampler, vacuum degasser, and a refractive index detector (Agilent Technologies Inc., Palo Alto, CA, USA). The HPLC column was an Aminex HPX-87H with Cation-H guard column (BioRad, Inc. Hercules, CA, USA) 300 × 7.8 mm (length and internal diameter, respectively). The mobile phase was 0.02 N H2SO4 and the flow rate was 0.50 mL/min. The column and detector were maintained at 50 °C, the run time was 30 min, and the injection volume was 50 µL. HPLC data was analyzed using Chem Station software (Rev.C.01.06; Agilent Technologies Inc., Palo Alto, CA, USA).
To assay for likely accumulation of methylglyoxal and/or 3-hydroxypropionaldehyde both intra- and extracellularly, GC-MS was used to analyze the metabolite profiles of culture broths and cell pellets of C. beijerinckii grown solely on glycerol (with and without acetate supplementation) relative to cells grown on glucose. After 12 h, fermentation was terminated, and the cells were harvested by centrifugation at 13,000× g for 5 min at 4 °C. The supernatant was separated from the cell pellet by decantation and aliquots of 25 mL were frozen at −80 °C for 10 days. The cell pellets were washed twice with cold (4 °C) sterile distilled water and harvested by centrifugation as above. The resulting pellets were frozen at −80 °C for 10 days. Afterwards, the frozen cell pellets and culture broths were freeze-dried in a Labconco Lyph-Loc 6 freeze-dryer (Kansas City, MO, USA) for 7 days. After freeze-drying, the samples were mashed into a slightly powdered formation by crushing the dry pellets with a spatula. Comparatively, the dry pellets (cell biomass) of glycerol-grown cells of C. beijerinckii were considerably fragile; hence, they crumbled seamlessly with the application of minimal force using a spatula. Conversely, the dry pellets (cell biomass) of glucose-grown cells presented a more fibrous texture that was significantly harder to break down with a spatula. Afterwards, extraction was carried out by placing 0.6 g of the dry samples in 600 μL of cold methanol. Extraction took place at 4 °C for 7 days. Subsequently, cell debris was removed by centrifugation at 10,000× g for 5 min at 4 °C. The extracts were then analyzed by GC-MS according to Galindo-Cuspinera et al. [34] using an Agilent 6890N gas chromatography (Agilent Technologies Inc., Palo Alto, CA) coupled to a mass selective detector (Agilent 5973 MS, Agilent Technologies Inc., Palo Alto, CA, USA). The GC is fitted with a fused-silica capillary column [RTx-5MS, 30 m long × 0.25 mm (internal diameter) × 0.5 μm film thickness; Restek Corp., Bellefonte, PA, USA]. Injection volume was 1 µL using a splitless injection mode. The column was operated at an initial temperature and holding time of 30 °C and 5 min, respectively. The temperature was then increased at the rate of 8 °C/min to 250 °C with a 10-min holding time. Helium was used as a carrier gas at a column flow rate of 1.3 mL/min. The mass spectroscopy was operated at an ion source temperature of 230 °C, ionization voltage of 69.9 eV, and mass scan range of m/z 33–250 at 6.17 scans/s. Volatile compounds were identified by matching the mass spectra to NIST database (National Institute of Standards and Technology, version 1.7 mass spectral database, Agilent Technologies Inc., Palo Alto, CA, USA). Each sample was analyzed twice.

2.5. Statistical Analysis

Analysis of variance (ANOVA) according to Dunnett’s method was deployed to compare results between the controls and treatments using Minitab (version 21.2.0.0; Minitab Inc., State College, PA, USA). Cell growth, pH, acetate, butyrate, butanol and acetone concentrations were analyzed at 95% confidence interval and treatments with a p ≤ 0.05 were considered significant. In addition, a pairwise Tukey’s test was used to compare mean differences between treatments. Treatments were analyzed in triplicate (n = 3).

3. Results

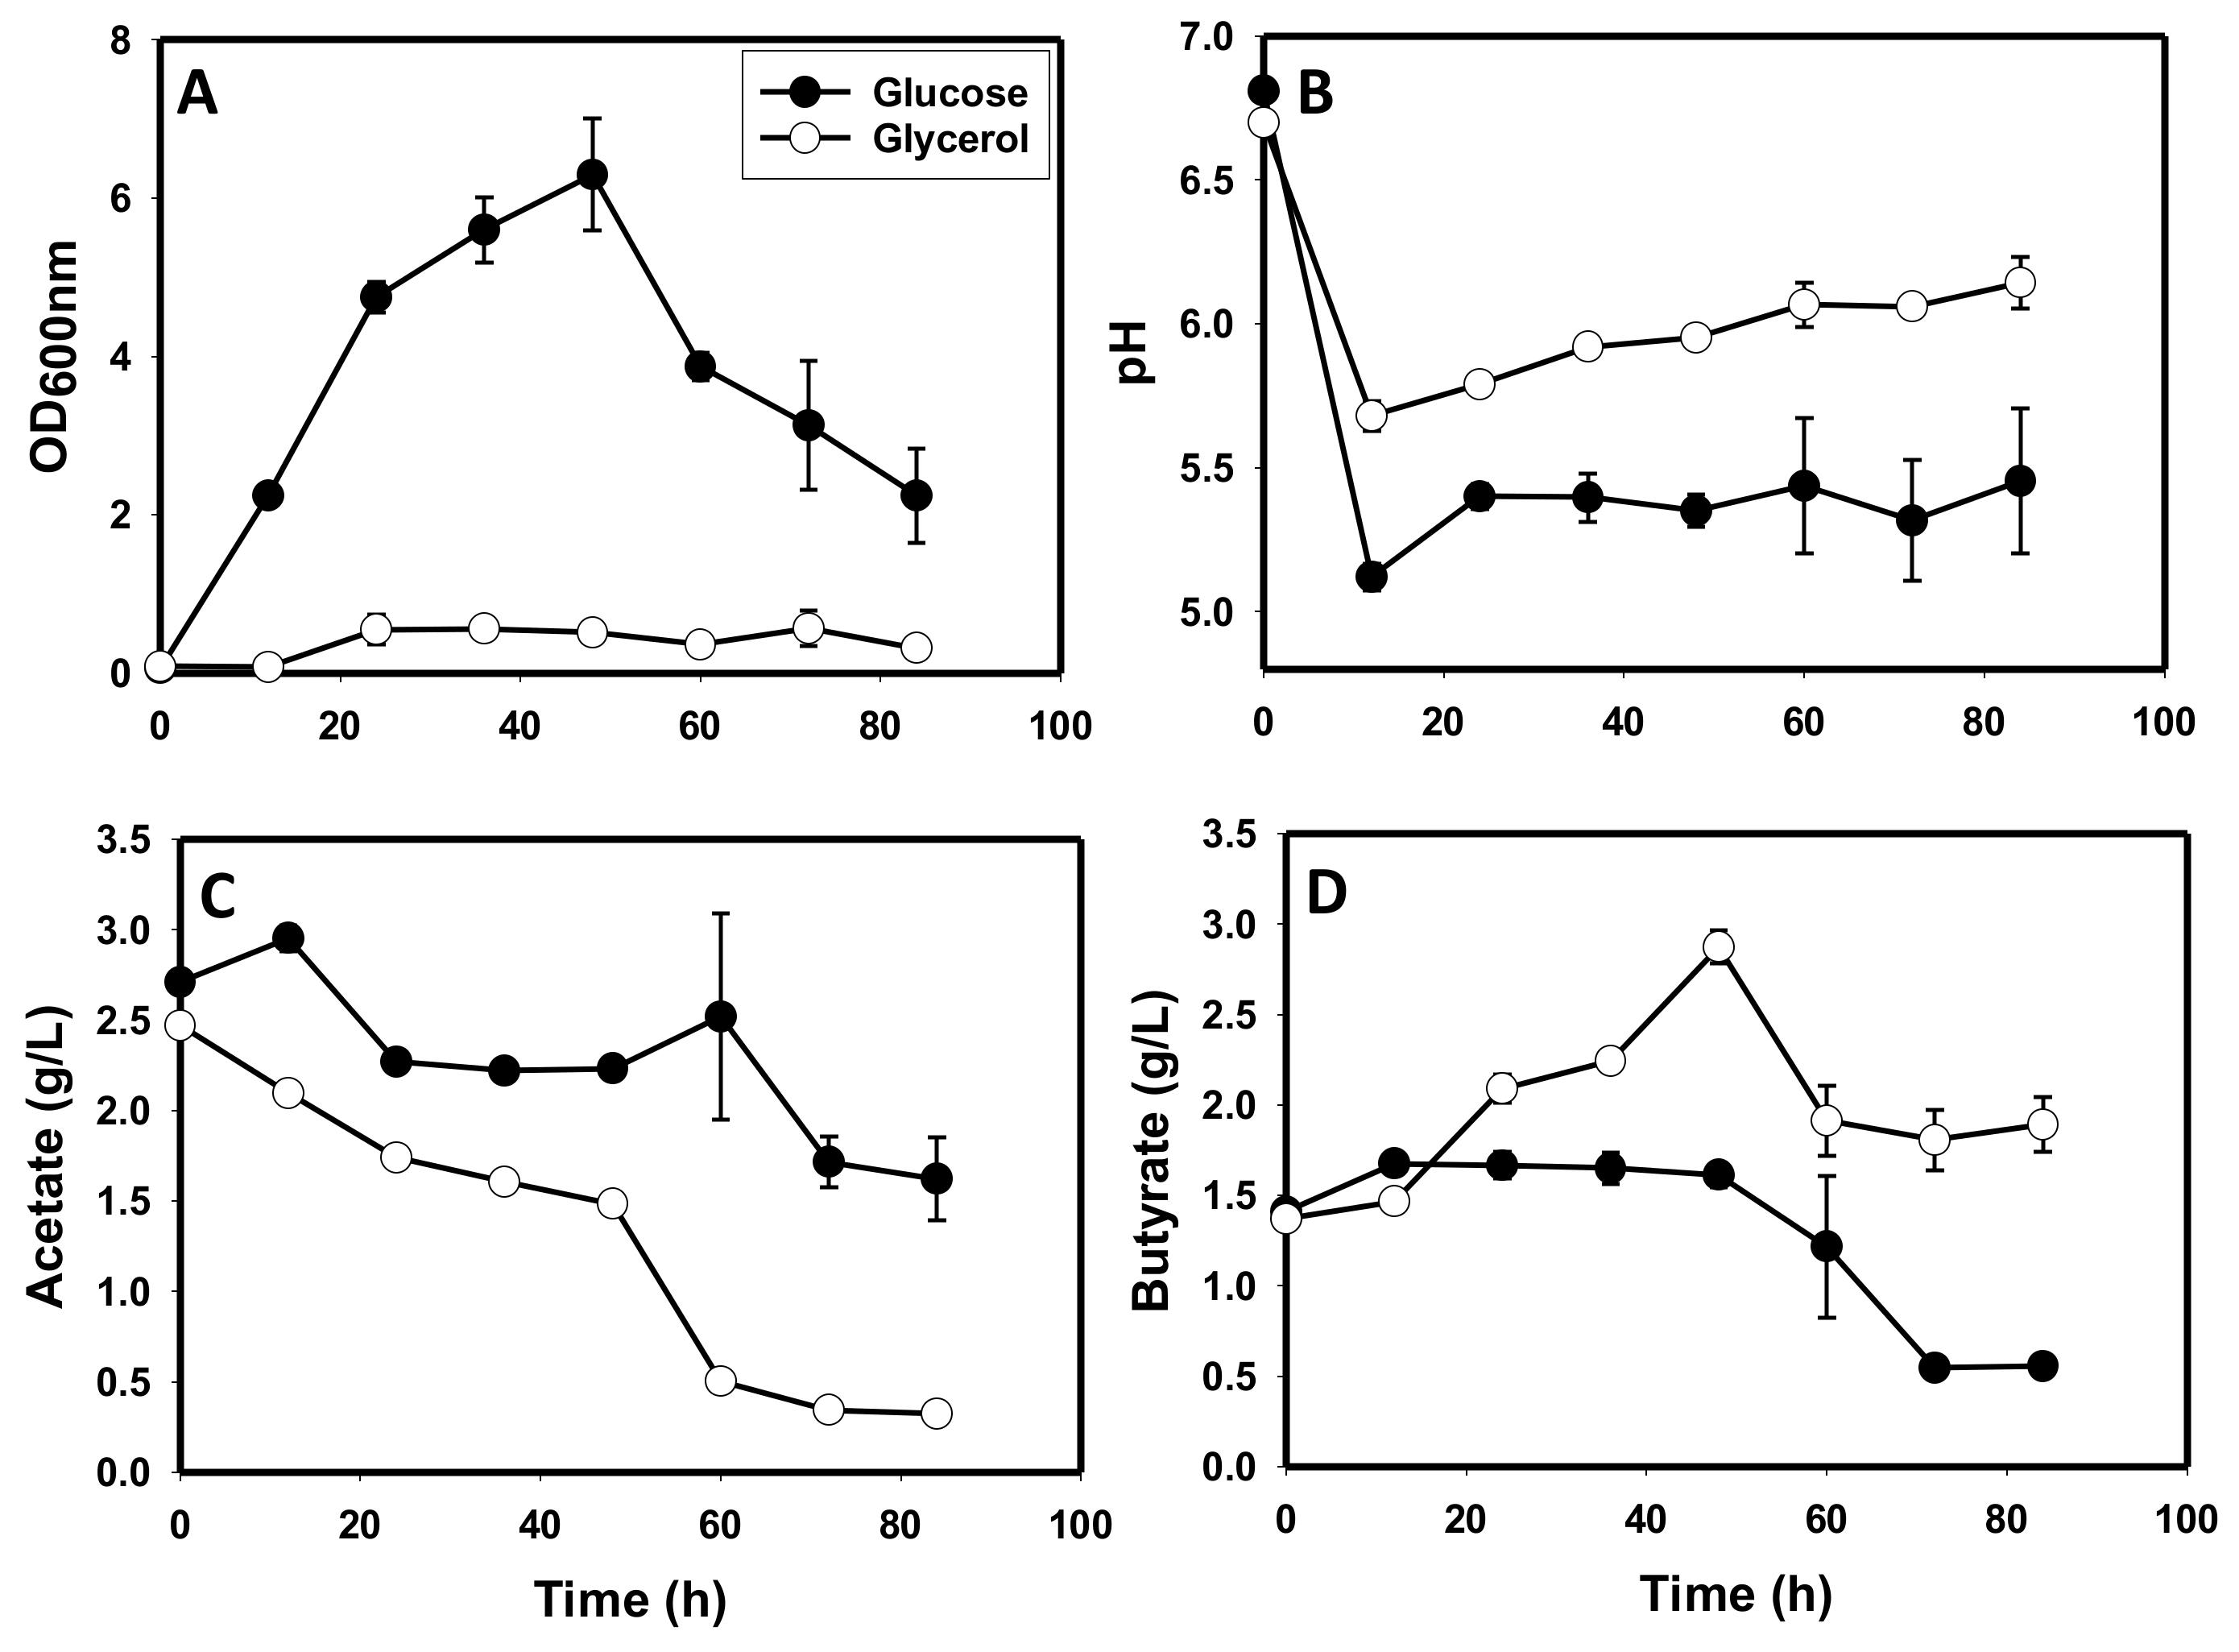
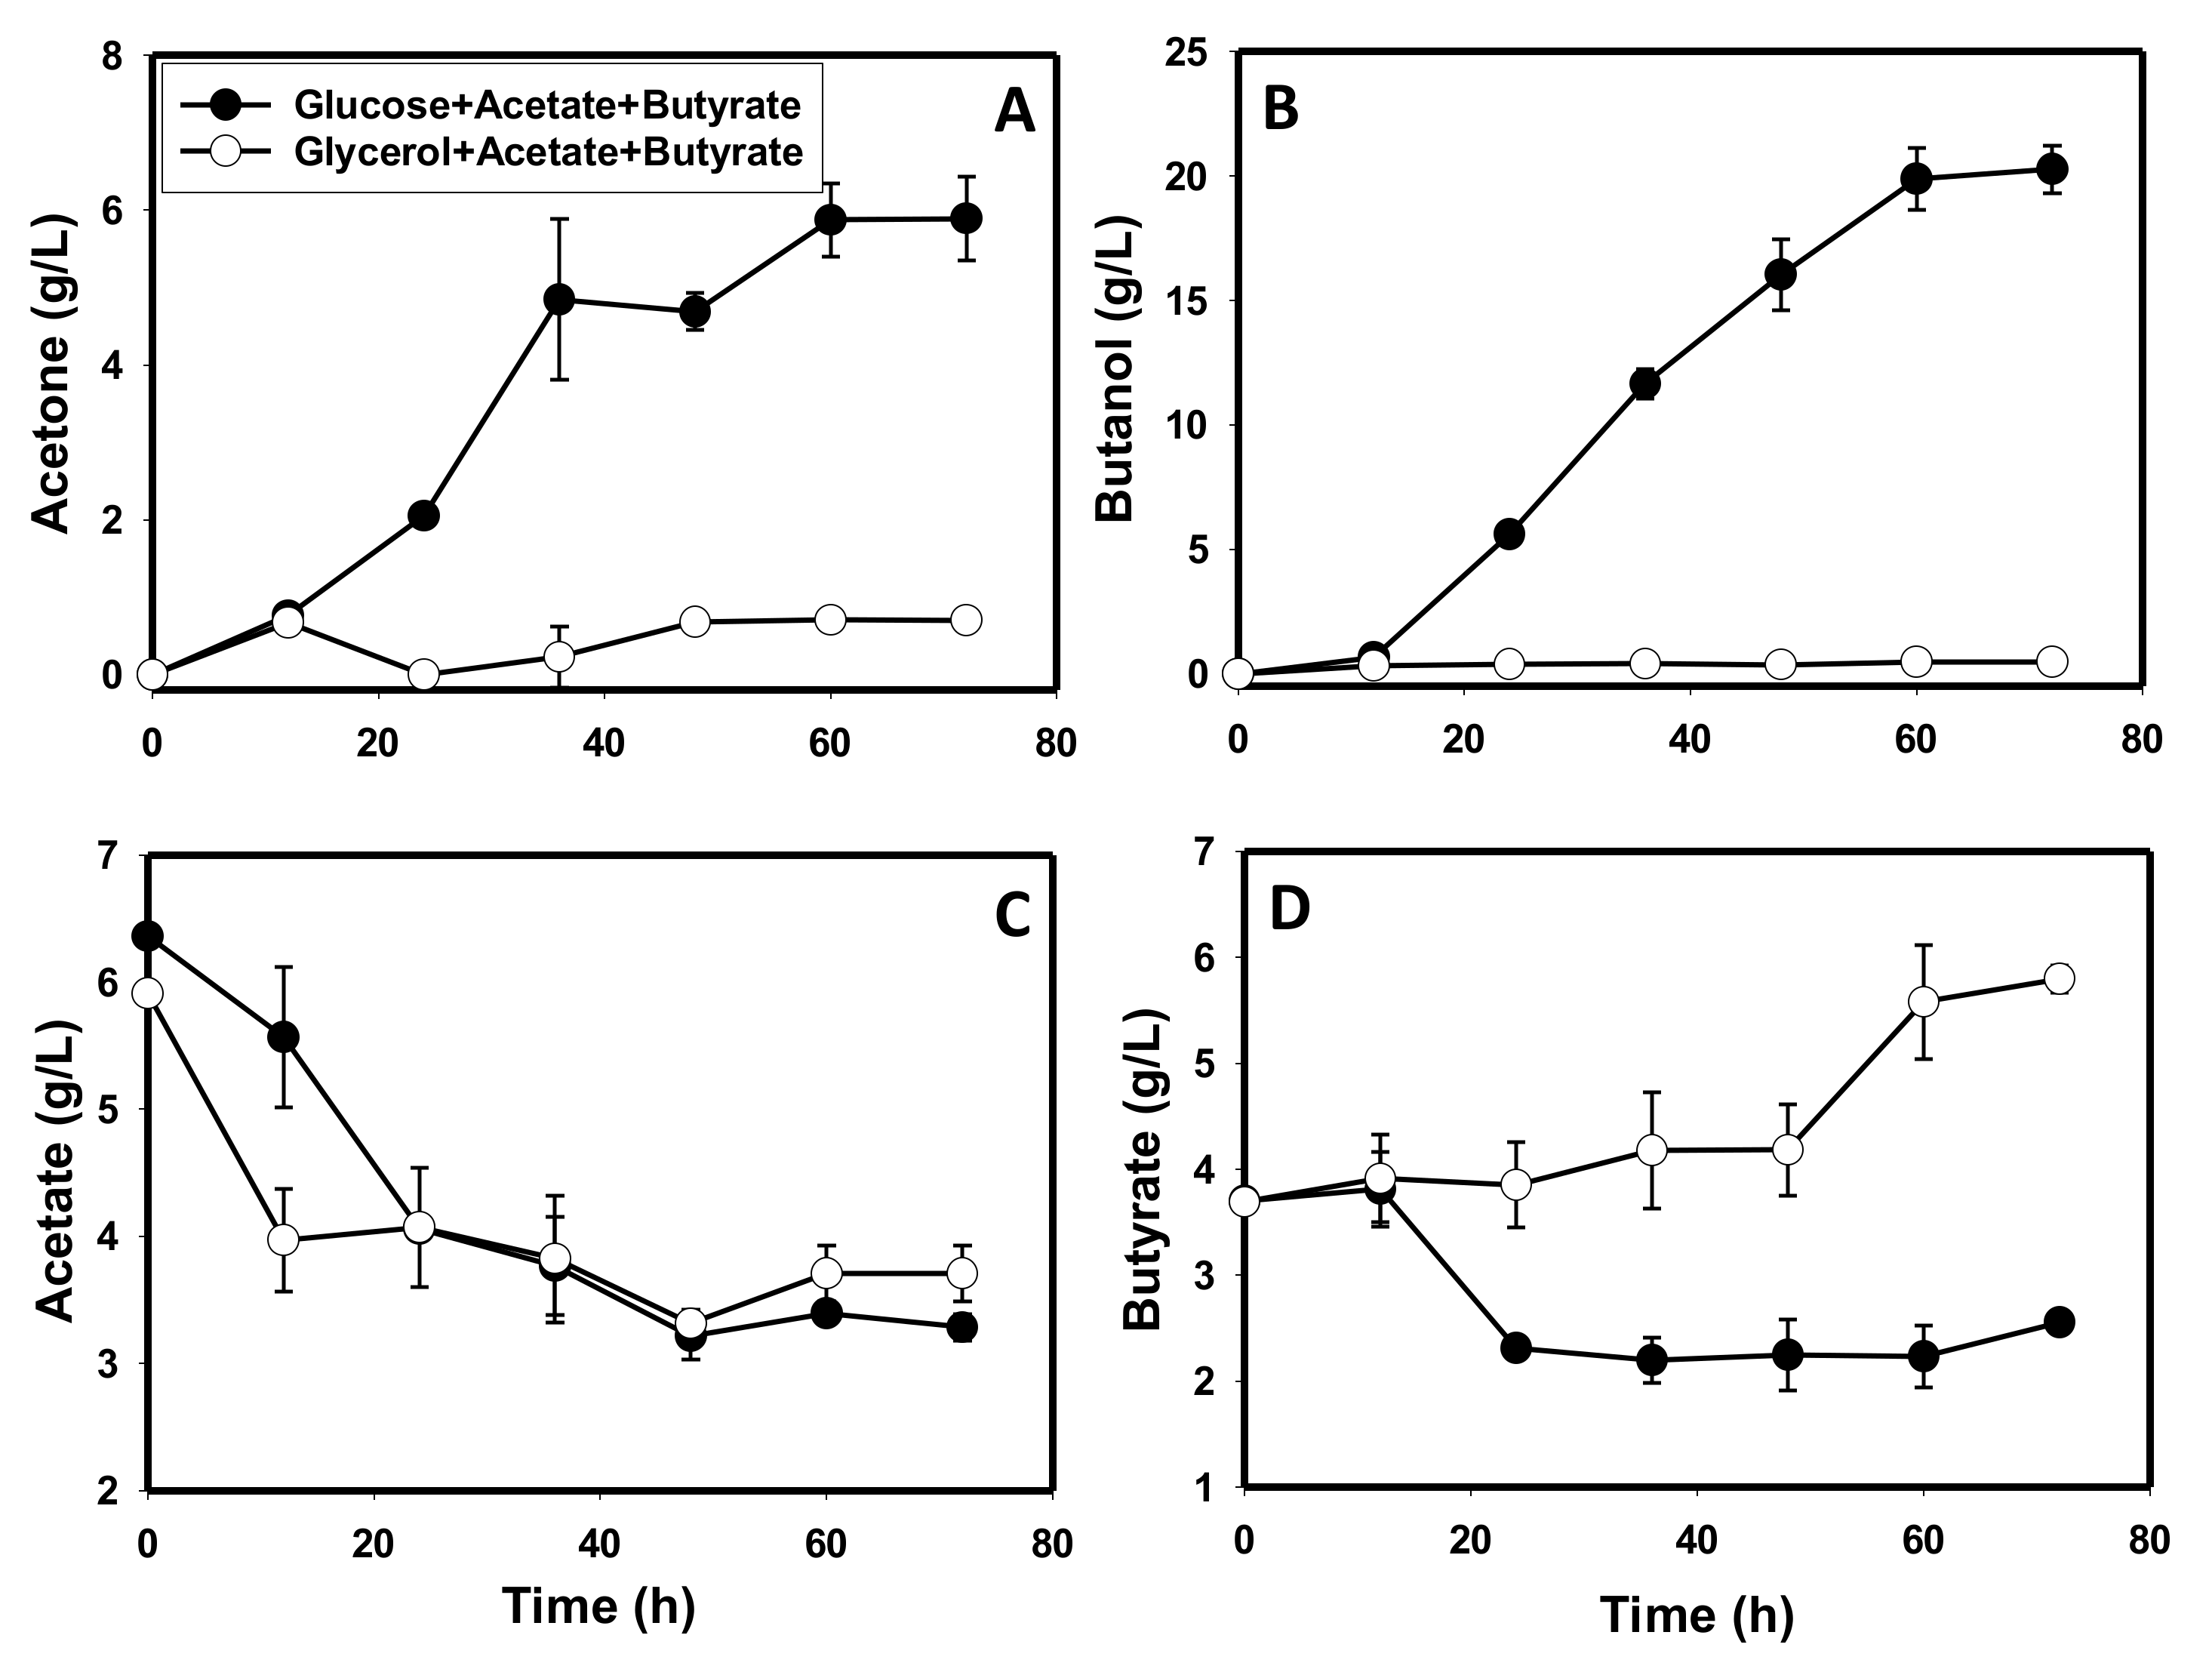
3.1. Comparative Fermentation Profiles of C. beijerinckii Grown on Glycerol versus Glucose

As expected, C. beijerinckii exhibited robust growth on glucose relative to an abysmal growth profile on glycerol. The maximum optical density observed for cells grown on glycerol as a sole carbon source (0.57) was 11.1-fold less than that observed for cells grown on glucose (p ≤ 0.05) as a sole carbon source (6.30; Figure 1A). Accordingly, the typical fall in pH that characterizes acidogenesis was considerably weaker (1.1-fold) in cultures grown on glycerol (pH 5.70), compared to those grown on glucose (pH 5.12; p ≤ 0.05; Figure 1B). Whereas both sets of cultures showed an overall drop in acetic acid concentration, cultures grown on glucose exhibited a somewhat undulating pattern indicative of acetate production and re-assimilation during fermentation (Figure 1C). Conversely, a consistently sharp reduction in acetate concentration was observed in cultures grown solely on glycerol. The pattern of reduction in acetate concentration in cultures grown on glycerol suggests that acetate is not produced in glycerol-grown cultures of C. beijerinckii. At the end of the fermentation, acetate concentration in the glycerol-grown cultures (0.32 g/L) was 5.1-fold (p ≤ 0.05) less than the concentration detected in the glucose-grown cultures (1.62 g/L; Figure 1C). On the contrary, butyric acid concentration showed contrasting patterns between cultures grown on glycerol and glucose. With glycerol as the sole carbon source, butyrate concentration exhibited an overall upward trend accumulating to as high as 2.9 g/L (Figure 1D).
With glucose as a sole carbon source, after an initial rise to 1.7 g/L, butyric acid concentration decreased during fermentation. Consequently, the final butyric acid concentrations in glycerol-based cultures were 3.5-fold higher than the concentrations in glucose-based cultures (p ≤ 0.05; Figure 1D). Apparently, butyrate is produced and re-assimilated in cultures grown on glucose, whereas glycerol-grown cells did not appear to reabsorb butyrate. C. beijerinckii did not produce acetone and butanol when grown on glycerol as a sole carbon source, whereas cultures grown on glucose produced 2.8 and 11.6 g/L, respectively (Figure 2A,B). Ethanol was produced in both glycerol- and glucose-grown cultures. However, the maximum ethanol concentration detected in glycerol-grown cultures was 1.25-fold less (p ≤ 0.05) than that detected in the glucose-grown cultures (Figure 2C).
Following the observation that C. beijerinckii did not appear to produce acetate on glycerol as a sole carbon source, fermentations were conducted in glycerol-based P2 medium devoid of acetate and the resulting culture profile was compared to that of cultures grown on glycerol with acetate supplementation. With or without acetate supplementation, C. beijerinckii did not produce acetone and butanol, while ethanol concentrations were similar. However, without acetate supplementation, the optical density (OD600 nm) of C. beijerinckii was 1.5-fold higher than the optical density of cultures supplemented with acetate (Figure 3A). Further, with acetate supplementation, both sets of cultures exhibited a characteristic initial fall in pH after 12 h, followed by a rise in culture pH (Figure 3B). Notably, the pH of acetate-supplemented cultures fell from 6.7 to 5.7 (1.2-fold reduction), whereas the drop in pH for the acetate un-supplemented cultures was ~1.4-fold (from 6.33 to 4.70; Figure 3B). Furthermore, following the initial fall in pH, the pH of acetate-supplemented cultures increased 1.1-fold to a final pH of 6.1. On the other hand, acetate un-supplemented cultures barely exhibited an increase in pH (final pH 4.9). As a result, the final pH of acetate un-supplemented cultures was 1.2-fold lower than the pH of cultures supplemented with acetate (p ≤ 0.05). Remarkably, the pH profiles of both sets of cultures did not reflect the observed acetate and butyrate concentrations. For the acetate un-supplemented cultures, 0.31 g/L acetate was carried over from the preculture (Figure 3C). After 24 h, the 0.31 g/L acetate was completely absorbed and no new acetate was produced, while acetate concentration in the acetate-supplemented cultures fell from 2.5 g/L to 0.34 g/L. Butyrate concentration increased with and without acetate supplementation (Figure 3D). However, an increase in butyrate concentration was more pronounced in the acetate-supplemented cultures. With both sets of cultures, minimal butyrate was carried over from the preculture. However, with acetate supplementation, butyrate increased 7.2-fold from 0.25 g/L to 1.81 g/L (Figure 3D). Without acetate supplementation, butyrate concentration increased 1.8-fold from 0.29 g/L to 0.51 g/L. Collectively, acetate-supplemented cultures contained a final acid (acetate + butyrate) concentration of 2.2 g/L, whereas the un-supplemented cultures contained 0.51 g/L (butyrate only). However, the final pH values of the acetate-supplemented and the un-supplemented cultures were 6.1 and 4.9, respectively (Figure 3B).
Furfural (1 g/L) was tested as an artificial electron acceptor to dispose of excess NADH in cultures grown on glycerol as a sole carbon source. Concurrently, cysteine was tested at 2 and 4 g/L for possible mitigation of stresses that may stem from 3-hydroxypropionaldehyde during growth on glycerol. Cysteine has been shown to mitigate 3-hydroxypropionaldehyde-mediated stresses on microbial cells [35]. In this study, there were no differences between the cultures supplemented with 2 and 4 g/L cysteine, hence, results of the cultures supplemented with 4 g/L cysteine are presented here. No significant differences in growth were observed in cultures grown on glycerol relative to glycerol-grown cultures supplemented with furfural or cysteine. However, furfural appeared to produce a stabilizing effect on the cells of C. beijerinckii towards the end of fermentation (Figure 4A). From 36 h to 60 h (end of fermentation), the optical densities of glycerol-grown cultures and glycerol-grown cultures supplemented with cysteine decreased at least 1.5-fold. Conversely, the optical density of furfural-supplemented glycerol-grown cultures remained stable during the same period, showing no observable change. The pH profiles were similar among the three sets of cultures. However, the furfural-supplemented cultures showed a slightly lower pH than the glycerol-grown cultures and glycerol-grown cultures supplemented with cysteine (p ≤ 0.05; Figure 4B). Although acetate was absorbed from all the cultures with no indication of acetate production, acetate concentration in furfural-supplemented cultures was consistently higher than those detected in the glycerol-grown cultures and glycerol-grown cultures supplemented with cysteine (Figure 4C). At the end of fermentation, the furfural-supplemented glycerol-grown cultures contained 2.0-fold greater acetate concentration (0.60 g/L) than the glycerol-grown cultures and glycerol-grown cultures supplemented with cysteine (0.30 g/L for both). Furthermore, butyrate concentration exhibited a similar upward trend as described earlier for glycerol-grown cultures. However, furfural-supplemented cultures contained 1.2-fold higher butyrate than the cultures grown on plain glycerol and glycerol-grown cultures supplemented with cysteine (p ≤ 0.05; Figure 4D). In total, furfural-supplemented glycerol-grown cultures contained 1.4-fold higher acids (acetate + butyrate) than cultures grown on glycerol with or without cysteine supplementation.
Contrary to the poor growth observed on glycerol as a sole carbon source, inoculation of C. beijerinckii into a glucose (40 g/L)-supplemented glycerol-based culture broth in which this organism was pre-grown for 24 h led to 1.4-fold higher optical density (p ≤ 0.05) than in cultures grown in glucose (40 g/L)-supplemented glucose-based broth in which C. beijerinckii was pre-grown for 24 h (Figure S1A). Additionally, both sets of cultures (glycerol- and glucose-based culture broths in which C. beijerinckii had been pre-grown) showed a similar pH profile during fermentation. There was no indication of the presence of a toxic metabolite(s) in the culture broth resulting from pre-growth of C. beijerinckii on glycerol as a sole carbon source. In fact, 1.4-fold higher optical density was observed with glucose (40 g/L)-supplemented C. beijerinckii-pre-grown glycerol broth relative to the glucose broth in which this organism was pre-grown (p ≤ 0.05; Figure S1A). However, the improved growth in the glycerol-containing medium did not translate into improved acetone and butanol production. In the glycerol-containing medium, 1.3- and 1.2-fold lower acetone and butanol concentrations were detected, respectively, relative to the C. beijerinckii-pre-grown glucose medium (Figure 5A,B).
Similar to cultures grown on glycerol as a sole carbon source, C. beijerinckii-pre-grown glycerol broth contained lower acetate (2.1-fold; p ≤ 0.05) and higher butyrate (1.2-fold) concentrations than the C. beijerinckii-pre-grown glucose medium (Figure 5C,D). Further, lower glycerol concentrations (12, 20, and 36.1 g/L) did not abolish the inability of C. beijerinckii to grow on glycerol as a sole carbon source (Figure S2A). Notably, lower glycerol concentrations than 60 g/L led to 1.2-fold lower culture pH (Figure S2B). However, irrespective of the glycerol concentration, acetone, butanol and acetate were not produced by C. beijerinckii.
Artificially induced acidogenesis via supplementation of the glycerol- and glucose-based media with 6.0 and 3.5 g/L acetate and butyrate, respectively, led to 9.2-, 1.1-, and 8.0-fold lower optical density, pH and ethanol concentrations, respectively, in the glycerol medium when compared to the glucose medium (p ≤ 0.05; Figure S3). Remarkably, high acid levels triggered solventogenesis in C. beijerinckii grow on glycerol as a sole carbon source, leading to 0.7 and ~0.5 g/L acetone and butanol, respectively. Apparently, although acetone and butanol were produced in the glycerol medium supplemented with high acetate and butyrate concentrations, solvent levels were low and transient. Consequently, acetone and butanol concentrations on glycerol (following supplementation of high acetate and butyrate concentrations) were 8.5- and 41-fold lower, respectively, relative to the amounts produced in glucose supplemented with high acetate and butyrate concentrations (p ≤ 0.05; Figure 6A,B). Notably, the glucose cultures supplemented with high acetate and butyrate concentrations produced 6.0 and 20.3 g/L acetone and butanol, respectively (Figure 6A,B). Interestingly the high initial acetate concentration elicited strong acetate absorption in both glycerol- and glucose-based media. Acetate concentrations decreased 1.9- and 1.6-fold with 3.3 and 3.7 g/L residual acetate remaining in the glucose- and glycerol-based media, respectively (Figure 6C). Conversely, butyrate concentrations showed contrasting trends in both sets of cultures. On glycerol as a sole carbon source, butyrate concentration increased 1.6-fold, whilst reducing 1.4-fold on glucose (p ≤ 0.05; Figure 6D). Thus, the final butyrate concentration in the glycerol medium was 2.3-fold higher than that in the glucose medium (p ≤ 0.05).
Similar to high acetate and butyrate supplementation, butyraldehyde (3 g/L) supplementation triggered transient and weak butanol production on glycerol as a sole carbon source. First, butyraldehyde led to a 1.8-fold increase in growth (p ≤ 0.05; Figure 7A). Second, C. beijerinckii grown on glycerol with butyraldehyde supplementation produced ~0.1 g/L butanol, whereas the butyraldehyde un-supplemented cultures did not produce butanol (Figure 7B). Third, butyraldehyde reversed acetate re-assimilation on glycerol as a sole carbon source. With butyraldehyde supplementation, acetate concentration increased ~1.1-fold, whereas acetate concentration decreased 1.3-fold in butyraldehyde un-supplemented glycerol-grown cultures (p ≤ 0.05). Finally, butyraldehyde dampened butyrate accumulation in glycerol-grown cultures (Figure 7D). In butyraldehyde-supplemented cultures, butyrate concentration increased 1.3-fold. On the other hand, butyrate concentration increased 2.0-fold in glycerol-grown cultures un-supplemented with butyraldehyde.

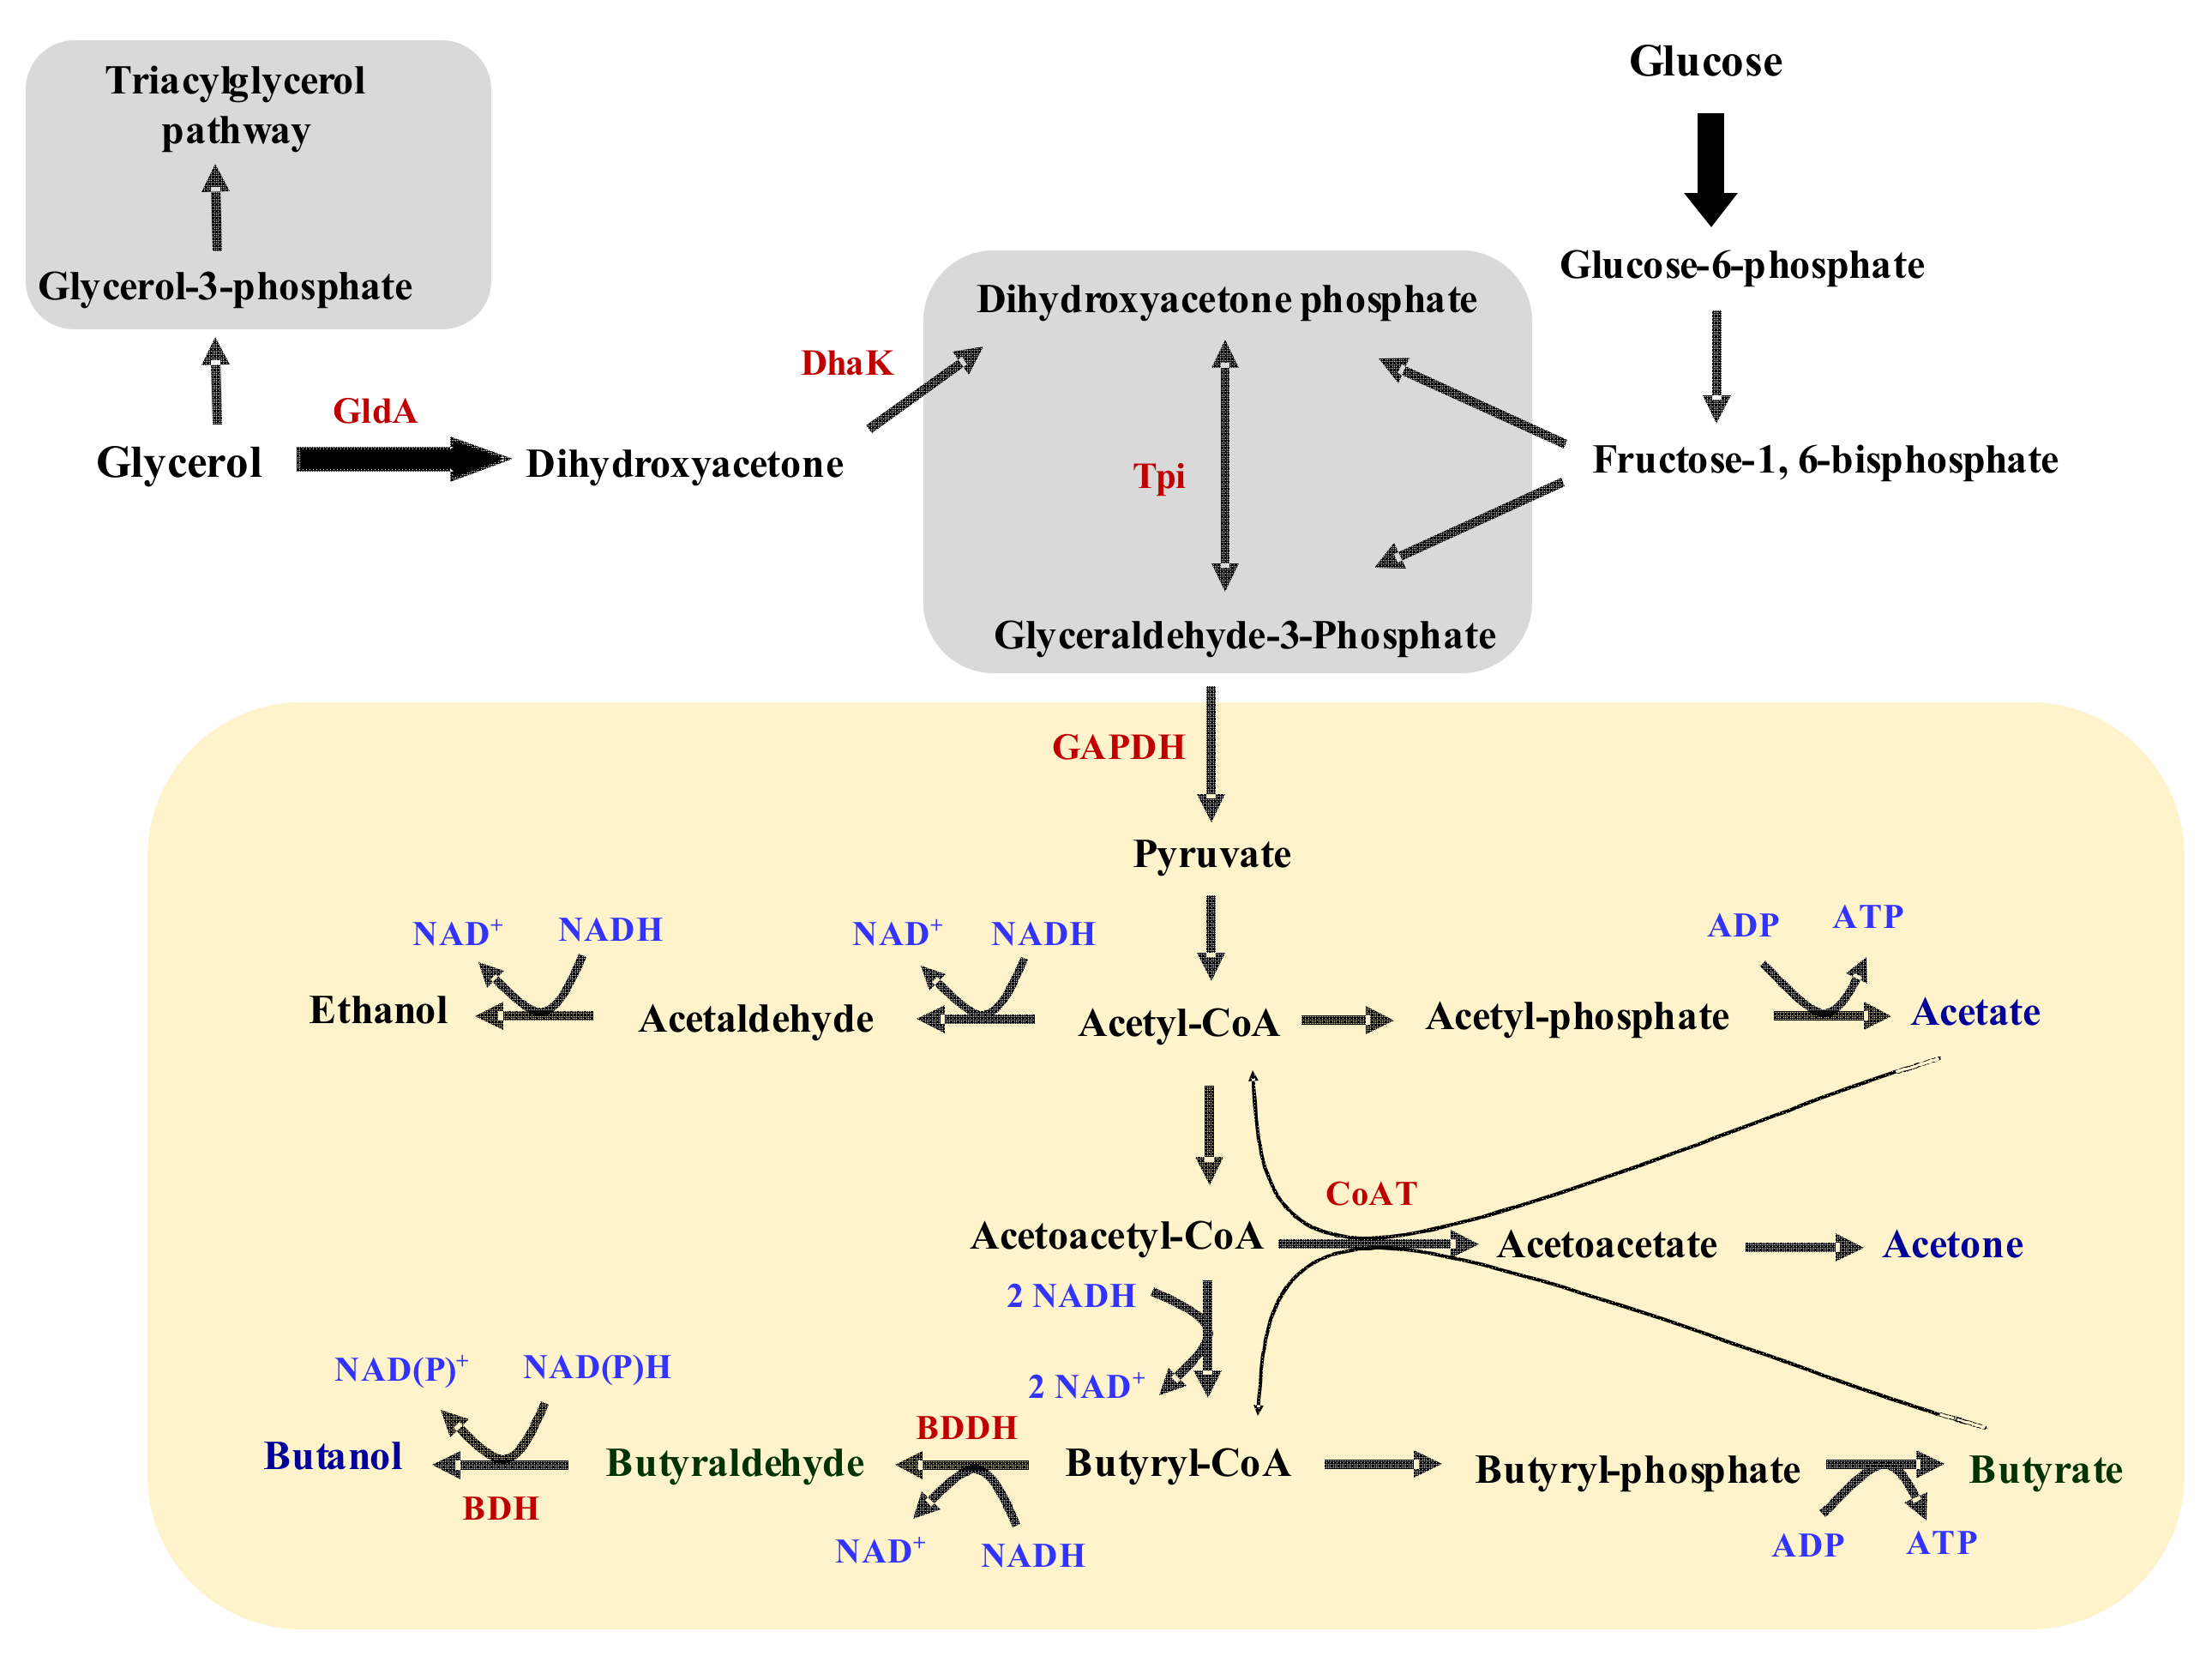
3.2. The Activities of Key Solventogenic Enzymes during Growth on Glycerol

Cultures grown on glycerol and glucose showed contrasting patterns of enzyme activity under the study conditions. This was more pronounced for the dehydrogenases (BDH and BDDH). Specifically, BDH activity was 1.5- and 5-fold higher with NADH than with NADPH as a cofactor in glycerol- and glucose-grown cells, respectively (p ≤ 0.05; Figure 8A). Remarkably, with or without glycerol (0.6 g/L) supplementation in the assay mixture, BDH activity with NADH as cofactor was at least, 7.5-fold greater in the glycerol-grown cells, relative to the cells grown on glucose as a sole carbon source (p ≤ 0.05; Figure 8A). Because addition of high butyrate (3.5 g/L) and butyraldehyde (3.0 g/L) concentrations elicited weak and transient solventogenesis, which appeared to shut down shortly after inception, we tested whether higher glycerol concentrations (10 and 20 g/L) in the assay mixture might inhibit BDH activity. Interestingly, the presence of 10 and 20 g/L glycerol in the assay mixture did not result in significant decreases in BDH activity in glucose-grown cells (Figure 8B). Conversely, BDH activity in the presence of 10 and 20 g/L glycerol decreased by as little as 2-fold and as much as 3-fold in assays conducted with lysate from the glycerol-grown cells (p ≤ 0.05; Figure 8B). BDDH activity decreased marginally with NADPH, relative to assays conducted with NADH as cofactor (Figure 8C). More strikingly, glycerol-grown cells exhibited at least 3-fold higher activity—with or without glycerol (0.6 g/L) supplementation in the assay mixture—with NADH and at least, 3.5-fold greater activity with NADPH than the glucose-grown cells (p ≤ 0.05; Figure 8C). CoAT activity was similar between glycerol- and glucose-grown cells (Figure 8D). ACDC activity was considerably low in C. beijerinckii, irrespective of the carbon substrate. However, ACDC activity was higher in glycerol-grown cells, particularly in assay mixtures containing 0.6 g/L glycerol (3.3-fold), when compared to glucose-grown cells (p ≤ 0.05; Figure 8E).

3.3. Relative Expression of Important Metabolic Genes of C. beijerinckii Grown on Glycerol

Table 2 shows the relative expression patterns of 13 genes of C. beijerinckii grown on glycerol or glucose as a sole carbon source, with and without acetate supplementation. Overall, relative expression decreased for nearly all genes studied at 24 h, when compared to their expression levels at 12 h. Furthermore, for the most part, the presence of acetate enhanced gene expression in comparison to cells grown without acetate. This effect was more pronounced in glucose-grown cells, relative to the glycerol-grown cells. With acetate supplementation, the bifunctional acetaldehyde-CoA/alcohol dehydrogenase gene [adhE; encoded by the open reading frame Cbei_0305] involved in butanol biosynthesis was strongly upregulated (21-fold) in glucose-grown cells, in comparison to glycerol-grown cells at 12 h (Table 2). However, at 24 h, the relative expression of adhE in glucose-grown cells was only 1.44-fold lower than that in glycerol-grown cells, when acetate was supplied to the fermentation medium. Surprisingly, the expression of butanol dehydrogenase gene (bdhA; Cbei_2421) was 2-fold greater in the glycerol-grown cells at 12 h with acetate supplementation than in the glucose-grown cells. However, when acetate was absent in the medium, the relative expression of bdhA was 3.1-fold higher with glucose as a carbon source than with glycerol. Similarly, at 24 h, acetate supplementation increased bdhA expression 2.7-fold in the glycerol-grown cells, whereas the degree of expression reduced 7.7-fold in these cells without acetate supplementation, in comparison to the glucose-grown cells.
The expression levels of the glycerol catabolic genes glycerol dehydrogenase (gldA; Cbei_2753) and dihydroxyacetone kinase (dhaK; Cbei_2148) confirm a degree of flux through the glycerol catabolic pathway in glycerol-grown cells, relative to cells grown on glucose. Although both genes were expressed at 12 h in glucose-grown cells, the expression levels in the glycerol-grown cells were considerably superior to those grown on glucose (Table 2). Specifically, the relative expression levels of gldA and dhaK at 12 h were 5- and 63-fold greater respectively, in glycerol-grown cells compared to glucose-grown cells in acetate supplemented cultures, and 1.4- and 881-fold higher, respectively, without acetate supplementation. At 24 h, gldA showed 2.1-fold higher expression and 3.3-fold reduced expression in glycerol-grown cells relative to glucose grown cells with and without acetate supplementation, respectively. On the other hand, the expression of dhaK was 127- and 2.2-fold higher in glycerol-grown cells when compared to the glucose-grown cells at 24 h, with and without acetate supplementation, respectively.
The A subunit of triosephosphate isomerase (tpiA; Cbei_0599); the link between glycerol catabolism and glycolysis, which interconverts DHAP, and glyceraldehyde-3-phosphate was upregulated 1.7-fold and downregulated 3.0-fold in glycerol-grown cells relative to their glucose-grown counterparts at 12 h, with and without acetate supplementation, respectively. Similarly, at 24 h, with and without acetate supplementation, tpiA was downregulated 1.7- and ~8.0-fold in cells grown on glycerol as a sole carbon source, when compared to those grown on glucose. We assessed the expression levels of three open reading frames putatively annotated to encode glyceraldehyde-3-phosphate dehydrogenase [type I (GAPDH-1); Cbei_0597)], NADP-dependent glyceraldehyde-3-phosphate dehydrogenase (GAPDH-N1; Cbei_2282), and NADP-dependent glyceraldehyde-3-phosphate dehydrogenase (GAPDH-N2; Cbei_2572). The gene gapdh-1 showed mostly similar expression profiles in glycerol- and glucose-grown cells at 12 and 24 h with acetate supplementation. In the acetate un-supplemented cultures, gapdh-1 was upregulated 3.3- and 10.1-fold with glucose as carbon source, relative to the cells grown on glycerol at 12 and 24h, respectively. At 12 h, both gapdh-N1 and gapdh-N2 were upregulated in glucose-grown cells by as low as 1.5- and as high as 16.4-fold, when compared to glycerol-grown cells, with or without acetate supplementation. Conversely, at 24 h, both gapdh-N1 and gapdh-N2 were upregulated 1.5- and 2.0-fold, respectively, in glycerol-grown cells with acetate supplementation, whilst being downregulated 5- and 1.25-fold, respectively, without acetate supplementation, relative to cells grown on glucose as a sole carbon source. The acetate and butyrate CoA-transferases (alpha and beta subunits; cftAB) were downregulated (by as much as 135-fold) in glycerol-grown cells at 12 h, with or without acetate supplementation (Table 2). However, at 24 h, they were feebly upregulated (by up to 5.1-fold) in glycerol-grown cells, when compared to the glycose-grown cells with acetate supplementation, but not without acetate supplementation.

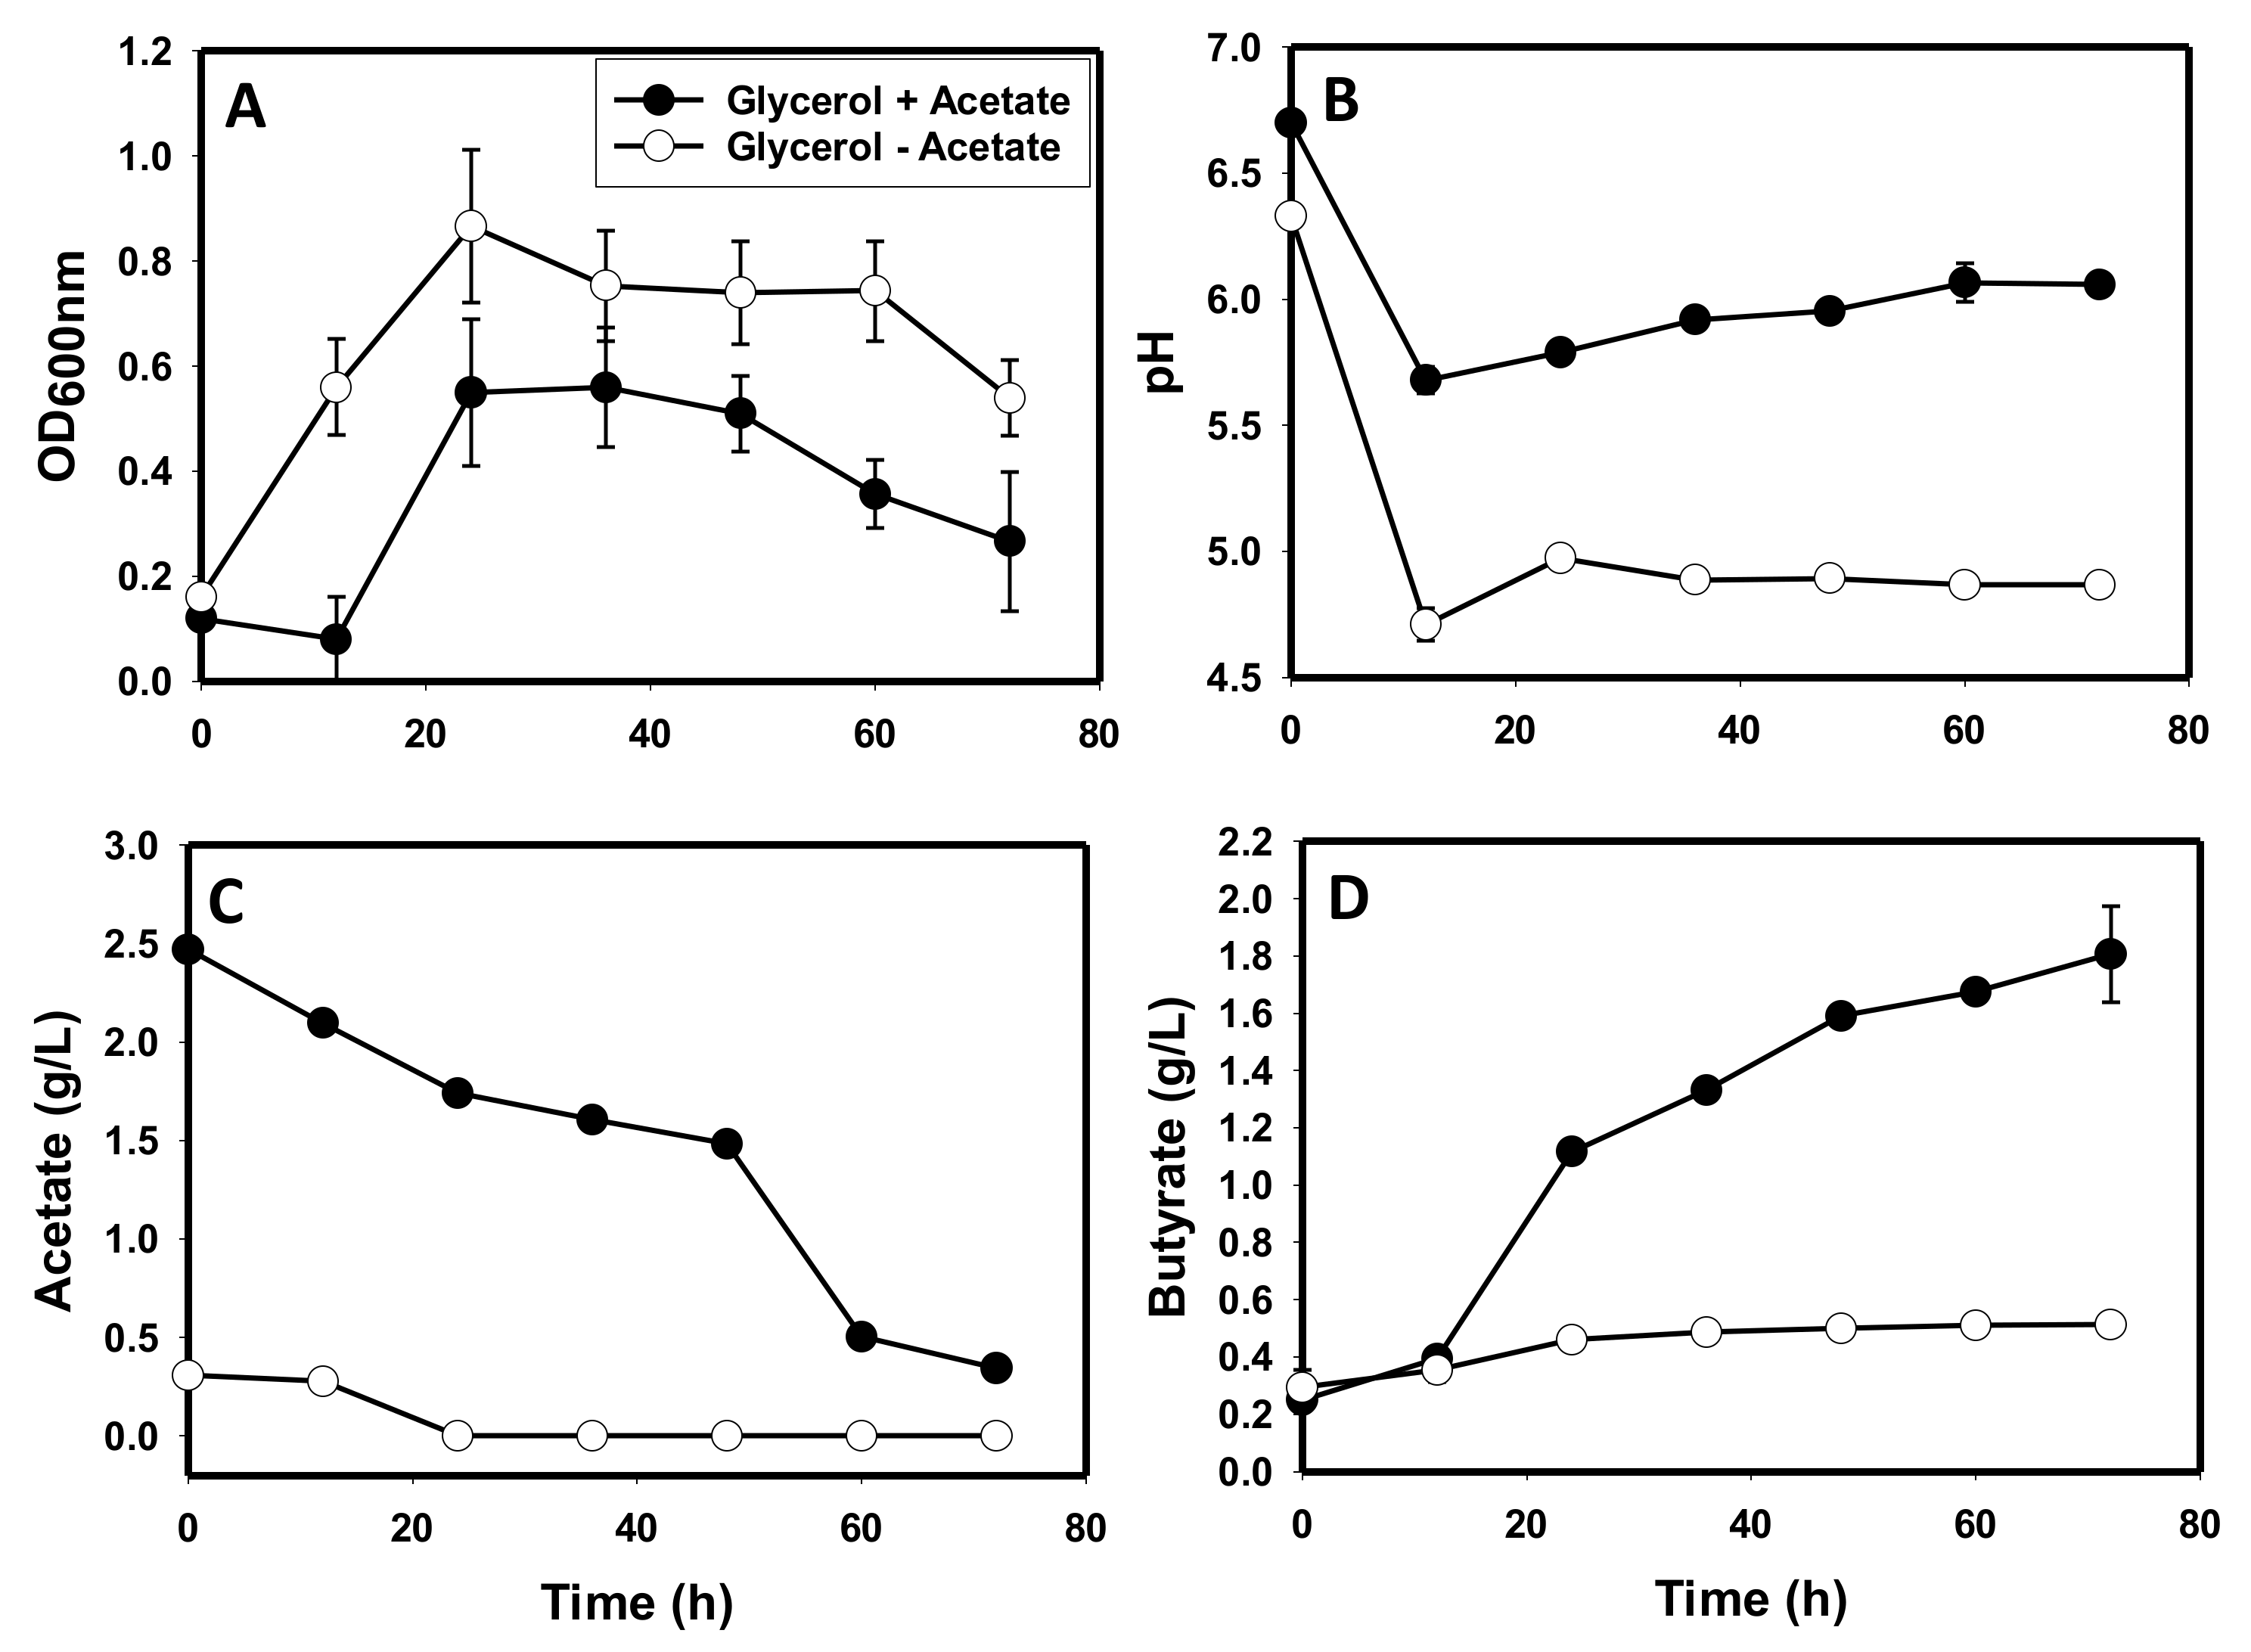
3.4. Glycerol and Glucose Utilization Profiles of C. beijerinckii

The glycerol and glucose utilization profiles of C. beijerinckii are presented in Table 3. As expected, glycerol was poorly utilized by this organism. Overall, C. beijerinckii utilized ~3.30–5.30 g/L glycerol, whilst consuming 39.1~46 g/L glucose. The presence of acetate in the fermentation medium marginally enhanced glycerol utilization 1.1-fold, relative to cultures not supplemented with acetate. Whereas addition of high acid (acetate and butyrate) concentrations in the fermentation medium at 0 h increased glucose consumption ~1.2-fold, no significant difference in glycerol utilization was observed for similarly treated glycerol-based fermentations. Furthermore, lower glycerol concentrations (12, 20, and 36.1 g/L) did not relieve poor glycerol utilization, when compared to cultures grown on 60 g/L glycerol.

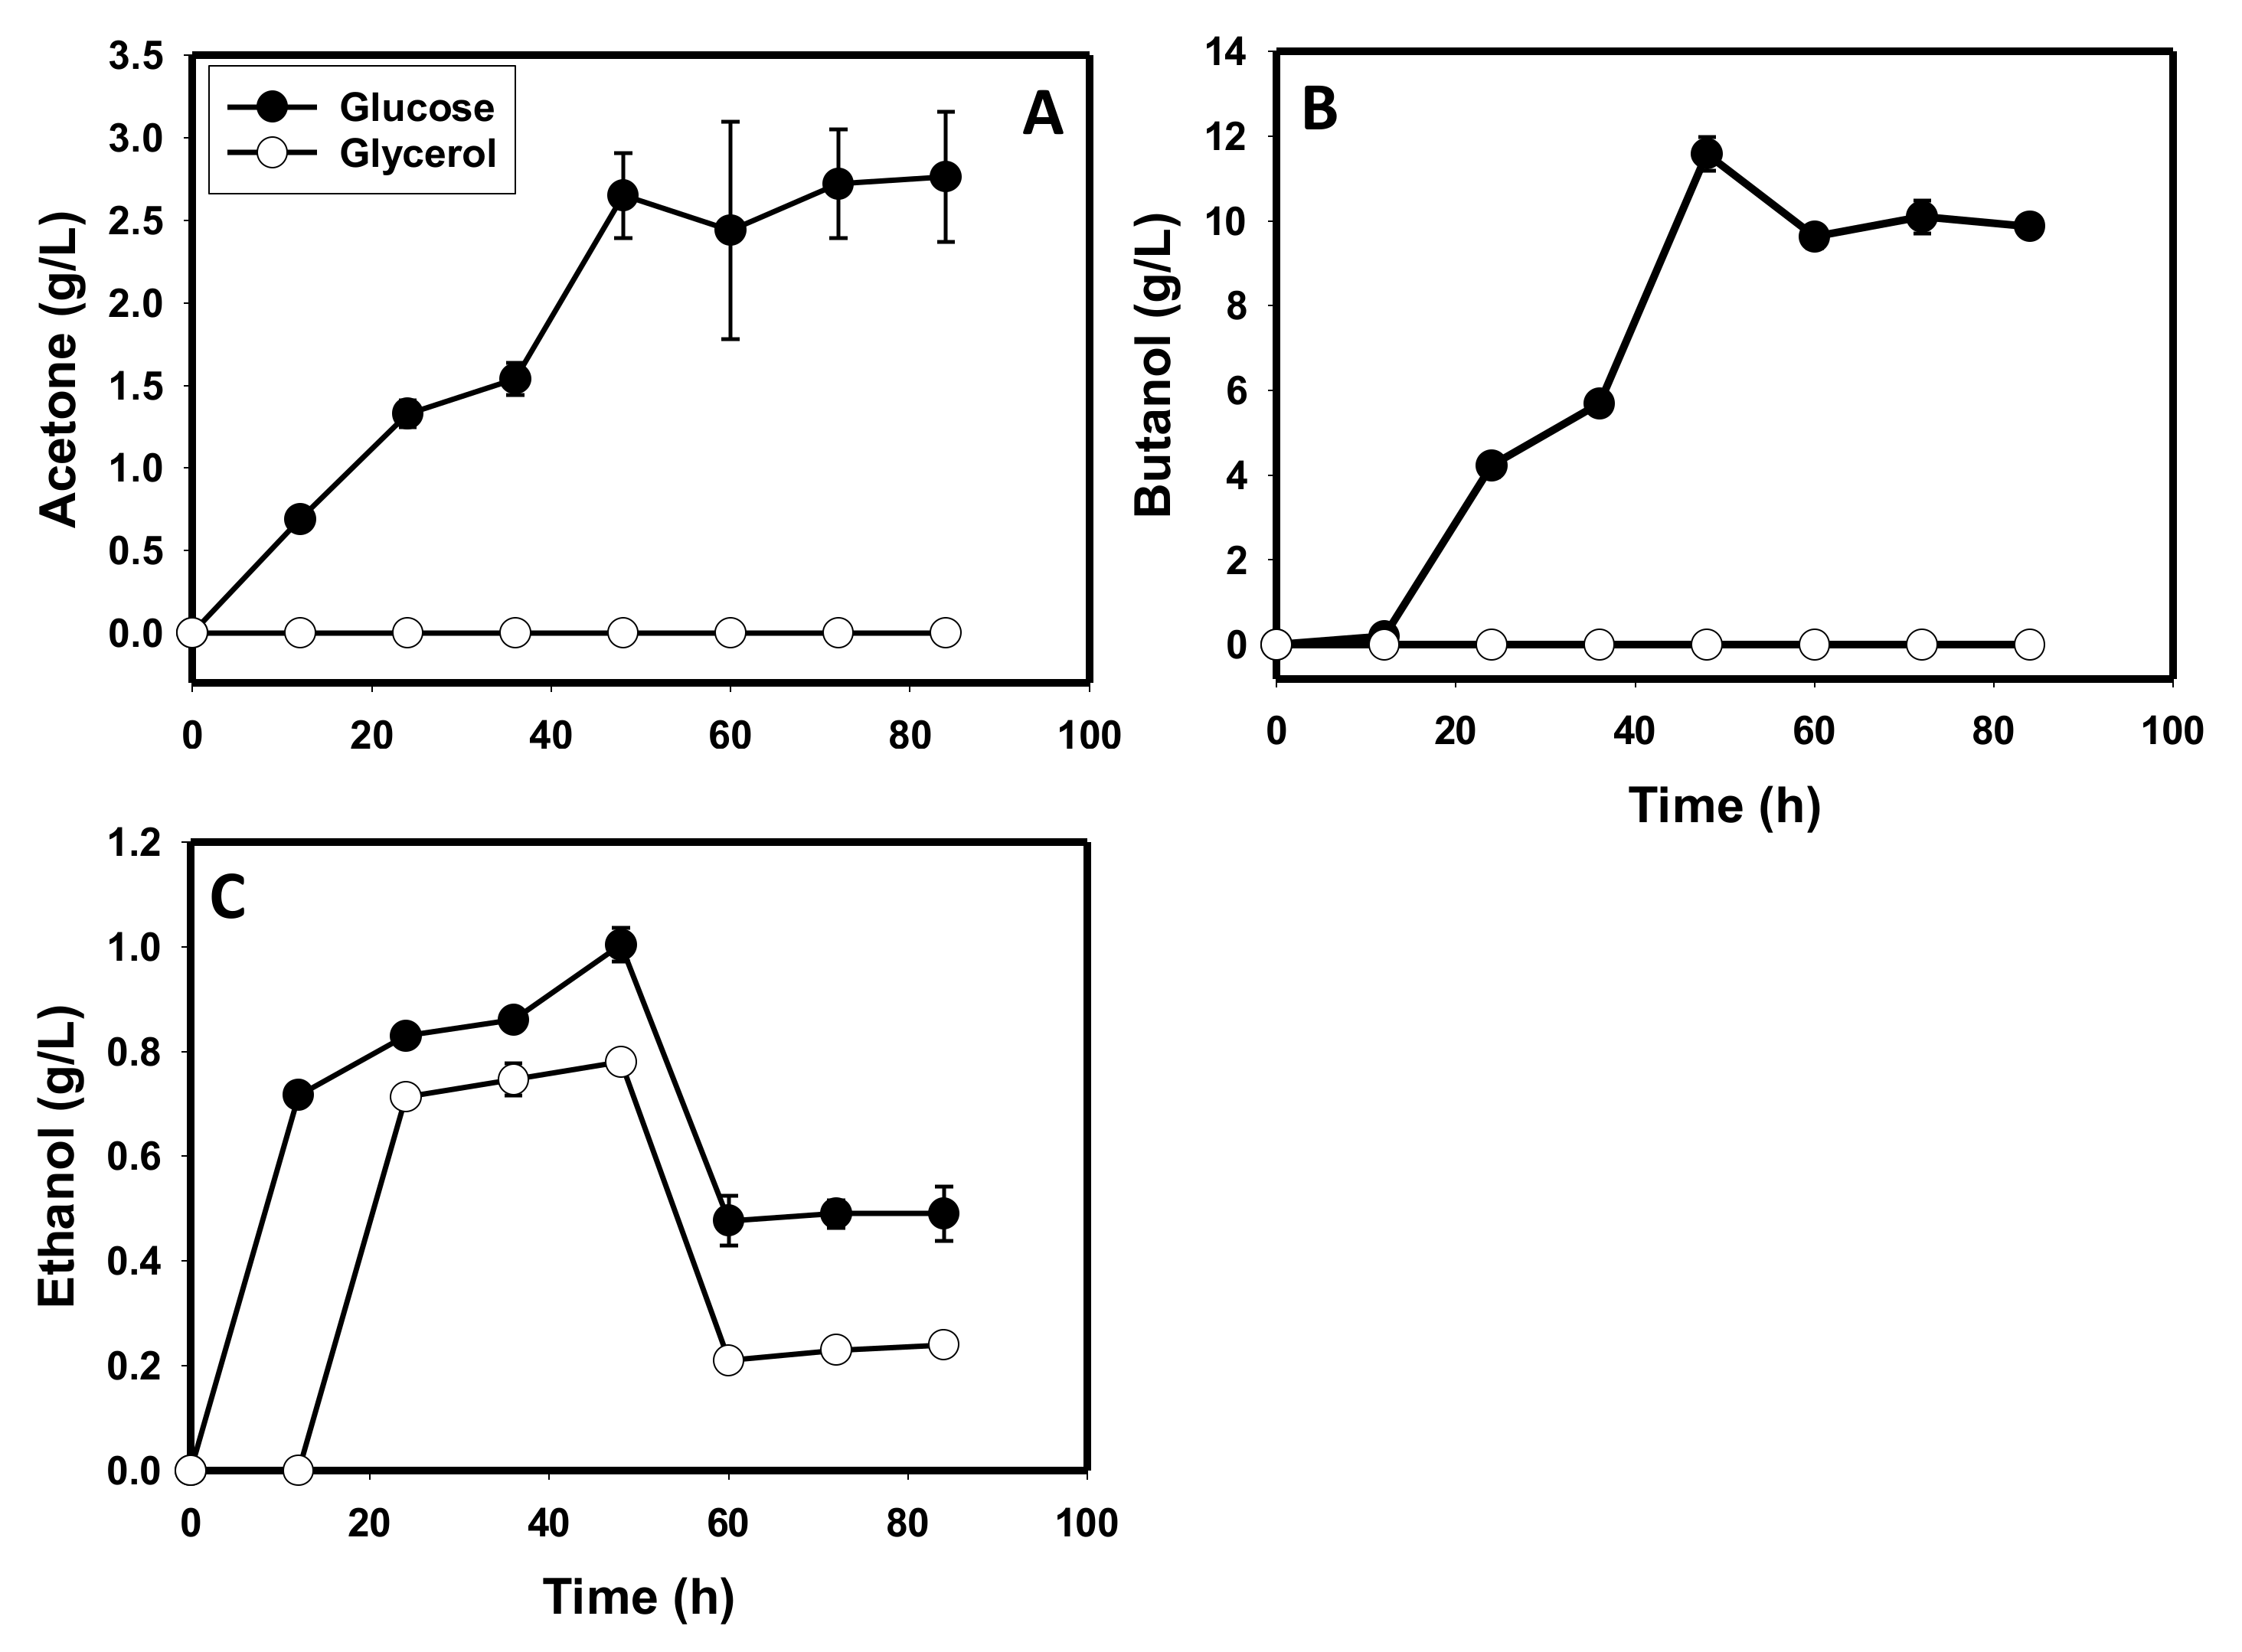
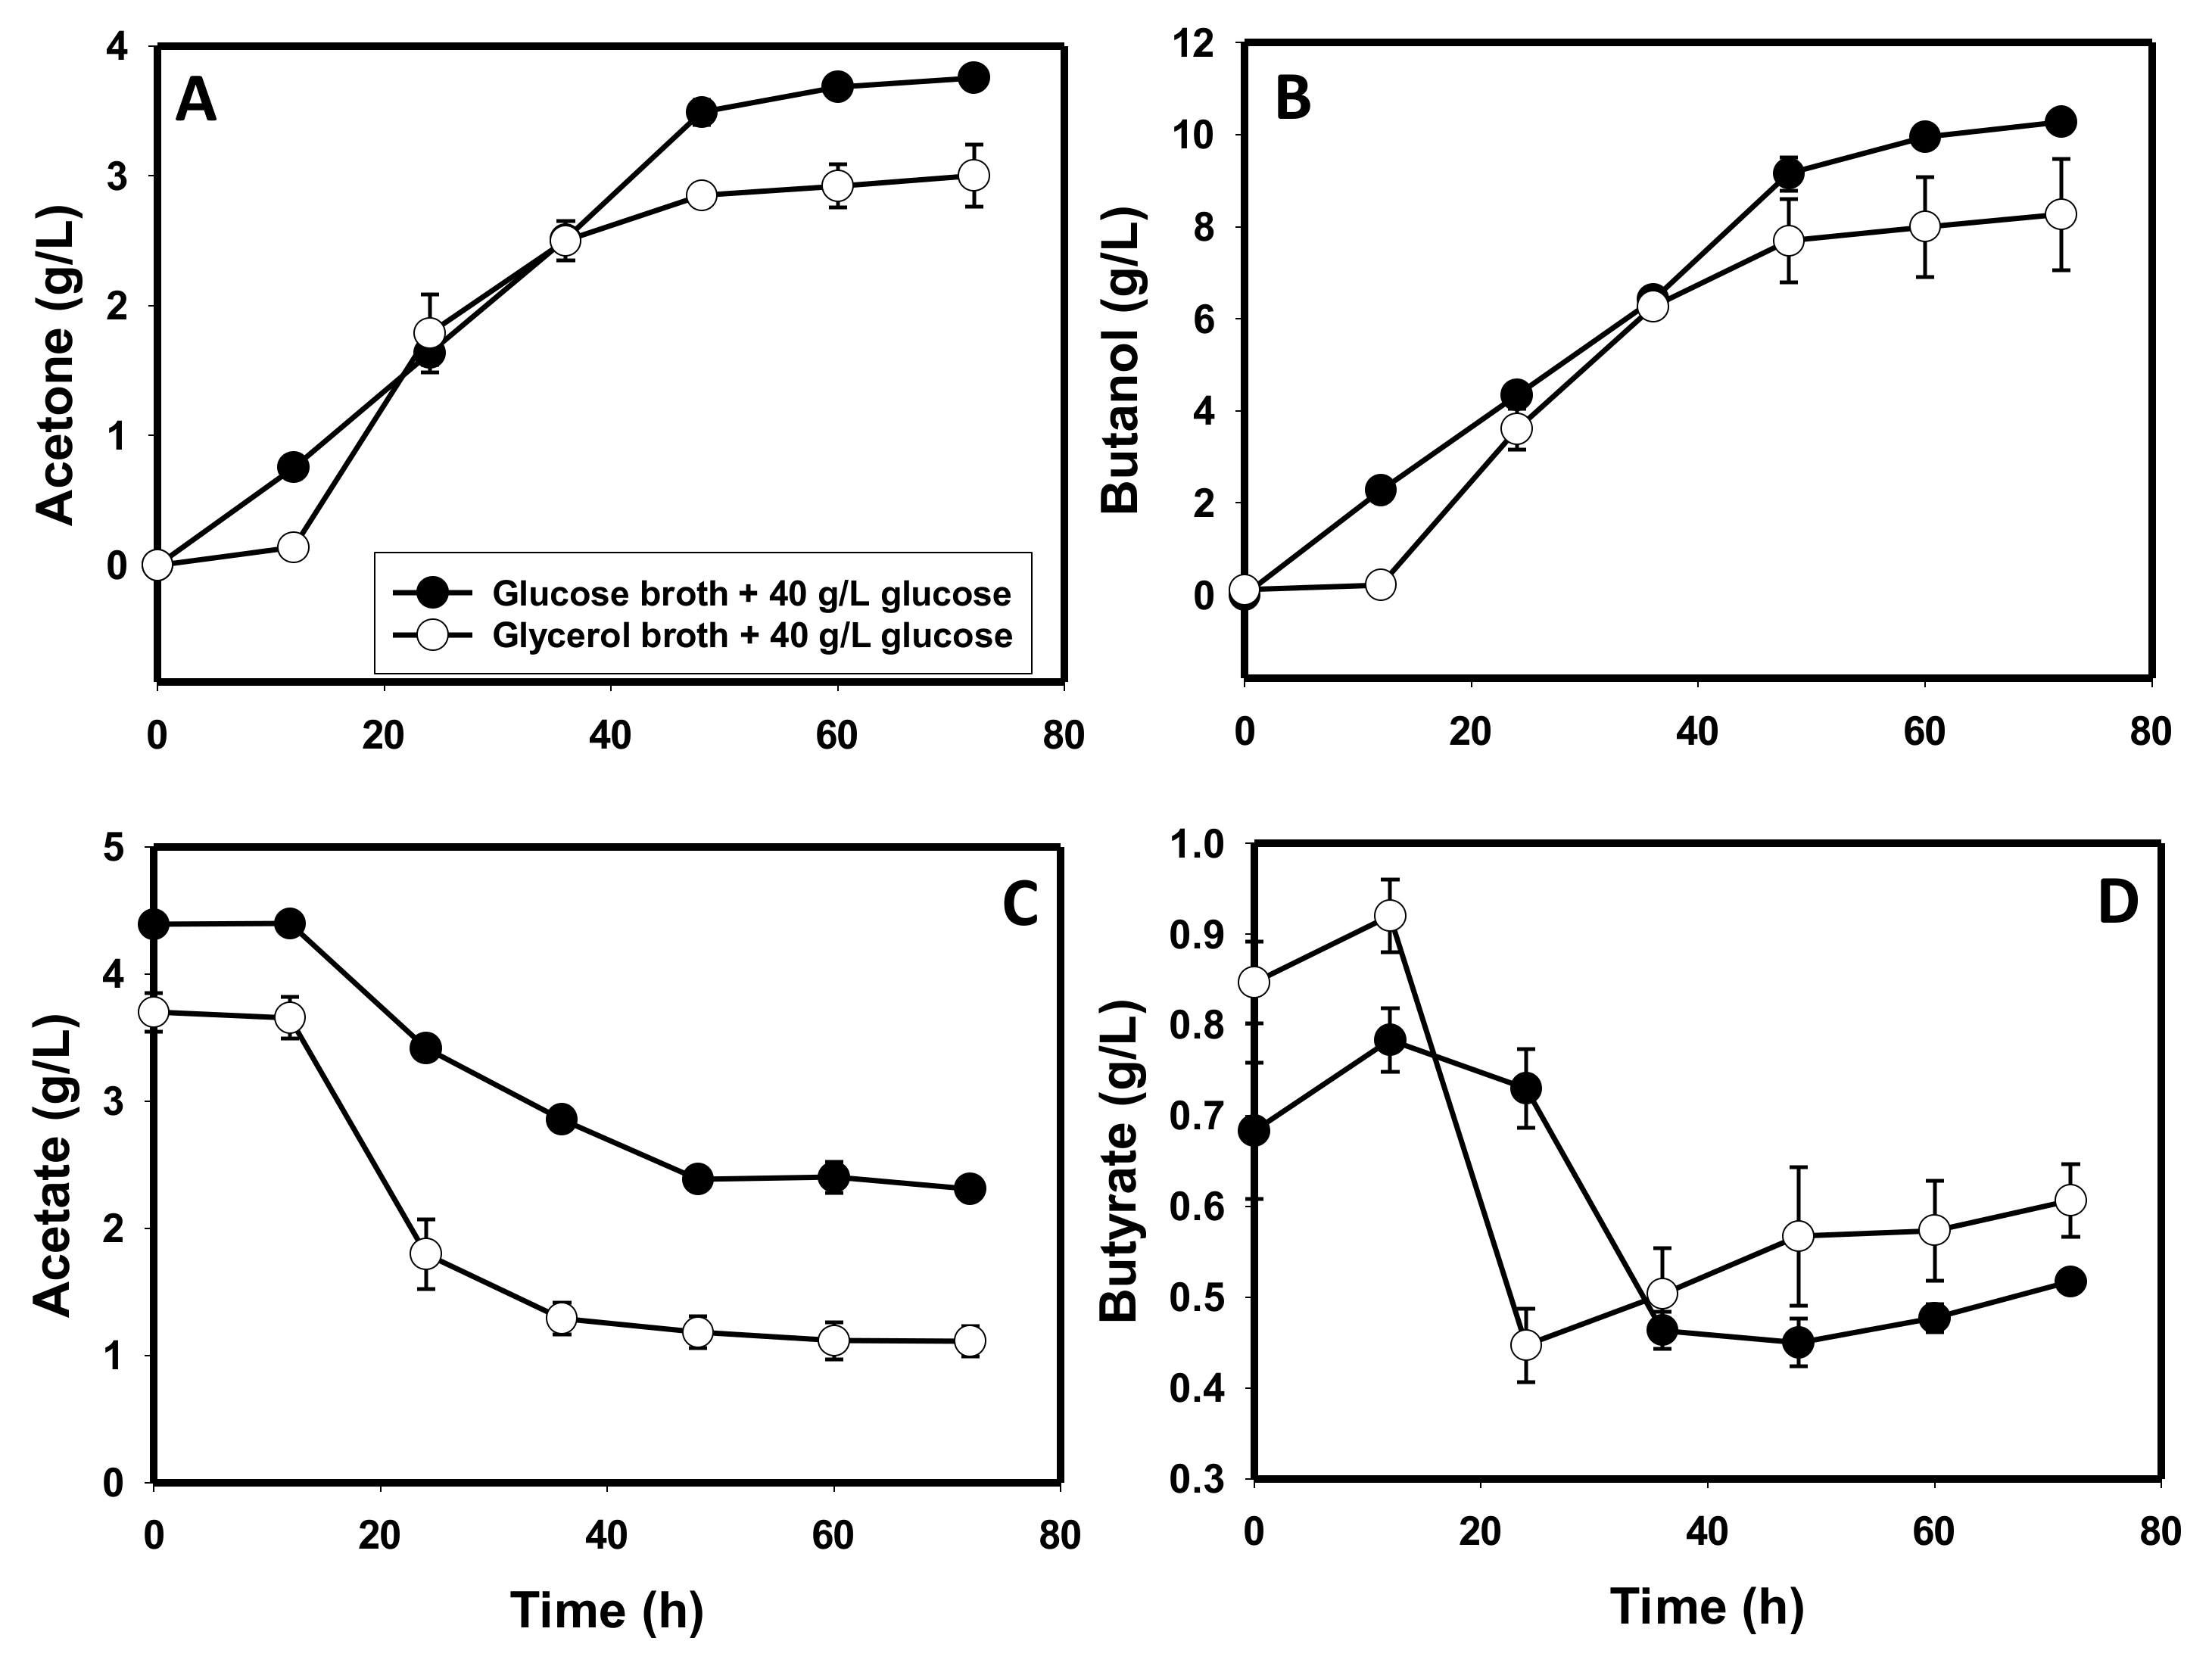
3.5. The Metabolite Profiles of Glycerol-versus Glucose-Grown Cells of C. beijerinckii

As depicted in Table S1, methylglyoxal and 3-hydroxypropionaldehyde were not detected in cultures of C. beijerinckii grown on glycerol as a sole carbon source (both in the cell and broth extracts), with or without acetate supplementation, under the conditions studied. However, crotonaldehyde, a carcinogen with the capacity to damage DNA and proteins [36,37,38] was detected in cell (biomass) extracts of C. beijerinckii grown on glycerol supplemented with acetate, but not in glycerol-grown cells without acetate supplementation or in glucose-grown cultures (with or without acetate supplementation). Furthermore, whereas tetradecanoic (myristic) acid, n-hexadecanoic acid and hexadecenoic acid, methyl ester were detected in the cell extracts of C. beijerinckii grown on either glycerol or glucose, hexadecenoic (palmitic) acid, butyl ester and cyclopentaneundecanoic acid, methyl ester were detected only in cell extracts of cultures grown on glucose as a sole carbon source (Table S1).

4. Discussion

In this study, we conducted an extensive characterization of the behavior of C. beijerinckii grown on glycerol as a sole carbon source. This includes evaluation of select enzyme activities and gene expression profiles, investigation of solvent profiles under different culture conditions, and the presence of key intracellular and extracellular metabolites associated with growth on glycerol as a sole carbon source. To the best of our knowledge, this is the first demonstration of butanol and acetone production by C. beijerinckii (NCIMB 8052) during growth on glycerol as a sole carbon source. Our results suggest that growth on glycerol as a sole carbon source exerts wide ranging deleterious effects on the overall physiology and metabolism of C. beijerinckii. Hence, for clarity, different aspects of the findings of this study are discussed separately.

4.1. Production of Toxic Metabolites and Likely Impaired Construction of Membrane Architecture during Growth on Glycerol

C. beijerinckii showed no obvious inhibition during the first 3–6 h of growth in P2 medium with glycerol as the sole carbon source, however, growth stalled afterwards. This raises the question as to whether a toxic glycerol-derived metabolic intermediate accumulates during growth on glycerol as a sole carbon source. Based on the glycerol dissimilatory pathways leading to 1,3-PDO and 1,2-PDO (Figure S4), the most apparent likely toxic intermediates that may accumulate in cultures of glycerol-grown C. beijerinckii are 3-hydroxypropinaldehyde and methylglyoxal. However, both metabolites were not detected in the broth and cell extracts of C. beijerinckii grown solely on glycerol. Furthermore, fresh inoculation of C. beijerinckii in glucose-supplemented (40 g/L) glycerol broth in which the same organism was pre-grown for 24 h resulted in 1.4-fold greater cell biomass accumulation than in the glucose only control cultures (Figure S1). The toxicity of 3-hydroxypropinaldehyde stems from its ability to induce oxidative stress by modifying thiol groups in a broad range of cellular targets [39]. Consequently, cysteine has been shown to mitigate 3-hydroxypropinaldehyde-mediated stresses in E. coli and C. difficile [39]. However, in the current study, cysteine supplementation neither relieved the poor growth of C. beijerinckii on glycerol, nor the inability to produce butanol and acetone (Figure 4). Additionally, there were no discernible differences in the acetate, butyrate and pH profiles of cysteine-supplemented cultures, relative to the controls without cysteine (Figure 4). Collectively these results suggest that accumulation of neither 3-hydroxypropinaldehyde nor methylglyoxal is responsible for the poor growth and solvent profiles of C. beijerinckii on glycerol as a sole carbon source.
Whereas 3-hydroxypropionaldehyde and methylglyoxal were not detected in glycerol-grown cultures, crotonaldehyde was found to be present in acetate-supplemented cultures grown solely on glycerol (Table S1). Crotonaldehyde is a genotoxic and carcinogenic unsaturated aldehyde that also interferes with membrane formation in eukaryotic cells [36,37,38,40,41]. The fact that crotonaldehyde was not detected in glycerol-grown acetate un-supplemented cultures—which grew only slightly better than the acetate-supplemented cultures (Figure 3A)—suggests that other factors beyond crotonaldehyde production contribute to the poor growth of C. beijerinckii on glycerol. Indeed, additional studies are required to determine if and how crotonaldehyde production likely affects C. beijerinckii grown on acetate-supplemented glycerol. Nonetheless, it is worthy of mention that despite utilizing slightly more (1.1-fold) glycerol than the cultures not supplemented with acetate (Table 3), the acetate-supplemented cultures produced 1.5-fold less biomass (Figure 3A), which perhaps, highlights the presence of an added stressor (such as crotonaldehyde) in the acetate-supplemented cultures.
Interestingly, both the acetate-supplemented and un-supplemented cultures exhibited a narrower profile of saturated long chain fatty acids, when compared to glucose-grown cultures (Table S1). Specifically, palmitic acid, butyl ester (C20) and cyclopentaneundecanoic acid, methyl ester (C17) were detected only in the extracts of cells grown on glucose as a sole carbon source. All organisms depend on biological membranes to shield their cellular constituents from the outside environment and the functions of these membranes are dictated by their architecture, which is mediated by their fatty acid composition [42,43]. This is particularly important in bacteria that continually modify their cell membrane architecture in response to changing environmental cues. For instance, in C. acetobutylicum, the saturated fatty acid composition of the cell membrane increases with an increase in alcoholic solvent concentrations (including butanol) and with a decrease in pH [44]. Furthermore, the amounts of cyclopropane fatty acids (which are considerably similar to cyclopentaneundecanoic acid, methyl ester detected in this study only in glucose-grown butanol producing cultures) in the membrane of C. acetobutylicum increased with decreasing pH. Similarly, a solvent-tolerant hyper-butanol producing strain of C. beijerinckii accumulated higher amounts of saturated fatty acids including palmitic acid (C16) and stearic acid (C18) in the cell membrane, relative to the wildtype with a less robust butanol-producing capacity [45]. It is well documented that an increase in saturated fatty acid profiles increases resistance to longer chain hydrophobic alcohols such as butanol and organic acids that exert a membrane-permeabilizing effect on bacteria [46,47,48]. This is because, greater amounts of saturated fatty acids in the cell membrane minimize membrane fluidity, thereby relieving solvent toxicity [45].
We speculate that the absence of both palmitic acid, butyl ester and cyclopentaneundecanoic acid, methyl ester in glycerol-grown cells is responsible for the vastly different textures observed with both sets of dry cell biomass samples during sample preparation for GC-MS. Specifically, the glycerol-grown cells exhibited a fragile texture, thus, they crumbled seamlessly whereas the glucose-grown cells were rubbery and much harder to breakdown. It is possible that the fragility of glycerol-grown cells reduced tolerance to butyrate; the major compound that accumulated in these cultures. In nearly all conditions studied, glycerol-grown cultures accumulated higher butyrate concentrations. However, in most cases, they had a higher pH than glucose-grown cultures that accumulated lower butyrate concentrations, but greater total acid (acetate + butyrate), hence, exhibited a lower pH profile. Nonetheless, the glucose-grown cultures showed more robust growth. Therefore, it is likely that the absence of an important protective component of the cell membrane in the form of saturated long chain fatty acids might render glycerol-grown cells more susceptible to lower butyrate concentrations. We also speculate that this phenomenon may contribute to the lack of, or low butanol production observed with glycerol as a sole carbon source. Given the chaotropic nature of butanol [49], a porous cell membrane—that is devoid of saturated long chain fatty acids required for tolerance to solvents and acids—may be a likely signal to terminate or repress the metabolic machinery for ABE (particularly, butanol) production during growth on glycerol. It is not clear though, how such a signal might orchestrate termination or repression of butanol biosynthesis. Therefore, we are deploying global transcriptome and proteome analysis to better delineate a wider range of the molecular and biochemical underpinnings of the behavior of glycerol-grown C. beijerinckii. Further, the underlying reason for the absence of both saturated fatty acids in cells grown solely on glycerol is not clear. However, given the poor growth on glycerol, particularly, inability to synthesize acetate (Figure 3C), which is crucial for replenishing acetyl-CoA—an important precursor of fatty acids [42]—might at least in part, account for this trend. Additionally, as discussed later, another possibility that is deserving of mention and worthy of further examination is inhibition of specific enzymes or genes by glycerol or glycerol-derived catabolic intermediates, which perhaps affects biosynthesis of saturated fatty acids during growth on glycerol.

4.2. Inefficient NADH Re-Oxidation

Our results suggest that inadequate NADH re-oxidation might contribute to a wider range of complex challenges posed by glycerol catabolism to C. beijerinckii. Butanol (biosynthesis) is an important electron acceptor in solventogenic Clostridium species (Figure 9). In the absence of butanol production during growth on glycerol as a sole carbon source, coupled with greater NADH generation than on glucose [1,3,4,11,12], glycerol-grown cells would likely undergo redox crisis. However, it is important to note that if NADH accumulates in glycerol-grown cells, this should promote butanol biosynthesis, especially in glycerol-grown cultures without acetate supplementation in which the culture pH dropped to as low as 4.9 (Figure 3B)—a pH value that normally triggers solventogenesis. Remarkably, this did not lead to solventogenesis, particularly acetone and butanol production. Notably, aside from the absence of butanol production in standard glycerol-based P2 medium, ethanol production—another outlet for NADH re-oxidation (Figure 9)—did not improve in glycerol grown cultures. In fact, ethanol production reduced 1.3-fold with glycerol relative to glucose (Figure 2C). These results point to a strong overriding factor that may be linked to the altered cell membrane architecture during growth on glycerol (discussed above). Alternatively, as mentioned earlier, glycerol catabolism might release an uncharacterized metabolic intermediate(s) that directly impair the activities/expression of solvent-producing enzymes/genes. In the absence of butanol biosynthesis, C. beijerinckii appears to recruit butyric acid production for NADH re-oxidation.
Upon careful examination, the acid profiles of glycerol-grown cultures suggest that acetate is absorbed in glycerol-grown cultures for butyrate biosynthesis. As depicted in Figure 3C,D, when acetate is supplemented in the growth medium, acetate concentration reduced 7.3-fold (from 2.47 to 0.34 g/L). In acetate un-supplemented cultures, however, acetate reduced from 0.31 to 0.0 g/L. Clearly, after the acetate that was carried over from the preculture was exhausted, acetate was not produced in the acetate un-supplemented glycerol-grown cultures. Concomitantly, butyrate concentrations increased from 0.25 to 1.81 g/L and from 0.29 to 0.51 g/L, respectively, in the acetate-supplemented and un-supplemented cultures. What these figures indicate is that only a fraction of the butyrate in the glycerol-grown cultures is produced directly from glycerol catabolism. By absorbing exogenously supplied acetate in the culture medium and funneling it through a truncated ABE pathway (leading to butyrate biosynthesis), glycerol-grown C. beijerinckii appears to use pre-synthesized acetate to drive butyrate production, which consumes 2 molecules of NADH (Figure 9; [50]). Mathematically, with a final butyrate concentration of 1.81 g/L in the acetate-supplemented glycerol-grown cultures (having absorbed 2.13 g/L acetate) and 0.51 g/L in the acetate un-supplemented cultures (having absorbed 0.31 g/L acetate), glycerol-grown cells utilized ~59.0% and 30.4% exogenously supplied acetate for butyrate biosynthesis, respectively (Figure 3C,D). Hence, we speculate that acetate conversion to butyrate likely relieves redox crisis in glycerol-grown C. beijerinckii, such that, in the absence of butanol biosynthesis, this strategy deploys externally supplied acetate to dispose of glycerol-derived NADH. The disparity in the percentage amounts of acetate consumed in the acetate supplemented (~59.0%) and un-supplemented (30.4%) cultures perhaps, accounts for the greater reduction in pH in the acetate un-supplemented cultures (1.3-fold) than in the acetate-supplemented cultures (1.1-fold; Figure 3B). Even though the acetate-supplemented cultures contained a greater amount of residual acids, it appears there was greater net change in acidity in the cultures not supplemented with acetate.
The acetate and butyrate profiles of furfural- and butyraldehyde-supplemented cultures grown solely on glycerol (Figure 4C,D and Figure 7C,D) further support the notion that acetate reabsorption is used to circumvent NADH-related redox stresses via conversion to butyrate. Both furfural and butyraldehyde are reduced to their respective alcohols using NAD(P)H as electron donor. Thus, in the presence of these aldehydes, glycerol-grown C. beijerinckii should consume a fair amount of NADH, which in turn, reduces the need for acetate reabsorption. With furfural (1 g/L) supplementation, acetate concentrations decreased 2.5-fold, whilst reducing 5.3-fold without furfural (Figure 4C). In fact, furfural-supplemented cultures contained twice the amount of acetate detected in the furfural un-supplemented cultures. Additionally, butyrate concentration increased 8.4- and 6.8-fold with and without furfural supplementation, respectively (Figure 4D). Lower acetate and higher butyrate concentrations in the furfural-supplemented cultures suggest that additional butyrate is produced from glycerol catabolism in the presence of furfural. Previously, we have shown that the presence of furfural, which negatively affects cellular ATP levels, increases acetate and butyrate production in C. beijerinckii, as a measure to replenish cellular ATP (Figure 9; [4]).
With acetate production being impaired on glycerol as a sole carbon source, it appears C. beijerinckii increased butyrate biosynthesis from glycerol catabolism as a strategy to improve ATP generation in response to furfural-mediated stresses. Thus, we reasoned that butyraldehyde, a native metabolic intermediated in C. beijerinckii, which is reduced to butanol (Figure 9), should pose less stress to this organism when supplied exogenously. Notably, butyraldehyde (3 g/L) supplementation led to the production of only ~0.1 g/L butanol on glycerol as a sole carbon source (Figure 7B). It is likely that butyraldehyde is poorly taken up by C. beijerinckii, hence, the reason for poor conversion of exogenously supplied butyraldehyde to butanol. In addition, it is possible that butyraldehyde conversion to butanol is somewhat inhibited in glycerol-grown cells. Nonetheless, it is important to note that in glycerol-grown butyraldehyde un-supplemented cultures, acetate concentration reduced 1.3-fold, whilst increasing 1.1-fold in butyraldehyde-supplemented cultures (Figure 7C). Furthermore, butyrate concentration increased 1.3- and 2.0-fold with and without butyraldehyde supplementation (Figure 7D), and butyraldehyde-supplemented cultures had a 1.7-fold higher cell biomass (Figure 7A) than the un-supplemented cultures. Therefore, it appears that in NADH-consuming aldehyde reduction particularly, the less toxic butyraldehyde dampens the need for acetate absorption in glycerol-grown C. beijerinckii (Figure 7D). In fact, butyraldehyde appears to mildly elicit acetate production on glycerol as a sole carbon source, whilst dampening butyrate production (Figure 7C,D).
The inability of C. beijerinckii to completely convert the supplied 3 g/L butyraldehyde to butanol in glycerol-grown cultures points to additional, perhaps, NADH-unrelated limitations during growth on glycerol as a sole carbon source. Clearly, some form of impediment exists at the butyric acid-butyraldehyde-butanol and the acetyl-CoA—acetyl-phosphate—acetate—acetone arms of the ABE pathway, when C. beijerinckii is grown solely on glycerol. The fermentation profiles of cultures grown on a glucose–glycerol mixture and those grown on glucose alone (Figure 5 and Figure S1A), further highlight the impaired ability of C. beijerinckii to produce acetate, acetone and butanol in the presence of glycerol. For example, despite achieving a 1.4-fold higher optical density (Figure S1), cultures grown on the glucose–glycerol mixture produced 1.3- and 1.2-fold reduced amounts of acetone and butanol, respectively, compared to the cultures grown on glucose alone (Figure 5A,B). Similarly, acetate concentrations decreased 1.9- and 3.4-fold in glucose-only and glucose-glycerol cultures, respectively (Figure 5C). This implies that even in the presence of glucose, growth on glycerol elicits a strong acetate absorption, perhaps to aid the disposal of excess glycerol-derived NADH, which may account for the 1.2-fold higher residual butyrate in glucose-glycerol cultures, when compared to the glucose-only cultures (Figure 5D).

4.3. Glycerol-Mediated Gene and Enzyme Inhibitions and the Attendant Solvent Profiles

The expression patterns observed for the genes assayed by qRT-PCR clearly show that acetate supplementation is essential for the cellular health of C. beijerinckii. This was more pronounced in glycerol-grown cells, in which a greater number of genes showed significant decreases in relative expression in the absence of acetate (Table 2). This is not surprising as acetate supplementation has been previously reported to enhance overall growth and solvent production by C. beijerinckii and C. acetobutylicum EA 2018 [51,52]. The relative expression of gldA and dhaK in glycerol-grown cells both at 12 and 24 h, relative to cells grown on glucose are indicative of greater flux via the glycerol catabolic pathway on glycerol as a sole carbon source (Figure 9; Table 2). This, therefore, suggests that a likely impediment to glycerol utilization lies downstream of the GldA- and DhaK-catalyzed steps. A possible candidate for such an impediment to flux during growth on glycerol is triosephosphate isomerase (Tpi). The expression level of tpiA (subunit A) in glycerol-grown cells was 1.7-fold greater than the relative expression in glucose-grown cells at 12 h (Table 2). However, even though the expression level increased at 24 h for both sets of cultures, it was ~1.7-fold lower in the glycerol-grown less than in the glucose-grown cells, representing a total reversal of comparative expression patterns for this gene between glycerol- and glucose-grown cells at 12 h. More importantly, this is indicative of greater glycolytic flux with glucose than with glycerol (Figure 9). Interestingly, at 12 h, there was no significant difference in the expression profiles of gapdh-1 between glycerol- and glucose-grown cells, with acetate supplementation. However, at 24 h, relative expression of the same gene was 1.5-fold higher in the glucose-grown cells. Again, this represents another indication of reduced glycolytic flux in the glycerol-grown cells as fermentation progressed. GAPDH is NAD+-dependent, thus, it is likely that increased NADH pool from glycerol catabolism [1,3,4,11,12] might account for reduced expression of the gapdh gene in the glycerol-grown cells over the course of fermentation. This might explain the observed 1.5- and ~2.0-fold increases in the expression of gapdh-N1 and gapdh-N2 (Table 2), both of which are NADP+-dependent at 24 h, in the glycerol-grown cells, compared to the glucose-grown cells.
Except for bdhA, which was upregulated, all solventogenic genes studied [ctfA (2 copies), ctfB (2 copies) and adhE] were significantly downregulated at 12 h in glycerol-grown cells, relative to cells grown on glucose (Table 2). The high expression levels observed for these genes (except bdhA) in glucose-grown cells is characteristic of the onset of solventogenesis, which is apparently absent in the glycerol-grown cells at 12 h. Interestingly, with acetate supplementation, all the solventogenic genes studied were upregulated at 24 h with glycerol as a substrate, compared to glucose-grown cells. This suggests that the signal for inception of solventogenesis might be delayed in glycerol-grown cells. Notably, the degrees of upregulation observed for these genes (in glycerol-grown cells at 24 h) were significantly less than the levels observed with glucose-grown cells at 12 h. This further buttresses possible overall sluggish growth on glycerol as a sole carbon source. However, it is worthy of note that despite the slow growth observed with glycerol, the culture pH in most cases were low enough to trigger solventogenesis. Thus, other factors unrelated to poor growth likely inhibit solventogenesis in glycerol-grown C. beijerinckii. In addition, despite marginal upregulation of solventogenic genes at 24 h, acetone and butanol were not produced in glycerol-grown cells, except with the supplementation of butyraldehyde (~0.1 g/L butanol; Figure 7B) and excess butyrate (0.7 g/L acetone and 0.5 g/L butanol; Figure 6A,B). More importantly, BDH, BDDH, CoAT and ACDC activities were either greater in the glycerol-grown cells, or considerably similar to the activities observed with lysates from glucose-grown cells, with or without 0.6 g/L glycerol supplementation in the assay mixture (Figure 8A,C–E).
There is clear incongruity in the activities of these enzymes in vitro relative to their activities in vivo (based on the solvent profiles), which suggests that an unknown mechanism might inhibit solventogenesis in C. beijerinckii grown on glycerol as a sole carbon source. The existence of such a mechanism is buttressed by the transience and weakness of acetone and/or butanol biosynthesis in glycerol-grown cultures supplemented with either butyraldehyde or excess butyrate. Both butyraldehyde and butyrate induced acetone and/or butanol biosynthesis, which terminated shortly after inception A,B and Figure 7B). Although the permeability of the cell membrane of C. beijerinckii to butyraldehyde is not known, this organism has an established mechanism for butyrate uptake. As a result, supplementation of butyrate (3.5 g/L) in glucose-grown cells led to the production of 20 g/L butanol (Figure 6B). Conversely, the glycerol-grown cells supplemented with the same concentration of butyrate produced 0.5 g/L butanol, thus, underscoring a likely metabolic inhibition of solventogenesis in glycerol-grown C. beijerinckii.
Progressive accumulation of butyrate in glycerol-containing cultures (even when glycerol is supplied alongside glucose; Figure 5D) leads us to speculate that coenzyme A transferases—which are also central to acetone biosynthesis (Figure 9; [53])—are in some way, inhibited in vivo in glycerol-grown cultures, transcriptionally and/or post-translationally (Table 2, Figure 8D). When glucose was supplemented to a glycerol broth in which C. beijerinckii was previously grown, butyrate concentration fell sharply in the early stages of fermentation, when glucose should be abundant in the medium (Figure 5D). However, as fermentation progressed, glucose concentration reduced sharply in these cultures, while a higher concentration of glycerol persisted in the medium. Remarkably, butyrate concentration increased over time in these cultures (glucose–glycerol mixture), starting at 36 h up to the end of fermentation. Indeed, in vivo, the CoAT activity is somehow disrupted if not completely inhibited in glycerol-grown cells, which impedes acetone and butanol biosynthesis. Relative expression of ctfAB suggests that the expression of the genes that encode the components of the heterodimeric coenzyme A transferase are not favored transcriptionally, despite considerably low culture pH—a known trigger for ctfAB expression [53]—in some glycerol-grown cultures. However, the CoAT assay suggests that this limitation extends beyond the transcriptional stage in vivo. This is because, even with 0.6 g/L glycerol, our enzyme assay showed that there was no significant difference in CoAT activity between glucose- and glycerol-grown cells. In fact, Wiesenborn et al. [53] demonstrated that 20% (v/v) glycerol stabilized the activity of purified CoAT in the closely related C. acetobutylicum ATC 824. Thus, it is unlikely that glycerol inhibited the activity of CoAT in vivo in glycerol-grown cells of C. beijerinckii. Perhaps, a metabolic intermediate of glycerol catabolism might account for this effect, which is probably mitigated allosterically when glycerol is co-utilized with glucose.
The inability of C. beijerinckii to produce butanol in particular, cannot be solely explained by lack of CoAT activity in vivo, during growth on glycerol as a sole carbon source. This is because, even when butyraldehyde is supplied in the medium, thereby bypassing the CoAT-catalyzed step of the ABE pathway, a transient and weak butanol production was also observed (Figure 7B). In fact, butanol production with butyraldehyde (~0.1 g/L) is 5-fold less than the concentration (0.5 g/L) observed with high butyrate supplementation (Figure 6B). Apparently, the same or different factors inhibit CoAT and BDH activity in glycerol-grown C. beijerinckii, because with butyraldehyde, acetone production (mediated by CoAT) appears to be completely inactive in vivo, whilst 0.7 g/L was produced with 3.5 g/L butyrate supplementation. Interestingly when glycerol concentration in the assay mixture was increased to 10 and 20 g/L using lysate from glycerol-grown C. beijerinckii, BDH activity decreased by at least ~2.0-fold, relative to the glycerol un-supplemented assay (Figure 8B). However, BDH activity remained unaffected with 10 and 20 g/L glycerol supplementation using lysate from glucose-grown cells. The fact that decreases were observed only in assays conducted with lysate from glycerol-grown cells raises the question as to whether some enzymes or perhaps, solventogenic enzymes in particular, undergo conformational changes that inhibit or significantly limit their activity during growth on glycerol as a sole carbon source. Purification and characterization of solventogenic enzymes from glycerol-grown C. beijerinckii will prove instructive towards understanding the reason for the disparity in activity observed for glycerol- and glucose-grown cells with 10 and 20 g/L glycerol.

5. Conclusions

The solvent and acid profiles of C. beijerinckii grown on glycerol as a sole carbon source show that acetate, acetone and butanol are not produced during glycerol fermentation. Glycerol-grown C. beijerinckii appears to rapidly couple acetate assimilation and butyrate biosynthesis, as a means to dispose of excess glycerol-derived NADH. Inability to synthesize saturated long chain fatty acids necessary for stabilizing the cell membrane architecture might account for lack of butanol biosynthesis and perhaps, poor resistance to the accumulated butyrate in glycerol-grown C. beijerinckii. The activities of solventogenic enzymes compared to their gene expression patterns point to a strong inhibition of solventogenesis in vivo, during growth on glycerol as a sole carbon source.

Supplementary Materials

The following supporting information can be downloaded at: https://www.mdpi.com/article/10.3390/fermentation8070339/s1, Figure S1: Optical density and culture pH of C. beijerinckii grown in culture broth following initial growth of the organism for 24 h on glycerol or glucose. A: optical density, B: culture pH; Figure S2: Optical density and culture pH of C. beijerinckii-pre-grown glycerol and glucose culture broths with additional supply of 40 g/L glucose. A: optical density, B: culture pH; Figure S3: Optical density, pH and ethanol profiles of C. beijerinckii grown on glycerol and glucose as a sole carbon source with the supply of 6 and 3.5 g/L acetate and butyrate. A: optical density, B: culture pH, C: ethanol profile; Figure S4: Possible pathways that may lead to accumulation of toxic intermediates in cultures of C. beijerinckii grown solely on glycerol; Table S1: List of compounds detected in cultures of C. beijerinckii grown on glycerol or glucose.

Author Contributions

This study was conceptualized by V.C.U. Experiments were designed and conducted by E.A.-D., V.C.U., S.K. and B.G. Results were analyzed and interpreted by V.C.U., E.A.-D. and S.K. V.C.U. wrote the manuscript. All authors have read and agreed to the published version of the manuscript.

Funding

Support for this study was provided by Office of the Vice Chancellor for Research and Graduate Education at the University of Wisconsin-Madison, with funding from the Wisconsin Alumni Research Foundation (WARF) and a USDA-National Institute of Food and Agriculture Hatch award (grant number: WIS04018) to V.C.U.

Institutional Review Board Statement

Not applicable.

Informed Consent Statement

Not applicable.

Conflicts of Interest

The authors declare no conflict of interest.

References

  1. Clomburg, J.M.; Ramon, G. Anaerobic fermentation of glycerol: A platform for renewable fuels and chemicals. Trends Biotechnol. 2013, 31, 20–28. [Google Scholar] [CrossRef] [PubMed] [Green Version]
  2. Xin, F.; Chen, T.; Jiang, Y.; Lu, J.; Dong, W.; Zhang, W.; Ma, J.; Zhang, M.; Jiang, M. Enhanced biobutanol production with high yield from crude glycerol by acetone uncoupled Clostridium sp. strain CT7. Bioresour. Technol. 2017, 244, 575–581. [Google Scholar] [CrossRef] [PubMed]
  3. Murarka, A.; Dharmadi, Y.; Yazdani, S.S.; Gonzalez, R. Fermentative Utilization of glycerol by Escherichia coli and its implications for the production of fuels and chemicals. Appl. Environ. Microbiol. 2008, 74, 1124–1135. [Google Scholar] [PubMed] [Green Version]
  4. Ujor, V.; Agu, C.V.; Gopalan, V.; Ezeji, T.C. Glycerol supplementation of the growth medium enhances in situ detoxification of furfural by Clostridium beijerinckii during butanol fermentation. Appl. Microbiol. Biotechnol. 2014, 98, 6511–6521. [Google Scholar] [CrossRef]
  5. Hirsch, R.L.; Bezdek, R.; Wendling, R. Peaking of World Oil Production and Its Mitigation. In Driving Climate Change; Sperling, D., Cannon, J.S., Eds.; Academic Press: Cambridge, MA, USA, 2007; pp. 9–27. [Google Scholar]
  6. Cheng, M.-H.; Huang, H.; Dien, B.S.; Singh, V. The costs of sugar production from different feedstocks and processing technologies. Biofuels Bioprod. Biorefining 2019, 13, 723–739. [Google Scholar] [CrossRef]
  7. Anitha, M.; Kamarudin, S.K.; Kofli, N.T. The potential of glycerol as a value-added commodity. Chem. Eng. J. 2016, 295, 119–130. [Google Scholar] [CrossRef]
  8. Mota, C.J.; Pinto, B.P.; de Lima, A.L. Glycerol Utilization. In Glycerol; Springer: New York, NY, USA, 2017; pp. 11–19. [Google Scholar]
  9. Vivek, N.; Sindhu, R.; Madhavan, A.; Anju, A.J.; Castro, E.; Faraco, F.; Pandey, A.; Binod, P. Recent advances in the production of value added chemicals and lipids utilizing biodiesel industry generated crude glycerol as a substrate–metabolic aspects, challenges and possibilities: An overview. Bioresour. Technol. 2017, 239, 507–517. [Google Scholar] [CrossRef]
  10. Yazdani, S.S.; Gonzalez, R. Anaerobic fermentation of glycerol: A path to economic viability for the biofuels industry. Curr. Opin. Biotechnol. 2007, 18, 213–219. [Google Scholar] [CrossRef]
  11. Neijssel, O.M.; Hueting, S.; Crabbendam, K.J.; Tempest, D.W. Dual pathways of glycerol assimilation in Klebsiella aerogenes NCIB 418. Arch. Microbiol. 1975, 104, 83–87. [Google Scholar] [CrossRef]
  12. Lin, E.C.C. Glycerol dissimilation and its regulation in bacteria. Annu. Rev. Microbiol. 1976, 30, 535–578. [Google Scholar] [CrossRef]
  13. Sarma, S.; Anand, A.; Dubey, V.K.; Moholka, V.S. Metabolic flux network analysis of hydrogen production from crude glycerol by Clostridium pasteurianum. Bioresour. Technol. 2017, 242, 169–177. [Google Scholar] [CrossRef]
  14. Palmqvist, E.; Almeida, J.S.; Hähn-Hägerdal, B. Influence of furfural on anaerobic glycolytic kinetics of Saccharomyces cerevisiae in batch culture. Biotechnol. Bioeng. 1999, 62, 447–454. [Google Scholar] [CrossRef]
  15. Palmqvist, E.; Hähn-Hägerdal, B. Fermentation of lignocellulosic hydrolysate. II: Inhibitors and mechanisms of inhibition. Bioresour. Technol. 2000, 74, 25–33. [Google Scholar] [CrossRef]
  16. Sávári, H.I.; Franzén, C.J.; Taherzadeh, M.J.; Niklasson, C.; Lidén, G. Effects of furfural on the respiratory metabolism of Saccharomyces cerevisiae in glucose-mediated chemostats. Appl. Environ. Microbiol. 2003, 69, 4076–4086. [Google Scholar]
  17. Bouvet, O.M.M.; Lenormand, P.; Ageron, E.; Grimont, P.A.D. Taxonomic diversity of anaerobic glycerol dissimilation in the Enterobacteriaceae. Res. Microbiol. 1995, 146, 279–290. [Google Scholar] [CrossRef]
  18. Booth, I.R. Glycerol and Methylglyoxal Metabolism. EcoSal Plus 2005, 1. [Google Scholar] [CrossRef] [PubMed]
  19. Agu, C.V.; Ujor, V.; Ezeji, T.C. Metabolic engineering of Clostridium beijerinckii to improve glycerol metabolism and furfural tolerance. Biotechnol. Biofuels 2019, 12, 50. [Google Scholar] [CrossRef] [PubMed] [Green Version]
  20. Ujor, V.C.; Lai, L.B.; Okonkwo, C.C.; Gopalan, V.; Ezeji, T.C. Ribozyme-Mediated downregulation uncovers DNA integrity scanning protein A (DisA) as a solventogenesis determinant in Clostridium beijerinckii. Front. Bioeng. Biotechnol. 2021, 9, 669462. [Google Scholar] [CrossRef]
  21. Sauvageot, N.; Gouffi, K.; Laplace, J.-M.; Auffray, Y. Glycerol metabolism in Lactobacillus collinoides: Production of 3-hydroxypropionaldehyde, a precursor of acrolein. Int. J. Food Microbiol. 2000, 55, 167–170. [Google Scholar] [CrossRef]
  22. Claisse, O.; Lonvaud-Funel, A. Detection of lactic acid bacteria producing 3-hydroxypropionaldehyde (acrolein precursor) from glycerol by molecular tests. Int. J. Dairy Sci. 2001, 81, 173–181. [Google Scholar]
  23. Vivek, N.; Hazeena, S.H.; Rajesh ROGodan, T.K.; Anjali, K.B.; Nair, L.M.; Mohan, B.; Nair, S.C.; Sindhu, R.; Pandey, A.; Binod, P. Genomics of lactic acid bacteria for glycerol dissimilation. Mol. Biotechnol. 2019, 61, 562–578. [Google Scholar] [CrossRef] [PubMed]
  24. Humphreys, F.B. Formation of acrolein from glycerol by B. welchii. J. Infect. Dis. 1924, 35, 282–290. [Google Scholar] [CrossRef]
  25. Voisenet, M.E. Sur un ferment, contenu dans les eaux, agent de déshydratation de la glycérine. Ann. Inst. Pasteur 1914, 28, 807–818. [Google Scholar]
  26. Hao, J.; Lin, R.; Zheng, Z.; Sun, Y.; Liu, D. 3-Hydroxypropionaldehyde guided glycerol feeding strategy in aerobic 1,3-propanediol production by Klebsiella pneumoniae. J. Ind. Microbiol. Biotechnol. 2008, 35, 1615–1624. [Google Scholar] [CrossRef] [PubMed]
  27. Liyanage, H.; Kashket, S.; Young, M.; Kashket, E.R. Clostridium beijerinckii and Clostridium difficile detoxify methylglyoxal by a novel mechanism involving glycerol dehydrogenase. Appl. Environ. Microbiol. 2001, 67, 2004–2010. [Google Scholar] [CrossRef] [Green Version]
  28. Inoue, Y.; Kimura, A. Methylglyoxal and regulation of its metabolism in microorganisms. In Advances in Microbial Physiology; Poole, R.K., Ed.; Academic Press: Cambridge, MA, USA, 1995; Volume 37, pp. 177–227. [Google Scholar]
  29. Kalapos, M.P. Methylglyoxal in living organisms: Chemistry, biochemistry, toxicology and biological implications. Toxicol. Lett. 1999, 110, 145–175. [Google Scholar] [CrossRef]
  30. Gangwar, B.; Kumar, S.; Darokar, M.P. Glabridin averts biofilms formation in methicillin-resistant Staphylococcus aureus by modulation of the surfaceome. Front. Microbiol. 2020, 11, 1779. [Google Scholar] [CrossRef]
  31. Inui, M.; Suda, M.; Kimura, S.; Yasuda, K.; Suzuki, H.; Toda, H.; Yamamoto, S.; Okino, S.; Suzuki, N.; Yukawa, H. Expression of Clostridium acetobutylicum butanol synthetic genes in Escherichia coli. Appl. Microbiol. Biotechnol. 2008, 77, 1305–1316. [Google Scholar] [CrossRef]
  32. Clark, S.W.; Bennett, G.N.; Rudolph, F.B. Isolation and characterization of mutants of Clostridium acetobutylicum ATCC 824 deficient in acetoacetyl-coenzyme A:acetate/butyrate:Coenzyme A-transferase (EC 2.8.3.9) and in other solvent pathway enzymes. Appl. Environ. Microbiol. 1989, 55, 970–976. [Google Scholar] [CrossRef] [Green Version]
  33. Han, B.; Ujor, V.; Lai, L.B.; Gopalan, V.; Ezeji, T.C. Use of proteomic analysis to elucidate the role of calcium in acetone-butanol-ethanol fermentation by Clostridium beijerinckii NCIMB 8052. Appl. Environ. Microbiol. 2012, 79, 282–293. [Google Scholar] [CrossRef] [Green Version]
  34. Galindo-Cuspinera, V.; Lubran, M.B.; Rankin, S.A. Comparison of volatile compounds in water- and oil-soluble annatto (Bixa orellana L.) Extracts. J. Agric. Food Chem. 2002, 50, 2010–2015. [Google Scholar] [CrossRef] [PubMed]
  35. Vollenweider, S.; Evers, S.; Zurbriggen, K.; Lacroix, C. Unraveling the hydroxypropionaldehyde (HPA) system: An active antimicrobial agent against human pathogens. J. Agric. Food Chem. 2010, 58, 10315–10322. [Google Scholar] [CrossRef] [PubMed]
  36. Schuler, D.; Eder, E. Detection of 1,N2-propanodeoxyguanosine adducts of 2-hexenal in organs of Fischer 344 rats by a 32P-post-labeling technique. Carcinogenesis 1999, 20, 1345–1350. [Google Scholar] [CrossRef] [Green Version]
  37. Auerbach, C.; Moutschen-Dahmen, M.; Moutschen, J. Genetic and cytogenetical effects of formaldehyde and related compounds. Mutat. Res. Genet. Toxicol. 1977, 39, 317–361. [Google Scholar] [CrossRef]
  38. Ikeda, M. H. Greim (ed): DFG Essential MAK value documentations. Int. Arch. Occup. Environ. Health 2008, 81, 933–934. [Google Scholar] [CrossRef]
  39. Schaefer, L.; Auchtung, T.; Hermans, K.E.; Whitehead, D.; Borhan, B.; Britton, R.A. The antimicrobial compound reuterin (3-hydroxypropionaldehyde) induces oxidative stress via interaction with thiol groups. Microbiology 2010, 156, 1589–1599. [Google Scholar] [CrossRef] [PubMed] [Green Version]
  40. Fernandes, P.H.; Kanuri, M.; Nechev, L.V.; Harris, T.M.; Lloyd, R.S. Mammalian cell mutagenesis of the DNA adducts of vinyl chloride and crotonaldehyde. Environ. Mol. Mutagen. 2005, 45, 455–459. [Google Scholar] [CrossRef]
  41. Liu, X.; Yang, Z.; Pan, X.; Zhu, M.; Xie, J. Gene expression profile and cytotoxicity of human bronchial epithelial cells exposed to crotonaldehyde. Toxicol. Lett. 2010, 197, 113–122. [Google Scholar] [CrossRef]
  42. Kaneda, T. Iso- and anteiso-fatty acids in bacteria: Biosynthesis, function, and taxonomic significance. Microbiol. Rev. 1991, 55, 288–302. [Google Scholar] [CrossRef]
  43. Carey, A.B.; Ashenden, A.; Köper, I. Model architectures for bacterial membranes. Biophys. Rev. 2022, 14, 111–143. [Google Scholar] [CrossRef]
  44. Lepage, C.; Fayolle, F.; Hermann, M.; Vandecasteele, J. Changes in membrane lipid composition of Clostridium acetobutylicum during acetone-butanol fermentation: Effects of solvents, growth temperature and pH. J. Gen. Microbiol. 1987, 133, 103–110. [Google Scholar] [CrossRef] [Green Version]
  45. Isar, J.; Rangaswamy, V. Improved n-butanol production by solvent tolerant Clostridium beijerinckii. Biomass-Bioenergy 2012, 37, 9–15. [Google Scholar] [CrossRef]
  46. Ingram, L.O. Adaptation of membrane lipids to alcohols. J. Bacteriol. 1976, 125, 670–678. [Google Scholar] [CrossRef] [PubMed] [Green Version]
  47. Weber, F.J.; de Bont, J.A.M. Adaptation mechanisms of microorganisms to the toxic effects of organic solvent on membranes. Biochim. Biophys. Acta. 1996, 1286, 225–245. [Google Scholar] [PubMed]
  48. Torres, S.; Pandey, A.; Castro, G.R. Organic solvent adaptation of Gram positive bacteria: Applications and biotechnological potentials. Biotechnol. Adv. 2011, 29, 442e52. [Google Scholar] [CrossRef] [PubMed]
  49. Cray, J.A.; Stevenson, A.; Ball, P.; Bankar, S.B.; Eleutherio, E.C.; Ezeji, T.C.; Singhal, R.S.; Thevelein, J.M.; Timson, D.J.; Hallsworth, J.E. Chaotropicity: A key factor in product tolerance of biofuel-producing microorganisms. Curr. Opin. Biotechnol. 2015, 33, 228–259. [Google Scholar] [CrossRef]
  50. Zhang, C.; Yang, H.; Yang, F.; Ma, Y. Current progress on butyric acid production by fermentation. Curr. Microbiol. 2009, 59, 656–663. [Google Scholar] [CrossRef]
  51. Gu, Y.; Hu, S.; Chen, J.; Shao, L.; He, H.; Yang, Y.; Yang, S.; Jiang, W. Ammonium acetate enhances solvent production by Clostridium acetobutylicum EA 2018 using cassava as a fermentation medium. J. Ind. Microbiol. Biotechnol. 2009, 36, 1225–1232. [Google Scholar] [CrossRef]
  52. Chen, C.-K.; Blaschek, H.P. Effect of acetate on molecular and physiological aspects of Clostridium beijerinckii NCIMB 8052 solvent production and strain degeneration. Appl. Environ. Microbiol. 1999, 65, 499–505. [Google Scholar] [CrossRef] [Green Version]
  53. Wiesenborn, D.P.; Rudolph, F.B.; Papoutsakis, E.T. Coenzyme A transferase from Clostridium acetobutylicum ATCC 824 and its role in the uptake of acids. Appl. Environ. Microbiol. 1989, 55, 323–329. [Google Scholar] [CrossRef] [Green Version]
Figure 1. Growth, pH, acetic acid and butyric acid profiles of C. beijerinckii grown on glycerol versus cells grown on glucose as a sole carbon source. (A): Optical density (OD600 nm), (B): pH, (C): acetic acid, (D): butyric acid.
Fermentation 08 00339 g001
Figure 2. Solvent concentrations in cultures of C. beijerinckii grown on glycerol relative to cultures grown on glucose as a sole carbon source. (A): acetone, (B): butanol, (C): ethanol.
Fermentation 08 00339 g002
Figure 3. The growth and acid profiles of C. beijerinckii grown on glycerol as a sole carbon source without acetate supplementation, relative to the cultures grown on glycerol with acetate supplementation. (A): optical density, (B): pH profile, (C): acetate, (D): butyrate.
Fermentation 08 00339 g003
Figure 4. The fermentation profiles of C. beijerinckii grown on glycerol as a sole carbon source in comparison to glycerol-grown cultures supplemented with furfural (1 g/) and cysteine (4 g/L). (A): optical density, (B): culture pH, (C): acetate, (D): butyrate.
Fermentation 08 00339 g004
Figure 5. Solvent and acid concentrations in cultures of C. beijerinckii grown on glycerol- or glucose-based media in which the same organism was pre-grown for 24 h with the supplementation of 40 g/L glucose. (A): acetone, (B): butanol, (C): acetate, (D): butyrate.
Fermentation 08 00339 g005
Figure 6. Solvent and acid profiles of C. beijerinckii cultures grown on glycerol or glucose upon supply of 6.0 and 3.5 g/L acetate and butyrate, respectively. (A): acetone, (B): butanol, (C): acetate, (D): butyrate.
Fermentation 08 00339 g006
Figure 7. The fermentation profiles of C. beijerinckii grown on glycerol with and without butyraldehyde supplementation. (A): optical density, (B): butanol, (C): acetate, (D): butyrate.
Fermentation 08 00339 g007
Figure 8. Enzyme activities in glycerol- and glucose-grown cells of C. beijerinckii. (A): Butanol dehydrogenase (BDH) activity, (B): BDH activity in the presence of 10 and 20 g/L glycerol, (C): Butyraldehyde dehydrogenase (BDDH) activity, (D): Coenzyme A transferase (CoAT) activity, (E): Acetoacetate decarboxylase (ACDC) activity. Gly—0.6 g/L glycerol except in panel (B) where 10 and 20 g/L were used.
Fermentation 08 00339 g008
Figure 9. An abbreviated schematic of the acetone-butanol-ethanol pathway of solventogenic Clostridium species based on glycerol and glucose substrates. GldA: glycerol dehydrogenase; DhaK: dihydroxyacetone phosphate kinase; Tpi: triosephosphate isomerase; GAPDH: glyceraldehyde-3-phosphate dehydrogenase; CoAT: coenzyme A transferase (encoded by ctfAB); BDDH: butyraldehyde dehydrogenase; BDH: butanol dehydrogenase (encoded by bdhA or adhE).
Fermentation 08 00339 g009
Table 1. Sequences of oligonucleotide primers used in qRT-PCR analysis.
S.N.Locus TagGenePrimer Sequence 5′ to 3′
1Cbei_0305adhEForwardGACCTGTGGAGTTATAGAGAGAGA
2Cbei_0305adhEReverseATGGCTGTTGATGTTGGATTTG
3Cbei_2421bdhAForwardCGAAGGAGATCCATGGGATTTAG
4Cbei_2421bdhAReverseCATGTGGATCCATCTCAGAACC
5Cbei_2753gldAForwardACACTGATGATGGCGTCTTT
6Cbei_2753gldAReverseGGCATCACCCATACCAGATAC
7Cbei_2148dhaKForwardGAGCAGTGTTTACATCACCTACA
8Cbei_2148dhaKReverseTCCCTTCCATTTCAGCCATATC
9Cbei_0599tpiAForwardAAGGCTGTAGCTGGTTCAAATA
10Cbei_0599tpiAReverseTCCCATAGCTTCAAGCATTCC
11Cbei_0597gapdh-1ForwardACTTTAGATGCTCCACACAGAA
12Cbei_0597gapdh-1ReverseCTCTTTGAGCACCACCATCT
13Cbei_2282gapdhForwardGGGAACCATTAGGAGTTGTACTT
14Cbei_2282gapdhReverseAATCCACATAAGCTCCCTTGAG
15Cbei_2572gapdhForwardTTGTAGCAGGTGGTTACTCATAC
16Cbei_2572gapdhReverseGGATTTCCGACCACAAGTTTATTC
17Cbei_2654ctfAForwardATCAGCTCAACCAGGAGAAAC
18Cbei_2654ctfAReverseGCTTCAGGGCAAGTACCAATA
19Cbei_2653ctfBForwardAGGTGGATCTCCAATCACTTTAC
20Cbei_2653ctfBReverseATCTACCTCTAAAGCGCCTAATG
21Cbei_3833ctfAForwardACCTTCTATAGGGCTGCTACT
22Cbei_3833ctfAReverseCCAGGAGTCATTATGGCATCTC
23Cbei_3834ctfBForwardGGGTGGCGCTATGGATTTA
24Cbei_3834cftBReverseCCACTTGAGCCTTAGCAGTAA
25Cbei_R002416SrRNAForwardCTCTGTCTTCAGGGACGATAATG
26Cbei_R002416SrRNAReverseTATCCACCTACGCTCCCTTTA
Table 2. Relative expression of select metabolic genes of C. beijerinckii grown on glycerol or glucose as a sole carbon source.
Gene IDFunction of Protein
Product
Relative Expression
12 h24 h
Glu + AGly + AGlu − AGly − AGlu + AGly + AGlu − AGly − A
Cbei_0305Bifunctional acetaldehyde-CoA/alcohol dehydrogenase (adhE)84.44 ± 8.54.00 ± 0.421.02 ± 0.21a1.13 ± 0.06 a1.00 ± 0.141.44 ± 0.181.00 ± 0.180.30 ± 0.53
Cbei_2421NADH-dependent butanol dehydrogenase A (bdhA)0.26 ± 0.040.51 ± 0.031.01 ± 0.120.33 ± 0.010.37 ± 0.021.00 ± 0.181.00 ± 0.070.13 ± 0.02
Cbei_2753Glycerol dehydrogenase (gldA)0.27 ± 0.031.36 ± 0.121.00 ± 0.041.4 ± 0.150.48 ± 0.041.00 ± 0.171.00 ± 0.090.30 ± 0.03
Cbei_2148Dihydroxyacetone kinase (subunit dhaK)13.83 ± 1.38880 ± 71.361.02 ± 0.25899 ± 71.360.01 ± 0.001.27 ± 0.071.04 ± 0.342.3 ± 0.44
Cbei_0599Triosephosphate isomerase (A subunit; tpiA)0.23 ± 0.020.4 ± 0.051.01 ± 0.140.33 ± 0.031.70 ± 0.051.03 ± 0.121.02 ± 0.250.13 ± 0.02
Cbei_0597Glyceraldehyde-3-phosphate dehydrogenase (type I)0.26 ± 0.03 a0.30 ± 0.04 a1.00 ± 0.110.30 ± 0.021.50 ± 0.071.00 ± 0.121.01 ± 0.140.10 ± 0.01
Cbei_2282NADP-dependent glyceraldehyde-3-phosphate dehydrogenase (gapdh-N1)26.3 ± 7.001.60 ± 0.311.04 ± 0.35 a0.70 ± 0.24 a1.00 ± 0.401.5 ± 0.071.00 ± 0.100.20 ± 0.07
Cbei_2572NADP-dependent glyceraldehyde-3-phosphate dehydrogenase (gapdh-N2)2.12 ± 0.020.50 ± 0.101.00 ± 0.030.40 ± 0.060.60 ± 0.111.13 ± 0.051.00 ± 0.09 a0.80 ± 0.04 a
Cbei_2654Acetate CoA-transferase, alpha subunit (ctfA)189 ± 15.001.40 ± 0.051.00 ± 0.040.30 ± 0.050.61 ± 0.051.70 ± 0.051.00 ± 0.100.01 ± 0.00
Cbei_2653Butyrate-acetoacetate CoA-transferase, subunit B (ctfB)89 ± 1.300.90 ± 0.091.01 ± 0.140.17 ± 0.040.60 ± 0.111.65 ± 0.131.00 ± 0.120.01 ± 0.00
Cbei_3833Butyrate-acetoacetate CoA-transferase, subunit A (ctfA)1.6 ± 0.030.04 ± 0.001.00 ± 0.110.02 ± 0.000.2 ± 0.010.8 ± 0.091.00 ± 0.120.00 ± 0.00
Cbei_3834Acyl-CoA:acetate CoA transferase, beta subunit (ctfB)1.0 ± 0.080.02 ± 0.001.00 ± 0.070.00 ± 0.000.14 ± 0.010.72 ± 0.111.00 ± 0.080.00 ± 0.00
Glu—glucose; Gly—glycerol; A—acetate. Relative expression means not marked with the letter ‘a’ within the same row are statistically significant (p ≤ 0.05).
Table 3. Glycerol and glucose utilization by C. beijerinckii.
SubstrateTreatmentInitial Concentration (g/L)Final Concentration (g/L)Substrate Consumed (g/L)
Glucose60 g/L in P2 medium *57.4 ± 0.0017.10 ± 3.7939.10 ± 2.23
Glycerol60 g/L in P2 medium55.10 ± 0.0049.80 ± 0.465.30 ± 0.46
Glycerol60 g/L without acetate59.80 ± 3.3255.10 ± 3.604.70 ± 0.40
Glycerol12 g/L without acetate12.60 ± 0.009.32 ± 0.653.28 ± 0.65
Glycerol20 g/L without acetate21.11 ± 0.0017.20 ± 0.363.91 ± 0.36
Glycerol36.1 g/L without acetate37.00 ± 0.0032.90 ± 0.364.10 ± 0.36
Glycerol60 g/L in P2 medium + butyraldehyde (3 g/L)61.00 ± 0.0057.20 ± 1.133.80 ± 1.03
Glycerol60 g/L + acetate (6 g/L) + butyrate (3.5 g/L)62.33 ± 0.0057.59 ± 0.494.74 ± 0.49
Glucose60 g/L + acetate (6 g/L) + butyrate (3.5 g/L)59.06 ± 0.0013.33 ± 0.8045.73 ± 0.50
* Standard P2 medium contains 2.2 g/L acetate.
Publisher’s Note: MDPI stays neutral with regard to jurisdictional claims in published maps and institutional affiliations.

