Article

The Effect of pH on the Production and Composition of Short- and Medium-Chain Fatty Acids from Food Waste in a Leachate Bed Reactor at Room Temperature

1
Department of Civil and Environmental Engineering, Carleton University, Ottawa, ON K1S 5B6, Canada
2
Department of Civil and Environmental Engineering, Nanyang Technological University, Singapore 639798, Singapore
3
Department of Civil and Environmental Engineering, Cornell University, Ithaca, NY 14853, USA
4
College of Civil and Transportation Engineering, Hohai University, Nanjing 210024, China
*
Authors to whom correspondence should be addressed.
These authors contributed equally to this work.
Fermentation 2023, 9(6), 518; https://doi.org/10.3390/fermentation9060518
Submission received: 16 April 2023 / Revised: 24 May 2023 / Accepted: 25 May 2023 / Published: 27 May 2023
(This article belongs to the Special Issue Sustainable Development of Food Waste Biorefineries)

Abstract

:
This study evaluated the hydrolysis and acidogenesis of food waste at different operating pHs (uncontrolled, 5.5, 6.5, 7.5, 8.5) in a leachate bed reactor (LBR) at room temperature. LBR operation at pH 6.5–8.5 resulted in a hydrolysis yield of 718–729 g SCOD/kg VSadded, which was statistically (p ≤ 0.05) higher than that obtained at pH 5.5 (577 g SCOD/kg VSadded) and the uncontrolled pH (462 g SCOD/kg VSadded). The hydrolysis rate at pH 6.5 was the highest amongst all the pH values. Stabilization at pH at 6.5 also resulted in a high fatty acid (FA) yield of 643 g CODFA/kg VSadded. Butyrate was the main FA at the pH of 5.5–6.5, while acetate was the main FA at the pH of 7.5–8.5. At the uncontrolled pH, lactate production was the highest, indicating a shift in the microbial community from fatty-acid-producing bacteria to lactate-producing bacteria. The compositions of medium-chain fatty acids, such as caproate, were the highest at pH of 5.5.

1. Introduction

Over 2 billion tons of municipal solid waste (MSW) was generated globally in 2016. At the current rate of generation, MSW is anticipated to further increase by 69% to reach 3.40 billion tons by 2050 [1,2]. A large portion of MSW is food waste, constituting up to 45% of MSW [1,2]. The main components of food waste are fruits and vegetables, which are disposed in large quantities by local markets and grocery stores. The bulk of the food waste in many developing and developed countries is disposed of through landfilling, resulting in adverse health and environmental effects including greenhouse gas (GHG) emissions, the contamination of subsurface environments and loss of habitats [3,4]. Therefore, sustainable approaches for managing food waste are being intensively researched. The conversion of food waste to fatty acids via the acidogenic fermentation process is an emerging biotechnology that combines the sustainable management of food waste with resource recovery.
Acidogenic fermentation is carried out by a consortium of bacteria (mixed microbial culture) under anaerobic conditions to produce different fatty acids (FAs) from heterogenous waste such as food waste through multi-step concurrent biochemical reactions. Fatty acids with 2–5 carbon atoms (e.g., acetate, propionate, butyrate, valerate) are categorized as short-chain fatty acids (SCFAs), and those with 6–8 carbon atoms (e.g., caproate, hexanoate, etc.) are called medium-chain fatty acids (MCFAs) [5,6,7]. FAs (SCFAs and MCFAs) are industrially important chemicals that are currently derived from petrochemicals causing substantial GHG emissions [1,8,9,10]. These are widely used in pharmaceutical, chemical, food processing, cosmetic, textile, paint and other industries. Additionally, these FAs can be used as a substrate in the microbial production of bioplastics and biofuels [11,12,13,14,15]. Comparatively, MCFAs have higher economical value than SCFAs because of their higher carbon to oxygen ratio (C:O) and energy potential [16].
Dry fermenters such as leachate bed reactors (LBRs) are being widely studied as an energy-efficient and cost-effective bioreactor platform for the production of FAs. Unlike the commonly used continuously stirred tank reactors (CSTRs), LBRs can handle higher solid contents (30–40% of total solid). Consequently, no dilution of food waste is required (no process water). Furthermore, no mechanical stirring is required in LBRs, which significantly reduces energy consumption. An added advantage of the LBR design is the separation of the degraded food waste from FAs containing broth, which eliminates or reduces the downstream costs associated with solid–liquid separation [17,18].
The operating parameters of LBRs significantly impact FA production (yield) and the percentage composition of individual FAs (e.g., the composition of acetate, butyrate and propionate) during acidogenic fermentation. Amongst the different operating parameters, pH is one of the most crucial parameters affecting FA production and composition, since pH has an impact on the microbial community’s composition and metabolic activity of the bacteria [12,18,19]. Many studies have investigated the impacts of pH on the production and composition of FAs from food waste in LBRs [18,20,21,22,23,24]. However, FA compositional analysis in these studies has been limited to primarily three SCFAs, namely, acetate, propionate and butyrate. The production of other SCFAs, such as iso-butyrate, n-valerate and iso-valerate, as well as MCFAs (i.e., n-caproate, iso-caproate, heptanoate), has not been extensively analyzed. In addition to limited compositional analysis, most of the studies on LBRs have tested food waste fermentation at temperatures above 35 °C. Maintaining LBRs at such temperatures (>35 °C) requires external heating, which can significantly impact the net energy gain as well as the reduction in GHG emissions. Therefore, the characterization of SCFAs and MCFAs under room conditions (i.e., without external heating) is of interest. However, there is limited information in the literature in this regard. This study was performed to fill these research gaps.
This study evaluated the impacts of five different pHs (uncontrolled, 5.5, 6.5, 7.5 and 8.5) on the full range of SCFAs (acetate, propionate, butyrate, iso-butyrate, n-valerate, iso-valerate) and MCFAs (n-caproate, iso-caproate, heptanoate) produced from food waste in an LBR at the room temperature of 22 °C. Firstly, the hydrolysis yields and rates were compared at different pHs. Secondly, the production and composition of SCFAs and MCFAs were analyzed to elucidate the impacts of pH on the range of acidogenic products obtained from food waste, and finally, the microbial community composition was analyzed to elucidate the hydrolytic and fermentative bacteria at different pHs.

2. Material and Methods

2.1. Characteristics of Food Waste and Inoculum

Simulated food waste was used in this study because of the closure of restaurants, cafeterias and commercial centers due to the COVID-19 pandemic. The simulated food waste consisted of (weight basis) 13% apples, 7% bananas, 17% capsicums, 14% tomatoes, 26% potatoes and 22% guavas with a total solids (TS) content of 13.23 ± 0.20% and volatile solids (VS) content of 9.86 ± 0.25%. To prevent degradation, each component of the food waste was stored at −10 °C until the time of use for the experiments. The required quantity of an individual component of food waste was defrosted at room temperature (22 °C) for two hours before use for the experiments. The food waste was then immediately shredded to an average particle size of 5–10 mm.
Anaerobic digestion sludge (AD-sludge) was used as the inoculum in this study. The AD sludge was collected from an anaerobic wastewater treatment plant (Ulu Pandan Water Reclamation Plant, Singapore). The AD sludge was filtered to remove solid particles with a size of over 10 mm so as to prevent the clogging of the LBR and then stored at 4 °C until use. To kill the methanogens, the AD sludge was heated at 75 °C for 15 min before addition to the LBR. The AD sludge contained a TS content of 1.68 ± 0.04% and VS content of 1.08 ± 0.02%.

2.2. LBR Design

A cylindrically shaped LBR was used in this study, which was fabricated using acrylic materials. The LBR was cylindrical with a height of 620 mm and a diameter of 130 mm; thus, the total volume of the LBR was 8 L (volume of a cylinder). The LBR comprised three sections (Figure 1A): (1) a top section with a headspace of 2.5 L, (2) a middle section with a food-waste-holding basket of 1.5 L and (3) a bottom section with leachate-holding bed of 4 L. The headspace was equipped with a detachable cover with a customized sprinkler nozzle and a gas collection port. The gas produced during acidogenic fermentation was collected in the gas collection bag (Tedlar Multilayer Gas Sampling Bags, 10 L) connected to the gas collection port. The food-waste-holding basket was made of stainless steel with a height of 185 mm and a diameter of 100 mm. The side wall and base of the food-waste-holding basket were perforated with a pore size of 4 mm to enable the percolation of the leachate into the leachate-holding bed while preventing food waste particles from entering the leachate-holding bed (Figure 1B). The leachate-holding bed had side sampling ports to collect the leachate samples for different analyses. The pH probe was installed on the retaining wall of the leachate-holding bed to monitor the pH using a pH controller (MODEL MC122, Milwaukee, WI, USA). The pH controller was connected to a dosing pump to adjust the pH of the leachate to the desired level by injecting 1 M NaOH. The leachate in the leachate-holding bed was gently mixed using a peristaltic pump (Masterflex Standard Digital Drive, Model 77200-62, Cole Parmer, Vernon Hills, IL, USA). Another peristaltic pump (Masterflex Digital Economy Drive, Model 77800-62, Cole Parmer, Vernon Hills, IL, USA) was used to recirculate and spray the leachate from the bottom of the leachate-holding bed to the food-waste-holding basket. The recirculation and mixing of the leachate with the peristaltic pumps were controlled using a timer (33 Multifunction timer relay, RS pro, Singapore). To ensure anaerobic conditions inside the LBR, the joints of the LBR had O-rings and rubber gaskets.

2.3. LBR Experimental Procedure

All LBR experiments were performed using the same procedure unless otherwise specified. The LBR was operated in batch mode at room temperature (22 °C) for a fixed period of 14 days. For each run, 1.5 kg of food waste was loaded into the food-waste-holding basket along with 0.6 L of heat-treated AD sludge in the leachate-holding bed, with an inoculum to substrate ratio (ISR) of 4%. This loading of food waste (VS of 98.63 g/kg) and AD sludge (VS of 10.81 g/kg) provided a volumetric organic loading of 19 g VS/Lreactor for each LBR run. Nitrogen gas was purged from the LBR to ensure anaerobic conditions inside the LBR. The impacts of pH on hydrolysis and acidification (SCFA and MCFA production) were evaluated by operating the LBR at different pHs: uncontrolled pH (designated as LBR-UC), 5.5 ± 0.5 (designated as LBR-5.5), 6.5 ± 0.5 (designated as LBR-6.5), 7.5 ± 0.5 (designated as LBR-7.5) and 8.5 ± 0.5 (designated as LBR-8.5). The pH for LBR-UC was measured to be in the range of 3.5–4. During the experiments, FA (SCFA and MCFA) generation causes the leachate to be acidic, which affects microbial activity. Therefore, it is crucial to use alkaline solution to maintain the pH. To maintain the pH at the required level in the LBR, 1 M solution of caustic soda (NaOH) was used during the experiments. The leachate was recirculated from the leachate-holding bed to the food-waste-holding basket at a leachate recirculation rate of 3 L/h in all the LBRs.

2.4. Sampling and Analytical Methods

About 30 mL of leachate was sampled every second day for all the LBRs to analyze the soluble chemical oxygen demand (SCOD) and VFAs. TS and VS were analyzed at the beginning and the end of each experimental run. For the SCOD and VFA analyses, the leachate sample was centrifuged at 6000 rpm for 10 min to obtain the supernatant, and then the supernatant was filtered with a syringe filter with a 0.45 µm pore size filter membrane. Subsequently, the filtered sample was used to analyze the SCOD using a COD reagent tube (Hatch, Los Angeles, CA, USA). Fatty acids (FAs) in the leachate were analyzed by injecting the filtered sample into a gas chromatograph (GC 7890A, Agilent, Santa Clara, CA, USA) equipped with a flame ionization detector (FID) and a DB-FFAP fused-silica capillary column. The injector and detector were both set to a temperature of 260 °C. The column temperature was initially adjusted to 80 °C for 1 min and then raised to 120 °C at a rate of 20 °C/min, and after that, it was increased to 205 °C at a rate of 10 °C/min and maintained at this temperature for 2 min.
In this study, the total FA (TFA) content was estimated as the sum of SCFAs (acetate, propionate, n-butyrate, iso-butyrate, iso-valerate and n-valerate) and MCFAs (iso-caproate, n-caproate and heptanoate). The lactate in the leachate was quantified with a high-performance liquid chromatograph (HPLC, CA) equipped with a refractive index detector (RID) and an ion exclusion column (300 × 7.8 mm diameter, 9 µm particle size, Aminex HPX-87H, Biorad, CA, USA). The temperature of the column was maintained at 65 °C with a sample injection flow rate of 0.6 mL/min. The concentration of total FAs and lactate was expressed as a chemical oxygen demand (COD) equivalent using half reactions for FAs and lactate with O2 [25]. All analyses were performed in triplicate unless otherwise specified.

2.5. Calculations

The impacts of pH on food waste degradation and acidification were evaluated based on the hydrolysis yield, acidification yield, FA yield, lactate yield and the ratios of FAs and lactate to SCOD [3,13,17,18,26]. The hydrolysis yield was calculated as the ratio of the mass of cumulative SCOD produced in the leachate to the initial amount vs. that added to the LBR (Equation (1)) [3]:
Hydrolysis   yield   ( g   SCOD / kg   VS added ) = c u m u l a t i v e   S C O D   p r o d u c e d   ( g   S C O D ) V S a d d   e d i n i t i a l l y k g
where
Cumulative SCOD produced (g SCOD) = F i n a l   S C O D   o f   l e a c h a t e g   S C O D - I n i t i a l   S C O D   o f   t h e   i n o c u l u m   ( g   S C O D ) .
VSadded initially (kg) = VS of food waste (kg) + vs. of inoculum (kg).
The FA yield was computed as the cumulative TFA (sum of SCFAs and MCFAs) produced to the initial, amount vs. that added to the LBR (Equation (2)) [17]:
TFA   yield   ( g   COD FA / kg   VS added ) = c u m u l a t i v e   T F A   p r o d u c e d   ( g   C O D F A ) V S a d d e d   i n i t i a l l y k g
where:
Cumulative TFA produced (g CODFA) = F i n a l   t o t a l   T F A   o f   l e a c h a t e   g   C O D F A - I n i t i a l   t o t a l   T F A   o f   i n o c u l u m   ( g   C O D F A ) .
VSadded initially (kg) = VSof food waste (kg) + VSof inoculum (kg).
The TFA/SCOD ratio (%) was calculated as the ratio of the TFA yield to the hydrolysis yield.
The lactate yield was calculated based on the ratio of cumulative lactate produced (g CODLactate) to the initial amount vs. that added to the LBR (Equation (3)) [17]. The lactate/SCOD ratio (%) was calculated as the ratio of the lactate yield to the hydrolysis yield:
Lactate   yield   ( g   COD Lactate / kg   VS added ) = c u m u l a t i v e   l a c t a t e   p r o d u c e d   ( g   C O D L a c t a t e ) V S a d d e d   i n i t i a l l y k g
where:
Cumulative lactate produced (g CODLactate) = F i n a l   t o t a l   l a c a t e   o f   l e a c h a t e   g   C O D L a c t a t e - I n i t i a l   t o t a l   l a c t a t e   o f   i n o c u l u m   ( g   C O D L a c t a t e ) .
VSadded initially (kg) = VSof food waste (kg) + VSof inoculum (kg).
The acidification yield was calculated as the sum of the TFA yield and lactate yield (Equation (4)) [17]:
Acidification   yield   ( g   COD / kg   VS added ) = c u m u l a t i v e   T F A   p r o d u c e d   g   C O D F A   +   c u m u l a t i v e   l a c t a t e   p r o d u c e d   g   C O D L a c t a t e V S a d d e d   i n i t i a l l y k g
where:
Cumulative TFA produced (gCODVFA) = F i n a l   t o t a l   T F A   o f   l e a c h a t e   g   C O D V F A     I n i t i a l   t o t a l   T F A   o f   i n o c u l u m   ( g   C O D V F A ) .
Cumulative lactate produced (gCODLactate) = F i n a l   t o t a l   l a c a t e   o f   l e a c h a t e   g   C O D L a c t a t e   25   M a y   2023   I n i t i a l   t o t a l   l a c t a t e   o f   i n o c u l u m   ( g   C O D L a c t a t e ) .
VSadded initially (kg) = VSof food waste (kg) + VSof inoculum (kg).

2.6. Microbial Community and Statistical Analysis

The residual food waste (in the food waste basket) and centrifuged biomass from the leachate in different LBRs were collected at the end of the batch cycle for microbial community analysis. As described by Xiong [18], genomic DNA (gDNA) was extracted from the food waste and the biomass samples using the Sox DNA Isolation Kit (Genewiz, Singapore) according to the protocol provided by the supplier. Polymerase chain reaction (PCR) for 16S rRNA genes was performed for each sample of gDNA (25 μL each) in triplicate, containing 0.5 μL of 10 mM dNTP, 2.5 μL of PCR buffer, 5.0 μL of 1 μM forward primer, 5.0 μL of 1 μM reverse primer, 0.25 μL of BSA (20 mg/mL), 5.0 μL DNA, 0.2 μL of Taq DNA polymerase (5u/μL) and 6.55 μL of PCR water. The forward and reverse primers were used to target 16S rRNA genes in both bacteria and archaea: Pro341F: CCTACGGGNBGCASCAG, Pro805R: GACTACNVGGGTATCTAATCC [27]. The PCR cycle included: (1) initial DNA denaturation at 95 °C for 5 min, (2) 35 cycles of DNA denaturation at 95 °C for 30 s, primer annealing at 30 °C for 30 s, primer extension at 72 °C for 50 s and then (3) a final extension at 72 °C for 10 min [27].
An equal amount of PCR amplicons were pooled and quantified using the NanoDrop 1000 (Thermo Fisher Scientific Inc.). The DNA sequences were produced in FASTQ files with a MiSeq Reagent Kit v2 (2 × 250 cycles) using an Illumina MiSeq sequencer (Illumina Inc, San Diego, CA, USA). The demultiplexing sequences, including the truncation of forward and reverse reads to 245 nucleotides, primer removal and the merging of paired reads, were processed using the DADA2 v1.6 tool [28] in QIIME 2 v.2018.2 [29].
After the chimera-containing sequences’ removal, clustering was performed at 97% identity, and then taxonomy was assigned to representative sequences from each cluster using a naive Bayesian classifier implemented in QIIME 2 based on SILVA release 132.
Single-factor analysis of variance (ANOVA) analysis was used to verify the impacts of different pHs on food waste degradation and acidification (p ≤ 0.05) using Microsoft Excel software version 2019.

3. Results and Discussion

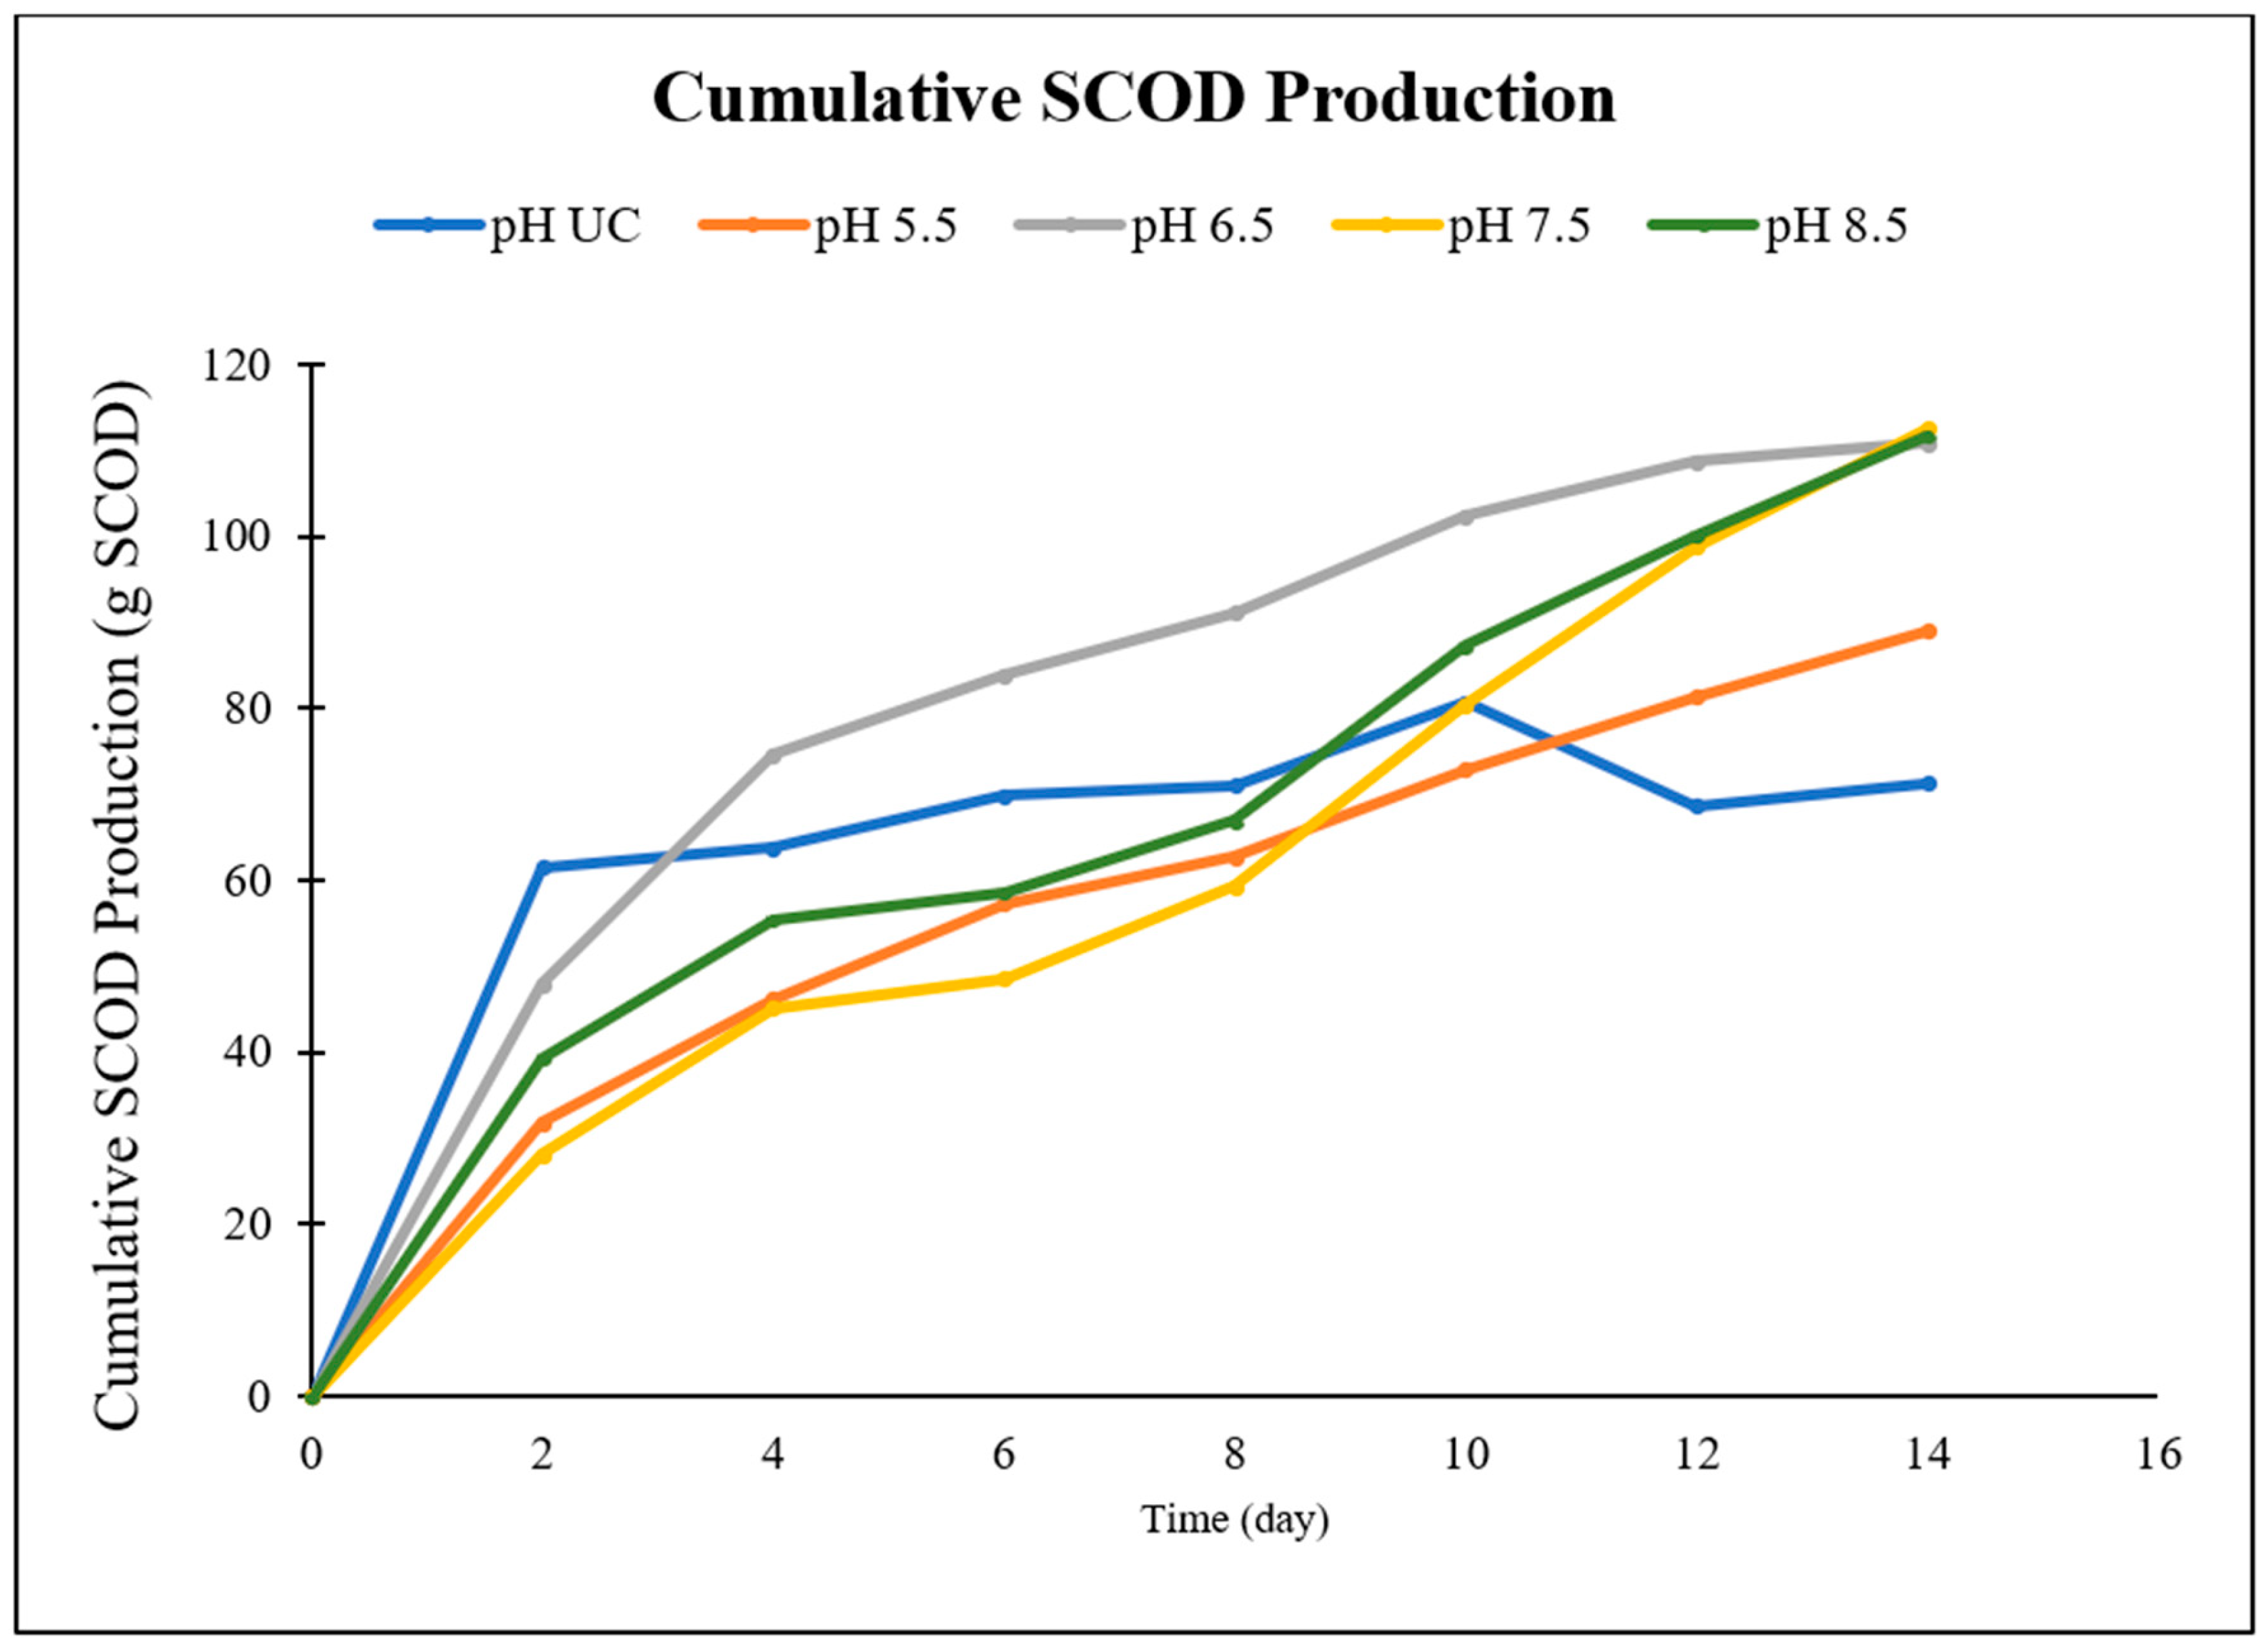
3.1. Hydrolysis of Food Waste at Different pHs

The hydrolysis of food waste was assessed based on the cumulative SCOD production. Figure 2 illustrates the impact of pH on cumulative SCOD (g SCOD) production in the LBR throughout the fermentation time of 14 days. The cumulative SCOD (g SCOD) production differed depending on the pH range. A nearly neutral to alkaline pH (i.e., 6.5–8.5 pH) resulted in statistically higher cumulative SCOD production than acidic pH ranges (uncontrolled pH–5.5). The highest cumulative SCOD production of 112.5 ± 2.6 g SCOD was obtained in LBR-7.5, followed by 111.7 ± 4.1 g SCOD in LBR-8.5, 110.8 ± 1.7 g SCOD in LBR-6.5, 89.0 ± 3.4 g SCOD in LBR-5.5 and 71.34 ± 0.9 g SCOD in LBR-UC. Notably, no statistical difference (p ≥ 0.05) was found for the cumulative SCOD (g SCOD) production from pH 6.5 to 8.5 (i.e., LBR-6.5, LBR-7.5 and LBR-8.5) after 14 days of fermentation time; however, these values were statistically (p ≤ 0.05) higher than the cumulative SCOD (g SCOD) obtained at pH 5.5 (LBR-5.5) and the uncontrolled pH (LBR-UC). A similar trend was also observed for the hydrolysis yields.
Table 1 summarizes the hydrolysis yields obtained in the LBRs at different pHs on day 14. A hydrolysis yield of 718–729 g SCOD/kg VSadded was achieved in a pH range of 6.5–8.5 (LBR 6.5, LBR7.5 and LBR-8.5), which was 21–58% higher than those obtained at pH 5.5 (LBR-5.5; 577 g SCOD/kg VSadded) and the uncontrolled pH (LBR-UC; 462 g SCOD/kg VSadded). This result indicated that nearly neutral to alkaline pH ranges (pH 6.5–8.5) enhance the hydrolysis of food waste in LBRs. It has been reported that the hydrolysis of food waste in an LBR was improved when the pH was increased from an acidic pH (pH < 5.5) to a nearly neutral to alkaline pH [17,18,30,31]. Hussain [17] reported a 0.18–1.3-foldincrease in the hydrolysis yield obtained by increasing the pH from 4–5 (227–405 g SCOD/kg VSadded) to 6–7 (478–530 g SCOD/kg VSadded) during food waste fermentation in an LBR. Similarly, in another study treating food waste in an LBR, a 73% higher hydrolysis yield was obtained at a pH of 6 (505 g SCOD/kg VSadded) compared to that obtained in uncontrolled pH conditions (292 g SCOD/kg VSadded) [31]. This enhanced hydrolysis of food waste at a nearly neutral to alkaline pH (i.e., 6.5–8.5 pH) can be attributed to better hydrolytic activity of the bacteria in these pH ranges, which results in the improved solubilization of particulate organic matter in the food waste [17,18].
Interestingly, the hydrolysis of the food waste was faster at the pH of 6.5 (LBR-6.5) than in the other pH conditions (LBR-UC, LBR-5.5, LBR-7.5, LBR-8.5). Notably, in LBR-6.5, the cumulative SCOD production on day 8 was 91 g SCOD, which was 82% of the cumulative SCOD produced on day 14 (Table 2). Comparatively, on the same day (day 8), the cumulative SCOD production for LBR-7.5 and LBR-8.5 was 53% and 60%, respectively, of the cumulative SCOD produced on day 14 in the reactor (Table 2). Additionally, the cumulative SCOD production on day 8 for LBR-6.5 was statistically (p ≤ 0.05) higher (LBR-6.5) than that obtained in the other pH conditions on day 10 (LBR-UC, LBR-5.5, LBR-7.5, LBR-8.5). This faster hydrolysis in LBR-6.5 indicates that operating the reactor at a pH of 6.5 can significantly shorten the fermentation time to 10–12 days instead of the 14 days required at the pHs of 7.5 and 8.5 to achieve the same SCOD production/hydrolysis yield.

3.2. TFA Production at Different pH

TFA production was calculated as the sum of SCFAs (i.e., acetate, propionate, n-butyrate, iso-butyrate, n-valerate, iso-valerate) and MCFAs (i.e., n-caproate, iso-caproate, heptanoate) produced in a particular LBR (Equation (2)). The TFA production also varied depending on the operating pH. On day 14, the maximum TFA production of 99.2 ± 3.0 g CODFA was obtained in LBR-6.5, followed by 71.4 ± 0.6 g CODFA in LBR-5.5, 67.4 ± 3.4 g CODFA in LBR-7.5, 65.3 ± 4.2 g CODFA in LBR-8.5 and 25.5± 0.2 g CODFA in LBR-UC. These results showed that the TFA production in the LBR operated at pH 6.5 (LBR-6.5) was statistically (p ≤ 0.05) higher than that obtained at the other pHs (LBR-UC, LBR-5.5, LBR-7.5, LBR-8.5) (Table 1). Moreover, the TFA production at pH 6.5 (LBR-6.5) was 47–52% higher than that obtained at pH 7.5–8.5 (LBR-7.5, LBR-8.5), even when the cumulative SCOD production was statistically the same at pH 6.5–8.5 (Table 1). The lower TFA production at pH 7.5–8.5 could be attributed to alcohol production under alkaline pH conditions [4]. Higher alcohol production (ethanol, butanol, etc.) at neutral and slightly alkaline pHs has been reported in previous studies [4,17,18]. It is due to enhanced hydrolysis in these alkaline pH ranges of 7.5–8.5 (Table 1), resulting in a greater availability of carbon as a source for alcohol production during the solventogenesis phase of the metabolic pathway in bacteria [4,17,18].
The positive impact of pH 6.5 on TFA production can be further determined from the TVFA yield and TVFA/SCOD ratio (Table 1). The highest TFA yield of 643 ± 19.2 g CODFA/kg VSadded was obtained for LBR-6.5, followed by 463 ± 4.3 g CODFA/kg VSadded for LBR-5.5, 437 ± 22.1 g CODFA/kg VSadded for LBR-7.5, 423 ± 27.4 g CODFA/kg VSadded for LBR-8.5 and 165 ± 1.1 g CODFA/kg VSadded for LBR-UC. This implies that a nearly neutral pH (pH 6.5) resulted in higher TFA production, along with improved hydrolysis yields (Table 1). Yu [32] reported a 34% increase in the TFA yield during the acidogenic fermentation of food waste when the pH was increased from pH 5.5 to pH 6.5. Likewise, Cysneiros [30] reported a high TFA yield of 720 g CODFA/kg VSadded at a pH of 6.5 in an LBR treating maize, which was 76% higher than that obtained under uncontrolled pH conditions (410 g CODVFA/kg VSadded). This higher TFA production at pH 6.5 could be due to better acidogenic activity at pH 5.5–6.5 [33].
The maximum TFA/SCOD of 90% was achieved at pH 6.5 in LBR-6.5 (Table 1), followed by 80% at pH 5.5 (LBR-5.5) and between 58 and 60% for a pH of 7.5–8.5. A low TFA/SCOD of 36% was obtained in LBR-UC due to the transformation of solubilized matter into lactate rather than FAs at an uncontrolled pH (Table 1). Lactate production of 39.3 ± 0.3 g CODLactate, a lactate yield of 255 ± 2.1 g CODLactate/kg VSadded and a lactate/SCOD of 55% were obtained for LBR-UC. Notably, no lactate was produced at the controlled pH of 5.5–8.5. The higher lactate production at the uncontrolled pH was due to a shift in the microbial community from FA-producing bacteria to lactate-producing bacteria (discussed in Section 3.4). Lactate-producing bacteria such as Lactobacillus can thrive under acidic conditions (pH 3.5–4.5) [19,34]. High lactate production at an uncontrolled pH was also observed in other studies. For instance, Kim [35] reported significantly higher lactate production from food waste at a pH of 3.3–3.4 than a pH of 7.2–7.9. Similarly, Ye [36] obtained higher lactate production at an uncontrolled pH as compared to a controlled pH of 6–8 during the acidogenic fermentation of vegetable waste.

3.3. TFA Composition at Different pH

The TFA composition at different pHs is shown in Figure 3. Butyrate (56% of TFA) was the most dominant FA at the uncontrolled pH (LBR-UC), followed by acetate (38% of TFA). At the pH of 5.5 (LBR-5.5), butyrate (50% of TFA) and acetate (23% of TFA) were the prevalent FAs and, together, constituted 73% of the TFA. Similarly, the produced amounts of butyrate (56% of TFA) and acetate (21% of TFA) were higher than those of the other FAs at pH 6.5 in LBR-6.5. The higher production of acetate and butyrate at pH 5.5–6.5 implies that bacteria follow the acetate–butyrate metabolic pathway at pH 5.5–6.5 [18]. On the other hand, the main FA content shifted from butyrate to acetate, along with a comparatively higher production of propionate at pH 7.5 (LBR-7.5). Acetate constituted 36% of the TFA, being the most dominant FA, followed by butyrate (29% of TFA) and propionate (27% of TFA). At pH 8.5, acetate (57% of TFA) was still the dominant FA, but the production of propionate (22% of TFA) increased significantly. Butyrate constituted 19% of the TFA at pH 8.5. Overall, an alkaline pH of 7.5–8.5 promotes the production of acetate and propionate, which is in agreement with the findings of other research studies. Bacteria will conserve their energy by producing acetate and balance their intracellular reducing power by producing propionate at the alkaline pH of 7.5–8.5 [18].
Caproate was the main MCFA (Table 1). A relatively high composition of caproate was observed at pH of 5.5, forming 13% of the TFA produced (Figure 3). Other MCFAs, such as heptanoate, constituted a very low fraction of the TFA (0–1.5%). Overall, the results demonstrate that the operating pH is a key parameter that impacts the production and composition of SCFAs and MCFAs during the acidogenic fermentation of food waste.

3.4. Microbial Community Composition

Figure 4 shows the microbial community at the genus level of the leachate and food waste for LBRs at different pHs. In the inoculum, Clostridium (43%) and Marcellibacteroides (34%) were mostly dominant. While the composition of Marcellibacteroides became significantly smaller throughout all the pH conditions, Clostridium was consistently found at all pHs in both the leachate and food waste. Clostridium is known for acetate, butyrate and hydrogen production through organic fermentation [18].
Different microbial communities were found in the leachate in response to different pHs. For the uncontrolled pH (LBR-UC), Lactobacillus was the most dominant (57%). Lactobacillus are lactate-producing bacteria and have been found under acidic conditions (pH 3.5–4.5) [34], which corresponds with the pH measured for LBR-UC. The high relative abundance of Lactobacillus supports high lactate production in LBR-UC. LBR-5.5 had the most diverse genera composition in its leachate, including Clostridium (15%), Citrobacter (18%) and Rummeliibacillus (14%). Among them, Citrobacter is a known fermentative bacteria, especially for hydrogen production through acetogenesis [37]. Recently Rummeliibacillus suwonensis, one of the species of Rummeliibacillus which is known for caproic acid production, was isolated [38]. Given that caproic acid was produced at a high rate at pH 5.5, this genus is suggested to be a major player in the production of caproic acid. In LBR-6.5 at pH 6.5, Bacteroides (31%) and Enterococcus (18%) were predominantly found with Clostridium. Enterococcus was reported as a fermentative bacteria producing butyrate and acetate, and it is also known to be a fermenter of carbohydrate and lignocellulose [39,40]. Bacteroides generates butyrate, acetate and propionate [41,42]. This genus was also found predominantly in LBR-7.5 at pH 7.5 (17%). In addition, the composition of Dysgonomonas became larger when the pH increased to 7.5 and 8.5. Dysgonomonas ferments glucose and produces propionate, acetate, lactate and succinate [43]. This result is consistent with our previous study that reported an abundance of Dysgonomonas at a high pH [18].
The bacterial communities in the food waste exhibited different compositions from those in the leachate, except for the uncontrolled conditions, in which Lactobacillus and Clostridium were dominant. At both pH 5.5 and 6.5, Lachnospira (16 and 33%, respectively) and Caproiciproducens (14 and 10%, respectively) were predominantly found, while these genera were less abundant in the leachate. Lachnospira is known as a type of pectin- and glucose-fermenting bacteria [44]. In our previous study, Caproiciproducens was mostly found in food waste and not in leachate [18]. Based on the literature, Caproiciproducens can hydrolyze cellulose using extracellular enzymes [45], and it also ferments fatty acids [46]. While LBR-7.5 at pH 7.5 showed a similar microbial composition, pH 8.5 exhibited a different composition, leading us to identify unclassified Clostridia (32.7%) and Epulopiscium (24%). Unclassified Clostridia were only identified in LBR-8.5 at pH 8.5. Clostridia is a class-level bacterium, and Clostridium also belongs to the Clostridia class. Thus, it is assumed that these populations would be involved in hydrolysis and fermentation at a specific high pH. However, it is challenging to fully comprehend their roles due to the limitation of identification to the lower phylogenetic level.

4. Conclusions

The operating pH significantly affects the solubilization and formation of fermentative products from food waste. High hydrolysis and acidification yields of 718 g SCOD/kg VSadded and 643 ± 19.2 g CODFA/kg VSadded, respectively, were obtained at pH of 6.5. The acidification yield at pH 6.5 was 47–52% higher than that obtained at pH 7.5–8.5, even when the hydrolysis yields were statistically similar in a pH range of 6.5–8.5. A higher TFA/SCOD ratio of 90% was also achieved at pH 6.5. Butyrate was the dominant fermentative product at the pH of 5.5–6.5, whereas acetate formed the major proportion of the TFA composition at pH 7.5–8.5. Lactate-producing bacteria were the most prevalent at the uncontrolled pH, thus resulting in a high lactate production in LBR-UC. The pH of 5.5 (LBR-5.5) resulted in the highest level of MCFA production, constituting 13% of the TFA produced.

Author Contributions

Conceptualization, A.H. and X.F.; methodology, J.L. and A.L.; software, J.L.; investigation, P.R. and A.L.; resources, A.H. and X.F.; data curation, J.L.; writing—original draft preparation, P.R. and A.L.; writing—review and editing, A.H., X.F., S.M. and J.L.; supervision, A.H. and X.F.; funding acquisition, A.H. and X.F., All authors have read and agreed to the published version of the manuscript.

Funding

Natural Sciences and Engineering Research Council of Canada (NSERC) and Ministry of Education (MOE).

Data Availability Statement

Data available on request.

Acknowledgments

The authors are grateful to the Natural Sciences and Engineering Research Council of Canada (NSERC) and Ministry of Education (MOE), Singapore, for the financial support.

Conflicts of Interest

The authors declare that they have no known competing financial interests or personal relationships that could have appeared to influence the work reported in this paper.

References

  1. Arras, W.; Hussain, A.; Hausler, R.; Guiot, S. Mesophilic, thermophilic and hyperthermophilic acidogenic fermentation of food waste in batch: Effect of inoculum source. Waste Manag. 2019, 87, 279–287. [Google Scholar] [CrossRef] [PubMed]
  2. Silpa, K.; Lisa, Y.; Perinaz, B.T.; van Woerden, F. What a Waste 2.0 A Global Snapshot of Solid Waste Management to 2050; World Bank Group: Washington, DC, USA, 2018. [Google Scholar]
  3. Xiong, Z.; Hussain, A.; Lee, H.S. Food waste treatment with a leachate bed reactor: Effects of inoculum to substrate ratio and reactor design. Bioresour. Technol. 2019, 285, 121350. [Google Scholar] [CrossRef] [PubMed]
  4. Zhou, M.; Yan, B.; Wong, J.W.; Zhang, Y. Enhanced volatile fatty acids production from anaerobic fermentation of food waste: A mini-review focusing on acidogenic metabolic pathways. Bioresour. Technol. 2018, 248, 68–78. [Google Scholar] [CrossRef]
  5. Agler, M.T.; Wrenn, B.A.; Zinder, S.H.; Angenent, L.T. Waste to bioproduct conversion with undefined mixed cultures: The carboxylate platform. Trends Biotechnol. 2011, 29, 70–78. [Google Scholar] [CrossRef]
  6. Holtzapple, M.T.; Wu, H.; Weimer, P.J.; Dalke, R.; Granda, C.B.; Mai, J.; Urgun-Demirtas, M. Microbial communities for valorizing biomass using the carboxylate platform to produce volatile fatty acids: A review. Bioresour. Technol. 2022, 344, 126253. [Google Scholar] [CrossRef] [PubMed]
  7. Lee, W.S.; Chua, A.S.M.; Yeoh, H.K.; Ngoh, G.C. A review of the production and applications of waste-derived volatile fatty acids. Chem. Eng. J. 2014, 235, 83–99. [Google Scholar] [CrossRef]
  8. Bastidas-Oyanedel, J.R.; Bonk, F.; Thomsen, M.H.; Schmidt, J.E. Dark fermentation biorefinery in the present and future (bio)chemical industry. Rev. Environ. Sci. Biotechnol. 2015, 14, 473–498. [Google Scholar] [CrossRef]
  9. Coma, M.; Martinez-Hernandez, E.; Abeln, F.; Raikova, S.; Donnelly, J.; Arnot, T.C.; Allen, M.J.; Honge, D.D.; Chuck, C.J. Organic waste as a sustainable feedstock for platform chemicals. Faraday Discuss. 2017, 202, 175–195. [Google Scholar] [CrossRef]
  10. Chang, H.N.; Kim, N.-J.; Kang, J.; Jeong, C.M. Biomass-derived volatile fatty acid platform for fuels and chemicals. Biotechnol. Bioprocess Eng. 2010, 15, 1–10. [Google Scholar] [CrossRef]
  11. Bhatt, A.H.; Ren, Z.; Tao, L. Value Proposition of Untapped Wet Wastes: Carboxylic Acid Production through Anaerobic Digestion. iScience 2020, 23, 101221. [Google Scholar] [CrossRef]
  12. Moretto, G.; Valentino, F.; Pavan, P.; Majone, M.; Bolzonella, D. Optimization of urban waste fermentation for volatile fatty acids production. Waste Manag. 2019, 92, 21–29. [Google Scholar] [CrossRef] [PubMed]
  13. Radadiya, P.; Lee, J.; Venkateshwaran, K.; Benn, N.; Lee, H.-S.; Hussain, A. Acidogenic fermentation of food waste in a leachate bed reactor (LBR) at high volumetric organic Loading: Effect of granular activated carbon (GAC) and sequential enrichment of inoculum. Bioresour. Technol. 2022, 361, 127705. [Google Scholar] [CrossRef] [PubMed]
  14. Talan, A.; Pokhrel, S.; Tyagi, R.; Drogui, P. Biorefinery strategies for microbial bioplastics production: Sustainable pathway towards Circular Bioeconomy. Bioresour. Technol. Rep. 2022, 17, 100875. [Google Scholar] [CrossRef]
  15. Uçkun Kiran, E.; Trzcinski, A.P.; Liu, Y. Platform chemical production from food wastes using a biorefinery concept. J. Chem. Technol. Biotechnol. 2015, 90, 1364–1379. [Google Scholar] [CrossRef]
  16. Wu, S.-L.; Luo, G.; Sun, J.; Wei, W.; Song, L.; Ni, B.-J. Medium chain fatty acids production from anaerobic fermentation of waste activated sludge. J. Clean. Prod. 2021, 279, 123482. [Google Scholar] [CrossRef]
  17. Hussain, A.; Filiatrault, M.; Guiot, S.R. Acidogenic digestion of food waste in a thermophilic leach bed reactor: Effect of pH and leachate recirculation rate on hydrolysis and volatile fatty acid production. Bioresour. Technol. 2017, 245, 1–9. [Google Scholar] [CrossRef]
  18. Xiong, Z.; Hussain, A.; Lee, J. Food waste fermentation in a leach bed reactor: Reactor performance, and microbial ecology and dynamics. Bioresour. Technol. 2019, 274, 153–161. [Google Scholar] [CrossRef]
  19. Wang, K.; Yin, J.; Shen, D.; Li, N. Anaerobic digestion of food waste for volatile fatty acids (VFAs) production with different types of inoculum: Effect of pH. Bioresour. Technol. 2014, 161, 395–401. [Google Scholar] [CrossRef]
  20. Browne, J.D.; Allen, E.; Murphy, J.D. Improving hydrolysis of food waste in a leach bed reactor. Waste Manag. 2013, 33, 2470–2477. [Google Scholar] [CrossRef]
  21. Chakraborty, D.; Karthikeyan, O.P.; Selvam, A.; Palani, S.G.; Ghangrekar, M.M.; Wong, J.W. Two-phase anaerobic digestion of food waste: Effect of semi-continuous feeding on acidogenesis and methane production. Bioresour. Technol. 2021, 346, 126396. [Google Scholar] [CrossRef]
  22. Hussain, A.; Lee, J.; Xiong, Z.; Wang, Y.; Lee, H.-S. Butyrate production and purification by combining dry fermentation of food waste with a microbial fuel cell. J. Environ. Manag. 2021, 300, 113827. [Google Scholar] [CrossRef] [PubMed]
  23. Jiang, J.; Zhang, Y.; Li, K.; Wang, Q.; Gong, G.; Li, M. Volatile fatty acids production from food waste: Effects of pH, temperature, and organic loading rate. Bioresour. Technol. 2013, 143, 525–530. [Google Scholar] [CrossRef] [PubMed]
  24. Xu, S.Y.; Karthikeyan, O.P.; Selvam, A.; Wong, J.W. Effect of inoculum to substrate ratio on the hydrolysis and acidification of food waste in leach bed reactor. Bioresour. Technol. 2012, 126, 425–430. [Google Scholar] [CrossRef] [PubMed]
  25. Lim, S.-J.; Kim, B.J.; Jeong, C.-M.; Choi, J.-D.; Ahn, Y.H.; Chang, H.N. Anaerobic organic acid production of food waste in once-a-day feeding and drawing-off bioreactor. Bioresour. Technol. 2008, 99, 7866–7874. [Google Scholar] [CrossRef]
  26. Saha, S.; Lee, H.S. High-rate carboxylate production in dry fermentation of food waste at room temperature. Sci. Total Environ. 2020, 714, 136695. [Google Scholar] [CrossRef]
  27. Takahashi, S.; Tomita, J.; Nishioka, K.; Hisada, T.; Nishijima, M. Development of a prokaryotic universal primer for simultaneous analysis of Bacteria and Archaea using next-generation sequencing. PLoS ONE 2014, 9, e105592. [Google Scholar] [CrossRef]
  28. Callahan, B.J.; Mcmurdie, P.J.; Rosen, M.J.; Han, A.W.; Johnson, A.J.A.; Holmes, S.P. DADA2: High-resolution sample inference from Illumina amplicon data. Nat. Methods 2016, 13, 581–583. [Google Scholar] [CrossRef]
  29. Caporaso, J.G.; Kuczynski, J.; Stombaugh, J.; Bittinger, K.; Bushman, F.D.; Costello, E.K.; Fierer, N.; Gonzalez Peña, A.; Goodrich, J.K.; Gordon, J.I.; et al. QIIME allows analysis of high-throughput community sequencing data. Nat. Methods 2010, 7, 335–336. [Google Scholar] [CrossRef]
  30. Cysneiros, D.; Banks, C.J.; Heaven, S.; Karatzas, K.-A.G. The effect of pH control and “hydraulic flush” on hydrolysis and Volatile Fatty Acids (VFA) production and profile in anaerobic leach bed reactors digesting a high solids content substrate. Bioresour. Technol. 2012, 123, 263–271. [Google Scholar] [CrossRef]
  31. Xu, S.Y.; Lam, H.P.; Karthikeyan, O.P.; Wong, J.W. Optimization of food waste hydrolysis in leach bed coupled with methanogenic reactor: Effect of pH and bulking agent. Bioresour. Technol. 2011, 102, 3702–3708. [Google Scholar] [CrossRef]
  32. Yu, P.; Tu, W.; Wu, M.; Zhang, Z.; Wang, H. Pilot-scale fermentation of urban food waste for volatile fatty acids production: The importance of pH. Bioresour. Technol. 2021, 332, 125116. [Google Scholar] [CrossRef] [PubMed]
  33. Strazzera, G.; Battista, F.; Garcia, N.H.; Frison, N.; Bolzonella, D. Volatile fatty acids production from food wastes for biorefinery platforms: A review. J. Environ. Manag. 2018, 226, 278–288. [Google Scholar] [CrossRef] [PubMed]
  34. Gu, X.Y.; Liu, J.Z.; Wong, J.W.C. Control of lactic acid production during hydrolysis and acidogenesis of food waste. Bioresouce Technol. 2018, 247, 711–715. [Google Scholar] [CrossRef] [PubMed]
  35. Kim, J.K.; Han, G.H.; Oh, B.R.; Chun, Y.N.; Eom, C.-Y.; Kim, S.W. Volumetric scale-up of a three stage fermentation system for food waste treatment. Bioresour. Technol. 2008, 99, 4394–4399. [Google Scholar] [CrossRef]
  36. Ye, N.F.; Lü, F.; Shao, L.M.; Godon, J.J.; He, P.J. Bacterial community dynamics and product distribution during pH-adjusted fermentation of vegetable wastes. J. Appled Microbiol. 2007, 103, 1055–1065. [Google Scholar] [CrossRef] [PubMed]
  37. Maru, B.T.; Lopez, F.; Medina, F.; Constantí, M. Improvement of biohydrogen and usable chemical products from glycerol by co-culture of Enterobacter spH1 and Citrobacter Freundii H3 using different supports as surface immobilization. Fermentation 2021, 7, 154. [Google Scholar] [CrossRef]
  38. Liu, C.; Du, Y.; Zheng, J.; Qiao, Z.; Luo, H.; Zou, W. Production of caproic acid by Rummeliibacillus suwonensis 3B-1 isolated from the pit mud of strong-flavor baijiu. J. Biotechnol. 2022, 35, 33–40. [Google Scholar] [CrossRef]
  39. Yin, Y.; Wang, J. Optimization of fermentative hydrogen production by Enterococcus faecium INET2 using response surface methodology. Int. J. Hydrogen Energy 2019, 44, 1483–1491. [Google Scholar] [CrossRef]
  40. Esquivel-Elizondo, S.; Ilhan, Z.E.; Garcia-Peña, E.I.; Krajmalnik-Brown, R. Insights into Butyrate Production in a Controlled Fermentation System via Gene Predictions. MSystems 2017, 2, e00051-17. [Google Scholar] [CrossRef]
  41. Yamada, H.; Watabe, Y.; Suzuki, Y.; Koike, S.; Shimamoto, S.; Kobayashi, Y. Chemical and microbial characterization for fermentation of water-soluble cellulose acetate in human stool cultures. J. Sci. Food Agric. 2021, 101, 2950–2960. [Google Scholar] [CrossRef]
  42. Brame, J.E.; Liddicoat, C.; Abbott, C.A.; Breed, M.F. The potential of outdoor environments to supply beneficial butyrate-producing bacteria to humans. Sci. Total Environ. 2021, 777, 146063. [Google Scholar] [CrossRef] [PubMed]
  43. Sun, X.; Yang, Y.; Zhang, N.; Shen, Y.; Ni, J. Draft Genome Sequence of Dysogonomonas Macrotermitis Strain JCM 19375T, Isolated from the Gut of a Termite. Genome Annoucements 2015, 3, e00963-15. [Google Scholar]
  44. Slováková, L.; Dušková, D.; Marounek, M. Fermentation of pectin and glucose, and activity of pectin-degrading enzymes in the rabbit caecal bacterium Bifidobacterium pseudolongum. Lett. Appled Microbiol. 2001, 35, 126–130. [Google Scholar] [CrossRef] [PubMed]
  45. Opdahl, L. Identification of Candidate Cellulose Utilizing Bacteria from the Rumen of Beef Cattle, Using Bacterial Community Profiling and Metagenomics. 2017. Available online: https://openprairie.sdstate.edu/cgi/viewcontent.cgi?article=2688&context=etd (accessed on 24 January 2023).
  46. Andersen, S.J.; De Groof, V.; Khor, W.C.; Roume, H.; Props, R.; Coma, M.; Rabaey, K. A Clostridium group IV species dominates and suppresses a mixed culture fermentation by tolerance to medium chain fatty acids products. Front. Bioeng. Biotechnol. 2017, 5, 8. [Google Scholar] [CrossRef] [PubMed]
Figure 1. Image of (A) LBR and (B) Food-Waste-Holding Basket.
Fermentation 09 00518 g001aFermentation 09 00518 g001b
Figure 2. Cumulative SCOD production in LBRs at different operating pHs at room temperature (22 °C).
Fermentation 09 00518 g002
Figure 3. TFA compositions in the LBRs at different pHs. Butyrate refers to the sum of n-butyrate and iso-butyrate. Caproate refers to the sum of n-caproate and iso-caproate. Valerate refers to the sum of n-valerate and iso-valerate.
Fermentation 09 00518 g003
Figure 4. Microbial community compositions of food waste and leachate for LBRs operated at different pHs.
Fermentation 09 00518 g004
Table 1. Performance of LBRs at different operating pHs in this study.
ParametersLBR-UCLBR-5.5LBR-6.5LBR-7.5LBR-8.5
Cumulative SCOD production (g SCOD)71.3 ± 0.189.0 ± 3.4110.8 ± 1.7112.5 ± 2.6111.7 ± 4.1
Hydrolysis yield
(g SCOD/kg VSadded)
462 ± 6.0577 ± 22.1718 ± 11.2729 ± 17.1724 ± 26.6
Acetate (g CODFA/L)3.85 ± 0.04.5 ± 0.426.15 ± 0.527.43 ± 0.310.7 ± 0.75
Propionate (g CODFA/L)0.57 ± 0.051.76 ± 0.082.57 ± 0.222.6 ± 0.24.1 ± 0.2
iso-Butyrate (g CODFA/L)-0.08 ± 0.0 0.09 ± 0.000.24 ± 0.010.23 ± 0.05
n-Butyrate (g CODFA/L)5.72 ± 0.09.72 ± 0.1316.3 ± 1.45.9 ± 0.33.63 ± 0.1
iso-Valerate (g CODFA/L)-0.13 ±0.15 ± 0.010.32 ± 0.020.31 ± 0.00
n-Valerate (g CODFA/L)-0.76 ± 0.001.2 ± 0.091.3 ± 0.00.32 ± 0.01
iso-Caproate (g CODFA/L)-0.09 ± 0.010.08 ± 0.000.1 ± 0.00.09 ± 0.0
n-Caproate (g CODFA/L)-2.54 ± 0.012.83 ± 0.230.24 ± 0.10.11 ± 0.0
Heptanoate (g CODFA/L)-0.29 ± 0.0000.28 ± 0.00
TVFA production (C2-C7) (g CODFA)25.5 ± 0.271.4 ± 0.699.2 ± 3.067.4 ± 3.465.3 ± 4.2
TVFA yield (g CODFA/kg VSadded)165 ± 1.1463 ± 4.3643 ± 19.2437 ± 22.1423 ± 27.4
TVFA (C2-C7):SCOD (%)3680906058
Lactate (g CODLactate)39.3 ± 0.3----
Lactate yield (g CODLactate/kg VSadded)255 ± 2.1----
Lactate: SCOD (%)55----
Acidification yield (g COD/kg VSadded)420 ± 5.8463 ± 4.8643 ± 19.2437 ± 22.1423 ± 27.4
Acidification (%)9180906058
Table 2. Cumulative SCOD production in LBRs at different operating pHs in this study.
TimeCumulative SCOD Production (g SCOD)
DayLBR-UCLBR-5.5LBR-6.5LBR-7.5LBR-8.5
g SCOD%g SCOD%g SCOD%g SCOD%g SCOD%
00.00%00%00%00%00%
261.586%31.836%47.943%28.125%39.335%
463.889%46.252%74.667%45.140%55.550%
669.898%57.364%83.976%48.543%58.652%
871.1100%62.770%91.182%59.353%66.960%
1080.6113%72.882%102.392%80.371%87.278%
1268.696%81.391%108.698%98.888%100.190%
1471.3100%89.0100%110.8100%112.5100%111.7100%
Disclaimer/Publisher’s Note: The statements, opinions and data contained in all publications are solely those of the individual author(s) and contributor(s) and not of MDPI and/or the editor(s). MDPI and/or the editor(s) disclaim responsibility for any injury to people or property resulting from any ideas, methods, instructions or products referred to in the content.

