Article

The Influence of Cabernet Sauvignon Ripeness, Healthy State and Maceration Time on Wine and Fermented Pomace Phenolic Profile

1
Department of Food Technology and Biochemistry, Faculty of Agriculture, University of Belgrade, 11080 Belgrade, Serbia
2
Department of Bromatology, Faculty of Pharmacy, University of Belgrade, 11000 Belgrade, Serbia
3
Department of Physics and Mathematics, Faculty of Pharmacy, University of Belgrade, 11000 Belgrade, Serbia
4
Institute of Nuclear Sciences Vinča, National Institute of Republic of Serbia, University of Belgrade, 11351 Belgrade, Serbia
5
Institute for Plant Protection and Environment, 11000 Belgrade, Serbia
*
Author to whom correspondence should be addressed.
Fermentation 2023, 9(7), 695; https://doi.org/10.3390/fermentation9070695
Submission received: 12 June 2023 / Revised: 13 July 2023 / Accepted: 14 July 2023 / Published: 24 July 2023
(This article belongs to the Special Issue Nutrition and Health of Fermented Foods, 2nd Edition)

Abstract

:
The phenolic composition and antioxidant activity of wine and fermented pomace (FP) from Cabernet Sauvignon grapes harvested at three ripening stages were evaluated using LC-MS/MS and spectrophotometric analyses. An investigation of grey mold’s (Botrytis cinerea) influence on wine phenolic content modulation was conducted as well. Finally, the influence of the plant’s ripening stage on the dynamics of the phenolic compounds extracted from wine and FP obtained from fully ripe grapes was evaluated. In this study, the content of catechin, epicatechin, quercetin, and p-coumaric, gallic, and syringic acids was analyzed. Wine and FP were obtained after extended maceration during the spontaneous and inoculated fermentation of fully ripe grapes. When comparing the wine and FP obtained from véraison, fully ripe, and overripe grapes, catechin was the most abundant in wine (40.13 ± 3.25 mg/L) and quercetin in FP (10.96 ± 0.14 mg/kg). A decrease in analyzed phenolic compounds was noticed in wine produced from grapes affected by Botrytis cinerea, and the highest depletion was found for quercetin. The use of a winemaking technique that involved differing maceration periods and inoculation using yeasts as well as spontaneous fermentation significantly modulated the phenolic content of derived wines and FP. The dynamics of the phenolic compounds extracted into wine, evaluated using a principal component analysis (PCA), highlighted contents of catechin and epicatechin. After a decrease in maceration, the PCA revealed a notable content of gallic and syringic acids, as well as quercetin, in samples of FP. This study offers a perspective for future research and the development of functional food with a high content of phenolic compounds originating from red grape products, such as wine and fermented pomace.

1. Introduction

Grape quality is the key factor in wine production. During wine production, different classes of biologically active compounds are extracted from the solid parts of a grape and turned into wine via the vinification process [1]. Special attention should be attributed to the phenolic compounds whose content depends on grape quality and different reactions during the vinification process. Intermolecular reactions between anthocyanin and tannin may affect the phenolic profile of wine. Emphasizing the reactions between phenolic compounds and biomolecules (proteins and polysaccharides) that result in the formation of compounds with complex structures is also important. Phenolic compounds are subject to the reactions of polymerization, condensation, oxidation, and absorption by yeast cells during sedimentation [1]. It is important to emphasize that the ripening stage of the grapes in a vineyard and fungal infections significantly affect the phenolic content of wine [2,3].
To produce good quality wine, there is a need to investigate the technological properties of dominant grape varieties in Serbia. One of the most dominant grape varieties in Serbia is Cabernet Sauvignon, which can be used for the production of high-quality red wines. This grape variety is autochthonous in the Bordeaux region of France, but it is widespread in Europe and New World wine countries [4]. Almost 80% of the vineyards in the Balkan peninsula comprise red grape varieties, among which Cabernet Sauvignon is one of the most represented. One of the reasons for such a prevalence of Cabernet Sauvignon across the world is its ability to acclimate to different climate conditions, especially in regions with high annual temperature ranges [5].
During the ripening stage, compounds of great oenological importance, such as phenolic compounds and aroma precursors, accumulate in grape berries [6]. Aroma precursors are the key factor that influences a wine’s organoleptic characteristics, which are important for the consumer’s choice of appropriate wine [7]. During the ripening of berries, their sugar content rises while their concentration of acids decreases. Véraison is an essential stage of grape ripening, in that during this period, color, aromatic compounds, and minerals accumulate [8]. Red grape varieties start the accumulation of phenolic compounds during véraison [9]. A study conducted on different red grape varieties showed that the extraction of phenolic compounds from Cabernet Sauvignon is easier than from Monastrell grapes [10].
Except for during the ripening stage, grape quality depends on the plant’s diseases. Grey mold is one of the most serious diseases affecting grapes, for which Botrytis cinerea is responsible. Grape infection with this mold leads to the degradation of catechin, epicatechin, phenolic acids, and esters of tartaric and ferulic acids [11,12]. The odor and the color of red wines can change as a result of the presence of Botrytis cinerea, which, in the final stage, leads to unwanted aromas. It is important to highlight that, in grapes affected by Botrytis cinerea, the presence of the enzyme laccase leads to the quick oxidation of phenolic compounds [13]. The literature data indicate only a few studies that deal with the impact of Botrytis cinerea on the content of individual phenolic compounds.
Besides these factors, it is very important to point out appropriate winemaking protocols that include the use of different yeast strains and maceration times. These factors can influence, at the same time, the optimization of extraction yields and the preservation of the integrity of the extracted phenolic compounds in wine [14].
Several studies have aimed to understand the impact of grape maturity on the phenolic profile of grapes and wine [15,16,17], but the phenolic profile of fermented pomace (FP) is not clear enough yet. Fermented pomace is a significant source of the phenolic compounds that remain after wine production. The extraction of phenolic compounds from FP could be very useful in practical applications. Unfortunately, today, FP is usually considered a byproduct that has no further application. However, FP has practical applications in various areas of industry. For example, it can be used as a dietary supplement, food additive [18], and biomaterial [19]. In addition to its economic benefits, the usage of FP contributes to environmental protection. The literature includes studies related to the influence of maceration time on the phenolic content of wine [3,20,21], while the dynamic of phenolic compounds extracted from FP during prolonged maceration has not been studied. Among the procedures that have been applied during winemaking in the literature, the extraction of phenolic compounds from grape skin and seeds has been emphasized [22,23]. Prior studies have shown that catechin, epicatechin, and quercetin, as well as phenolic acids (gallic, syringic, and p-coumaric) were the most represented in wine [2,14,21,24,25] and fermented pomace [25,26,27].
Different ripening stages of grapes and the presence of grey mold can significantly affect the phenolic profile and antioxidant properties of wine. Winemaking techniques, which include spontaneous fermentation, also contribute to the higher content of phenolic compounds in wine compared to fermented pomace (FP). This study aimed to show technical and experimental findings related to the influences of different ripening stages, fungal infections, and dynamics of phenolic compound extraction on the phenolic profile and antioxidant properties of wine and FP. The analyzed wine and FP in this study were obtained after spontaneous and inoculated fermentation, during which a prolonged maceration has been applied.

2. Materials and Methods

2.1. Plant Material

Grapes used for this investigation originated from the Belgrade wine growing area, experimental vineyards of the Faculty of Agriculture, University of Belgrade (44°45′23.8″ N 20°34′57″ E). Phytosanitary, 100% healthy grapes were used for all experiments, except in an experiment in which grapes affected by grey mold were used (Botrytis cinerea). Grey-mold grapes were obtained from the Trišić winery vineyard located in the Belgrade wine growing area (44°58′43″ N 20°27′60″ E).

2.2. Chemicals and Reagents

All chemicals and reagents were analytical grade and were obtained from Sigma-Aldrich (Steinheim, Germany) and Fluka (Buch, Switzerland). The Oasis HLB bcc/200 µm SPE cartridges were obtained from Waters (Milford, MA, USA).

2.3. Winemaking

2.3.1. Different Ripening Stages

For the first part of this research, the grape variety Cabernet Sauvignon was harvested in three different stages of ripening: véraison, fully ripe, and overripe. After grape crushing and de-stemming, K2S2O5 (10 g per 100 kg) was added to the grape must and Saccharomyces cerevisiae yeast strain in the amount of 20 g/hL (BDX, Lallemand, Montréal, QC,Canada) was inoculated. The grapes in the véraison stage were harvested during the last week of August 2020. Total sugar content was 19.8 °Brix and titratable acid content was 7.10 g/L, expressed as tartaric acid. Total sugar content was corrected up to 23.9 °Brix by adding 205 g of sugar (sucrose) calculated to the content of must. Sugar was added to achieve the same alcohol content as in wine produced from fully ripe grapes (for comparison reasons). Grapes at the fully ripe stage were harvested during the first week of October 2020. Total sugar content was 23.4 °Brix and titratable acid content was 6.5 g/L, expressed as tartaric acid. The harvest of overripe grapes was carried out 21 days after they had fully matured. The sugar content was 24.5 °Brix and titratable acidity was 4.20 g/L, expressed as tartaric acid. For all three aforementioned vinifications, maceration lasted for 21 days during alcoholic fermentation at a temperature of 25 ± 2 °C while using the “pigeage” system. The end of fermentation was determined when the total sugar content was decreased to 4 °Brix, measured by a refractometer. Obtained wine samples were bottled and stored until required for further analysis. Samples of FP from all three ripening stages were stored at −80 °C until required for further analysis.

2.3.2. Healthy Grapes vs. Grapes Affected by Botrytis cinerea

The second part of the experiment consisted of two vinifications. In the first, healthy grapes were used, while in the second, the ones affected by grey mold were used (Botrytis cinerea). The presence of Botrytis cinerea was evaluated by visual assessment. Healthy grapes and grapes affected by Botrytis cinerea were separately crushed, de-stemmed, and K2S2O5 was added in an amount 10 g per 100 kg. Both vinifications were inoculated by yeast strain Saccharomyces cerevisiae (BDX, Lallemand, Montréal, QC, Canada) in the amount of 20 g/hL. During the 14 days of maceration at a temperature of 25 ± 2 °C, grapes were mechanically punched down twice a day.

2.3.3. Different Vinifications and the Dynamics of Phenolic Compound Extraction

The third part of the experiment focused on wine production from fully ripe grapes during spontaneous and inoculated fermentation in which different maceration periods were applied. During alcoholic fermentation, maceration was carried out by vinifications at a temperature of 25 ± 2 °C where the grape must be mechanically punched down twice a day. Before alcoholic fermentation, the grape must be inoculated with yeast strain Saccharomyces cerevisiae and K2S2O5 (10 g of per 100 kg) was added. Three individual vinifications were inoculated with the following commercial yeasts: BDX (Lallemand, Montréal, QC, Canada), FX10 (Laffort, Bordeaux, France), and Qa23 (Lallemand, Montréal, QC, Canada). For each vinification, maceration lasted 0, 3, 5, 7, 14, and 21 days, respectively. After conducting spontaneous fermentation (SF without commercial yeast), where maceration time was the same as for the inoculated one (0, 3, 5, 7, 14, and 21 days) wine samples were also obtained. The control samples were those obtained on 0 days according to the technology of white wines (without maceration) for inoculated and spontaneous fermentation. From all four vinifications (three with inoculated yeast and SF), wine and separated FP were obtained and used for further analysis. Pomace (unfermented) obtained after grape crushing was used as a control for all four vinifications in which the content of phenolic compounds was analyzed. After a specified period of maceration, wine samples were separated from grape solids and stored in glass jars for stabilization. Wines were racked after one week, and bottled in 0.75 L glass bottles. Obtained wines were stored in a wine cellar at a temperature of 14 °C until required for analysis.

2.4. Sample Preparation

Wine sample preparation was conducted by solid phase extraction (SPE) with a slight modification of the method by [28], which was performed in the vacuum device SPE Vacuum Manifold Baker SPE12G (Fisher Scientific, Göteborg, Sweden) using Oasis HLB bcc/200 µm cartridges (Waters, Milford, MA, USA). The cartridge was conditioned with 5 mL of methanol, followed by 5 mL of distilled water. From each wine sample, 5 mL was loaded, then washed with 2 mL of distilled water, and eluted with 2 mL of methanol. Collected wine samples were used for LC-MS/MS analysis.
Fermented pomace samples were prepared using the following procedure. A 30 g FP sample was lyophilized. After performed lyophilization, the mass of obtained FP samples ranged from 7 g to 10 g. The lyophilization process was carried out using a laboratory freeze dryer Christ Alpha 2-4 LD plus (Osterode am Harz, Germany) for 72 h, at temperature −80 °C and pressure of 0.008 mbar. For further extraction, 2.5 g of each lyophilized sample was used. Extraction was carried out by methanol/water mixture (1:1) for 45 min in the water bath Bandelin SONOREX SUPER Ultrasonic bath RK 514 BH (Bandelin Electronic, Berlin, Germany). Evaporation of the obtained filtrates was conducted in a rotating vacuum evaporator IKA RV 10 basic (IKA Werke GmbH, Staufen, Germany) until dryness was achieved. The temperature during evaporation was up to 35 °C to preserve thermo labile phenolic compounds of the sample. The rotating speed of the vacuum evaporator was accommodated due to a decrease in filtrate volumes. Obtained dry extracts were weighted and dissolved in 12% ethanol (imitation-like wine). Fermented pomace samples were prepared for LC-MS/MS analysis by SPE, using the same procedure already described for the preparation of wine samples.

2.5. LC-MS/MS Analysis

The analysis was performed by using a liquid chromatograph Agilent 1290 Infinity II LC System (Agilent Technologies, Santa Clara, CA, USA) with a binary pump combined with a triple quadripole Agilent LCTQ 6495C Triple Quadrupole (Agilent Technologies, Santa Clara, CA, USA) in accordance with a slightly modified method [29]. The components are separated in the column Zorbax Rapid Resolution C18.50 × 4.6 mm, 1.8µm (Agilent Technologies, Santa Clara, CA, USA) in a system of 0.1% (v/v) formic acid in methanol (A) and 0.1% (v/v) formic acid in water (B). The following gradient was used: 0 min—95% B, 2 min—95% B, 10 min- 50% B, 12 min—30% B, and 20 min—10% B. During analysis, the column was kept at 40 °C, while the flow rate and injection volume were 0.40 mL/min and 2 µL, respectively. The MassHunter Optimizer software (Agilent Technologies, Santa Clara, CA, USA) was used to obtain optimized parameters for quantification of investigated components, including ionization mode, cone voltage, collision energy, and characteristic transitions MRM (multiple reaction monitoring), which are present in Table 1. Tested phenolic compounds were identified by comparison of their retention times (tR) and mass spectra (MRM modes) with relevant standards. All samples were measured in triplicate. Chromatograms of identified phenolic compounds are presented in Figure S1.

2.6. Determination of Titratable Acidity

The amount of 25 mL was titrated with 0.25 M NaOH aiming to estimate titratable acidity of wine [30]. The titration endpoint (pH 7.0 ± 0.5) was indicated by a pH meter.

2.7. Determination of Total Soluble Solids-Sugar Content

Sugar content (expressed in °Brix) was measured in fruit juice by using a re-refractometer PAL-87S (Atago, Tokyo, Japan)

2.8. Total Phenolic Content (TPC)

Total phenolic content (TPC) in wine and pomace samples was evaluated by the Folin–Ciocalteu (FC) method using gallic acid as a standard [30]. All samples were measured in triplicate.

2.9. Ferric Reducing Activity of Plasma (FRAP)

Determination of the antioxidant activity of wine samples and pomace extract was carried out using the method FRAP [31]. The results are expressed in mmol Fe2+/L for wine and mmol Fe2+/kg of FP. All samples were measured in triplicate.

2.10. Trolox Equivalent Antioxidant Capacity (TEAC)

The TEAC test is based on the reduction in the ABTS cation radical and was carried out in accordance with the procedure described by Re et al. [32] but with slight modifications. Antioxidant activity was calculated based on decreasing absorbance and expressed as mmol of Trolox equivalents per liter of wine or kg of fermented pomace (Trolox mmol/L or mmol/kg). All samples were measured in triplicate.

2.11. Statistical Analysis

Statistical analyses were conducted using SPSS Statistic V22.0 software (IBM, Chicago, IL, USA; 2014); one-way ANOVA (in the analysis of the phenolic profile of the wine and FP the factor was ripening stage of grape and in the analysis of the influence of Botrytis cinerea on the phenolic profile the factor was healthy condition (healthy grapes and grapes infected by grey mold)), two-way ANOVA (the factors were type of vinification and maceration time), with Tukey post hoc test for subgroup differences, and Principal Component Analysis (PCA). p-values lower than 0.05 were significant.

3. Results and Discussion

3.1. Phenolic Profile and Antioxidant Properties of Wine and FP Obtained from Grapes of Different Ripeness

Obtained wine and pomace samples from the grapes of three different ripening stages were used for the analysis of phenolic profiles and antioxidant properties.
One-way ANOVA was used to estimate the influence of different ripening stages on the content of phenolic compounds of wine and FP. A statistically significant difference (p ˂ 0.05) for the content of all analyzed phenolic compounds was found in wine and FP.
After performing the Tukey post hoc test, a significant difference between subgroups was confirmed. Statistically significant differences (p ˂ 0.05) were found in wine samples for all phenolic compounds, except for the content of syringic acid from fully ripe grapes (p = 0.275), and for p-coumaric acid content from véraison and fully ripe grapes (p = 0.372) (Table 2). Samples of FP showed statistically significant differences (p ˂ 0.05) for all phenolic compounds, except for gallic acid content from véraison as well as fully ripe grapes (p = 0.392), and p-coumaric acid content from véraison and overripe grapes (p = 0.99) (Table 3).
The highest content of phenolic compounds in wine samples was detected for catechin and epicatechin (Table 2). Observing results related to grape ripening stages, a high content of these two compounds was noticed in wine samples produced from the fully ripe and overripe grapes. The lowest content was found in wine from véraison stage grapes. Obtained results are in line with the literature data, which indicate higher content of these phenolic compounds in wine produced from ripe grapes [33]. The entire content of flavan-3-ols in this study (catechin and epicatechin) from grapes of the véraison stage is hard to extract into the wine. From this point of view, it is important to emphasize that alongside the influence of environmental conditions and maceration time, the ripening stage of the grape is directly linked to the phenolic profile of wine [34]. The content of epicatechin and catechin in FP (Table 3) was noted in significant amounts. Epicatechin and catechin are two of the most abundant phenolic compounds from grapes and wine, which are responsible for their anti-hyperlipidemic effect and the reduction in plasma cholesterol levels [35]. Overall, the higher content of catechin than that of epicatechin is in line with results from a study of pomace of Cabernet Sauvignon from Argentina [25]. A study of red grape skin conducted by Du et al. [36] showed that catechin was the most abundant flavanol detected during all ripening stages while epicatechin content was lower. The beneficial health effect of grape pomace emphasized its ability to prevent oxidative stress and inflammation of human tissues. The activity of grape pomace can be attributed to catechin, which is the major phenolic compound [37].
A notable amount of gallic and syringic acid was detected among hydroxybenzoic acid derivatives (Table 2). According to Muñoz-Bernal et al. [38], among the others, these two compounds were the principal phenolic acids in Cabernet Sauvignon wine. During the ripening of the grapes used in our experiment, the amount of gallic acid decreased. Our results are supported by a study in which the highest content of these compounds was obtained from grapes in the véraison stage [15]. The content of gallic acid in a wine produced from fully ripe grapes (Table 2) was significantly higher compared to data from our prior study of Cabernet Sauvignon wine [14]. On the other hand, it is important to highlight that a similar content of gallic acid was reported in the literature [39]. The health benefits of gallic acid include the ability to prevent oxidative stress by the reduction in reactive oxygen species and lipid peroxidation [40]. Unlike gallic acid, the content of syringic acid increased during the ripening of the grape (Table 2). These findings are consistent with the study by Özcan et al. [17], as well as the experiments of Cabernet Sauvignon from Chile where the content of syringic acid started to increase after the véraison stage and maintained the same trend during the ripening of the grape [16]. The content of syringic acid in FP was almost ten times higher than gallic acid (Table 3). As in our results, data from another study indicated that syringic acid was more abundant than gallic acid [27]. It is important to point out the capacity of syringic acid as an alternative for the treatment of ulcerative colitis [41]. As opposed to the obtained data (Table 3), gallic acid was not detected in Cabernet Sauvignon pomace [25].
The content of p-coumaric acid decreased during the ripening of the grape, which affected the content of this phenolic acid in wine (Table 2). Results from another study revealed a lower content compared to our obtained values [39]. On the contrary, results from our prior study reported a higher content of p-coumaric acid in wine produced from fully ripe grapes [14]. Among all phenolic compounds of FP, p-coumaric acid was detected in the lowest content (Table 3). This finding correlates with the study of Cabernet Sauvignon pomace, which found that p-coumaric acid was not detected [27]. Contrary to this, Nui et al. [42] reported that p-coumaric acid was the dominant compound of grape extracts while its content increased as grape development progressed. Phenolic acids, such as p-coumaric, which was isolated from a natural source, showed neuroprotective and antidepressant effects [43]. Quercetin content in wines was the lowest among all other quantified phenolic compounds (Table 2). Data from the literature showed higher contents of quercetin in Cabernet Sauvignon wine [25,39]. These findings are supported by the fact that variable flavonol content in the same grape variety depends on the interactions of different terroirs [44]. In contrast to wine, quercetin was one of the most abundant compounds detected in FP (Table 3). By observing the ripening stages, the highest amount of quercetin was detected in FP of fully ripe grapes. This finding is in line with the study of Lingua et al. [25], which emphasized that quercetin was the main flavonol of Cabernet Sauvignon grapes at their optimal ripening stage. Extracts of grape skin of different ripening stages showed an increase in quercetin content during grape ripening [36]. It is interesting to highlight that quercetin effectively reduced the progression of atherosclerosis by suppressing the oxidised LDL fraction of cholesterol and the p38 MAPK/p16 pathway [45].
One-way ANOVA analysis was applied to estimate the influence of different ripening stages on the antioxidant activity (evaluated by FRAP and TEAC methods) and TPC of wine and FP. By observing wine samples, one-way ANOVA showed a statistically significant difference (p ˂ 0.05) for values obtained in all three methods applied: FRAP (p = 0.046), TEAC (p = 0.023), and TPC (p = 0.032). Unlike in wine, the FP one-way ANOVA showed a statistically significant difference (p ˂ 0.05) for FRAP (p = 0.043) and TPC (p = 0.022) values, while for TEAC there was no significant difference (p = 0.370).
The Tukey post hoc test was used to evaluate significant differences between subgroups for FRAP, TEAC, and TPC values of wine and FP. Using the Tukey post hoc test, a statistically significant difference was shown (p ˂ 0.05) for TEAC values of wine produced from véraison grapes in comparison with the wine produced from grapes in other ripening stages. Values of TPC analyzed by the Tukey post hoc test showed a statistically significant difference (p ˂ 0.05) between wine produced from the grape of véraison and overripe stages. The Tukey post hoc test showed only a statistically significant difference (p = 0.019) for TPC values of FP obtained from véraison and fully ripe grapes.
In this study, it was noticed that TPC increased during the ripening of grapes, and the highest value was observed in wine produced from overripe grapes (Table 4). Literature data suggest that the maturity stage of grapes had a great influence on the TPC of wine [46]. During the ripening of grapes, the amount of phenolic compounds increases, but it could decline later during the grape development [47]. The continuously increasing TPC during different ripening stages could be explained by the fact that phenolic extractability increases during ripening [10]. Du et al. [36] evaluated the TPC of grape skin and noticed an increase with the advancement of maturity. In contrast to the results of wine samples, values for TPC in FP (Table 4) increased in the sample obtained from fully ripe grapes and then decreased in FP from overripe grapes. During the extraction, the balance of phenolic compounds between pomace and wine is established by adsorption–desorption processes, and when the highest content of TPC is reached, further extraction from the grape is not possible [48].
Besides TPC in wine and FP, the antioxidant activity of samples was determined by the FRAP and TEAC methods (Table 4). The antioxidant activity of wine measured by the FRAP method increased and the highest activity was observed in a wine produced from overripe grapes. Obtained results are consistent with the increase in TPC values of analyzed wine samples. The highest value for antioxidant activity measured by the TEAC method was observed in wine from fully ripe grapes. For the results related to FP, the highest values for both methods FRAP and TEAC were obtained for samples of fully ripe grapes. The highest value for TPC in FP of fully ripe grapes correlates well with the highest values for antioxidant activity measured by FRAP and TEAC methods in the same ripening stage. Data for the literature emphasized the same positive correlation between TPC and antioxidant activity [36,49]. The antioxidant activity of grape seeds and skin extracts investigated during the ripening of some red varieties showed different values. Higher FRAP values were noticed in the skins of ripe grapes, as opposed to the seeds whose FRAP values were higher in the véraison stage. Results for the TEAC method showed higher values at the véraison stage [50]. It is interesting to point out that TEAC values of FP of Cabernet Sauvignon at the optimal mature stage could be higher than the values in our results, which depend on the technology applied in wine production and the terroir [25]. Red grape skin extracts showed an increase in TEAC values during grape ripening [36]. High antioxidant activity evaluated by the same method was noticed for the fresh pulp of fully ripe grapes [51].

3.2. Influence of Botrytis cinerea on the Phenolic Profile of Wine

To show the influence of grey mold on the phenolic profile, wines were obtained from two vinifications: the healthy grapes and grapes affected by grey mold (Botrytis cinerea). The produced wines were analyzed by LC-MS/MS and the content of the phenolic compound was quantified (Table 5). One-way ANOVA was applied to estimate the influence of Botrytis cinerea on the content of phenolic compounds in wine. A statistically significant difference (p ˂ 0.05) in the content of phenolic compounds in wine produced from healthy grapes and grapes affected by Botrytis cinerea was shown for all compounds except for p-coumaric acid (p = 0.154) (Table 5). Grape skin is the main source of phenolic compounds, therefore direct contact of skin with Botrytis cinerea causes a decrease in its content [52]. Our results showed a lower content of phenolic compounds in wines produced from moldy grapes in comparison with the wines produced from healthy ones (Table 5), which is in line with the previously mentioned literature data. Produced wine from grapes affected by Botrytis cinerea showed a decreased concentration of catechin by 28.51% and epicatechin by 10.90% compared to wines from healthy grapes (Table 5). The destruction of catechin and epicatechin results in an organoleptic change in wine, which could significantly affect its quality [11]. The enzyme laccase is responsible for the destruction of phenolic compounds and its activity persists even during the winemaking process [13,53]. Phenolic compounds of FP, obtained from grapes affected by Botrytis cinerea, are quickly susceptible to the enzymatic activity of laccase. To adequately preserve FP for further analysis, we needed to apply shock freezing, which was not available during the work in the field. When observing quantified phenolic compounds in these two vinifications, it is important to highlight that gallic acid and quercetin proved to be good substrates for the enzymatic activity of laccase. It can be explained by the fact that those compounds contain at least two hydroxyl groups in the phenolic ring on the meta and para positions, which leads to its rapid oxidation by laccase [13]. Quercertin is presented in the glycoside form in the grape (quercertin monoglycoside), which is the most stable form of this phenolic compound. During the alcoholic fermentation, which involves the activity of Saccharomyces cerevisiae and non-Saccharomyces cerevisiae yeast strains, glycolytic enzymes cleave the glycoside bonds. As a result of this action, an unstable aglycone of quercetin is obtained. This form of quercetin is more susceptible to oxidation and co-pigmentation, which could explain the high depletion in the content of this phenolic compound in wine and FP obtained from grapes affected by the grey mold [54]. Data from a previous study indicate that the enzymatic activity of fungal laccase with phenolic compounds from wine showed the highest oxygen consumption for gallic acid (89%) and a little bit lower for quercetin (82%) [55]. Its data support our results, which indicate lower content of gallic acid and quercetin in wine produced from the moldy grape. The presence of these two compounds is significant due to their beneficial health effect. Gallic acid showed the ability to prevent health problems related to vascular tissues caused by atherosclerosis [56]. The cardioprotective effect of red wine is derived from the presence of phenolic compounds, particularly quercetin, which showed the ability to regulate lipoprotein metabolism [57]. Our results are in line with a study that indicates that p-coumaric acid showed the lowest interaction during the enzymatic reaction with laccase [13]. Data from a previous study indicate that p-coumaric acid could be used for the treatment of uncontrolled inflammation of the digestive tract [41].

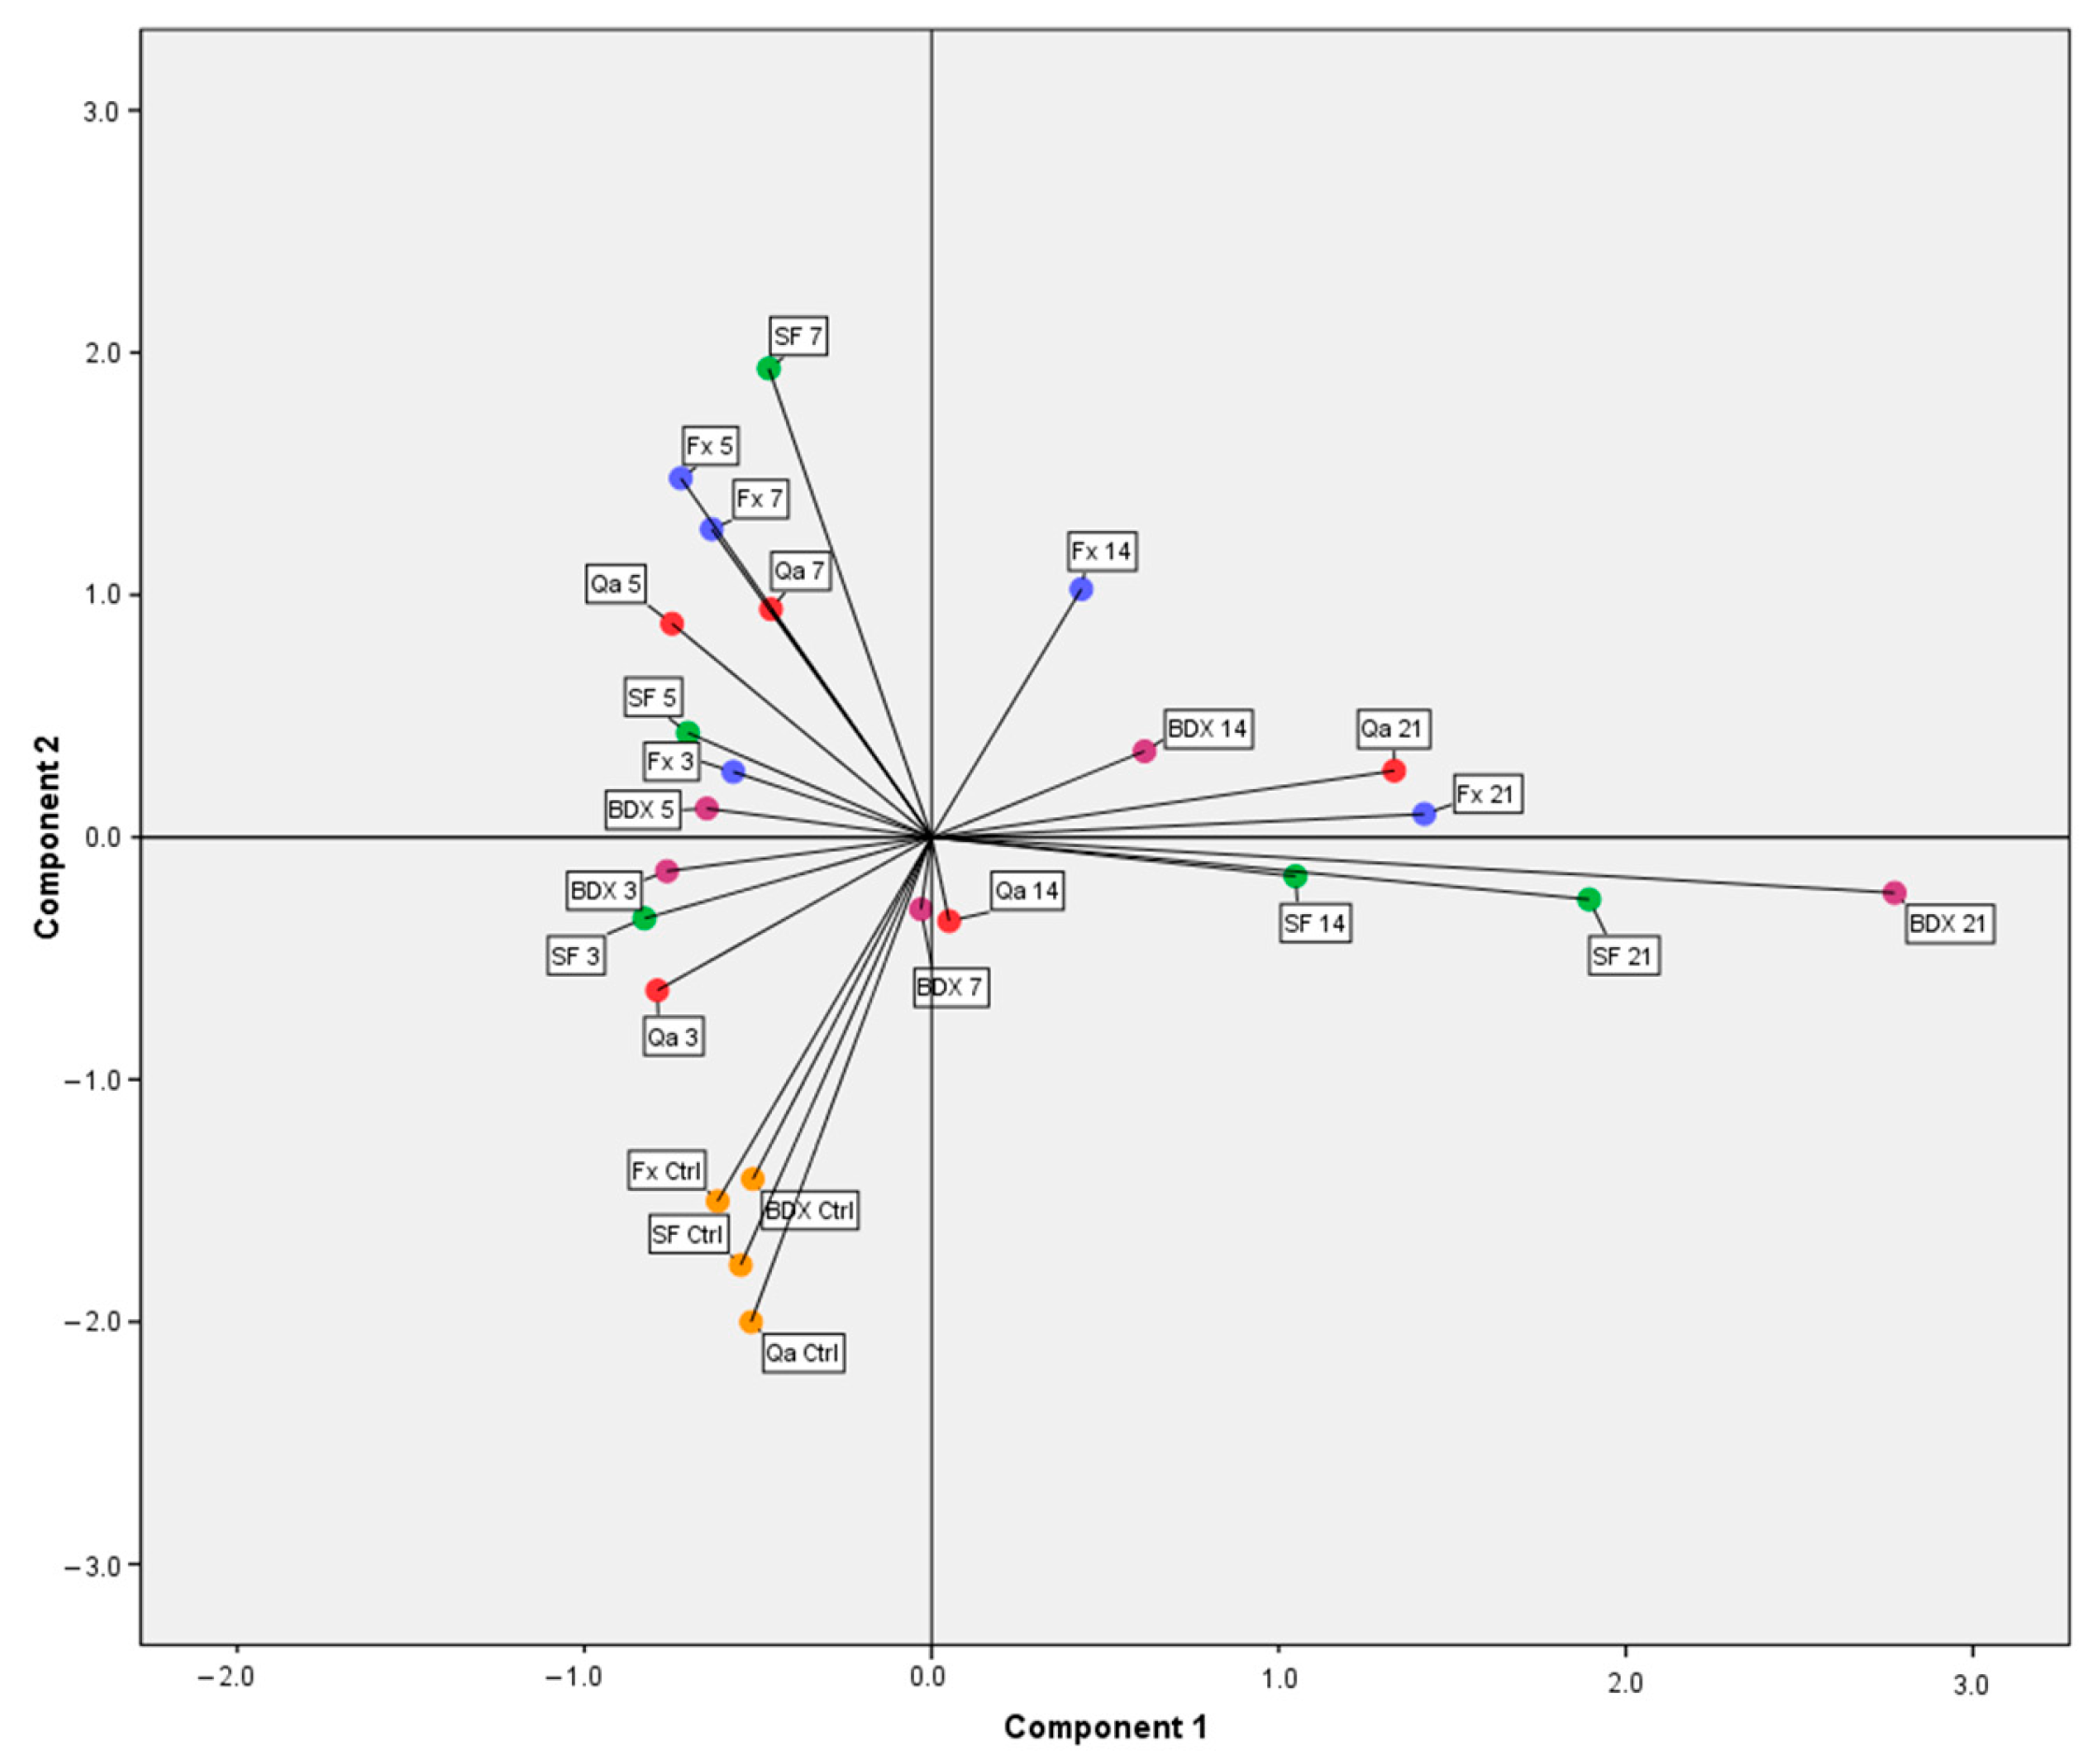
3.3. Dynamic of Phenolic Compounds Extraction during Inoculated and Spontaneous Fermentations

To estimate the influence of different kinds of yeast used during fermentation, different vinifications, and different maceration times (expressed in days) on the content of phenolic compounds in wine and FP, a two-way ANOVA analysis was applied. Four different vinifications were observed (BDX, FX, Qa, and SF), and in each of them, the same six maceration periods were observed. The content of phenolic compounds was separately observed in wine and FP.
Statistical analysis showed that the content of phenolic compounds in wine indicates that there were no interactions (p = 0.993) between different kinds of yeasts used in fermentation and different maceration periods. On the contrary different maceration periods showed statistically significant differences (p = 0.000) on the content of phenolic compounds. Different vinifications applied for wine production did not show significant differences in the content of phenolic compounds (p = 0.626).
After statistical analysis was carried out for the content of phenolic compounds in FP, it was shown that there were no interactions between different kinds of yeasts used in fermentation and different maceration periods (p = 0.843). Maceration time was statistically significant for the content of phenolic compounds in FP (p = 0.012). Unlike in wine, different kinds of yeasts in FP used in fermentation showed significant differences (p = 0.04).
PCA statistical analysis with varimax rotation was carried out to show a trend of the dynamics of phenolic compound extraction in wine and FP during different vinifications and maceration periods. The contents of six phenolic compounds from wine and FP (catechin, epicatechin, quercetin, gallic, p-coumaric, and syringic acids) obtained during four different vinifications and maceration periods were analyzed with PCA.
After confirmation of statistical parameters (Kaiser–Meyer–Olkin criterion = 0.611; Bartlett’s test of sphericity p < 0.05), PCA analysis of wine was carried out (Figure 1). It was possible to identify the two main components. The first component described catechin, epicatechin, and gallic acid better, while the second one described quercetin, syringic, and p-coumaric acids better (Figure S2). The same component also described catechin and epicatechin since these two compounds are epimers. It is interesting to emphasize the correlation between the results of the two-way ANOVA and the PCA. In comparison with controls in all four fermentations, content of phenolic compounds described by the second component increased up to the 7th day of maceration while the first component remained unchanged (Figure 1; Table 6). Our results are in agreement with a study that detected syringic acid in wine from the Cabernet Sauvignon variety after 9 days of maceration [58]. In comparison with the findings from our study, a much lower content of p-coumaric acid was found by Alencar et al. [24] and Kocabey et al. [21] after grape maceration, which had lasted 15 and 30 days, respectively. According to Baleiras-Couto et al. [59], gallic acid in grapes must be in low amounts at the beginning of fermentation, but its content increases throughout fermentation. It is important to emphasize that gallic and p-coumaric acids show good bioaccessibility through the digestive system and their metabolites may reach the colon where they could express beneficial health effects [60]. On the 14th and 21st day of maceration, content of phenolic compounds described by the first component increased, while the second component remained unchanged (Figure 1; Table 6). Data from the literature suggest that maximum amounts of catechin and epicatechin were found at the end of prolonged maceration [3,21]. Likewise, Artem et al. [61] reported that catechin content increased up to the 8th day of maceration, after which concentration almost doubled during the additional eight days of maceration. The studies conducted on cell cultures and experimental rats pointed out that epicatechin and catechin showed the ability to promote vascular health and prevent kidney damage [62,63]. Contrary to our results, it was found by Ivanova-Petropulos et al. [58] that the amount of gallic acid increased during maceration, which lasted up to 9 days.
Application of various pure wine yeast cultures showed different glycolytic activity, which results in the liberation of different extents of aglycones of phenolic compounds. During the process of sedimentation at the end of the fermentation process, different absorption abilities of yeasts and maceration times affect the content of specific phenolic compounds. It is possible to highlight the occurrence of precipitation of phenolic compounds on the surfaces of yeast cells as well as FP [64]. Differences regarding the absorption of phenolic compounds during the application of various yeasts appear due to different structures of cell walls. The reason for the different structures is the composition of polar groups on the surface of the cell wall. Those polar groups can increase or decrease the absorption of phenolic compounds on yeast cell walls [65]. Among all four vinifications, the highest variability in the dynamics of the phenolic compound extraction, described by the first component, was observed for the BDX vinification. A significant increase in the content of phenolic compounds, described by the second component, was observed for the FX vinification up to the 5th day, while compounds described by the first component increased between the 7th and 14th days (Figure 1). The Qa vinification showed a slower increase in both components compared to the FX vinification. The highest value for the second component was obtained on the 7th day of spontaneous fermentation (SF), which significantly contributed to an increase in quercetin. In Figure 1, different vinifications obtained for the 14th and 21st days of maceration were located on the right side of the y-axis. It correlates with the results of two-way ANOVA, which indicated a significant difference between values obtained on the 21st and before the 14th day of maceration. Vinifications in which maceration lasted for 14 days are located near the center of the PCA diagram (Figure 1). Such a position on the diagram is due to the significant difference between values of the 14th day and the beginning of maceration, which is in line with the two-way ANOVA. Our findings are consistent with Oliva et al. [66] who stated that shorter maceration times led to significantly lower phenolic content in comparison with the prolonged maceration applied for red wine production.
After confirmation of statistical parameters (Kaiser–Meyer–Olkin criterion = 0.593; Bartlett’s test of sphericity p < 0.05), a PCA analysis of FP was carried out (Figure 2). Two main components were highlighted. The first component best described catechin, epicatechin, and p-coumaric acid, while the second one best described quercetin, syringic, and gallic acids (Figure S3). Like in wine, the first component described catechin and epicatechin, while the second component described two compounds of the same group (hydroxybenzoic acid derivatives-syringic and p-coumaric acids).
By observing Figure 2, it is possible to emphasize that the dynamics of phenolic compound extraction during different vinifications showed a similar trend of change in all vinifications, except for Qa. Specific changes in Qa vinification were observed during the 3rd, 5th, and 7th days of maceration (Figure 2). Compounds described by the first component were increased, and the highest value was achieved on the 5th day (Figure 2; Table 7). Unlike our results, data from another study showed that p-coumaric acid was not detected in an FP of the same grape variety [27]. Qa vinification showed a sudden increase in catechin and epicatechin contents up to the 5th day while it decreased on the 7th day of maceration. Two other studies indicated that catechin and epicatechin were the most dominant compounds in Cabernet Sauvignon grape pomace [67,68].
A study of grape pomace obtained after 11 days of maceration highlighted a high abundance of catechin and epicatechin, as well as syringic acid [26]. Phenolic compounds of red grape pomace showed the ability to improve insulin responses during the meal, which is important for the prevention of chronic non-communicable diseases [69]. During the 14th and 21st days of maceration, its content was stabilized. The correlation between results obtained by the two-way ANOVA and PCA indicates a significant influence of Qa yeast on the dynamics of the phenolic compound extraction from FP, especially on the 5th day of maceration. Observing these results, it is possible to highlight clusters of the same maceration periods of different vinifications during which component two increased while component one stagnated (Figure 2). Such a trend indicated an increase in quercetin, syringic, and gallic acids (Table 7). The presence of syringic and gallic acids in FP of Cabernet Sauvignon was also confirmed in another study [27]. These two compounds also express significant beneficial health effects. It is especially possible to highlight the neuroprotective activity of syringic acid and its potential ability in the prevention of Alzheimer’s disease [70]. By observing the dynamic of quercetin extraction, obtained results are in line with a study that showed a higher content of quercetin in FP, which had macerated, in comparison with pomace, which was not macerated [71]. Among the different grape varieties that were analyzed, de la Cerda Carrasco et al. [67] reported that Cabernet Sauvignon showed the highest content of flavonols from pomace extracts. Values of catechin and epicatechin only mildly increased on the 5th day of maceration in SF and FX vinifications, while during other days, a significant change was not observed.

4. Conclusions

The present study, which investigated the effect of the ripening stage and phytosanitary state of grapes, as well as winemaking techniques, showed significantly different impacts on the phenolic profiles and antioxidant properties of wine and FP. The fully ripe grapes were found to be the most suitable for the production of wine with optimal content of selected phenolic compounds after 21 days of maceration, while it was also confirmed for the same samples of FP. Grapes with Botrytis cinerea affect the content of selected phenolic compounds in wine, as compared to a wine produced from healthy grapes. Among selected compounds, the highest depletion in the phenolic profile was noticed for quercetin, while the lowest was for p-coumaric acid. The winemaking technique, which involved prolonged maceration (21 days) and inoculation by yeasts, as well as spontaneous fermentation, significantly modulates the phenolic content of derived wines. The dynamics of phenolic compounds extracted from wine produced from fully ripe grapes helped to find the most suitable winemaking conditions for the highest content of the analyzed phenolic compounds. Furthermore, obtained samples of FP showed a rich source of these compounds, especially after a short maceration time. This study offers a perspective for future research, the development of a functional food, and different dosage forms of dietary supplements. Food enrichment, with a high content of phenolic compounds, originating from red grape products, such as wine and FP, is significant for the production of foods with added value.

Supplementary Materials

The following supporting information can be downloaded at: https://www.mdpi.com/article/10.3390/fermentation9070695/s1, Figure S1: Chromatograms of identified phenolic compounds; Figure S2: Loading plots of phenolic compounds detected in wine; and Figure S3: Loading plots of phenolic compounds detected in FP.

Author Contributions

Conceptualization, A.P. and U.Č; methodology, G.V. and M.Č.; software, D.M.; formal analysis, D.M. and U.Č.; investigation, N.L. and G.V.; resources, A.P.; data curation, N.L.; writing—original draft preparation, N.L.; writing—review and editing, U.Č. and A.P.; visualization, U.Č.; supervision, A.P.; project administration, A.P.; and funding acquisition, A.P. and S.D. All authors have read and agreed to the published version of the manuscript.

Funding

This research was funded through grants from the Ministry of Science, Technological Development and Innovation, Republic of Serbia and the University of Belgrade-Faculty of Agriculture (no. 451-03-47/2023-01/200116 and 451-03-1202/2021-09), the Ministry of Science, Technological Development and Innovation, Republic of Serbia and the University of Belgrade-Faculty of Pharmacy (no. 451-03-47/2023-01/ 200161), and the Ministry of Science, Technological Development and Innovation, Republic of Serbia and the Vinča Institute of Nuclear Sciences (no. 451-03-47/2023-01/ 200017). The APC was funded by a grant from the Ministry of Science, Technological Development and Innovation, Republic of Serbia no. 451-03-47/2023-01/200116 and 451-03-1202/2021-09.

Institutional Review Board Statement

Not applicable.

Informed Consent Statement

Not applicable.

Data Availability Statement

Data sharing is not applicable to this article.

Acknowledgments

Authors gratefully acknowledge Alexander Ambrozic for his language editing assistance.

Conflicts of Interest

The authors declare no conflict of interest. The funders had no role in the design of the study; in the collection, analyses, or interpretation of data; in the writing of the manuscript; or in the decision to publish the results.

References

  1. Ribéreau-Gayon, P.; Dubourdieu, D.; Donèche, B.; Lonvaud, A. Handbook of Enology: The Microbiology of Wine and Vinifications, 2nd ed.; Jonh Wiley & Sons: Chichester, UK, 2006; Volume 1, pp. 283–294. [Google Scholar]
  2. Generalić Mekinić, I.; Skračić, Ž.; Kokeza, A.; Soldo, B.; Ljubenkov, I.; Banović, M.; Skroza, D. Effect of winemaking on phenolic profile, colour components and antioxidants in Crljenak kaštelanski (sin. Zinfandel, Primitivo, Tribidrag) wine. J. Food Sci. Technol. 2019, 56, 1841–1853. [Google Scholar] [CrossRef] [PubMed]
  3. Francesca, N.; Romano, R.; Sannino, C.; Le Grottaglie, L.; Settanni, L.; Moschetti, G. Evolution of microbiological and chemical parameters during red wine making with extended post-fermentation maceration. Int. J. Food Microbiol. 2014, 171, 84–93. [Google Scholar] [CrossRef] [PubMed] [Green Version]
  4. Robinson, A.; Adams, D.; Boss, P.; Heymann, H.; Solomon, P.; Trengove, R. Influence of geographic origin on the sensory characteristics and wine composition of Vitis vinifera cv. Cabernet sauvignon wines from Australia. Am. J. Enol. Vitic. 2012, 63, 467–476. [Google Scholar] [CrossRef]
  5. Radovanović, B.; Radovanović, A.; Souquet, J. Phenolic profile and free radical-scavenging activity of Cabernet Sauvignon wines of different geographical origins from the Balkan region. J. Sci. Food Agric. 2010, 90, 2455–2461. [Google Scholar] [CrossRef]
  6. Van Leeuwen, C.; Destrac-Irvine, A. Modified grape composition under climate change conditions requires adaptations in the vineyard. Oeno One 2017, 51, 147–154. [Google Scholar] [CrossRef]
  7. Madžgalj, V.; Petrović, A.; Čakar, U.; Maraš, V.; Sofrenić, I.; Tešević, V. The influence of different enzymatic preparations and skin contact time on the aromatic profile of wines produced from autochthonous grape varieties Krstač and Žižak. J. Serb. Chem. Soc. 2022, 88, 11–23. [Google Scholar] [CrossRef]
  8. Singh, R.K.; Martins, V.; Soares, B.; Castro, I.; Falco, V. Chitosan application in vineyards (Vitis vinifera L. cv. Tinto Cão) induces accumulation of anthocyanins and other phenolics in berries, mediated by modifications in the transcription of secondary metabolism genes. Int. J. Mol. Sci. 2020, 21, 306. [Google Scholar] [CrossRef] [Green Version]
  9. Shen, L.; Chen, S.; Mi, Z.; Su, J.; Huang, R.; Song, Y.; Fang, Y.; Su, B. Identifying veraison process of coloured wine grapes in field conditions combining deep learning and image analysis. Comput. Electron. Agric. 2022, 200, 107268. [Google Scholar] [CrossRef]
  10. Medina-Plaza, C.; Meade, H.; Dokoozlian, N.; Ponangi, R.; Blair, T.; Block, D.E.; Oberholster, A. Investigating the Relation between Skin Cell Wall Composition and Phenolic Extractability in Cabernet Sauvignon Wines. Ferment 2022, 8, 401. [Google Scholar] [CrossRef]
  11. Steel, C.C.; Blackman, J.W.; Schmidtke, L.M. Grapevine bunch rots Impacts on wine composition, quality, and potential procedures for the removal of wine faults. J. Agric. Food Chem. 2013, 61, 5189–5206. [Google Scholar] [CrossRef]
  12. Blanco-Ulate, B.; Amrine, K.C.; Collins, T.S.; Rivero, R.M.; Vicente, A.R.; Morales-Cruz, A.; Doyle, C.L.; Ye, Z.; Greg, A.; Heymann, H.; et al. Developmental and metabolic plasticity of white-skinned grape berries in response to Botrytis cinerea during noble rot. Plant Physiol. 2015, 169, 2422–2443. [Google Scholar] [CrossRef] [Green Version]
  13. Quijada-Morin, N.; Garcia, F.; Lambert, K.; Walker, A.S.; Tiers, L.; Viaud, M.; Sauvage, F.X.; Hirtz, C.; Saucier, C. Strain effect on extracellular laccase activities from Botrytis cinerea. Aust. J. Grape Wine Res. 2018, 24, 241–251. [Google Scholar] [CrossRef]
  14. Lisov, N.; Petrovic, A.; Čakar, U.; Jadranin, M.; Tešević, V.; Bukarica-Gojković, L. Extraction kinetic of some phenolic compounds during Cabernet Sauvignon alcoholic fermentation and antioxidant properties of derived wines. Maced. J. Chem. Chem. 2020, 39, 185–196. [Google Scholar] [CrossRef]
  15. de Simón, B.F.; Hernández, T.; Estrella, I.; Gómez-Cordovés, C. Variation in phenol content in grapes during ripening: Low-molecular-weight phenols. Z. Lebensm. Unters. Forsch. 1992, 194, 351–354. [Google Scholar] [CrossRef]
  16. Peña-Neira, A.; Dueñas, M.; Duarte, A.; Hernandez, T.; Estrella, I.; Loyola, E. Effects of ripening stages and plant vegetative vigour on the phenolic composition of grapes (Vitis vinifera L.) cv. Cabernet sauvignon in the Maipo Valley (Chile). Vitis 2004, 43, 51–57. [Google Scholar] [CrossRef]
  17. Özcan, M.M.; Al Juhaimi, F.; Gülcü, M.; Uslu, N.; Geçgel, Ü.; Ghafoor, K.; Dursun, N. Effect of harvest time on physics-co-chemical properties and bioactive compounds of pulp and seeds of grape varieties. J. Food Sci. Technol. 2017, 54, 2230–2240. [Google Scholar] [CrossRef]
  18. Gil-Sánchez, I.; Cueva, C.; Sanz-Buenhombre, M.; Guadarrama, A.; Moreno-Arribas, M.V.; Bartolomé, B. Dynamic gastrointestinal digestion of grape pomace extracts: Bioaccessible phenolic metabolites and impact on human gut microbiota. J. Food Compos. 2018, 68, 41–52. [Google Scholar] [CrossRef]
  19. Jiang, Y.; Simonsen, J.; Zhao, Y. Compression-molded biocomposite boards from red and white wine grape pomaces. J. Appl. Polym. Sci. 2011, 119, 2834–2846. [Google Scholar] [CrossRef]
  20. Ivanova, V.; Vojnoski, B.; Stefova, M. Effect of winemaking treatment and wine ageing on phenolic content in Vranec wines. J. Food Sci. Technol. 2012, 49, 161–172. [Google Scholar] [CrossRef] [Green Version]
  21. Kocabey, N.; Yilmaztekin, M.; Hayaloglu, A.A. Effect of maceration duration on physicochemical characteristics, organic acid, phenolic compounds and antioxidant activity of red wine from Vitis vinifera L. Karaoglan. J. Food Sci. Technol. 2016, 53, 3557–3565. [Google Scholar] [CrossRef] [Green Version]
  22. Anđelkovic, M.; Radovanović, B.; Radovanović, A.; Anđelkovic, A.M. Changes in polyphenolic content and antioxidant activity of grapes cv Vranac during ripening. South Afr. J. Enol. Vitic. 2013, 34, 147–155. [Google Scholar] [CrossRef] [Green Version]
  23. Obreque-Slier, E.; Peña-Neira, Á.; López-Solís, R.; Cáceres-Mella, A.; Toledo-Araya, H.; López Rivera, A. Phenolic composition of skins from four Carmenet grape varieties (Vitis vinifera L.) during ripening. LWT-Food Sci. Technol. 2013, 54, 404–413. [Google Scholar] [CrossRef]
  24. Alencar, N.M.M.; Cazarin, C.B.B.; Corrêa, L.C.; Maróstica Junior, M.R.; Biasoto, A.C.T.; Behrens, J.H. Influence of maceration time on phenolic compounds and antioxidant activity of the Syrah must and wine. J. Food Biochem. 2017, 42, e12471. [Google Scholar] [CrossRef]
  25. Lingua, M.S.; Fabani, M.P.; Wunderlin, D.A.; Baroni, M.V. From grape to wine: Changes in phenolic composition and its influence on antioxidant activity. Food Chem. 2016, 208, 228–238. [Google Scholar] [CrossRef]
  26. Antoniolli, A.; Fontana, A.R.; Piccoli, P.; Bottini, R. Characterization of polyphenols and evaluation of antioxidant capacity in grape pomace of the cv. Malbec. Food Chem. 2015, 178, 172–178. [Google Scholar] [CrossRef]
  27. Ribeiro, L.F.; Ribani, R.H.; Francisco, T.M.G.; Soares, A.A.; Pontarolo, R.; Haminiuk, C.W.I. Profile of bioactive compounds from grape pomace (Vitis vinifera and Vitis labrusca) by spectrophotometric, chromatographic and spectral analyses. J. Chromatogr. B 2015, 1007, 72–80. [Google Scholar] [CrossRef]
  28. Ferreiro-González, M.; Carrera, C.; Ruiz-Rodríguez, A.; Barbero, G.F.; Ayuso, J.; Palma, M.; Barroso, C.G. A new solid phase extraction for the determination of anthocyanins in grapes. Molecules 2014, 19, 21398–21410. [Google Scholar] [CrossRef]
  29. Wang, Y.; Liu, Y.; Xiao, C.; Liu, L.; Hao, M.; Wang, J.; Liu, X. Simultaneous determination of 15 phenolic constituents of Chinese black rice wine by HPLC-MS/MS with SPE. J. Food Sci. 2014, 79, C1100-5. [Google Scholar] [CrossRef]
  30. Tanner, H.; Brunner, H.R. Gentranke-Analytik; Verlag Heller-Chemie und Verwaltunsgesellschaft mbH: Darmstadt, Germany, 1979. [Google Scholar]
  31. Benzie, I.F.F.; Strain, J.J. The ferric reducing ability of plasma (FRAP) as a measure of “antioxidant power”: The FRAP assay. Anal. Biochem. 1996, 239, 70–76. [Google Scholar] [CrossRef] [Green Version]
  32. Re, R.; Pellegrini, N.; Proteggente, A.; Pannala, A.; Yang, M.; Rice-Evans, C. Antioxidant activity applying an improved ABTS radical cation decolourization assay. Free Radic. Biol. Med. 1999, 26, 1231–1237. [Google Scholar] [CrossRef]
  33. Pérez-Magariño, S.; González-San José, M.L. Effect of ripening stage of grapes on the low molecular weight phenolic compounds of red wines. Eur. Food Res. Technol. 2005, 220, 597–606. [Google Scholar] [CrossRef]
  34. Casassa, L.F.; Sari, S.E.; Bolcato, E.A.; Fanzone, M.L. Microwave-assisted extraction applied to Merlot grapes with contrasting maturity levels: Effects on phenolic chemistry and wine colour. Fermentation 2019, 5, 15. [Google Scholar] [CrossRef] [Green Version]
  35. Nunes, M.A.; Pimentel, F.; Costa, A.S.; Alves, R.C.; Oliveira, M.B.P. Cardioprotective properties of grape seed proanthocyanidins: An update. Trends Food Sci. 2016, 57, 31–39. [Google Scholar] [CrossRef]
  36. Du, Y.; Li, X.; Xiong, X.; Cai, X.; Ren, X.; Kong, Q. An investigation on polyphenol composition and content in the skin of the grape (Vitis vinifera L. cv. Hutai No. 8) fruit during ripening by UHPLC-MS2 technology combined with multivariate statistical analysis. Food Biosci. 2021, 43, 101276. [Google Scholar] [CrossRef]
  37. Fernandes, A.C.F.; Martins, I.M.; Moreira, D.K.T.; Macedo, G.A. Use of agro-industrial residues as a potent antioxidant, antiglycation agents, and α-amylase and pancreatic lipase inhibitory activity. J. Food Process. Preserv. 2020, 44, e14397. [Google Scholar] [CrossRef]
  38. Muñoz-Bernal, Ó.A.; Coria-Oliveros, A.J.; Vazquez-Flores, A.A.; de la Rosa, L.A.; NúñezGastélum, J.A.; Rodrigo-García, J.; Ayala-Zavala, J.F.; Alvarez-Parrilla, E. Evolution of phenolic content, antioxidant capacity and phenolic profile during cold pre-fermentative maceration and subsequent fermentation of Cabernet sauvignon red wine. South Afr. J. Enol. Vitic. 2020, 41, 72–82. [Google Scholar] [CrossRef]
  39. Wu, Y.Y.; Xing, K.; Zhang, X.X.; Wang, H.; Wang, Y.; Wang, F.; Li, J.M. Influence of freeze concentration technique on aromatic and phenolic compounds, colour attributes, and sensory properties of Cabernet Sauvignon wine. Molecules 2017, 22, 899. [Google Scholar] [CrossRef] [Green Version]
  40. Kahkeshani, N.; Farzaei, F.; Fotouhi, M.; Alavi, S.S.; Bahramsoltani, R.; Naseri, R.; Momtaz, S.; Abbasabadi, Z.; Rahimi, R.; Farzaei, M.H.; et al. Pharmacological effects of gallic acid in health and diseases: A mechanistic review. Iran. J. Basic Med. Sci. 2019, 22, 225. [Google Scholar] [CrossRef]
  41. Ekhtiar, M.; Ghasemi-Dehnoo, M.; Mirzaei, Y.; Azadegan-Dehkordi, F.; Amini-Khoei, H.; Lorigooini, Z.; Samiei-Sefat, A.; Bagheri, N. The coumaric acid and syringic acid ameliorate acetic acid-induced ulcerative colitis in rats via modulator of Nrf2/HO-1 and pro-inflammatory cytokines. Int. Immunopharmacol. 2023, 120, 110309. [Google Scholar] [CrossRef]
  42. Niu, S.; Hao, F.; Mo, H.; Jiang, J.; Wang, H.; Liu, C.; Fan, X.; Zhang, Y. Phenol profiles and antioxidant properties of white-skinned grapes and their coloured genotypes during growth. Biotechnol. Biotechnol. Equip. 2017, 31, 58–67. [Google Scholar] [CrossRef] [Green Version]
  43. Oh, D.R.; Choi, C.; Kim, M.J.; Mun, B.Y.; Ko, H.; Oh, K.N.; Jo, A.; Kim, J.Y.; Bae, D. Antidepressant effects of p-coumaric acid isolated from Vaccinium bracteatum leaves extract on chronic restraint stress mouse model and antagonism of serotonin 6 receptor in vitro. Phytomedicine 2023, 116, 154871. [Google Scholar] [CrossRef] [PubMed]
  44. Blancquaert, E.H.; Oberholster, A.; Ricardo-da-Silva, J.M.; Deloire, A.J. Grape flavonoid evolution and composition under altered light and temperature conditions in Cabernet Sauvignon (Vitis vinifera L.). Front. Plant Sci. 2019, 10, 1062. [Google Scholar] [CrossRef] [PubMed] [Green Version]
  45. Luo, G.; Xiang, L.; Xiao, L. Quercetin alleviates atherosclerosis by suppressing oxidized LDL-induced senescence in plaque macrophage via inhibiting the p38MAPK/p16 pathway. J. Nutr. Biochem. 2023, 116, 109314. [Google Scholar] [CrossRef]
  46. Jediyi, H.; Naamani, K.; Elkoch, A.A.; Dihazi, A.; El Fels, A.E.A.; Arkize, W. First study on technological maturity and phenols composition during the ripeness of five Vitis vinifera L. grape varieties in Morocco. Sci. Hortic. 2019, 246, 390–397. [Google Scholar] [CrossRef]
  47. Kennedy, J. Understanding grape berry development. Pract. Winery Vineyard 2002, 4, 1–5. [Google Scholar]
  48. Bautista-Ortín, A.B.; Busse-Valverde, N.; Fernández-Fernández, J.I.; Gómez-Plaza, E.; Gil-Muñoz, R. The extraction kinetics of anthocyanins and proanthocyanidins from grape to wine in three different varieties. J. Int. Sci. Vigne. Vin. 2016, 50, 91–100. [Google Scholar] [CrossRef]
  49. Jara-Palacios, M.J.; Hernanz, D.; Escudero-Gilete, M.L.; Heredia, F.J. Antioxidant potential of white grape pomaces: Phenolic composition and antioxidant capacity measured by spectrophotometric and cyclic voltammetry methods. Food Res. Int. 2014, 66, 150–157. [Google Scholar] [CrossRef]
  50. Benbouguerra, N.; Richard, T.; Saucier, C.; Garcia, F. Voltammetric Behavior, Flavanol and Anthocyanin Contents, and Antioxidant Capacity of Grape Skins and Seeds during Ripening (Vitis vinifera var. Merlot, Tannat, and Syrah). Antioxidants 2020, 9, 800. [Google Scholar] [CrossRef]
  51. Prakash, O.; Supriya, A.; Kudachikar, V.B. Physicochemical Changes, Phenolic Profile and Antioxidant Capacities of Colored and White Grape (Vitis vinifera L.) Varieties during Berry Development and Maturity. Int. J. Fruit Sci. 2020, 20, 1773–1783. [Google Scholar] [CrossRef]
  52. Ky, I.; Lorrain, B.; Jourdes, M.; Pasquier, G.; Fermaud, M.; Gény, L.; Rey, P.; Donesche, B.; Teissedre, P.L. Assessment of grey mould (Botrytis cinerea) impact on phenolic and sensory quality of Bordeaux grapes, musts and wines for two consecutive vintages. Aust. J. Grape Wine Res. 2012, 18, 215–226. [Google Scholar] [CrossRef]
  53. Zinnai, A.; Venturi, F.; Sanmartin, C.; Quartacci, M.F.; Andrich, G. Chemical and laccase catalysed oxidation of gallic acid: Determination of kinetic parameters. Res. J. Biotechnol. 2013, 8, 62–65. [Google Scholar]
  54. Terrier, N.; Poncet-Legrand, C.; Cheynier, V. Flavanols, Flavonols and Dihydroflavonols. In Wine Chemistry and Biochemistry; Moreno-Arribas, V., Polo, C., Eds.; Springer: New York, NY, USA, 2009. [Google Scholar] [CrossRef]
  55. Claus, H. Laccases of Botrytis cinerea. In Biology of Microorganisms on Grapes, in Must and in Wine; König, H., Unden, G., Fröhlich, J., Eds.; Springer: Berlin/Heidelberg, Germany, 2017; pp. 339–356. [Google Scholar]
  56. Clark, M.; Centner, A.M.; Ukhanov, V.; Nagpal, R.; Salazar, G. Gallic acid ameliorates atherosclerosis and vascular senescence and remodels the microbiome in a sex-dependent manner in ApoE−/− mice. J. Nutr. Biochem. 2022, 110, 109132. [Google Scholar] [CrossRef]
  57. Pal, S.; Ho, N.; Santos, C.; Dubois, P.; Mamo, J.; Croft, K.; Allister, E. Red wine polyphenolics increase LDL receptor expression and activity and suppress the secretion of ApoB100 from human HepG2 cells. J. Nutr. 2003, 133, 700–706. [Google Scholar] [CrossRef] [Green Version]
  58. Ivanova-Petropulos, V.; Durakova, S.; Ricci, A.; Parpinello, G.P.; Versari, A. Extraction and evaluation of naturally occurring bioactive compounds and change in antioxidant activity during red winemaking. J. Food Sci. Technol. 2016, 53, 2634–2643. [Google Scholar] [CrossRef] [Green Version]
  59. Baleiras-Couto, M.M.; Guedes, R.; Duarte, F.L.; Fortes, A.M.; Serralheiro, M.L. Untargeted metabolomics discriminates grapes and wines from two Syrah vineyards located in the same wine region. Fermentation 2023, 9, 145. [Google Scholar] [CrossRef]
  60. Hernández-Maldonado, L.M.; Blancas-Benítez, F.J.; Zamora-Gasga, V.M.; Cárdenas-Castro, A.P.; Tovar, J.; Sáyago-Ayerdi, S.G. In Vitro Gastrointestinal Digestion and Colonic Fermentation of High Dietary Fiber and Antioxidant-Rich Mango (Mangifera indica L.) “Ataulfo”-Based Fruit Bars. Nutrients 2019, 11, 1564. [Google Scholar] [CrossRef] [Green Version]
  61. Artem, V.; Antoce, A.O.; Geana, E.I.; Ranca, A. Effect of grape yield and maceration time on the phenolic composition of ‘Fetească neagră’organic wine. Not. Bot. Horti Agrobot. 2021, 49, 12345. [Google Scholar] [CrossRef]
  62. Milenkovic, D.; Declerck, K.; Guttman, Y.; Kerem, Z.; Claude, S.; Weseler, A.R.; Bast, A.; Schroeter, H.; Morand, C.; Vanden Berghe, W. (−)-Epicatechin metabolites promote vascular health through epigenetic reprogramming of endothelial-immune cell signalling and reversing systemic low-grade inflammation. Biochem. Pharmacol. 2020, 173, 113699. [Google Scholar] [CrossRef]
  63. Patial, V.; Katoch, S.; Chhimwal, J.; Dadhich, G.; Sharma, V.; Rana, A.; Joshi, R.; Padwad, Y. Catechins prevent obesity-induced kidney damage by modulating PPARγ/CD36 pathway and gut-kidney axis in rats. Life Sci. 2023, 316, 121437. [Google Scholar] [CrossRef]
  64. Setford, P.C.; Jeffery, D.W.; Grbin, P.R.; Muhlack, R.A. Factors affecting extraction and evolution of phenolic compounds during red wine maceration and the role of process modelling. Trends Food Sci. Technol. 2017, 69, 106–117. [Google Scholar] [CrossRef]
  65. Morata, A.; Gómez-Cordovés, M.C.; Colomo, B.; Suárez, J.A. Cell wall anthocyanin adsorption by different Saccharomyces strains during the fermentation of Vitis vinifera L. cv Graciano grapes. Eur. Food Res. Technol. 2005, 220, 341–346. [Google Scholar] [CrossRef]
  66. Oliva, E.; Mir-Cerdà, A.; Sergi, M.; Sentellas, S.; Saurina, J. Characterization of sparkling wine based on polyphenolic profiling by liquid chromatography coupled to mass spectrometry. Fermentation 2023, 9, 223. [Google Scholar] [CrossRef]
  67. de la Cerda-Carrasco, A.; López-Solís, R.; Nuñez-Kalasic, H.; Peña-Neira, Á.; Obreque-Slier, E. Phenolic composition and antioxidant capacity of pomaces from four grape varieties (Vitis vinifera L.). J. Sci. Food Agric. 2015, 95, 1521–1527. [Google Scholar] [CrossRef] [PubMed]
  68. Melo, P.S.; Massarioli, A.P.; Denny, C.; dos Santos, L.F.; Franchin, M.; Pereira, G.E.; Ferreira de Souza Vieira, T.M.; Rosalen, P.L.; de Alencar, S.M. Winery by-products: Extraction optimization, phenolic composition and cytotoxic evaluation to act as a new source of scavenging of reactive oxygen species. Food Chem. 2015, 181, 160–169. [Google Scholar] [CrossRef] [Green Version]
  69. Costabile, G.; Vitale, M.; Luongo, D.; Naviglio, D.; Vetrani, C.; Ciciola, P.; Tura, A.; Castello, F.; Mena, P.; Del Rio, D.; et al. Grape pomace polyphenols improve insulin response to a standard meal in healthy individuals: A pilot study. Clin. Nutr. 2019, 38, 2727–2734. [Google Scholar] [CrossRef]
  70. Zhao, Y.; Dang, M.; Zhang, W.; Lei, Y.; Ramesh, T.; Priya Veeraraghavan, V.; Hou, X. Neuroprotective effects of Syringic acid against aluminium chloride-induced oxidative stress-mediated neuroinflammation in a rat model of Alzheimer’s disease. J. Funct. Foods 2020, 71, 104009. [Google Scholar] [CrossRef]
  71. Cheng, V.J.; Bekhit, A.E.D.A.; McConnell, M.; Mros, S.; Zhao, J. Effect of extraction solvent, waste fraction and grape variety on the antimicrobial and antioxidant activities of extracts from wine residue from cool climate. Food Chem. 2012, 134, 474–482. [Google Scholar] [CrossRef]
Figure 1. Distribution of different vinifications and maceration times according to the content of phenolic compounds in wine (Ctrl-control; 3, 5, 7, 14, 21-days of maceration; BDX, FX, Qa, SF (spontaneous fermentation without commercial yeast)—a type of vinification).
Fermentation 09 00695 g001
Figure 2. Distribution of different vinifications and maceration times according to the content of phenolic compounds in FP (Ctrl-control; 3, 5, 7, 14, 21-days of maceration; BDX, FX, Qa, SF (spontaneous fermentation without commercial yeast)—a type of vinification).
Fermentation 09 00695 g002
Table 1. The conditions for identification and quantification of phenolic compounds.
Phenolic CompoundMolecular
Formula
Molecular Mass
(g/mol)
ESI
Mode
MRM
Transition
Cone
Voltage (V)
Collision
Energy (V)
tR (min)
Gallic acidC7H6O5170-169→125166103.90
CatechinC15H14O6290-289→245166109.90
EpicatechinC15H14O6290-289→2451661011.52
Syringic acidC9H10O5198-197→182166711.60
p-Coumaric acidC9H8O3164-163→119166912.70
QuercetinC15H10O7 302 -301→1511661515.60
ESI—electrospray ionization; MRM—multiple reaction monitoring; and tR—retention time.
Table 2. Content of phenolic compound in wine (mean ± SD).
Content (mg/L)ANOVA
Phenolic
Compound
VéraisonFully RipeOverripeFp-Value
Gallic acid5.18 ± 0.20 a4.22 ± 0.40 b1.59 ± 0.15139.730.000 *
Catechin1.55 ± 0.10 a40.13 ± 3.25 b19.23 ± 1.40267.8410.000 *
Epicatechin0.73 ± 0.05 a22.29 ± 1.50 b12.35 ± 0.50418.7780.000 *
Syringic acid5.57 ± 0.40 a7.55 ± 0.508.26 ± 0.6022.7150.002 *
p-Coumaric acid4.19 ± 0.35 b3.88 ± 0.20 b2.33 ± 0.2044.1350.000 *
Quercetin0.09 ± 0.01 a0.78 ± 0.02 b0.003277.80.000 *
* Denotes the level of significance of 0.05; a—significantly different from fully and overripe (Tukey post hoc test, p ˂ 0.05); b—significantly different from overripe (Tukey post hoc test, p ˂ 0.05).
Table 3. Content of phenolic compound in FP (mean ± SD).
Content (mg/kg)ANOVA
Phenolic
Compound
VéraisonFully RipeOverripeFp-Value
Gallic acid0.86 ± 0.04 b0.82 ± 0.04 b0.67 ± 0.0225.0830.001 *
Catechin4.92 ± 0.15 a6.73 ± 0.11 b3.30 ± 0.09620.5640.000 *
Epicatechin2.70 ± 0.05 a3.37 ± 0.10 b1.76 ± 0.04417.5110.000 *
Syringic acid5.68 ± 0.10 a8.53 ± 0.15 b10.29 ± 0.25512.7190.000 *
p-Coumaric acid0.04 ± 0.004 c0.05 ± 0.002 b0.04 ± 0.00212.5000.007 *
Quercetin7.44 ± 0.10 a10.96 ± 0.14 b5.61 ± 0.15440.5490.000 *
* Denotes the level of significance of 0.05; a—significantly different from fully and overripe (Tukey post hoc test, p ˂ 0.05); b—significantly different from overripe (Tukey post hoc test, p ˂ 0.05); c—significantly different from full ripe (Tukey post hoc test, p ˂ 0.05).
Table 4. TPC and antioxidant properties of wine and FP were obtained from grapes of three different ripening stages.
Ripening StageWineFP
FRAP
(mmol Fe2+/L)
TEAC
(mmol TE/L)
TPC
(mg/L)
FRAP
(mmol Fe2+/KG)
TEAC
(mmol TE/KG)
TPC (mg/KG)
Véraison19.50 ± 4.25 a8.74 ± 2.621000.0 ± 190.0 b16.22 ± 4.8214.93 ± 3.621320.9 ± 290.0 c
Fully ripe20.10 ± 4.0216.0 ± 3.201525.0 ± 210.026.31 ± 5.2115.90 ± 3.182260.4 ± 325.0
Overripe28.50 ± 2.8515.34 ± 1.511550.0 ± 235.016.61 ± 1.5812.43 ± 1.111629.5 ± 275.0
a—Significantly different from fully ripe and overripe (Tukey post hoc test); b—significantly different from overripe (Tukey post hoc test); c—significantly different from full ripe (Tukey post hoc test).
Table 5. A phenolic compound in wine produced from grapes affected by Botrytis cinerea and healthy grapes (mean ± SD).
Content (mg/L)ANOVA
Phenolic
Compound
Healthy GrapeGrape Affected by
Botrytis cinerea
Fp-Value
Gallic acid2.80 ± 0.10 a2.00 ± 0.05153.60.000 *
Catechin23.71 ± 0.50 a16.95 ± 0.33381.980.000 *
Epicatechin10.46 ± 0.20 a9.32 ± 0.2048.7350.002 *
Syringic acid3.73 ± 0.15 a8.43 ± 0.40363.1230.000 *
p-Coumaric acid2.32 ± 0.102.19 ± 0.083.0910.154
Quercetin24.75 ± 0.50 a0.47 ± 0.027062.9200.000 *
* Denotes the level of significance of 0.05; a—significantly different from grape affected by Botrytis cinerea.
Table 6. Dynamic phenolic compounds extracted from wine obtained by different vinifications.
Wine (mg/L)
Type of
Vinification
Maceration TimeGallic AcidSyringic Acidp-Coumaric AcidCatechinEpicatechinQuercetin
SF0 (control)0.09 ± 0.020.96 ± 0.200.73 ± 0.210.32 ± 0.090.03 ± 0.0040.01 ± 0.001
30.16 ± 0.047.23 ± 1.98 a1.28 ± 0.380.73 ± 0.210.08 ± 0.020.38 ± 0.07
51.02 ± 0.198.11 ± 1.55 a5.31 ± 1.59 a,b3.20 ± 0.960.59 ± 0.110.32 ± 0.06
72.04 ± 0.31 a,b7.21 ± 1.70 a6.30 ± 1.89 a,b8.63 ± 2.001.68 ± 0.502.35 ± 0.47 a,b,c
141.82 ± 0.24 a,b5.43 ± 1.62 a4.03 ± 1.2025.39 ± 5.61 a,b,c,d11.53 ± 2.90 a,b,c,d0.98 ± 0.20 a,b,c,d
213.44 ± 0.80 a,b,c,d,e6.58 ± 1.97 a5.07 ± 1.52 a,b29.72 ± 6.00 a,b,c,d16.72 ± 4.01 a,b,c,d0.46 ± 0.09 d
BDX0 (control)0.57 ± 0.112.70 ± 0.350.97 ± 0.200.32 ± 0.070.06 ± 0.010.00
30.81 ± 0.168.78 ± 1.99 a2.35 ± 0.400.03 ± 0.0010.000.00
51.32 ± 0.306.28 ± 1.705.56 ± 1.60 a,b1.29 ± 0.300.26 ± 0.020.21 ± 0.04
72.42 ± 0.70 a,b7.50 ± 1.70 a0.20 ± 0.04 c5.58 ± 1.401.50 ± 0.200.53 ± 0.10 a,b,c
142.42 ± 0.72 a,b7.74 ± 1.55 a5.54 ± 1.55 a,b,d19.35 ± 4.02 a,b,c,d7.60 ± 1.54 a,b,c,d0.57 ± 0.12 a,b,c
214.22 ± 0.90 a,b,c,d,e7.55 ± 2.01 a3.88 ± 0.80 a,d40.13 ± 5.50 a,b,c,d,e22.29 ± 4.00 a,b,c,d,e0.78 ± 0.20 a,b,c
FX100 (control)0.11 ± 0.012.16 ± 0.401.05 ± 0.200.06 ± 0.010.01 ± 0.00010.02 ± 0.003
31.02 ± 0.18 a8.03 ± 1.80 a4.74 ± 0.75 a5.76 ± 1.450.79 ± 0.150.28 ± 0.04
51.49 ± 0.30 a7.36 ± 1.55 a10.90 ± 1.02 a,b5.38 ± 1.401.29 ± 0.100.72 ± 0.21 a,b
71.77 ± 0.24 a,b6.52 ± 1.70 a8.01 ± 1.80 a4.22 ± 0.800.89 ± 0.161.19 ± 0.20 a,b,c
142.60 ± 0.25 a,b,c,d7.48 ± 1.50 a7.82 ± 1.50 a17.10 ± 3.20 a,b,c,d7.43 ± 1.40 a,b,c,d0.99 ± 0.11 a,b
212.68 ± 0.25 a,b,c,d6.77 ± 1.40 a6.47 ± 1.60 a,c29.14 ± 6.20 a,b,c,d,e13.67 ± 3.10 a,b,c,d,e0.54 ± 0.10 a,d,e
Qa230 (control)0.04 ± 0.010.34 ± 0.050.000.000.000.00
30.21 ± 0.037.26 ± 1.80 a0.87 ± 0.170.000.000.05 ± 0.002
51.65 ± 0.15 a,b8.15 ± 1.90 a7.61 ± 1.40 a,b1.11 ± 0.250.31 ± 0.050.34 ± 0.04 a,b
71.63 ± 0.20 a,b6.40 ± 1.20 a6.14 ± 1.40 a,b6.33 ± 1.05 a,b,c1.72 ± 0.25 a,b1.24 ± 0.20 a,b,c
143.70 ± 0.70 a,b,c,d8.80 ± 1.90 a0.00 c,d1.03 ± 0.30 d0.34 ± 0.040.02 ± 0.001 c,d
213.16 ± 0.60 a,b,c,d6.47 ± 1.40 a5.98 ± 1.45 a,b,e23.63 ± 3.20 a,b,c,d,e13.64 ± 1.25 a,b,c,d,e0.85 ± 0.15 a,b,c,d,e
a—Significantly different content of detected compounds from content detected on control (Tukey post hoc test p ˂ 0.05); b—significantly different content of detected compounds from content 3rd, day of maceration (Tukey post hoc test p ˂ 0.05); c—significantly different content of detected compounds from content detected on 5th day of maceration (Tukey post hoc test p ˂ 0.05); d—significantly different content of detected compounds from content detected on 7th, of maceration (Tukey post hoc test p ˂ 0.05); e—significantly different content of detected compounds from content detected on 14th day of maceration (Tukey post hoc test p ˂ 0.05).
Table 7. Dynamic phenolic compounds extraction from FP obtained by different vinifications.
Fermented Pomace (mg/KG)
Type of
Vinification
Maceration TimeGallic
Acid
Syringic Acidp-Coumaric AcidCatechinEpicatechinQuercetin
SF0 (control) *0.53 ± 0.052.11 ± 0.320.002.98 ± 0.402.13 ± 0.300.77 ± 0.20
30.49 ± 0.043.14 ± 0.400.05 ± 0.01 a1.41 ± 0.140.84 ± 0.151.70 ± 0.25
50.69 ± 0.123.90 ± 0.300.06 ± 0.01 a8.61 ± 1.90 a,b4.48 ± 0.80 a,b6.53 ± 1.80 a,b
70.67 ± 0.104.47 ± 0.900.05 ± 0.01 a4.62 ± 0.90 b,c1.84 ± 0.25 c9.16 ± 2.05 a,b
140.84 ± 0.15 a,b7.40 ± 1.40 a,b,c,d0.05 ± 0.011 a5.06 ± 1.00 b,c2.26 ± 0.60 b,c9.99 ± 2.00 a,b
210.98 ± 0.15 a,b,d9.12 ± 1.90 a,b,c,d0.06 ± 0.02 a4.51 ± 0.50 b,c2.20 ± 0.50 b,c10.40 ± 1.95 a,b
BDX30.55 ± 0.053.28 ± 0.400.05 ± 0.01 a5.06 ± 1.502.78 ± 0.402.62 ± 0.40
50.62 ± 0.184.77 ± 0.800.05 ± 0.01 a6.83 ± 1.702.92 ± 0.807.41 ± 1.70 a,b
70.73 ± 0.146.03 ± 1.70 a0.04 ± 0.005 a4.43 ± 0.801.70 ± 0.307.07 ± 1.50 a,b
140.73 ± 0.156.63 ± 1.50 a0.04 ± 0.01 a4.27 ± 0.901.92 ± 0.3010.46 ± 1.99 a,b
210.82 ± 0.208.53 ± 2.10 a,b,c0.05 ± 0.01 a6.73 ± 1.003.37 ± 0.40 d,e10.96 ± 1.40 a,b,d
FX30.58 ± 0.053.24 ± 0.250.06 ± 0.01 a2.37 ± 0.691.01 ± 0.253.00 ± 0.75
50.57 ± 0.114.62 ± 0.40 a0.04 ± 0.002 a7.83 ± 1.23 a,b3.42 ± 0.90 a,b3.54 ± 0.57
70.59 ± 0.125.25 ± 0.60 a,b0.04 ± 0.001 a4.45 ± 0.90 c1.95 ± 0.42 c9.64 ± 1.63 a,b,c
140.68 ± 0.096.16 ± 0.50 a,b0.05 ± 0.01 a2.37 ± 0.80 c1.06 ± 0.20 c10.23 ± 2.04 a,b,c
210.72 ± 0.229.26 ± 1.32 a,b,c,d,e0.06 ± 0.02 a3.61 ± 1.34 c1.94 ± 0.20 c12.17 ± 2.13 a,b,c
Qa30.73 ± 0.154.83 ± 0.600.08 ± 0.02 a10.59 ± 2.14 a5.95 ± 0.87 a3.83 ± 0.30 a
51.00 ± 0.12 a6.83 ± 0.55 a0.09 ± 0.02 a28.30 ± 3.58 a,b15.08 ± 2.13 a,b10.31 ± 1.09 a,b
70.88 ± 0.166.56 ± 0.83 a0.06 ± 0.01 a17.42 ± 2.19 a,b,c7.79 ± 1.54 a,c11.30 ± 1.11 a,b
140.75 ± 0.1410.45 ± 2.01 a,b0.05 ± 0.002 a,c3.70 ± 0.78 b,c,d2.05 ± 0.36 b,c,d10.59 ± 0.90 a,b
210.66 ± 0.1610.24 ± 2.63 a,b0.06 ± 0.01 a4.21 ± 0.69 b,c,d2.70 ± 0.30 b,c,d10.99 ± 1.45 a,b
* Control is same for all four vinifications; a—significantly different content of detected compounds from content detected on control (Tukey post hoc test p ˂ 0.05); b—significantly different content of detected compounds from content 3rd, day of maceration (Tukey post hoc test p ˂ 0.05); c—significantly different content of detected compounds from content detected on 5th day of maceration (Tukey post hoc test p ˂ 0.05); d—significantly different content of detected compounds from content detected on 7th, of maceration (Tukey post hoc test p ˂ 0.05); e—significantly different content of detected compounds from content detected on 14th day of maceration (Tukey post hoc test p ˂ 0.05).
Disclaimer/Publisher’s Note: The statements, opinions and data contained in all publications are solely those of the individual author(s) and contributor(s) and not of MDPI and/or the editor(s). MDPI and/or the editor(s) disclaim responsibility for any injury to people or property resulting from any ideas, methods, instructions or products referred to in the content.

