Article

Joint Multi-Optimization of an Extremophilic Microbial Bioanode for Mitigation of Mixed Hazardous Azo Dyes in Textile Synthetic Wastewater

1
ISBST, BVBGR-LR11ES31, Biotechpole Sidi Thabet, University of Manouba, Ariana 2020, Tunisia
2
Faculté des Sciences de Tunis, Université de Tunis El Manar, Tunis 1068, Tunisia
3
Laboratoire de Génie Chimique, Université de Toulouse, CNRS, INPT, UPS, 31062 Toulouse, France
*
Authors to whom correspondence should be addressed.
Fermentation 2023, 9(9), 782; https://doi.org/10.3390/fermentation9090782
Submission received: 1 July 2023 / Revised: 6 August 2023 / Accepted: 8 August 2023 / Published: 24 August 2023
(This article belongs to the Special Issue Biodegradation and Fermentation in Biorefinery)

Abstract

:
Bioelectrochemical systems (BESs), rather than physicochemical processes, are used for wastewater remediation, electricity production, and zero carbon dioxide emission. Textile effluents contain organic and inorganic compounds that can fuel BESs. The main goal of this study was to understand the interplay between the anode material, its surface area, the potential applied to the working electrode (WE), and the concentration of the co-substrate, and how these factors lead to the formation of highly efficient thermohalophilic bioanodes (THB) retrieved from Chott El Djerid (SCD) hypersaline sediment for the treatment of synthetic textile wastewater. To this end, twenty-seven bioanode formation experiments were designed using a Box-Behnken matrix and response surface methodology to understand concomitant interactions. All experiments were conducted in electrochemical reactors of final volume 750 mL inoculated with 80% of enrichment medium containing three azo dyes at a concentration of 300 ppm and 20% of biocatalyst microbial SCD source, at 45 °C. The optimal levels were predicted using NemrodW software as carbon felt (CF) anode material, 6 cm2 anode surface, 7 g/L glucose concentration, and −0.1 V applied potential. These theoretical results were experimentally validated, using maximum current output of 5.23 ± 0.30 A/m2, decolorization rate of 100%, and a chemical oxygen demand (COD) removal rate of 96 ± 1%. Illumina Miseq results revealed that bacterial community harbored the bioanode was dominated at phylum level by Firmicutes (67.1%). At the species level, the biofilm was mainly colonized by Orenia metallireducens species (59.5%). Obtained findings show a promising application of THB in the degradation of recalcitrant molecules as well as for the energy recovery.

1. Introduction

Synthetic dyes are used in a wide variety of applications, including textile, paper, and food industries [1]; it is estimated that there are 100,000 dyes in circulation in the market, with an annual global production of more than 700 tons [2]. Numerous azo dyes are used in the textile sector, which also produces wastewater streams with a very diverse composition containing mainly high concentrations of dyes, high ionic strength salts, heavy metals, surface-active dispersing agents, and formaldehyde-based dye-fixing agents [3]. An estimated 200 L of water is used to produce 1 kg of cloth, which results in a significant discharge into a number of water bodies [4]. The discharge of textile effluent containing dyes and other chemical molecules has a number of detrimental effects on the health of people and animals and on the ecosystem. In fact, these chemical compounds lessen the amount of sunlight that reaches the water, hinder the photosynthetic process, impede plant growth, and are more poisonous, carcinogenic, and mutagenic [5,6,7]. As a result, it is a priority for environmental conservation to manage textile wastewater before releasing it into natural water bodies. Physicochemical methods such as coagulation, flocculation and advanced oxidation techniques, and biological methods are the main treatment strategies explored to date. However, these methods are not widely adopted because of the secondary pollution they generate, their high energy consumption, and the slowness of the treatment process. In recent years, BES technologies, which use exoelectrogenic microorganisms to recover electrical energy and bio-electrodegrade recalcitrant molecules such as dyes [3,4,8,9], fungicide [10], and wastewater constituents [11], have been widely explored for their innovative features and environmental benefits. However, due to their poor electricity recovery, these methods have not yet been used on an industrial scale. In addition, by focusing on the specific treatment of azo dyes in BES, we identify that experimental work has often been carried out with a single dye, at low salinity, and at ambient temperature [12,13], which means that these exploratory case studies are not ideally representative of real effluents. But all the work already undertaken has the merit of having greatly advanced knowledge of the mechanisms involved in the bioelectrodegradation of azo dyes. In fact, two possible reduction mechanisms have been reported in the literature. The extracellular reduction pathway, which involves electroactive bacteria [14], and the intracellular reduction pathway, which involves co-enriched electrolyte bacteria beyond the electroactive biofilm [15].
In very general terms, it is clearly established that a series of factors (inoculum source, anode material, specific surface area of the material, dye structure, co-substrate), including operating conditions (pH, temperature, salinity, feed mode, effluent stability, electrode potential), can affect the electrical current recovered and the high COD and dye removal achieved. The source of the microbial consortia utilized as the inoculum may significantly affect the BES’s performance [16]. Textile effluents are characterized by a high concentration of NaCl ranged from 10 to 80 g/L [17]. NaCl is added to improve the fixation of dyes on fabrics and to adjust the ionic strength of dye baths. During the treatment process, NaCl can inhibit the activity of bacterial species, which may suffer from dehydration, leading to cell death and hindering the treatment process [17]. Moreover, the rejected effluent from dyeing units can reach temperatures of 70 °C, and this high temperature can prevent microbiological activity in treatment plants [5]. In this regard, our earlier research showed the value of Chott El Djerid’s hypersaline sediment as a source of inoculum capable of developing bioanodes under circumstances of extreme salinity that reached 150 g/L [10] and 165 g/L [18].
Microorganism development, clearance rate, and electron generation are all critically influenced by the anode compartment. In terms of mechanical strength, chemical stability, electrical conductivity, and biocompatibility, the material must be suitable. Consequently, various WE materials have been tested in the BESs for textile effluent treatment, and the most adopted are carbon-based materials such as carbon cloth [19], carbon fiber brushes [20], carbon felt [21], carbon paper [22], carbon rod [23], graphite [24,25], and granular activated carbon [26]. However, the influence of the electrode surface on the bioelectrochemical treatment of azo dyes has not yet been well investigated. Likewise, the co-substrate, from which anaerobic microbes obtain electrons to reduce dyes, plays a crucial role in the degradation of these molecules. According to the literature, the main electron donors utilized for azo dye reduction include glucose, acetate, ethanol, and yeast extracts. It has been demonstrated that they can successfully drive the azo bond’s reductive cleavage [27,28,29]. But there is still work to be performed in deciding which concentration is appropriate.
Using appropriate multivariate statistical techniques, specifically response surface methodology (RSM), our first objective in this work is to understand how the relationships between parametric variables can be optimized to have a direct positive impact on the performance of the BES treating azo dye loaded effluents. Pioneering work has already shown that RSM can be used to jointly optimize the combination of salinity, temperature, and inoculation rate in order to design microbial anodes that oxidize lactate [18].
In this study, this RSM method was investigated for the improvement of BESs designed to treat synthetic textile effluents made from three azo dyes frequently used in the textile industry. The main goal of this strategy is to simultaneously adjust the levels of the chosen variables in order to achieve the best BES performance (high level of dyes degradation and high current densities). We examined the combined effect of the WE material, its surface area, the potential applied to the WE, and the concentration of additional co-substrate on decolorization rates, COD removal, and electrical current generation.

2. Materials and Methods

2.1. Collection of Hypersaline Sediment and Textile Dyes

Direct Black 22 (C44H32N13Na3O11S3), Direct Blue 71 (C40H23N7Na4O13S), and Sirius Light Grey CG-LL (C44H24Cu2N8Na4O17S4) were the three azo dyes widely used in the textile industry, and they were collected from the global washing textile industry, Gitex group located in Korba, Nabeul, Tunisia (N 36°34′24.636″ and E 10°51′31.463″).
The hypersaline sediment used as sources of thermohalophilic inoculum was sampled in July 2021 from the sediment of Chott El Djerid (SCD) (N 33°59′965″ and E 08°25′332) located in the south of Tunisia. All samples were conserved in closed plastic bags at +4 °C until experiments were started.

2.2. Combined Effects of Working Electrode Material, Working Electrode Surface Area, Glucose Co-Substrate Concentration, and Applied Polarization Potential on the Performance of the BES

In order to study the concomitant impact of the WE material (θ1), WE surface (θ2), the co-substrate concentration (θ3), and applied polarization potential (θ4) (Table 1) on the BES performance, current production (ψ1), decolorization rate (ψ2), and COD removal (ψ3) are experimentally assessed by using a Box-Behnken design (BBD) generated by NemrodW software (version 1.0).
The BBD design involved four process variables θ1, θ2, θ3, and θ4 each at three levels (−1, 0, +1). A total of 27 (R1 to R27) experiments were obtained (Table 2). Selected boundaries of the variables for the BBD (Table 1) were based on preliminary experimental tests performed on SCD as well as results of previous studies carried out with microbial communities adapted to salty environments [18,30].
In order to ensure repeatability and to estimate the variance of the pure error, the experiments performed with the parameters corresponding to the central point (0, 0, 0) were repeated three times (R25, R26, R27).
After acquiring the data for each experimental point, we fitted a mathematical equation describing the behavior of the response as a function of the levels of the values studied. A regression model containing 15 coefficients, including the linear and quadratic effect on the variables and the linear effect on the interactions, was generated by the software (Equation (1)).
Ψ(Ψ1, Ψ2,Ψ3) = β0 + β1θ1 + β2θ2 + β3θ3 + β4θ4+ β11θ12 + β22θ22+ β33θ32+ β44θ42 + β12θ1θ2 + β13θ1θ3+ β23θ2θ3 + β14θ1θ4 + β24θ2θ4+ β34θ3θ4
where Ψ (Ψ1, Ψ2, Ψ3) are the given responses; β0 is the model constant; θ1, θ2, θ3, and θ4 are the independent variables; β1, β2, β3, and β4 are the linear coefficients; β12, β13, β23, β14, β24, and β34 are the cross-product coefficients; and β11, β22, β33, and β44 are the quadratic coefficients for each response Ψ1, Ψ2, and Ψ3.
To test the validity of the model, analysis of variance (ANOVA) was used to examine the significance and effectiveness of the model. The latter was used to plot response surfaces and to estimate the simultaneous influence and interaction of parametric variables on current production, decolorization, and COD removal. ANOVA uses sum of squares and F-statistics to find the relative importance of the analyzed variables, measurement errors, and uncontrolled parameters. It was used to check the fit of the model for each response of the experiments.
In addition to ANOVA verification of the statistical model fit, additional verification experiments were performed under the optimal conditions predicted by the model.

2.3. Bioelectrochemical System Construction, Inoculation, and Operation

The electrochemical experiments were performed in a 750 mL glass reactor. STWW was composed of 80% of enrichment medium containing the following (g/L): 0.5 K2HPO4, 1 NH4Cl2, 2 MgCl2, 0.1 CaCl2, 15 NaCl, three dyes mixture (100 ppm of Direct Black 22 (DB), 100 ppm of Direct Blue 71 (Db) and 100 ppm of Sirius Light Grey CG-LL (SLG)), and 20% of SCD source of halothermophilic microorganisms [3,18]. After the homogenization step, the medium was deaerated with nitrogen bubbling for 20 min.
A conventional three-electrode setup (working electrode (WE), counter electrode (CE), and reference electrode (RE)) was used with aMGP multichannel potentiostat (Biologic SAS) equipped with EC lab software (version 11.43). A WE made of various materials and surfaces (carbon felt, carbon cloth, and stainless steel plate) was connected to a titanium rod (1 mm diameter and 15 cm long) and polarized at (−0.3, −0.1, or +0.2 V/SCE), and a platinum grid was used as a CE, and a saturated calomel RE (+0.24 V/SHE) was located between the CE and the WE.
Monitoring of biofilm formation on the WE surface was performed using analytical electrochemistry techniques: chronoamperometry (CA) and cyclic voltammetry (CV). For the CA, the WEs were polarized at −0.3, −0.1, and +0.2 V/SCE. The CV was performed in situ between −0.6 and +0.3 V/SCE at a scan rate of 1 mV/S at the beginning and at the end of each experiment.

2.4. Decolorization and Biodegradation Analysis

Color measurements were carried out in 2 mL samples removed from the electrolyte (the reactor liquid suspension), and then centrifuged at 10,000 rpm for 5 min. The decolorization efficiency was monitored by measuring the decrease in absorbance of the supernatant with a UV–VIS spectrophotometer (Jenway 7315, Laboratoires Humeau, La Chapelle-sur-Erdre, France) at the maximum wavelength for the different dyes.
The decolorization rate was calculated according to Equation (2).
D R = I a O a I a × 100
where I a is the initial absorbance; O a is the observed absorbance.
The chemical oxygen demand (COD) in the reaction media was determined by using the LCK 514 kit (100–2000 mg/O2) then calculated according to Equation (3).
C O D   r e m o v a l   r a t e = C O D i C O D f C O D f × 100
where C O D i and C O D f are the initial and final COD.
The biodegradation of the chromophore functional groups was monitored using Fourier Transform Infrared Spectroscopy FTIR (Perkin Elmer model) to detect possible changes in dyes structures by evaluating functional groups. Electrolyte samples were collected before and after bioelectrochemical treatment. FTIR analyses were performed in the mid IR region of 500–4000 cm−1 at a speed of 16 scans.

2.5. Microscopic Characterization of Biofilms

The morphology of the different biofilms was examined using a scanning electron microscope (LEO 435 VP-Carl Zeiss SMT, Oberkochen, Germany) equipped with the EDX analysis tool. To fix the removed electrode fragments, 4% glutaraldehyde was added to phosphate buffer (400 mM, pH 7.4). The fragments were washed in a phosphate solution containing 0.4 M sucrose before being dehydrated with acetone in increasing concentrations of 50%, 70%, and 100%, followed by acetone and a mixture of 50% acetone and 50% hexamethyldisilazane (HMDS), and finally 100% HMDS. Before observation, the electrodes were dried overnight.

2.6. Bactrial Community Analyses

Genomic DNA extractions were performed from different biofilms and anolytes using a DNeasy Power Biofilm Kit-QIAGEN (Zone Industrielle ElAgba, Tunisia). DNA concentration measurements (ng/μL) and purity ratios (absorbance ratio (A260/A280))were verified using Nanodrop. Next, Illumina Miseq sequencing of the V4V5 region of 16S rRNA was performed to analyze bacterial community composition. Sequencing was performed at INRAE Transfert (Toulouse, France). The sequences underwent cleaning with several levels of filters (repetition of motifs, elimination of poor-quality ends, minimum size of sequences, etc.). Next, the sequences that passed through the filter were grouped into groups of redundant sequences by clusterization with a homology rate of 96%. Finally, a FASTA file was created for each cluster grouped homologous sequences queried against an NCBI database using BLASTn. Identification at taxonomic level was based on the percentage identity between the sequence and that derived from BLASTn.

3. Results and Discussion

3.1. Analyses of Concomitant Effects of Anode Material, Anode Surface, Glucose Concentration, and Applied Potential on Current Production, Dye Decolorization, and COD Removal

An optimization study of concomitant effects of anode material, anode surface, applied potential, and glucose concentration on current production, dye decolorization, and COD removal was carried using RSM. BBD was chosen to determine the most suitable anode material (θ1) and its surface (θ2), the most suitable glucose concentration (θ3), and applied potential (θ4) on maximum current production (Ψ1), dye decolorization (Ψ2), and COD removal (Ψ3) (Table 2).
After acquiring data related to each experimental point, mathematical equations describing the behavior of each response (Ψ1, Ψ2, and Ψ3) were adjusted according to the levels of the values studied of different variables (θ1, θ2, θ3, and θ4). Three regression models with 15 coefficients for each, including the linear and quadratic effect on variables determined by the software, are represented in the following equations:
Ψ1 (current production) A/m2= 1.1139 − 0.685 (anode material) − 0.602 (anode surface) + 1.064 (glucose concentration) + 0.608 (applied potential) − 0.289 (anode material) (anode material) + 1.066 (anode surface) (anode surface) − 0.659 (glucose concentration) (glucose concentration) − 0.109 (applied potential) (applied potential) + 0.272 (anode material) (surface area) − 0.719 (anode material) (glucose concentration) − 0.427(anode surface) (glucose concentration) + 0.044 (anode material) (applied potential) − 0.473 (anode surface) (applied potential) + 0.216 (glucose concentration) (applied potential)
Ψ2 (dye decolorization) % = 88.222 − 2.833 (anode material) − 0.556 (anode surface) + 26.778 (glucose concentration) + 1.222 (applied potential) − 5.833 (anode material) (anode material) + 1.667 (anode surface) (anode surface) − 28.333 (glucose concentration) (glucose concentration) − 0.667 (applied potential) (applied potential) + 0.938 (anode material) (anode surface) − 2.938 (anode material) (glucose concentration) + 0.188 (anode surface) (glucose concentration) + 0.438 (anode material) (applied potential) − 2.438 (anode surface) (applied potential) + 0.438 (glucose concentration) (applied potential)
Ψ3 (COD removal) %= 7.321 − 3 (anode material) − 2.333 (anode surface) + 8.333 (glucose concentration) − 3.333 (applied potential) − 6.815 (anode material) (anode material) + 6.185 (anode surface) (anode surface) − 6.815 (glucose concentration) (glucose concentration) − 12.815 (applied potential) (applied potential) + 2.438 (anode material) (anode surface) − 4.188 (anode material) (glucose concentration) − 1.188 (anode surface)(glucose concentration) − 0.188 (anode material) (applied potential) − 5.688 (anode surface) (applied potential) − 1.563 (glucose concentration) (applied potential)
The models expressed by the Equations (4)–(6) are considered adequate if the variances due to the lack of fit are not significantly different from the pure error variances [13]. The analysis of variance for the three models (Tables S1–S3, Supplementary Data) showed that the model regression sum of squares is statistically significant at the levels of 99% for Ψ1 and Ψ3 and 99.9% for Ψ2. The lack of fit is not significant for the three models. We can therefore conclude that the three models correlate well with the measured data.
The integrity of the model can be also tested by the determination of the coefficient R2 that measured the proportion of variation determined by the model relative to the mean. The obtained R2 values of 0.901, 0.971, and 0.895 for current production, decolorization rate, and COD removal, respectively, indicated, a good relation between the experimental and predicted values. Moreover, models could explain more than 89.5% of the variability in the response.

3.1.1. Concomitant Effects of Anode Material, Anode Surface, Glucose Concentration, and Applied Potential on Current Production

From Table S1 (Supplementary Data), the linear term β3 had the greatest effects on current production (p < 0.0001), followed by the linear term coefficients β1, β2, and β4, and the interaction term β23 with a significant effect of p < 0.01, and finally the quadratic terms coefficients (β22 and β33) and the interaction terms (β23 and β24) with a significant effect of p < 0.05. The interaction terms β12, β14, and β34 as well as the quadratic terms β11 and β44 were not significant (p < 0.5).
Regarding the effects of different interactions, it was determined that the anode material/glucose concentration interaction had the greatest impact on current production in the model, followed by surface area/glucose concentration and surface area/applied potential.
Plotting the response area curves against two significant independent factors while maintaining the levels of the other two variables allowed us to analyze the impacts of anode material, anode surface, glucose concentration, and applied potential in combination on the generation of bioanode current. Figure 1 displays response surface plots and their related contour plots for the projected current density. The geometrical design of the response area curve is known to shed light on the strength of the interaction between two factors. In fact, an oval or elliptical contour curve implies a considerable interaction between the two independent variables being compared, whereas a circular contour curve suggests a weak interaction [31].
For current production, Figure 1A,B describe the two-dimensional (2D) counter plot and corresponding three-dimensional (3D) response surface plot expressing the crossed effect of glucose concentration (θ3) and anode material (θ1) on the maximum current density when the anode surface (θ2) and applied potential (θ4) were kept constant at the center level (30 cm2 and −0.2 V).
Regardless of the anode material, the current output remains extremely low for low glucose concentrations, as seen by the 2D counter plot. For the three anode materials, glucose concentrations above 5 g/L resulted in the highest current output. However, at a glucose concentration between 5 and 10 g/L, a surface area of 30 cm2, and an applied potential of −0.2 V, carbon cloth or carbon felt anodes allow for the generation of the best current densities, i.e., 1.89 ± 0.63 and 2.66 ± 0.56 A/m2, respectively.
Similarly, Figure 1C,D described the two-dimensional (2D) counter plot and corresponding three-dimensional (3D) response surface plot expressing the crossed effect of glucose concentration (θ3) and anode surface (θ2) on the maximum current density when the anode material (θ1) and applied potential (θ4) were kept constant at the center level (carbon felt and −0.1 V). Figure 1C,D reveal that glucose concentration behind 5 g/L and anode surface more than 30 cm2 lowered the production of current by bioanodes (1.25 ± 0.55 A/m2). However, the current production was positively impacted at glucose concentration more than 5 g/L and in the proximity of 6 cm2 anode surfaces (3.54 ± 0.24 A/m2).
Figure 1E,F demonstrated how the interactions between the anode material and the applied potential heavily influence the current generation when glucose concentration and anode surface were maintained constant at the center level (5 g/L and 30 cm2). Different current densities are produced by the same applied potential for anodes built of various materials. For example, using carbon cloth at −0.3 V or carbon felt at −0.1 V yielded the same current densities, 1.28 ± 0.73 and 1.27 ± 0.33 A/m2, respectively. Compared to anodes made of carbon felt or cloth, those constructed of stainless steel produced very low densities at any voltage (0.64 to 0.44 ± 0.37 A/m2).
By partial differentiation of the established second-order regression models (Equation (4)) using experimental data and NemrodW software, the optimum conditions for maximum current production were established as carbon felt as anode material, 6 cm2 as anode surface, −0.1 V as applied potential, and 5 g/Las glucose concentration. Under these conditions, the second-order model predicted a maximum current production of 4.94 ± 0.24 A/m2.

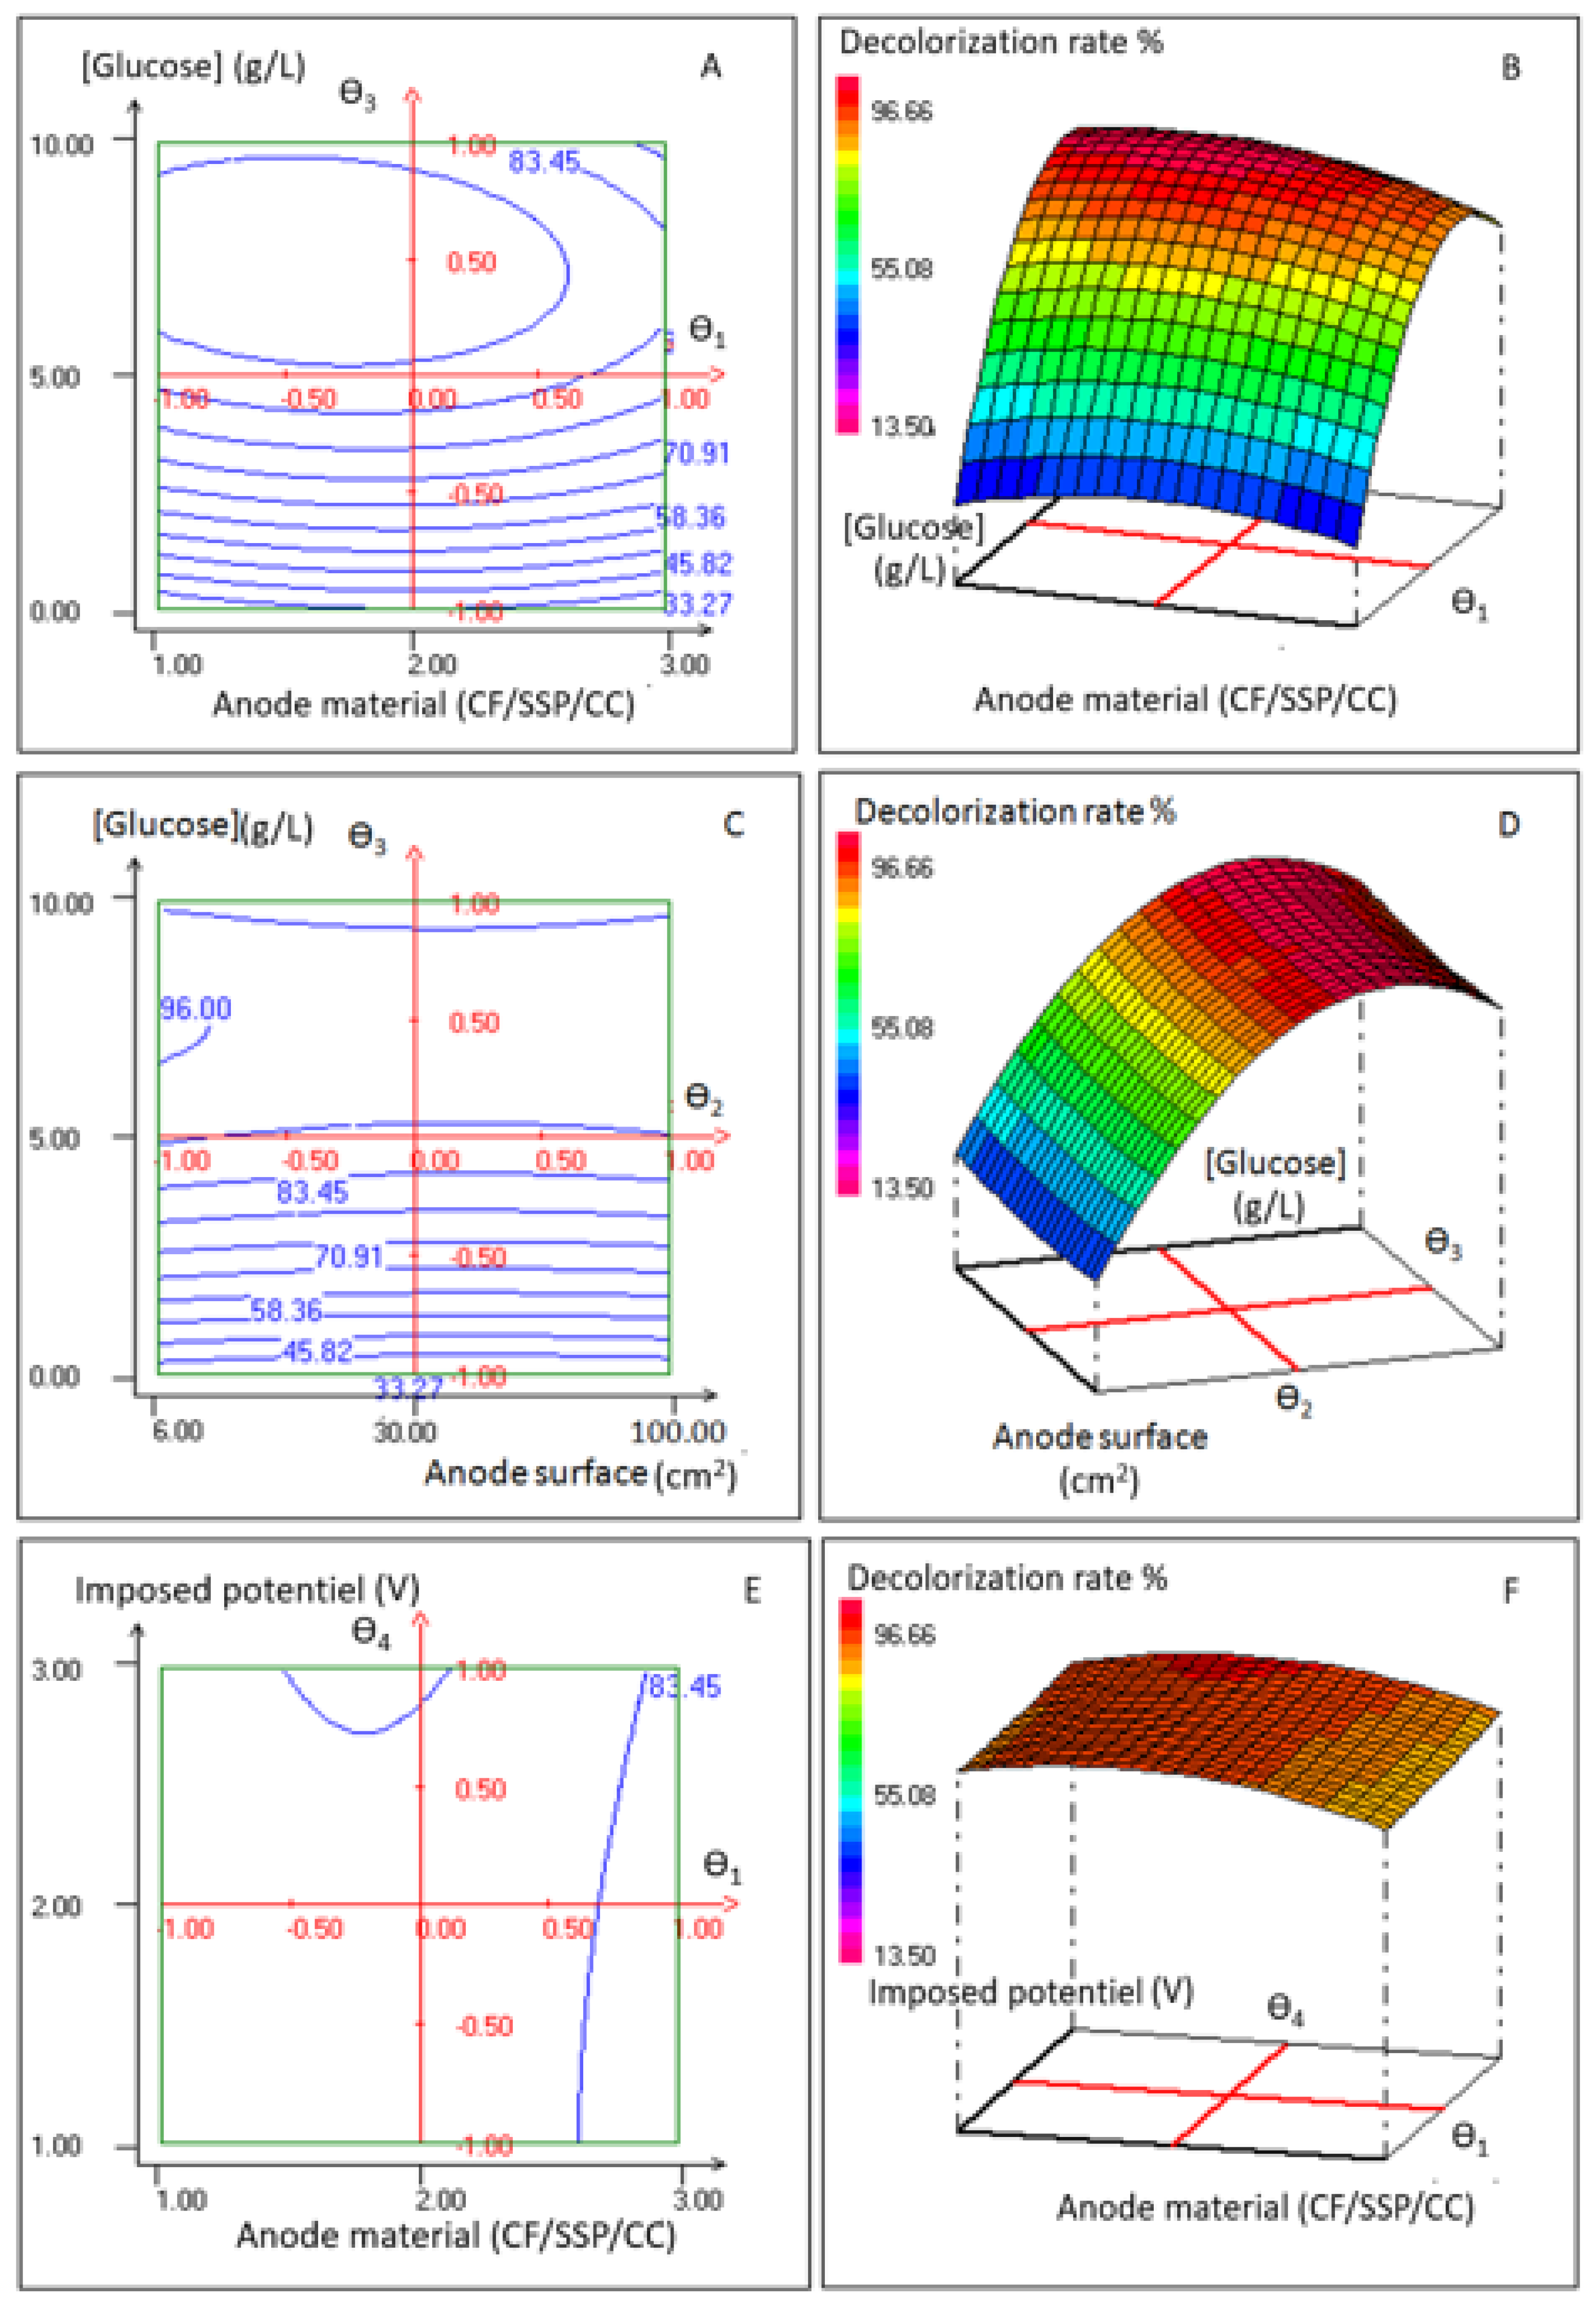
3.1.2. Concomitant Effects of Anode Material, Anode Surface, Glucose Concentration, and Applied Potential on Dye Decolorization

From Table S2 (Supplementary Data), the linear term β3 and the quadratic term β33 had the most significant effects on decolorization rate (p < 0.0001), followed by the linear term coefficients β1, and the interaction terms β13 and β24 with a significant effect of (p < 0.05). However, linear terms β2 and β4 the quadratic terms β11, β22 and β44 the interaction terms β12, β23, β14 and β34 were not significant (p < 0.5). Regarding the effects of variable interactions, it was concluded that, in the model fitted by Equation (5), the most influence on decolorization rate was the interactions between anode material/glucose concentration, and anode surface /applied potential.
For decolorization rate Figure 2A,B describe the two-dimensional (2D) counter plot and corresponding three-dimensional (3D) response surface plot expressing the crossed effect of glucose concentration (θ3) and anode material (θ1) on the maximum decolorization rate when the anode surface (θ2) and applied potential (θ4) were kept constant at the center level (30 cm2 and −0.2 V). The 2D counter plot shows that the decolorization rate is still very low for low glucose concentrations (Figure 2A). Lower glucose concentrations than 2 g/L led to the lowest decolorization rate (52.13 ± 4.00%) for the three anode materials. However, when using carbon felt as the anode material, the decolorization rate gradually increases from a glucose concentration of 2 g/L to above 95% at 7.4 g/L of glucose (95.28 ± 2.72%). When carbon felt is used as the anode, the decolorization rate is still high (93.31 ± 4.36%) but is lower with a stainless steel anode (84.77 ± 4.70).
Figure 2 C,D reported that when the concentration of glucose fluctuates from 0 to 5 g/L, decolorization rate rises with increasing glucose concentration (from 33.22% to 89.00%) irrespective of the anode surface. In this concentration range, the anode surface does not appear to have a substantial impact on decolorization rate. However, decolorization rate varies depending on the anode surface for concentrations between 5 g and 7.5 g/L. It is greatest (96.61 ± 4.67%) for surfaces close to 7 cm2, and it is significantly lower for surfaces below 30 cm2. It is noteworthy that, for glucose concentrations greater than 7.5 g/L, the decolorization rate reduces independent of the anode surface.
Figure 2E,F showed how the interactions between the anode material and the applied potential impacted decolorization rate when glucose concentration and anode surface were maintained constant at the center level. With carbon cloth as the anode material, the decolorization rate was consistently close to 86% (86.68 ± 5.27%) for all evaluated applied potentials. The decolorization rate with carbon felt did, however, somewhat rise by 90.31 ± 4.73 and 89.00 ± 2.54% with applied potentials of −0.1 and +0.2 V, respectively. The least amount of decolorization loss occurs when using stainless steel as anode material, independent of the applied potential (83.4 ± 4.03%).
The optimal conditions for the maximum decolorization rate were then found by partially differentiating the established second-order regression model (Equation (5)) using experimental data and NemrodW software. These conditions were carbon felt as the anode material, 6 cm2 as the anode surface, −0.1 V as the applied potential, and 7 g/L as the glucose concentration. The highest decolorization rate under these conditions was predicted by the second-order model to be 96.55 ± 3.02%.

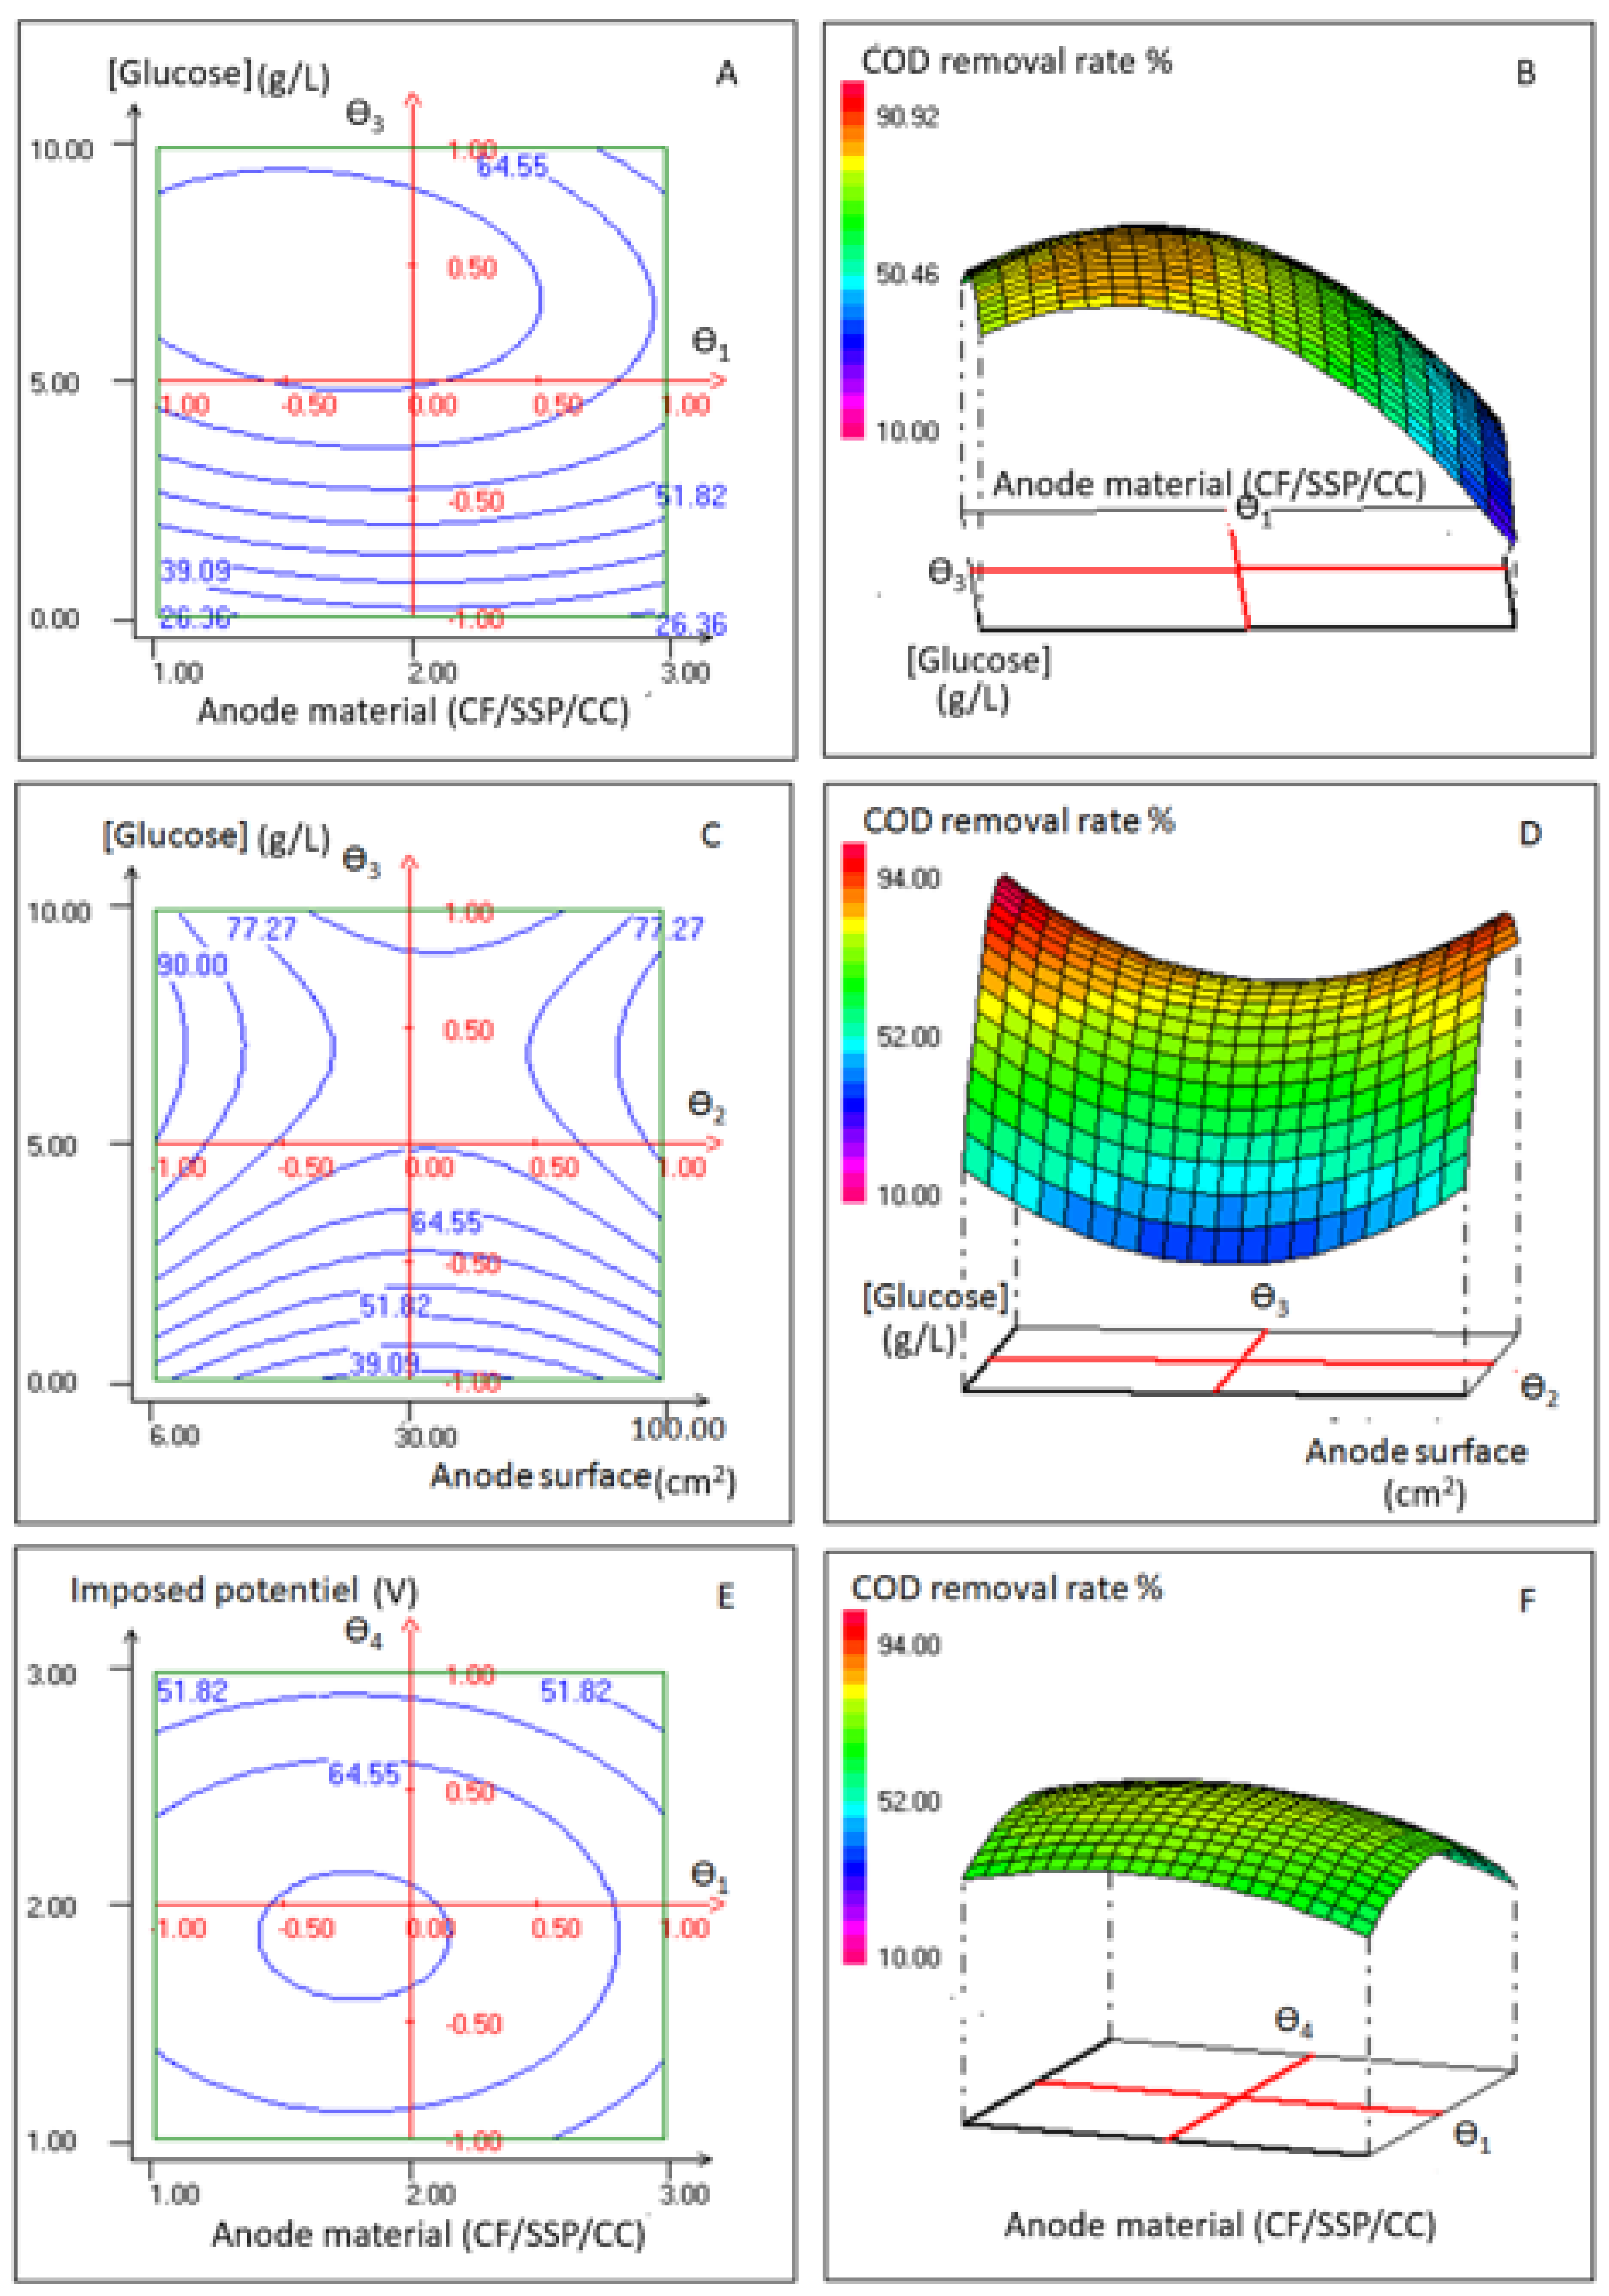
3.1.3. Concomitant Effects of Anode Material, Anode Surface, Glucose Concentration and Applied Potential on COD Removal Rate

From Table S3 (Supplementary Data), we conclude that the linear terms β3 and the quadratic term β33 had the greatest significant influence on COD removal rate (p < 0.01), then the linear terms β1 and β3 and the quadratic terms β22 and β44, and the interaction terms β13 and β14 with a significant effect of p < 0.05. However, the interaction between terms β12, β23, β14, and β34 as well as the linear term β2 and the quadratic term β11 were not significant (p < 0.5). Regarding the effects of variable interactions, it was determined that the model’s interactions between anode material/glucose concentration and anode surface/applied potential had the greatest impact on the COD removal rate.
Figure 3A,B for COD removal rate depict the cross-effect as 2D and 3D plots of glucose concentration and anode material on the maximum COD removal rate when the anode surface and applied potential were kept constant at the center level. Figure 3A indicated that when the glucose concentration rises from 0 to 5 g/L, the COD removal rate fluctuates from 26.36 to 70.85%. The COD removal rate is still independent of the anode’s material within this range of glucose content. When using carbon felt as the anode, the COD removal rate reaches a maximum of 76.36% at glucose concentrations between 6.5 and 8 g/L. When using carbon cloth as the anode, it slightly declines to 73.5 ± 1.03%. However, the COD removal rate drops to 61.64 ± 1.5% for the same glucose concentrations (6.5–8 g/L) when a stainless steel anode is applied.
According to Figure 3C,D, the concentration of glucose fluctuates from 0 to 5 g/L, COD removal rate rises with increasing glucose concentration (from 39.09% to 70.70%) despite the anode surface. The COD removal rate does not seem to be significantly impacted by the anode surface in this concentration range. However, the anode surface impacts the rate of COD removal at glucose concentrations between 5 and 10 g/L, and different COD removal rates were found with various surface anodes. At a glucose concentration of 7.5 g/L, the 6 cm2 carbon felt anode produced the maximum COD removal rate (94.52 ± 2.21%). Figure 3C demonstrates a decline in the COD removal rate for anode surfaces bigger than 6 cm2 (anode surfaces of 30 and 100 cm2), with 74.79 ± 1.27% and 86.24 ± 2.03%, respectively.
According to Figure 3C,D, the concentration of glucose fluctuates from 0 to 5 g/L, COD removal rate rises with increasing glucose concentration (from 39.09% to 70.70%) despite the anode surface. The COD removal rate does not seem to be significantly impacted by the anode surface in this concentration range. However, the anode surface impacts the rate of COD removal at glucose concentrations between 5 and 10 g/L, and different COD removal rates were found with various surface anodes. At a glucose concentration of 7.5 g/L, the 6 cm2 carbon felt anode produced the maximum COD removal rate (94.52 ± 2.2%). Figure 3C demonstrates a decline in the COD removal rate for anode surfaces bigger than 6 cm2 (anode surfaces of 30 and 100 cm2), with 74.79 ± 1.27% and 86.24 ± 2.03%, respectively.
Figure 3E,F showed how the interactions between the anode material and the applied potential impacted the COD removal rate when glucose concentration and anode surface were maintained constant at the center level. The rate at which COD is removed with a carbon cloth anode is substantially impacted by the applied potential. In fact, a maximum COD removal rate of 67.50 ± 2.27% was achieved with a −0.1 V applied potential. Additionally, the COD removal decreased with values of 58.06 ± 2.59 and 52.22 ± 2.65% for applied potentials of −0.3 and +0.2 V, respectively. Same results were obtained when used carbon felt or stainless steel anodes. An important interaction between anode material and applied potential is illustrated in Figure 3B,E. The best COD removal rate of 71.12 + 1.12% was attained with a carbon fiber anode at an applied voltage of −0.1 V.
The established second-order regression model (Equation (6)) was then partially differentiated using experimental data and the NemrodW program to determine the optimal parameters for the highest COD removal rate. The anode material was carbon felt, the anode surface was 6 cm2, the applied potential was −0.1 V, and the glucose concentration was 7.5 g/L. The second-order model indicated that the maximum COD removal rate under these conditions would be 94.52 ± 2.2%.
The optimal conditions for maximum current production, maximum decolorization rate, and maximum COD removal rate were identified as carbon felt anode material, 6 cm2 anode surface, 7 g/L glucose concentration, and −0.1 V applied potential by partial differentiation of the established second-order regression models (Equations (4)–(6)). Under these conditions, the second-order models suggested that the maximum current production would be 4.94 ± 0.24 A/m2, the highest decolorization rate would be 96.55 ± 3.02%, and the COD removal rate would be 94.52 ± 2.2%.

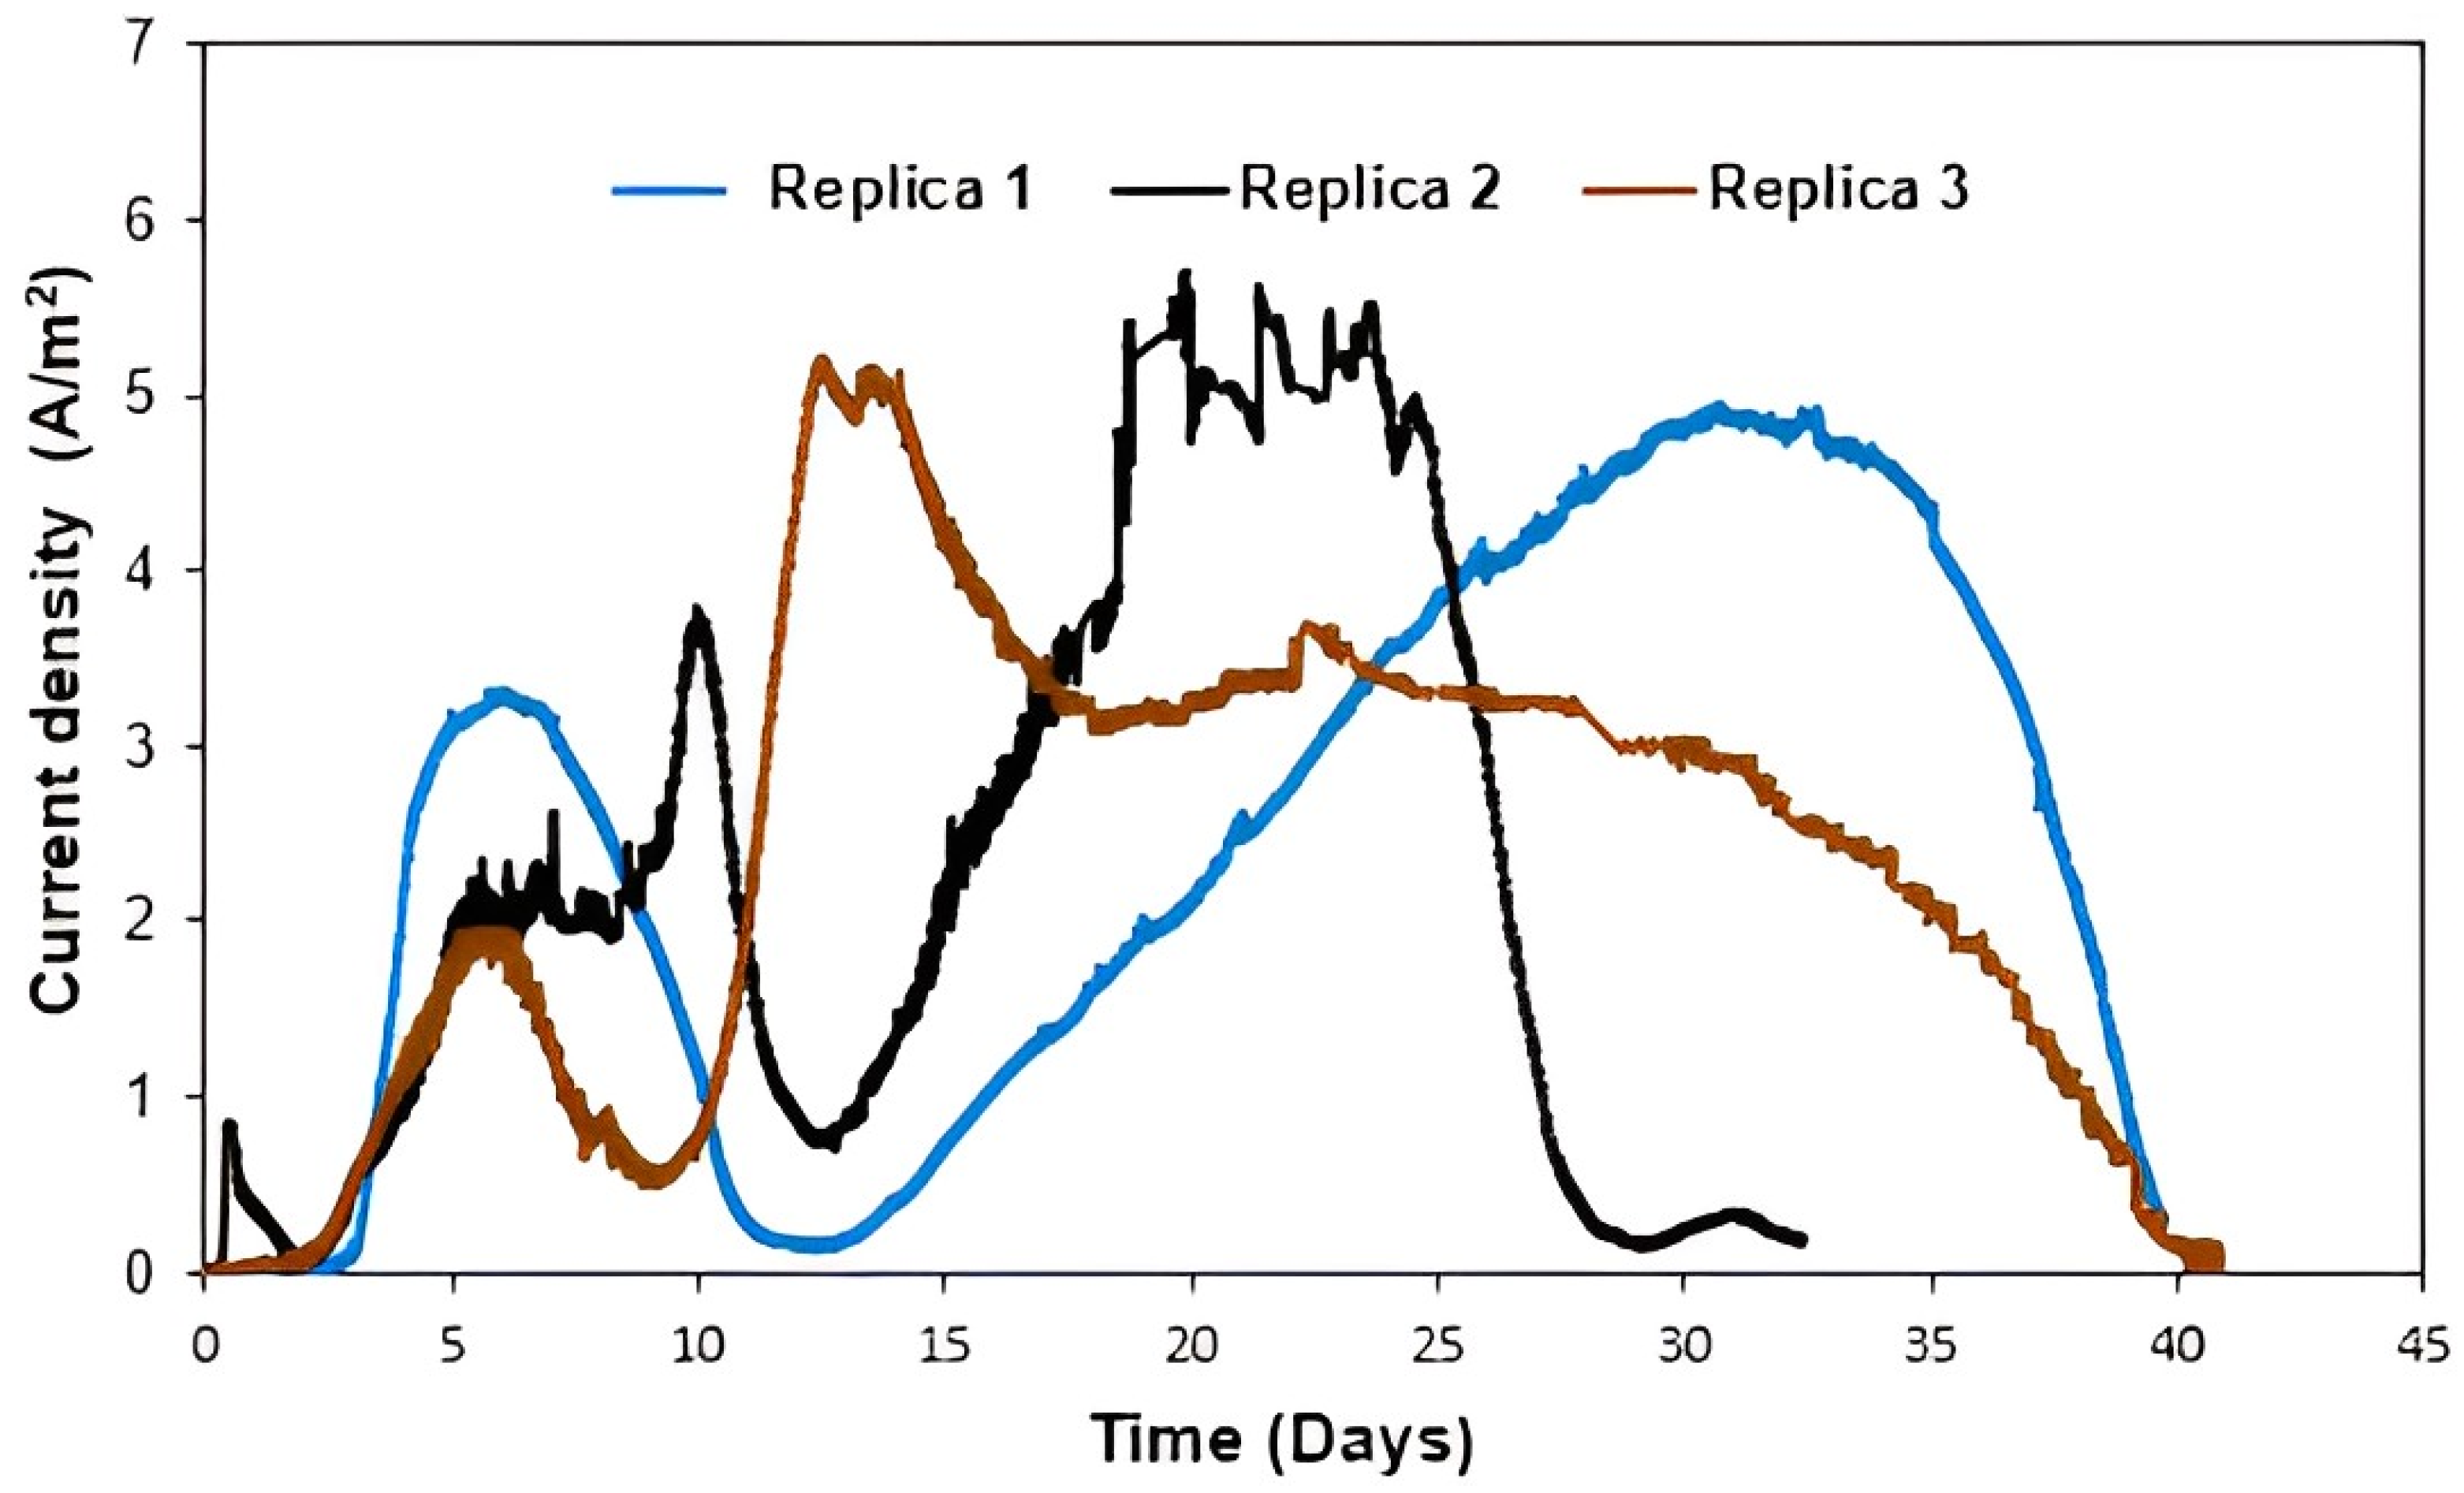
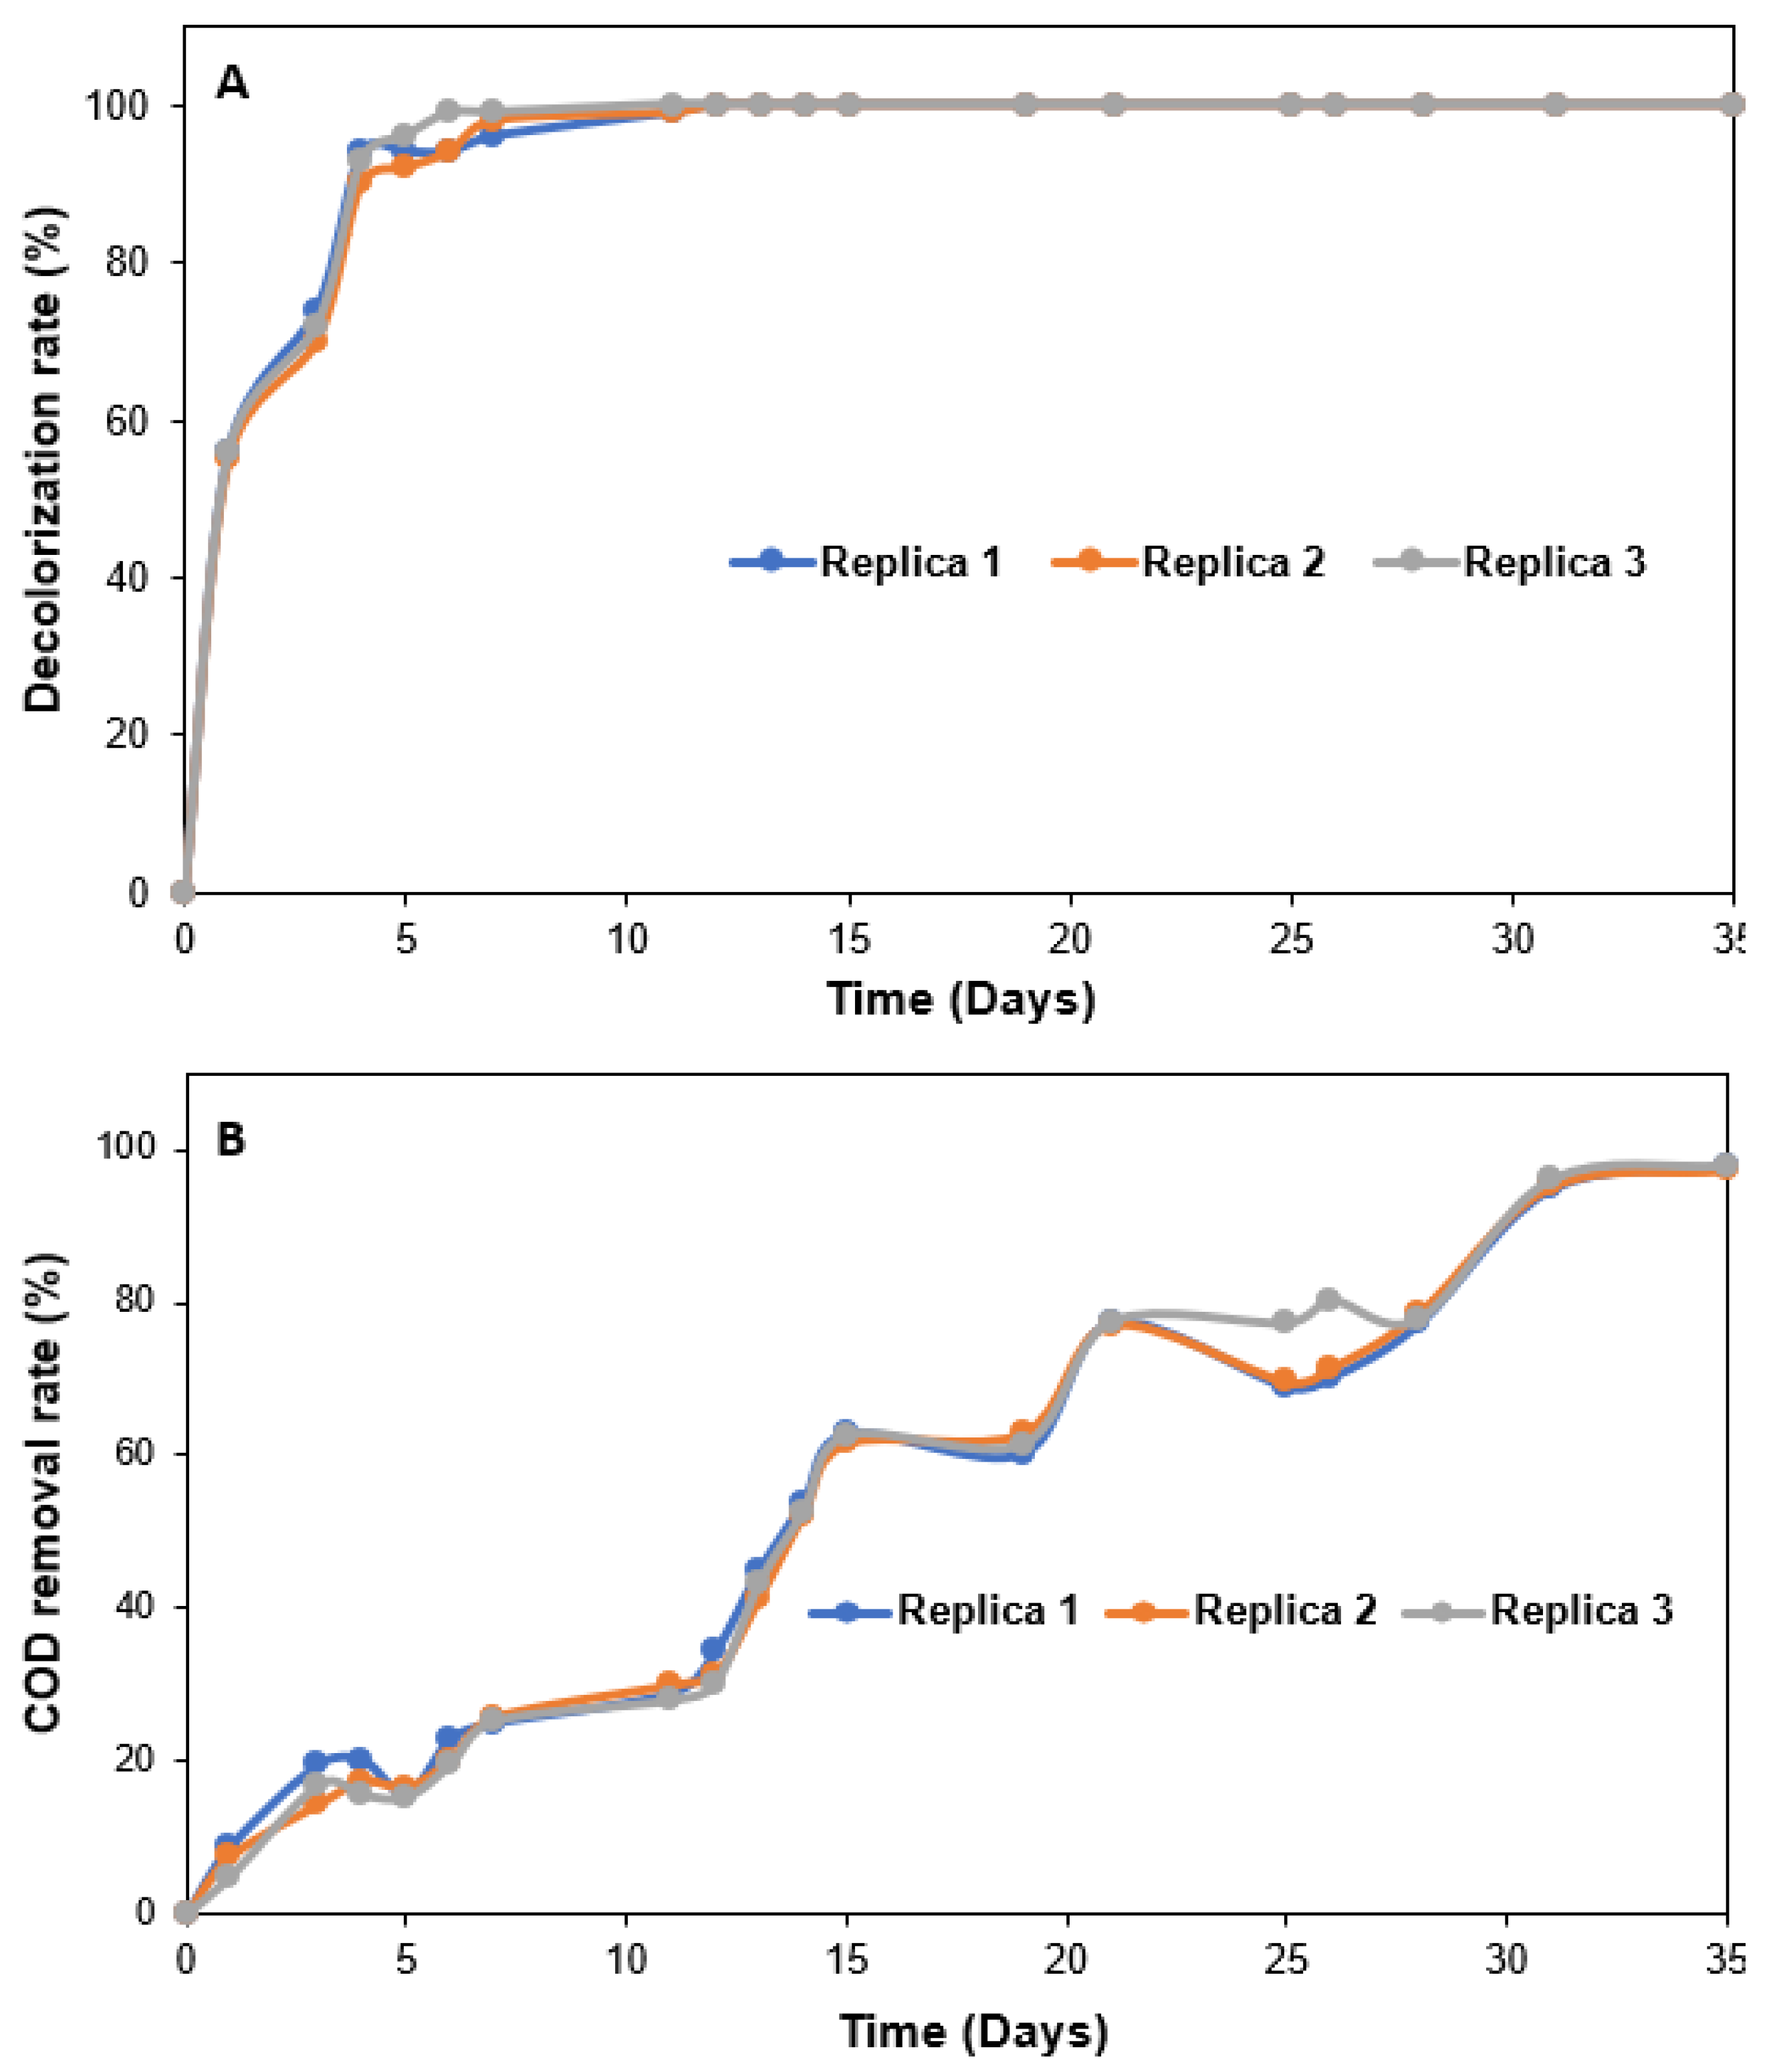
3.2. Experimental Validation of the Model

Three additional verification experiments were conducted under the optimal theoretical conditions predicted by the model (potential: −0.1 V/SCE, anode material: carbon felt, surface area: 6 cm2, co-substrate: glucose 7 g/L), allowing to reach the maximum current density, higher decolorization rate, and maximum COD removal rate. These three identical experiments carried out in parallel served to confirm the statistical model’s suitability.
As illustrated by Figure 4, the chronoamperometric curves of the three replicas displayed a comparable overall pattern in terms of both their shape and the maximum current density produced. These curves are characterized by two phases of current production. The maximum peak of 2.96 ± 0.87 A/m2 was obtained at day 6 of the first phase, which lasted a total of 10 days. The second phase was seen between days 11 and 40, with a maximum current density of 5.23 ± 0.30 A/m2 being recorded. For almost 10 days during this second phase, a stable current generation was maintained before it started to steadily decline. In addition to the current generation, the decolorization rates of DB, Db, and SLG were examined under optimal conditions in the BES inoculated with SCD. Towards day 4 of the experiment, a decolorization rate of 94.00 ± 1.00% was achieved, and then it increased to 99.00 ± 0.57% around the 11th day (Figure 5A). Concurrently, a final COD removal rate of 96 ± 1% was achieved towards the end of the experiment (Figure 5B).
The theoretical conclusions anticipated by the statistical model and the experimentally observed results agree quite well (differences range from 1% to 3%), demonstrating the model’s validity and robustness. The experiments carried out with the parameters corresponding to the central point were repeated three times (R25, R26, R27) to ensure repeatability and to estimate the variance of the pure error. These experiments showed similar performance. Indeed, the current densities obtained varied from 1 to 1.5 A/m2, the decolorization rates from 89 to 92%, and the COD removal rates from 77 to 83%. The theoretical responses for these experiments were very close to the experimental responses (Table 2). Moreover, with experiments carried out under optimal conditions, the three replicates revealed maximal current densities of roughly 5.23 ± 0.30 A/m2, 100% decolorization rate, and 96 ± 1% COD removal rate (Figure 4 and Figure 5). The standard deviations between the three replicates for the different variables studied were close to 0, meaning that the values are very little dispersed around the mean. These data made it possible to obtain statistically robust results.
Compared with other studies focusing on the bioelectrochemical degradation of azo dyes, our results revealed that the use of SCD as extremophilic microbial inoculum is more efficient than other sources of microorganisms mainly from sludge. As examples, (i) decolorization of new coccine with mixed culture sludge (COD removal = 77.0%) [32], (ii) decolorization of orange acid 7 with activated sludge (COD removal = 50.9%) [33], (iii) decolorization of methyl orange with anaerobic sludge (COD removal = 84.1%) [34], and (iv) decolorization of two azo dyes Remazol Yellow and Reactive Black 5 with a mixed culture of sludge from the wastewater treatment plant (COD removal = 91.0%) [35].
In contrast to earlier studies on the treatment of textile azo dyes in bioelectrochemical systems, it is clearly evident from our study that a combined effect of optimized operating variables has resulted in more significant current production. In fact, the data reported to date cover current densities ranging from 0.5 to 3 A/m2 [36,37]. The bioelectrochemical decolorization of azo dyes by mixed cultures from extreme thermohalophilic habitats has been poorly studied, despite the high salinity typical of textile effluents. It is essential to note that all these studies were carried out under low salinity conditions and often using a single azo dye. As far as we know, only the study of Oon et al. [38] investigated the effect of salinity and initial dye concentration on the treatment efficiency in particular of red acid 15 in a microbial fuel cell. For an initial dye concentration of 500 ppm, a power density of 8.67 mW/m2 and a maximum decolorization rate of 91% were reported. However, the concentration of NaCl applied varied only from 0.007 to 0.7 g/L in this work, whereas in a real effluent, the concentration of salt reaches up to 80 g/L. This suggests that these conditions are not representative of real effluents.
Here, in our work, three materials were used as WE, two carbon-based anode (carbon felt and carbon cloth) and one metal-based anode (stainless steel plate). The porous carbon felt facilitated the achievement of higher degradation rates and maximum current density. Yakoob et al. [39] attributed the efficiency of the carbon felt to its high chemical stability, high conductivity, good biocompatibility, and good electron transfer kinetics. Several studies have successfully designed BESs for azo dye degradation using carbon felt as the anode material to host microorganisms, and high COD removal rates from 70 to 96% were achieved [21,32,40]. Regarding the stainless steel electrode, the obtained current densities were three times lower than those obtained with carbon felt. In fact, metal-based materials such as stainless steel do not offer high current densities compared to other carbon-based materials [8]. Previous studies have shown that larger anode surfaces (72 cm2) favor the attachment of the mixed microbial population compared with smaller surfaces (18 and 36 cm2) [41]. Our results are in contrast with these findings. In fact, the experiments performed with the 100 cm2 WE surface area showed a low decolorization rates compared to the one observed with the experiments performed on less wide anodic surface of 6 cm2 (Table 2).
Regarding glucose concentration added as a co-substrate in experiments, our results showed that the presence of the additional co-substrate seems to be a key element for the decolorization reaction as well as for the electricity production. Based on earlier research [12,13], several bacterial strains involved in biodegradation have been identified, but many of them cannot use dye for their growth and maintenance of their metabolism. Highly charged azo dyes are thought to undergo reductive degradation to aromatic amines in the extracellular fluid but are unable to penetrate inside the cells [42]. Thus, decolorization of azo compounds may compete with electron transfer at the anode in the BES. In fact, experiments carried out under glucose deficiency conditions showed low rates of dye removal varied only from 17 to 21% with a very low oxidation current, which did not exceed 0.05 A/m2. On the other hand, the use of increasing concentrations of glucose improved elimination rates and resulted in much higher current densities, reaching 7 A/m2 (R13). In general, the co-substrate is oxidized and part of the electrons produced by this oxidation is transferred to the anode as a final acceptor. The other part of electrons is transferred for reductive cleavage of the azo bond in the structure of the dye. Therefore, there will be a competition to reduce the equivalents between the azo molecules and the anode as the final electron acceptor [4]. The polarization of an electrode provides an additional dye reduction pathway simultaneously with the intracellular reduction pathway involving bacteria co-enriched in the anolyte. This reduction pathway, known as the extracellular reduction pathway, involves the electroactive bacteria. The extracellular electron transfer capacity of these electroactive bacteria perfectly meets the requirements of the extracellular reduction pathway for azo dyes. Therefore, electroactive bacteria with high electron transfer capacity should also be efficient azo dye reductants due to the role of extracellular cytochrome C (OmcB, OmcC, and OmcE), which has been identified as a key outer membrane protein for extracellular dye reduction.
External power is required when BESs use removal mechanisms to degrade azo dyes. The value of the applied potential is a critical parameter for electroactive bacteria performance, and its value determines the energy available for growth and operation of electroactive bacteria. Optimal electroactive bacteria activity (from 0.8 to 7.00 A/m2) was observed with −0.1 and +0.2 V/SCE potentials, while with the −0.3 V/SCE potential, we recorded the lowest current densities ranging from 0.23 to 3 A/m2. In theory, the higher the applied potential, the more energy available to the microorganisms to grow rapidly. Wei et al. [43] demonstrated these phenomena in a study using a pure culture of Geobacter Sulfurreducens. The anodes were polarized at three different potentials: −0.16, 0, and 0.4V. The authors showed faster start-up, higher current densities, and greater biomass production for anodes polarized at positive potentials compared with those polarized at −0.16V. They concluded that favoring the rapid development of a thick biofilm on the electrode surface makes it possible to obtain a high current density.

3.3. FTIR Analysis

To gain more insights into azo dyes degradation by the bioelectrochemical process, FTIR was used to reveal possible transformations in their structures. FTIR spectra (Figure 6) obtained after bioelectrochemical treatment showed significant changes in peak position compared to the untreated sample, indicating the complete degradation of the functional chromophore groups. Indeed, the control spectra showed a peak at 1592.4 cm−1 for the azo bond, a peak at 2923.28 cm−1 for the CH3 asymmetric stretching, a peak at 1167.8 cm−1 for the C-N stretching of the aromatic amines, and a peak at 1489.04 cm−1 for the C-C stretching of the aromatics. The peak at 1125.46 cm−1represents the asymmetric stretching vibrations of the sulfonates [44]. Comparing with the FTIR spectrum of the treated sample, the absorption peak of the azo vibrations of wave number at 1592.44 cm−1 was significantly reduced indicating the breakage of the azo bond, due to the action of bacterial azoreductase. The absence of a peak in the region 500–600 cm−1 indicates loss of aromaticity [45]. The absence of a peak at 1167.8 cm−1 demonstrated the absence of C-N stretching of aromatic amines. Furthermore, the absence of the peak at 1225.46 cm−1 suggests the disappearance of the sulfonic group.

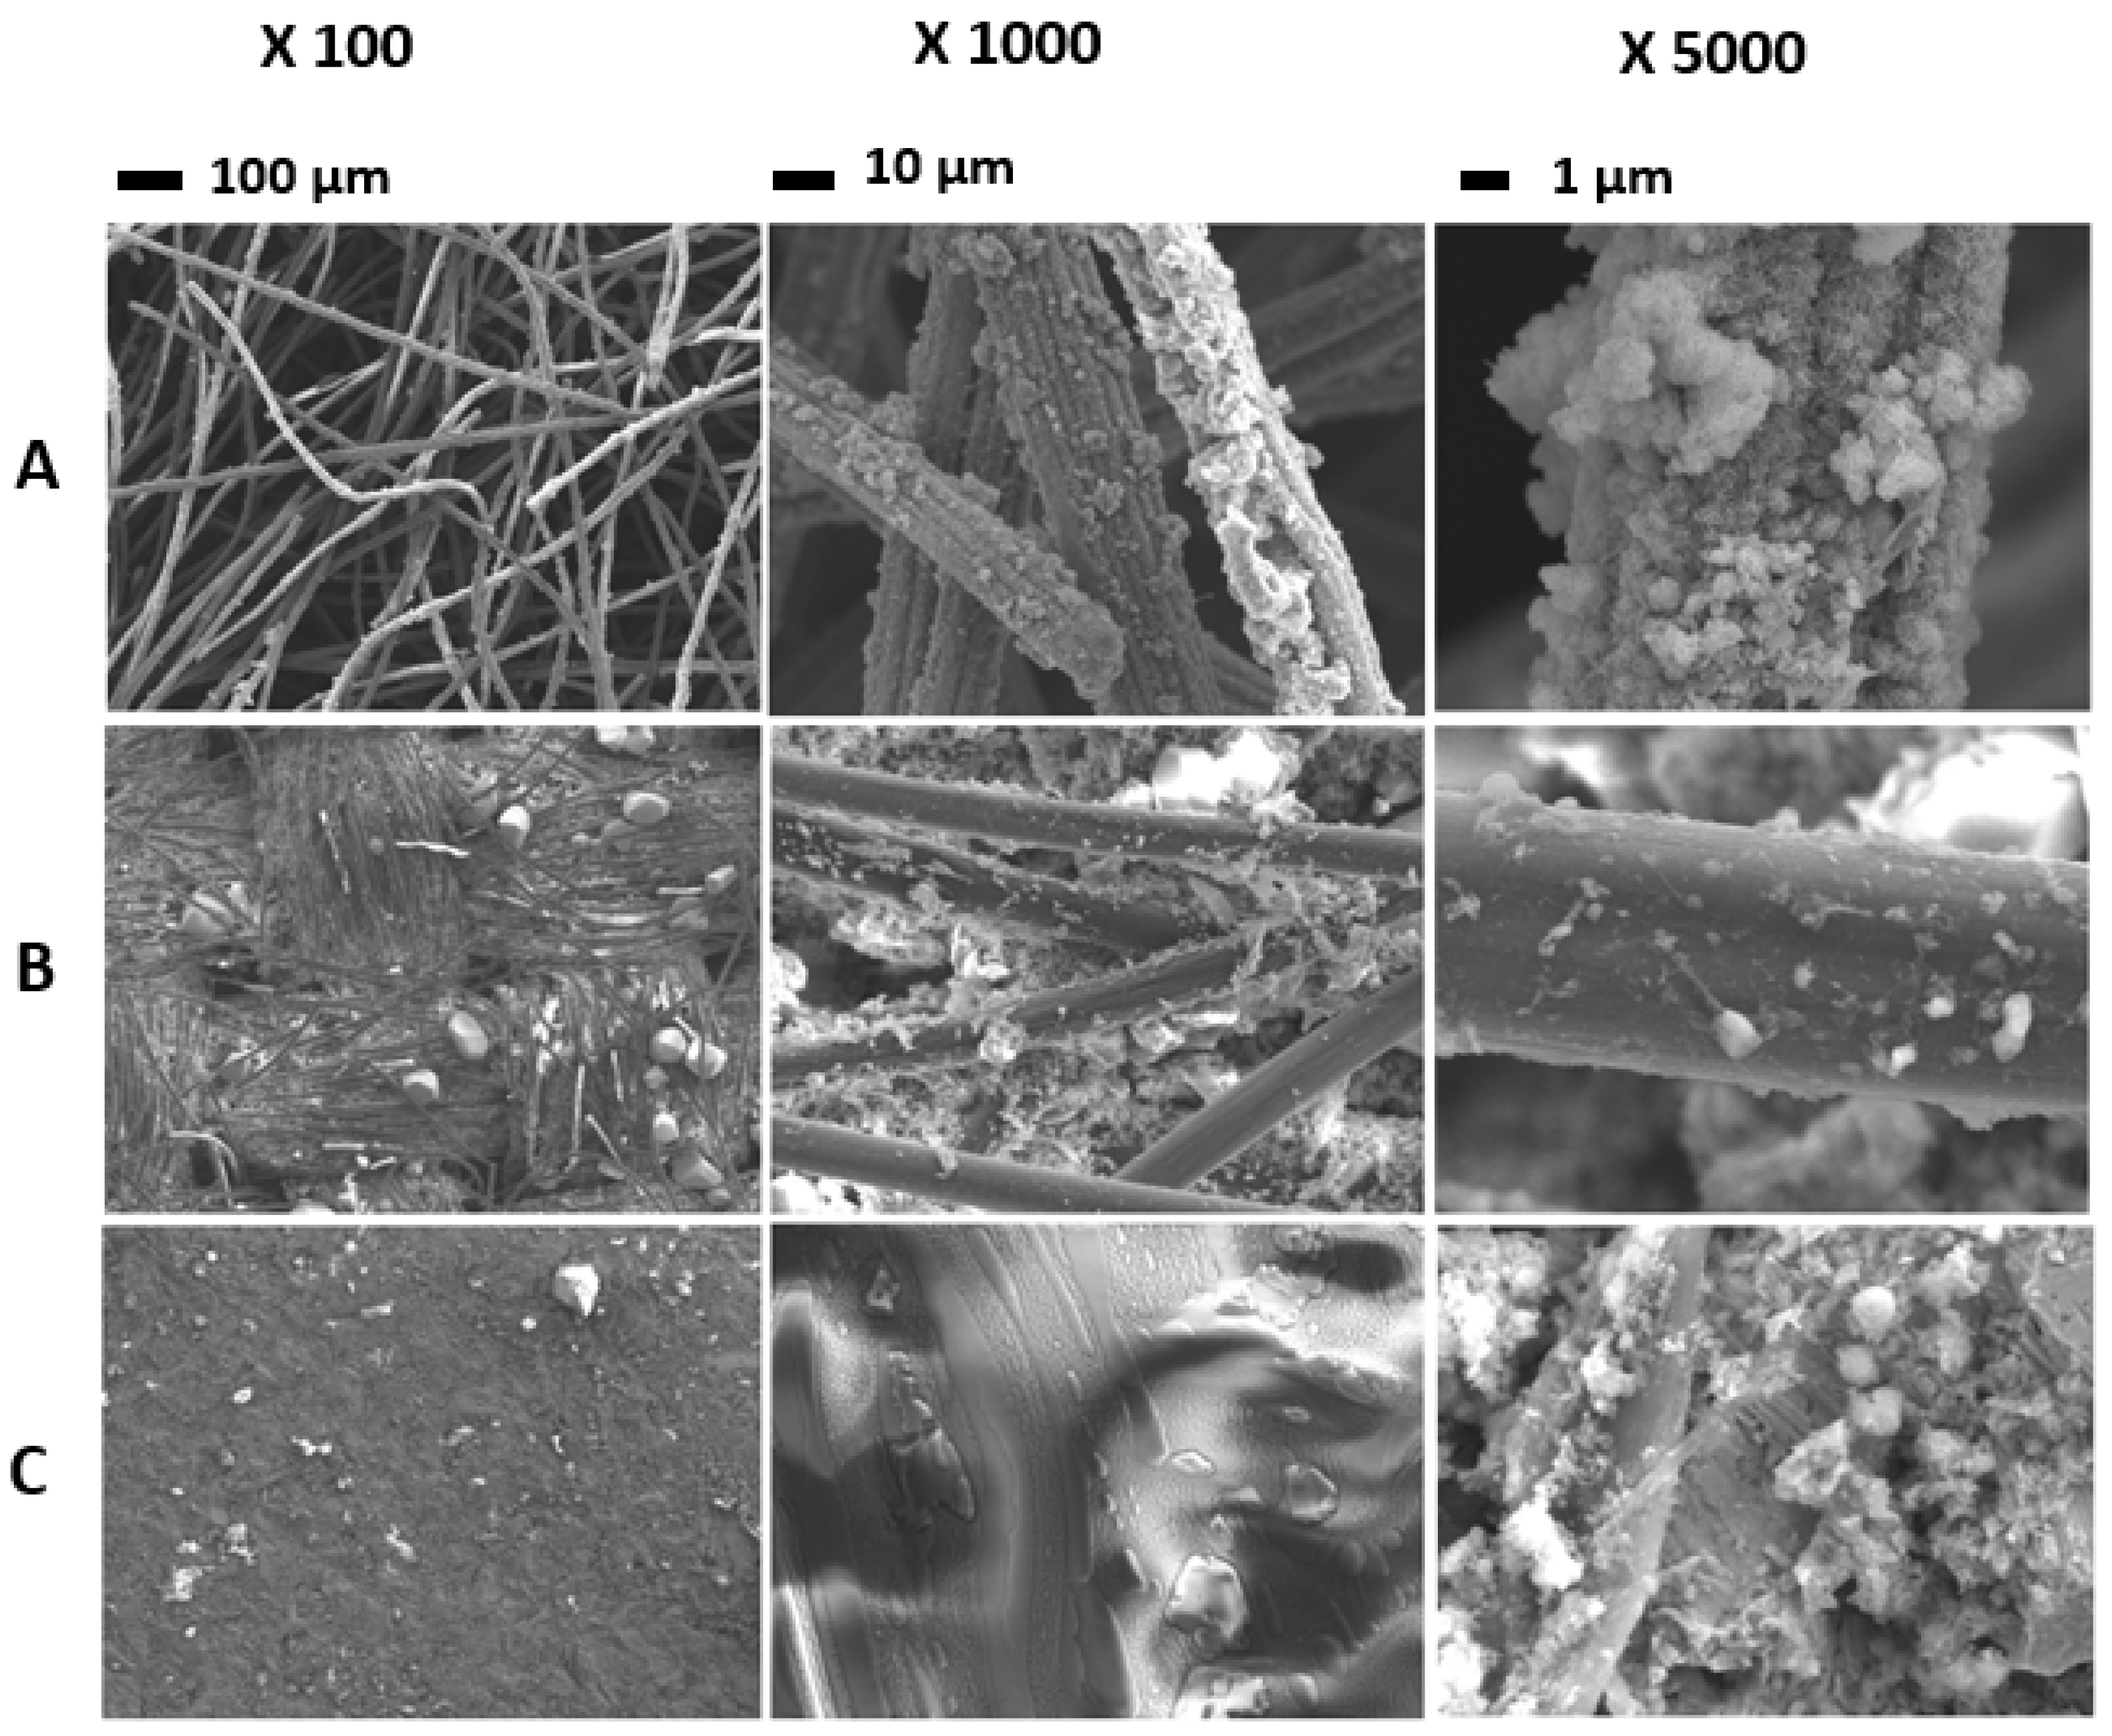
3.4. Biofilm Architecture

Microbial colonization and biofilm formation on the different material surfaces used as anodic electrodes were studied using SEM. For the experiments carried out with the carbon felt, we noticed that the adhesion was mainly achieved on the fibers (Figure 7A), unlike the carbon cloth, where the adhesion was observed only between the fibers (Figure 7B).
The adhesion observed on the surface of these two materials is greater than that observed on stainless steel plate. This maximum adhesion can be attributed to the characteristics of these two materials, such as surface biocompatibility and porosity, which provides a larger surface area available for bacterial attachment and improves extracellular electron transfer between microorganisms and the electrode surface [39].
The study by Blanchet et al. [46] demonstrated the influence of the composition of the enrichment medium on the mode of microbial colonization. Indeed, the use of a rich, non-selective synthetic medium led to easy biofilm formation (on the CF and CC), which prevented deep internal colonization and gave a relatively modest performance (ranging from 1.8 to 3.5 A/m2). In contrast, the study by Rousseau et al. [30] that used the same material as the anodic surface (carbon felt) but under highly selective conditions for halotolerant microbial species (45 g/L NaCl) resulted in a much higher current density of the order of 80 A/m2. These conditions resulted in the formation of a biofilm wrapped mainly around the internal fibers within the felt structure. Based on these data, it can be concluded that bacterial adhesion to a conductive surface depends on the characteristics of the material used (porosity, surface, biocompatibility, mechanical stability) but is also influenced by the composition of the reaction medium, essentially the source of inoculum and the composition of the enrichment medium.

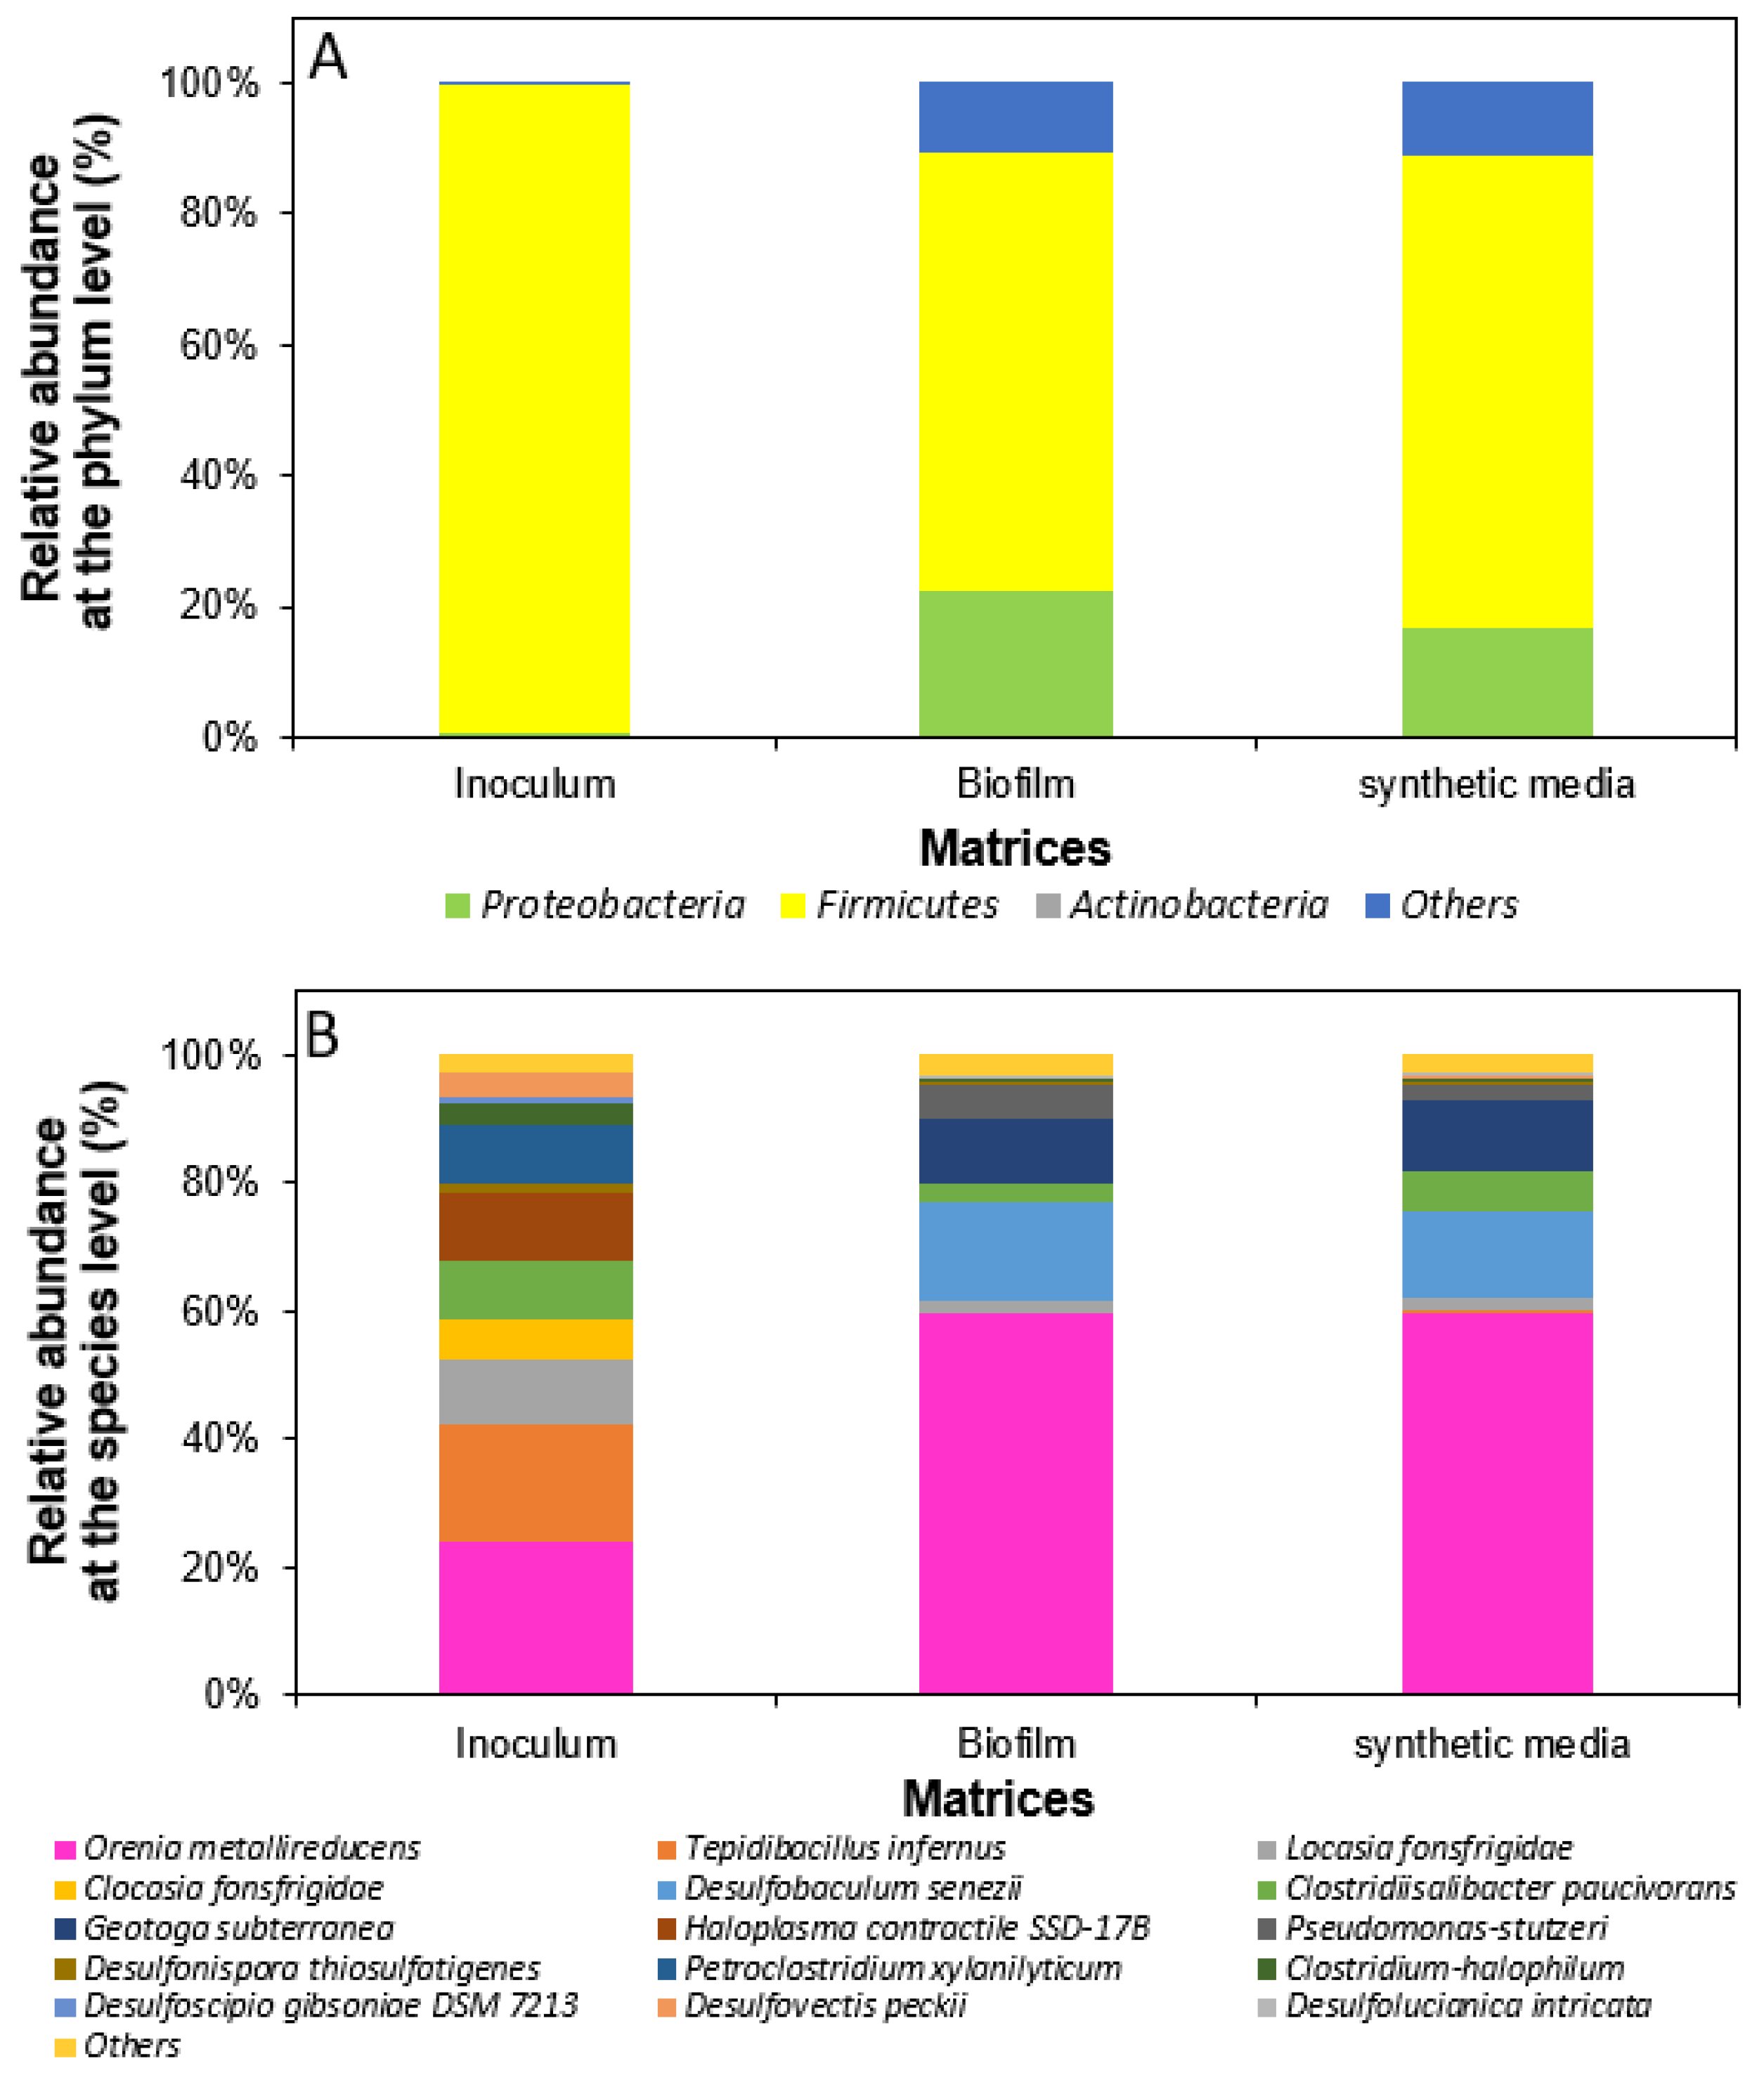
3.5. Comparison of Bacterial Communities in Biofilms Colonising Electrode Materials and Synthetic Media Containing Azo Dye Mixtures

In order to establish a comparative study of the bacterial composition that colonized the initial inoculum, the synthetic media, and the anodic biofilm of the BES, the bacterial population was analyzed. This comparative analysis was limited to experiments conducted under optimal conditions. The different samples were obtained when the oxidation current dropped (≈day 40). We noticed a relative change in the bacterial composition of the bacterial community between the initial inoculum, the electrode materials, and synthetic media at the phylum and species levels.
The initial inoculum was predominantly hosted by the Firmicute phylum with a relative abundance of 99.0%. The enrichment of sulphate-reducing bacteria had a significant influence on the microbial community, leading to the appearance of the Proteobacteria phylum with levels of 16.5% in the electrolyte and 22.3% in the anode biofilm. The Firmicutes phylum retained its dominance with rates of 72.1% and 67.0% for the synthetic media the electrode, respectively (Figure 8A).
Figure 8B describes the bacterial community at the species level. Compared to the bacterial population that harbored the electrolyte and the anode biofilm, the inoculum bacterial community appears to be more heterogenous. The inoculum was mainly consisted of Orenia metallireducens (23.8%), Tepidibacillus infernus (18.7%), Haloplasma contractile SSD-17B (10.4%), Iocasia fonsfrigidae (9.8%), Clostridiisalibacter paucivorans (9.2%), Petroclostridium xylanilyticum (8.9%), Desulfovectis peckii (3.7%), and Clostridium halophilum (3.5%). For the community enriched in the synthetic media, the most dominant bacterial species were Orenia metallireducens (59.7%), Desulfobaculum senezii (13.3%), Geotoga subterranea (11.1%), Clostridiisalibacter paucivorans (6.2%), Desfolulucianicaintricata (2.6%), Pseudomonas stutzeri (2.2%), and Iocasia fonsfrigidae (2.1%). However, in the biofilm, the most dominant species were Orenia metallireducens (59.5%), Desulfobaculum senezii (15.1%), Geotoga subterranea (10.2%), Pseudomonas stutzeri (5.1%), and Clostridiisalibacter paucivorans (3.1%).
For the three analyzed matrices, the most dominant species was Orenia metallireducens. This strain was described as a halophilic, metal-reducing bacterium first isolated from groundwater in the Illinois Basin [47]. However, the electrogenic potential of this species and its involvement in extracellular electron transfer is so far not reported in the literature. The species Petroclostridium xylanilyticum, Haloplasma contractile, and Tepidibacillus infernus were only present in the initial inoculum suggesting their low extracellular electron transfer potentials.
It is also important to note that Desulfovibrio senezii and Geotoga subterranea were only present in the electrolyte and the anodic biofilm. In fact, bacterial species belonging to the genus Desulfovibrio have been well reported for their potential in the efficient treatment of effluents loaded with azo dyes [36,48]. Species belonging to this genus also possess an abundance of multiheme membrane proteins mainly C-type cytochrome proteins involved in extracellular electron transfer [33,49]. Both of these genera are also capable of reducing sulphate to H2S and are referred to as sulphate-reducing bacteria, which can significantly influence the final rate of decolorization. Indeed, the decolorization of azo dyes can occur through chemical reactions with inorganic compounds (sulfide and ferrous ion) that are formed or regenerated as end products of metabolic reactions under anaerobic conditions. The decolorization of azo dyes can thus be achieved by H2S generated by sulphate-reducing bacteria in the extracellular process by acting as an electron donor for the reductive cleavage of the azo bond [50].
Pseudomonas stutzeri was also found in the anodic biofilm (5.7%). The role of this species in the reduction of textile diazo dye Acid Blue 113 was recently reported in the study by Joshi et al. [51]. Several other species belonging to this genus have been identified as azo-reducing species. Examples include Pseudomonas sp. for the biodegradation of the textile azo dye C.I. Red H-3B [52] and Pseudomonas aeruginosa for the decolorization of the textile diazo dye Reactive Yellow 145 [53]. These strains showed significant azoreductase, laccase, and NADH-DCIP reductase activities, and they are the three enzymes most involved in azoreduction. Clostridiisalibacter paucivorans, which is considered a moderately halophilic and strictly anaerobic species, was also present in the initial inoculum as well as at lower levels in the electrode materials and synthetic media. Its role in the treatment of azo dyes was recently reported in the study of Guo et al. [54] who used a halophilic bacterial consortium composed of 50% Halomonas, 30% Marinobacter, and 20% Clostridiisalibacter. This halophilic consortium led to a final yellow-Methanil (MY-G) decolorization rate of 93.3%.

4. Conclusions

In this study, the effectiveness of a thermohalophilic microbial anode made from SCD inoculum to treat a synthetic complex saline textile effluent composed of three azo dyes was optimized. The experiments carried out under the optimized conditions (Section 3.2) resulted in a maximum current density of 5.23 ± 0.30 A/m2, a decolorization rate of 100%, and a COD removal rate of 96 ± 1%. Bacterial population dynamics were revealed. Extremophile bacterial strains enriched on the biofilm demonstrated high potential for azodye degradation and current generation. These extremophiles seem very interesting and require further investigation. This analysis also showed the relative abundance of the species Orenia metallireducens in the three matrices analyzed. This strain could be a suitable and promising candidate for the design of thermohalophilic bioanodes for the treatment of recalcitrant molecules in bioelectrochemical systems.

Supplementary Materials

The following supporting information can be downloaded at: www.mdpi.com/xxx/s1s2s3, Table S1. p values of studied variables and their quadratic and interaction terms for Equation (4) (supplementary data); Table S2. p values of studied variables and their quadratic and interaction terms for Equation (5) (supplementary data); Table S3. p values of studied variables and their quadratic and interaction terms for Equation (6) (supplementary data).

Author Contributions

Conceptualization, S.S., H.C. and B.E.; methodology, S.S. and H.C.; software, H.C. and L.E.; validation, B.E. and H.C.; formal analysis, S.S., B.E. and H.C.; writing—original draft preparation, S.S.; writing—review and editing, S.S., B.E. and H.C.; visualization, B.E. and H.C.; supervision, B.E., H.C. and A.C.; project administration, B.E. and H.C. All authors have read and agreed to the published version of the manuscript.

Funding

This work was financially supported by the “PHC Utique” program of the French Ministry of Foreign Affairs and Ministry of Higher Education, Research and Innovation and the Tunisian Ministry of Higher Education and Scientific Research through a CMCU project, number 20G1115.

Institutional Review Board Statement

Not applicable.

Informed Consent Statement

Not applicable.

Data Availability Statement

Not applicable.

Conflicts of Interest

The authors declare no conflict of interest.

References

  1. Vikrant, K.; Giri, B.S.; Raza, N.; Roy, K.; Kim, K.-H.; Rai, B.N.; Singh, R.S. Recent Advancements in Bioremediation of Dye: Current Status and Challenges. Bioresour. Technol. 2018, 253, 355–367. [Google Scholar] [CrossRef] [PubMed]
  2. Chittal, V.; Gracias, M.; Anu, A.; Saha, P.; Bhaskara Rao, K.V. Biodecolorization and Biodegradation of Azo Dye Reactive Orange-16 by Marine Nocardiopsis sp. Iran. J. Biotechnol. 2019, 17, 18–26. [Google Scholar] [CrossRef]
  3. Saadaoui, S.; Erable, B.; Saidi, N.; Etcheverry, L.; Neifar, M.; Masmoudi, A.S.; Driouech, R.; Cherif, A.; Chouchane, H. Saline Sediments as a Suitable Source for Halophilic Inoculums to Degrade Azo Dyes in Synthetic and Real Textile Wastewaters by Microbial Electrochemical Systems. Appl. Sci. 2023, 13, 5581. [Google Scholar]
  4. Cui, M.-H.; Liu, W.-Z.; Tang, Z.-E.; Cui, D. Recent Advancements in Azo Dye Decolorization in Bio-Electrochemical Systems (BESs): Insights into Decolorization Mechanism and Practical Application. Water Res. 2021, 203, 117512. [Google Scholar] [CrossRef] [PubMed]
  5. Imran, M.; Crowley, D.E.; Khalid, A.; Hussain, S.; Mumtaz, M.W.; Arshad, M. Microbial Biotechnology for Decolorization of Textile Wastewaters. Rev. Environ. Sci. Bio/Technol. 2015, 14, 73–92. [Google Scholar] [CrossRef]
  6. Jadhav, S.A.; Garud, H.B.; Patil, A.H.; Patil, G.D.; Patil, C.R.; Dongale, T.D.; Patil, P.S. Recent Advancements in Silica Nanoparticles Based Technologies for Removal of Dyes from Water. Colloid Interface Sci. Commun. 2019, 30, 100181. [Google Scholar] [CrossRef]
  7. Lellis, B.; Fávaro-Polonio, C.Z.; Pamphile, J.A.; Polonio, J.C. Effects of Textile Dyes on Health and the Environment and Bioremediation Potential of Living Organisms. Biotechnol. Res. Innov. 2019, 3, 275–290. [Google Scholar] [CrossRef]
  8. Solanki, K.; Subramanian, S.; Basu, S. Microbial Fuel Cells for Azo Dye Treatment with Electricity Generation: A Review. Bioresour. Technol. 2013, 131, 564–571. [Google Scholar]
  9. Askri, R.; Erable, B.; Etcheverry, L.; Saadaoui, S.; Neifar, M.; Cherif, A.; Chouchane, H. Allochthonous and autochthonous halothermotolerant bioanodes from hypersaline sediment and textile wastewater: A promising microbial electrochemical process for energy recovery coupled with real textile wastewater treatment. Front. Bioeng. Biotechnol. 2020, 8, 609446. [Google Scholar]
  10. Saidi, N.; Erable, B.; Saadaoui, S.; Driouech, R.; Zaouak, A.; Jelassi, H.; Neifar, M.; Masmoudi, A.S.; Cherif, A.; Chouchane, H. Tunisian Hypersaline Sediments to Set up Suitable Halotolerant Microbial Bioanodes for Electrostimulated Biodegradation of Thiabendazole. Front. Energy Res. 2022, 10, 981802. [Google Scholar]
  11. Cruz Viggi, C.; Casale, S.; Chouchane, H.; Askri, R.; Fazi, S.; Cherif, A.; Zeppilli, M.; Aulenta, F. Magnetite nanoparticles enhance the bioelectrochemical treatment of municipal sewage by facilitating the syntrophic oxidation of volatile fatty acids. J. Chem. Technol. Biotechnol. 2019, 94, 3134–3146. [Google Scholar] [CrossRef]
  12. Ihsanullah, I.; Jamal, A.; Ilyas, M.; Zubair, M.; Khan, G.; Atieh, M.A. Bioremediation of Dyes: Current Status and Prospects. J. Water Process Eng. 2020, 38, 101680. [Google Scholar] [CrossRef]
  13. Sun, L.; Mo, Y.; Zhang, L. A Mini Review on Bio-Electrochemical Systems for the Treatment of Azo Dye Wastewater: State-of-the-Art and Future Prospects. Chemosphere 2022, 294, 133801. [Google Scholar] [CrossRef] [PubMed]
  14. Liu, S.; Song, H.; Wei, S.; Liu, Q.; Li, X.; Qian, X. Effect of Direct Electrical Stimulation on Decolorization and Degradation of Azo Dye Reactive Brilliant Red X-3B in Biofilm-Electrode Reactors. Biochem. Eng. J. 2015, 93, 294–302. [Google Scholar] [CrossRef]
  15. Yang, H.-Y.; Liu, J.; Wang, Y.-X.; He, C.-S.; Zhang, L.-S.; Mu, Y.; Li, W.-H. Bioelectrochemical Decolorization of a Reactive Diazo Dye: Kinetics, Optimization with a Response Surface Methodology, and Proposed Degradation Pathway. Bioelectrochemistry 2019, 128, 9–16. [Google Scholar] [CrossRef] [PubMed]
  16. Hassan, M.; Wei, H.; Qiu, H.; Su, Y.; Jaafry, S.W.H.; Zhan, L.; Xie, B. Power Generation and Pollutants Removal from Landfill Leachate in Microbial Fuel Cell: Variation and Influence of Anodic Microbiomes. Bioresour. Technol. 2018, 247, 434–442. [Google Scholar] [CrossRef]
  17. Grattieri, M.; Minteer, S.D. Microbial Fuel Cells in Saline and Hypersaline Environments: Advancements, Challenges and Future Perspectives. Bioelectrochemistry 2018, 120, 127–137. [Google Scholar] [CrossRef]
  18. Askri, R.; Erable, B.; Neifar, M.; Etcheverry, L.; Masmoudi, A.S.; Cherif, A.; Chouchane, H. Understanding the Cumulative Effects of Salinity, Temperature and Inoculation Size for the Design of Optimal Halothermotolerant Bioanodes from Hypersaline Sediments. Bioelectrochemistry 2019, 129, 179–188. [Google Scholar] [CrossRef]
  19. Chen, B.-Y.; Zhang, M.-M.; Ding, Y.; Chang, C.-T. Feasibility Study of Simultaneous Bioelectricity Generation and Dye Decolorization Using Naturally Occurring Decolorizers. J. Taiwan Inst. Chem. Eng. 2010, 41, 682–688. [Google Scholar] [CrossRef]
  20. Cui, M.-H.; Cui, D.; Gao, L.; Wang, A.-J.; Cheng, H.-Y. Evaluation of Anaerobic Sludge Volume for Improving Azo Dye Decolorization in a Hybrid Anaerobic Reactor with Built-in Bioelectrochemical System. Chemosphere 2017, 169, 18–22. [Google Scholar] [CrossRef]
  21. Thung, W.-E.; Ong, S.-A.; Ho, L.-N.; Wong, Y.-S.; Ridwan, F.; Oon, Y.-L.; Oon, Y.-S.; Lehl, H.K. A Highly Efficient Single Chambered Up-Flow Membrane-Less Microbial Fuel Cell for Treatment of Azo Dye Acid Orange 7-Containing Wastewater. Bioresour. Technol. 2015, 197, 284–288. [Google Scholar] [CrossRef]
  22. Sun, J.; Bi, Z.; Hou, B.; Cao, Y.; Hu, Y. Further Treatment of Decolorization Liquid of Azo Dye Coupled with Increased Power Production Using Microbial Fuel Cell Equipped with an Aerobic Biocathode. Water Res. 2011, 45, 283–291. [Google Scholar] [CrossRef] [PubMed]
  23. Carmalin, S.A.; Bhalambaal, V.M.; Lima, E.C. Re-Use of Carbon Rods from Used Batteries as Cathode for Textile Azo Dye Degradation in a Microbial Fuel Cell. Desalin. Water Treat. 2017, 79, 322–328. [Google Scholar] [CrossRef]
  24. Cui, Z.; Gao, W.; Xu, G.; Luan, X.; Li, Q.; Yin, X.; Huang, D.; Zheng, L. Marinobacter Aromaticivorans Sp. Nov., a Polycyclic Aromatic Hydrocarbon-Degrading Bacterium Isolated from Sea Sediment. Int. J. Syst. Evol. Microbiol. 2016, 66, 353–359. [Google Scholar] [CrossRef]
  25. Mu, Y.; Rabaey, K.; Rozendal, R.A.; Yuan, Z.; Keller, J. Decolorization of Azo Dyes in Bioelectrochemical Systems. Environ. Sci. Technol. 2009, 43, 5137–5143. [Google Scholar] [CrossRef]
  26. Kalathil, S.; Lee, J.; Cho, M.H. Efficient Decolorization of Real Dye Wastewater and Bioelectricity Generation Using a Novel Single Chamber Biocathode-Microbial Fuel Cell. Bioresour. Technol. 2012, 119, 22–27. [Google Scholar] [CrossRef] [PubMed]
  27. Miran, W.; Nawaz, M.; Kadam, A.; Shin, S.; Heo, J.; Jang, J.; Lee, D.S. Microbial Community Structure in a Dual Chamber Microbial Fuel Cell Fed with Brewery Waste for Azo Dye Degradation and Electricity Generation. Environ. Sci. Pollut. Res. 2015, 22, 13477–13485. [Google Scholar] [CrossRef]
  28. Fernando, E.; Keshavarz, T.; Kyazze, G.; Fonseka, K. Treatment of Colour Industry Wastewaters with Concomitant Bioelectricity Production in a Sequential Stacked Mono-Chamber Microbial Fuel Cells–Aerobic System. Environ. Technol. 2016, 37, 255–264. [Google Scholar] [CrossRef] [PubMed]
  29. Xu, H.; Wang, L.; Lin, C.; Zheng, J.; Wen, Q.; Chen, Y.; Wang, Y.; Qi, L. Improved Simultaneous Decolorization and Power Generation in a Microbial Fuel Cell with the Sponge Anode Modified by Polyaniline and Chitosan. Appl. Biochem. Biotechnol. 2020, 192, 698–718. [Google Scholar] [CrossRef] [PubMed]
  30. Rousseau, R.; Santaella, C.; Bonnafous, A.; Achouak, W.; Godon, J.-J.; Delia, M.-L.; Bergel, A. Halotolerant Bioanodes: The Applied Potential Modulates the Electrochemical Characteristics, the Biofilm Structure and the Ratio of the Two Dominant Genera. Bioelectrochemistry 2016, 112, 24–32. [Google Scholar] [CrossRef]
  31. Chouchane, H.; Mahjoubi, M.; Ettoumi, B.; Neifar, M.; Cherif, A. A Novel Thermally Stable Heteropolysaccharide-Based Bioflocculant from Hydrocarbonoclastic Strain KocuriaRosea BU22S and Its Application in Dye Removal. Environ. Technol. 2018, 39, 859–872. [Google Scholar] [CrossRef] [PubMed]
  32. Oon, Y.-S.; Ong, S.-A.; Ho, L.-N.; Wong, Y.-S.; Oon, Y.-L.; Lehl, H.K.; Thung, W.-E.; Nordin, N. Microbial Fuel Cell Operation Using Monoazo and Diazo Dyes as Terminal Electron Acceptor for Simultaneous Decolourisation and Bioelectricity Generation. J. Hazard. Mater. 2017, 325, 170–177. [Google Scholar] [CrossRef]
  33. Kang, C.S.; Eaktasang, N.; Kwon, D.-Y.; Kim, H.S. Enhanced Current Production by Desulfovibrio Desulfuricans Biofilm in a Mediator-Less Microbial Fuel Cell. Bioresour. Technol. 2014, 165, 27–30. [Google Scholar] [CrossRef] [PubMed]
  34. Huang, T.; Liu, L.; Tao, J.; Zhou, L.; Zhang, S. Microbial Fuel Cells Coupling with the Three-Dimensional Electro-Fenton Technique Enhances the Degradation of Methyl Orange in the Wastewater. Environ. Sci. Pollut. Res. 2018, 25, 17989–18000. [Google Scholar] [CrossRef]
  35. Teoh, T.-P.; Ong, S.-A.; Ho, L.-N.; Wong, Y.-S.; Lutpi, N.A.; Oon, Y.-L.; Tan, S.-M.; Ong, Y.-P.; Yap, K.-L. Insights into the Decolorization of Mono and Diazo Dyes in Single and Binary Dyes Containing Wastewater and Electricity Generation in Up-Flow Constructed Wetland Coupled Microbial Fuel Cell. Environ. Sci. Pollut. Res. 2022, 30, 17546–17563. [Google Scholar] [CrossRef]
  36. Miran, W.; Jang, J.; Nawaz, M.; Shahzad, A.; Lee, D.S. Sulfate-Reducing Mixed Communities with the Ability to Generate Bioelectricity and Degrade Textile Diazo Dye in Microbial Fuel Cells. J. Hazard. Mater. 2018, 352, 70–79. [Google Scholar] [CrossRef] [PubMed]
  37. Li, Z.; Zhang, X.; Lin, J.; Han, S.; Lei, L. Azo Dye Treatment with Simultaneous Electricity Production in an Anaerobic–Aerobic Sequential Reactor and Microbial Fuel Cell Coupled System. Bioresour. Technol. 2010, 101, 4440–4445. [Google Scholar] [CrossRef]
  38. Oon, Y.-L.; Ong, S.-A.; Ho, L.-N.; Wong, Y.-S.; Dahalan, F.A.; Oon, Y.-S.; Lehl, H.K.; Thung, W.-E.; Nordin, N. Up-Flow Constructed Wetland-Microbial Fuel Cell for Azo Dye, Saline, Nitrate Remediation and Bioelectricity Generation: From Waste to Energy Approach. Bioresour. Technol. 2018, 266, 97–108. [Google Scholar]
  39. Yaqoob, A.A.; Mohamad Ibrahim, M.N.; Rafatullah, M.; Chua, Y.S.; Ahmad, A.; Umar, K. Recent Advances in Anodes for Microbial Fuel Cells: An Overview. Materials 2020, 13, 2078. [Google Scholar] [CrossRef]
  40. Shahi, A.; Rai, B.N.; Singh, R.S. Biodegradation of Reactive Orange 16 Dye in Microbial Fuel Cell: An Innovative Way to Minimize Waste Along with Electricity Production. Appl. Biochem. Biotechnol. 2020, 192, 196–210. [Google Scholar] [CrossRef]
  41. Sun, J.; Li, Y.; Hu, Y.; Hou, B.; Xu, Q.; Zhang, Y.; Li, S. Enlargement of Anode for Enhanced Simultaneous Azo Dye Decolorization and Power Output in Air-Cathode Microbial Fuel Cell. Biotechnol. Lett. 2012, 34, 2023–2029. [Google Scholar] [CrossRef] [PubMed]
  42. Ilamathi, R.; Jayapriya, J. Microbial Fuel Cells for Dye Decolorization. Environ. Chem. Lett. 2018, 16, 239–250. [Google Scholar] [CrossRef]
  43. Wei, J.; Liang, P.; Cao, X.; Huang, X. A New Insight into Potential Regulation on Growth and Power Generation of Geobacter Sulfurreducens in Microbial Fuel Cells Based on Energy Viewpoint. Environ. Sci. Technol. 2010, 44, 3187–3191. [Google Scholar] [CrossRef] [PubMed]
  44. Qiu, H.; Shen, F.; Yin, A.; Liu, J.; Wu, B.; Li, Y.; Xiao, Y.; Hai, J.; Xu, B. Biodegradation and Detoxification of Azo Dyes by Halophilic/Halotolerant Microflora Isolated From the Salt Fields of Tibet Autonomous Region China. Front. Microbiol. 2022, 13, 877151. [Google Scholar] [CrossRef] [PubMed]
  45. Chen, Y.; Feng, L.; Li, H.; Wang, Y.; Chen, G.; Zhang, Q. Biodegradation and Detoxification of Direct Black G Textile Dye by a Newly Isolated Thermophilic Microflora. Bioresour. Technol. 2018, 250, 650–657. [Google Scholar] [CrossRef] [PubMed]
  46. Blanchet, E.; Erable, B.; De Solan, M.-L.; Bergel, A. Two-Dimensional Carbon Cloth and Three-Dimensional Carbon Felt Perform Similarly to Form Bioanode Fed with Food Waste. Electrochem. Commun. 2016, 66, 38–41. [Google Scholar] [CrossRef]
  47. Dong, Y.; Sanford, R.A.; Boyanov, M.I.; Kemner, K.M.; Flynn, T.M.; O’Loughlin, E.J.; Chang, Y.; Locke, R.A.; Weber, J.R.; Egan, S.M.; et al. Orenia Metallireducens Sp. Nov. Strain Z6, a Novel Metal-Reducing Member of the Phylum Firmicutes from the Deep Subsurface. Appl. Environ. Microbiol. 2016, 82, 6440–6453. [Google Scholar] [CrossRef]
  48. Diniz, P.E.; Lopes, A.T.; Lino, A.R.; Serralheiro, M.L. Anaerobic Reduction of a Sulfonated Azo Dye, Congo Red, by Sulfate-Reducing Bacteria. Appl. Biochem. Biotechnol. 2002, 97, 147–164. [Google Scholar] [CrossRef]
  49. Dai, Q.; Zhang, S.; Liu, H.; Huang, J.; Li, L. Sulfide-Mediated Azo Dye Degradation and Microbial Community Analysis in a Single-Chamber Air Cathode Microbial Fuel Cell. Bioelectrochemistry 2020, 131, 107349. [Google Scholar] [CrossRef]
  50. Selvaraj, V.; Swarna Karthika, T.; Mansiya, C.; Alagar, M. An over Review on Recently Developed Techniques, Mechanisms and Intermediate Involved in the Advanced Azo Dye Degradation for Industrial Applications. J. Mol. Struct. 2021, 1224, 129195. [Google Scholar] [CrossRef]
  51. Joshi, A.U.; Hinsu, A.T.; Kotadiya, R.J.; Rank, J.K.; Andharia, K.N.; Kothari, R.K. Decolorization and Biodegradation of Textile Di-Azo Dye Acid Blue 113 by Pseudomonas Stutzeri AK6. 3 Biotech 2020, 10, 214. [Google Scholar] [CrossRef] [PubMed]
  52. Bera, S.P.; Tank, S.K. Screening and Identification of Newly Isolated Pseudomonas Sp. for Biodegrading the Textile Azo Dye C.I. Procion Red H-3B. J. Appl. Microbiol. 2021, 130, 1949–1959. [Google Scholar] [CrossRef] [PubMed]
  53. Garg, N.; Garg, A.; Mukherji, S. Eco-Friendly Decolorization and Degradation of Reactive Yellow 145 Textile Dye by Pseudomonas Aeruginosa and Thiosphaera Pantotropha. J. Environ. Manag. 2020, 263, 110383. [Google Scholar] [CrossRef] [PubMed]
  54. Guo, G.; Li, X.; Tian, F.; Liu, T.; Yang, F.; Ding, K.; Liu, C.; Chen, J.; Wang, C. Azo Dye Decolorization by a Halotolerant Consortium under Microaerophilic Conditions. Chemosphere 2020, 244, 125510. [Google Scholar] [CrossRef]
Figure 1. The 2D-contour plots and 3D-response surface of current production A/m2versus the tested variables:glucose concentration and anode material (A,B) with anode surface and applied potential kept constant at the center level; glucose concentration and anode surface (C,D) with anode material and applied potential kept constant at the center level; and applied potential and anode material (E,F) with glucose concentration and anode surface kept constant at the center level.
Fermentation 09 00782 g001
Figure 2. The 2D-contour plots and 3D-response surface of decolorization rate% versus the tested variables: glucose concentration and anode material (A,B) with anode surface and applied potential kept constant at the center level; glucose concentration and anode surface (C,D) with anode material and applied potential kept constant at the center level; and applied potential and anode material (E,F) with glucose concentration and anode surface kept constant at the center level.
Fermentation 09 00782 g002
Figure 3. The 2D-contour plots and 3D-response surface of COD removal rate% versus the tested variables: glucose concentration and anode material (A,B) with anode surface and applied potential kept constant at the center level; glucose concentration and anode surface (C,D) with anode material and applied potential kept constant at the center level; and imposed potential and anode material (E,F) with glucose concentration and anode surface kept constant at the center level.
Fermentation 09 00782 g003
Figure 4. Evolution of the current density (A/m2) versus time (days) for triplicate experiments in a synthetic medium under theoretical optimal conditions determined using the statistical model: potential: −0.1 V/SCE, anode material: carbon felt, surface area: 6 cm2, and co-substrate: glucose 7 g/L.
Fermentation 09 00782 g004
Figure 5. (A) Decolorization and (B) COD removal rates of the experiment performed with the optimal conditions (potential: −0.1 V/SCE, WE material: carbon felt, surface: 6cm2, co-substrate: glucose 7g/L).
Fermentation 09 00782 g005
Figure 6. FTIR spectra of the three azo dye mixtures before and after treatment.
Fermentation 09 00782 g006
Figure 7. SEM micrographs of different conditions used in the BES for textile azo dyes treatment and electrical power generation: (A) experiment conducted under optimal conditions (WE: carbon felt; glucose: 7 g/L; applied potential: −0.1 V/SCE), (B) experiment 19 (WE: carbon cloth; glucose: 5 g/L; applied potential: −0.1 V/SCE), and (C) (WE: stainless steel plate; glucose: 5 g/L; applied potential: −0.1 V/SCE).
Fermentation 09 00782 g007
Figure 8. Bacterial distribution at (A) phylum level and (B) species level.
Fermentation 09 00782 g008
Table 1. Experimental domain of the Box-Behnken design.
Variables−101
Working electrode material (θ1)Carbon clothCarbon feltStainless steel plate
Working electrode surface area (θ2) (cm2)630100
Glucose co-substrate concentration (θ3) (g/L)5010
Applied polarization potential (θ4) (V/SCE)−0.3−0.1+0.2
Table 2. Statistical design in coded and natural variables and the corresponding experimental and predicted responses.
Responses (ψ)
Coded VariablesNatural VariablesΨ1 Ψ2 Ψ3
Reactorsθ1θ2θ3θ4Anode MaterialAnode Surface [Glucose]
(g/L)
Applied Potential
(V)
Exp
(A/m2)
Pred
(A/m2)
Exp
(%)
Pred
(%)
Exp
(%)
Pred
(%)
R1−1−1−1−1CF60−0.30.00−0.0229.0025.0230.0028.40
R21−1−1−1SSP60−0.30.00−0.5928.0022.8927.0025.86
R3−11−1−1CF1000−0.30.000.2320.0029.2329.0029.92
R411−1−1SSP1000−0.30.000.7525.0036.8527.0031.13
R5−1−11−1CF610−0.33.303.9772.0075.5690.0086.58
R61−11−1SSP610−0.30.230.5342.0056.6964.0072.29
R7−111−1CF10010−0.33.502.5180.0075.0289.0088.85
R8111−1SSP10010−0.30.420.1775.0065.8982.0078.31
R9−1−1−11CF60+0.20.020.8225.0033.2333.0033.97
R101−1−11SSP60+0.20.020.4326.0030.3531.0033.18
R11−11−11CF1000+0.20.05−0.8230.0014.6932.0025.74
R1211−11SSP1000+0.20.00−0.1226.0021.5628.0028.69
R13−1−111CF610+0.27.005.6790.0077.5296.0093.91
R141−111SSP610+0.22.102.4168.0057.8985.0081.36
R15−1111CF10010+0.21.202.3250.0054.2388.0086.42
R161111SSP10010+0.20.700.1541.0044.3574.0077.63
R17−1000CF305−0.11.141.5456.0067.5172.0085.22
R181000SSP305−0.10.400.1667.0061.5190.0079.57
R190−100CC65−0.13.252.7189.0089.8490.0090.44
R200100CC305−0.11.001.7080.0085.1787.0089.33
R2100−10CC300−0.10.00−0.5835.0030.1733.0033.11
R220010CC3010−0.10.801.5456.0066.8484.0086.67
R23000−1CC305−0.30.900.8278.0061.8491.0087.67
R240001CC305+0.21.001.2433.0055.1784.0090.11
R250000CC305−0.11.001.1475.0071.3289.0088.22
R260000CC305−0.11.501.1476.0071.3292.0088.22
R270000CC305−0.11.401.1481.0071.3292.0088.22
Exp: experimental, Pred: predicted, CF: carbon felt, SSP: stainless steel plate, CC: carbon cloth.
Disclaimer/Publisher’s Note: The statements, opinions and data contained in all publications are solely those of the individual author(s) and contributor(s) and not of MDPI and/or the editor(s). MDPI and/or the editor(s) disclaim responsibility for any injury to people or property resulting from any ideas, methods, instructions or products referred to in the content.

