Article

Pull-Out Resistance of Rebar Stake Depending on Installation Conditions and Compaction Levels of Agricultural Soil

1
Department of Civil and Environmental Engineering, Hanyang University, ERICA, Sangnok-gu, Ansan 15588, Republic of Korea
2
Department of Architectural Engineering, Kyungpook National University, Daegu 41566, Republic of Korea
3
Department of Agricultural Engineering, National Institute of Agricultural Sciences, Rural Development Administration, Jeonju 54875, Republic of Korea
*
Author to whom correspondence should be addressed.
Horticulturae 2024, 10(3), 277; https://doi.org/10.3390/horticulturae10030277
Submission received: 30 January 2024 / Revised: 6 March 2024 / Accepted: 11 March 2024 / Published: 13 March 2024

Abstract

:
Strong winds, particularly in the absence of disaster-resistant designs, significantly impact the stability of greenhouse foundations and eventually lead to structural damage and potential harm to crops. As a countermeasure, rebar stakes are commonly used to reinforce the foundations of non-disaster-resistant greenhouses. This study evaluates the pull-out resistance (Rpull-out) of rebar stakes considering various factors like soil compaction, embedded length, installation duration and angle, and changes in soil water content against uplift pressure by strong winds. A combination of field (i.e., the cone penetration test and rebar stake pull-out test) and laboratory (i.e., the compaction test, soil compaction meter test, and soil box test) tests are performed for the assessment of Rpull-out. The results indicate that Rpull-out increases with higher soil compaction, greater embedded length, longer installation duration, and an inclined installation angle. The soil compaction exerts the most significant impact; 90% to 100% of the soil compaction rate has approximately 10 folds higher Rpull-out than the 60–70% compaction rate. If the embedded length is increased from 20 cm to 40 cm, there is a two-fold increase in the average of Rpull-out. Inclined installation of rebar stakes increases Rpull-out by 250% to 350% compared to vertical installation, and rebar stakes installed prior to the uplift event have 1.5 to 6.4 fold increases in Rpull-out than those with instant installation. Additionally, we observed variations in the surface soil moisture due to climatic changes introducing variability in Rpull-out. These findings lead to the proposition of efficient rebar stake installation methods, contributing to the enhanced stability of a greenhouse.

Graphical Abstract

1. Introduction

Plastic greenhouses, with their lightweight structure, are particularly susceptible to wind damage. This vulnerability has induced numerous studies focusing on their safety under wind pressure, examining how such forces impact their structural integrity [1,2]. During the summer season (June to August), typhoons often hit South Korea, accompanied by substantial rainfall [3,4]. The significance of this heavy rainfall with wind pressure cannot be understated, especially in terms of its impact on the stability of the greenhouse foundations [5]. Yoon et al. [6] noted that the primary cause of typhoon damage to greenhouses was the inadequate installation of the foundations compared to the uplift forces exerted by strong winds. Excessive moisture due to rainfall weakens the soil’s shear strength, even increasing the risk of damage through uplift or overturning by strong winds [7]. This highlights the need for robust foundation designs and installation methods to ensure the resilience of plastic greenhouses against wind hazards.
In South Korea, wind hazards have led to significant damage, with 1040 ha greenhouses affected in 2020 and 7151 ha in 2021 [8]. Between 2020 and 2021, the annual financial loss due to this damage amounted to KRW 4.4 billion [8]. This recurring problem has become a major concern for greenhouse owners and farmers. In response, the Rural Development Administration (RDA) in South Korea introduced new disaster-resistant design criteria in 2010 to mitigate the hazard. These new criteria focus on preventing uplift failure due to wind pressure and structural failure due to snow weight [9]. A key requirement of the criteria is the installation of a continuous pipe foundation at a depth of over 20 cm. This buried continuous pipe foundation is connected to greenhouse rafters, and the foundation effectively resists uplift pressure. It is reported that greenhouses adhering to these new standards have suffered minimal damage, even in strong winds [9]. However, many greenhouses were constructed before the disaster-resistant criteria were established or were not in compliance due to cost considerations. As of 2023, more than 50% of greenhouses in South Korea do not meet the new disaster-resistant standards. These non-disaster-resistant greenhouses rely only on rafter pipes buried in the ground for uplift resistance, which may be inadequate against strong winds. Some non-disaster-resistant greenhouses are reinforced using rebar stakes, but the effectiveness of rebar stakes has not been thoroughly evaluated.
Previous studies have examined various greenhouse foundation systems [10,11,12,13,14,15,16,17,18,19,20,21,22,23,24]. In South Korea, several studies examined the pull-out resistance of continuous pipe foundations compared with other types of foundations using a soil container [25,26,27]. Lim et al. [26] evaluated the pull-out resistance of continuous pipe foundations, spiral foundations, and top foundations with varying embedment depths and the soil types (i.e., silty sand, low plasticity silt, and clayey sand). They found no significant correlation between the type of soil and the foundation’s pull-out resistance [26]. Song et al. [27] assessed the pull-out resistance of continuous pipe foundations, spiral foundations, and independent concrete foundations with varying soil types and compaction levels. They found that the maximum pull-out resistance was highest for the independent concrete foundations, followed by continuous pipe foundations and spiral foundations [27]. Choi et al. [25] tested the pull-out resistance of continuous pipe foundations and rafter pipes with various soil types (rice pad soil and reclaimed land soil), compaction rates, and embedment depths. The higher the compaction rate and the deeper the embedment depth, the greater the pull-out resistance for all foundations and soil types. The pull-out resistance of the continuous pipe foundation was approximately six times greater than that of one of the rafter pipes. For both types of foundations, the differences in capacities between the two soil types were not significant. Choi et al. [25] reported that if a higher compaction rate is applied, the continuous pipe foundation will be effective against pull-out force regardless of soil type. Lee et al. [16] used a numerical analysis to evaluate the pull-out resistance of continuous pipe foundations, individual pipe, spiral foundations, and top foundations under uplift load and stated that greenhouses using individual pipe foundations require essential reinforcement.
For greenhouses in Spain, three types of foundations (i.e., piles with full-length concrete, free-base anchorage, and piles with partial-length concrete) were tested against the pull-out force in the field, and numerical simulations were performed [18]. Similar to other studies, the pull-out resistance increased with the embedment depth and foundation diameter. Among the three types of foundations, they found that the pile with a full length of concrete was the most effective, and the free-base anchorage was the worst. If the length-to-diameter ratio was less than 9.5, a small displacement was observed for the concrete pile.
These previous studies often focused on continuous pipe foundations or specific foundations, limiting their relevance for non-disaster-resistant greenhouses that commonly rely on rebar stakes for pull-out resistance. The relationship between water content, compaction level, and the pull-out resistance of rebar stakes remains underexplored. In addition, for the rafter pipe, only the vertical pull-out capacity was examined, but capacities with inclined angles were not investigated. To overcome the lack of information, this study aims to develop a comprehensive understanding of the pull-out resistance of rebar stakes under varying soil conditions and installation parameters (i.e., installation length and angle). We investigated how the soil water content and compaction level, along with installation conditions, influence the rebar stake pull-out resistance using multiple series of laboratory and field tests. Based on the test results, we suggest an optimal installation method for rebar stakes and anticipated pull-out resistance.

2. Materials and Methods

2.1. Surface Soil Types

In determining the soil types for laboratory and field testing in this study, we first assessed the distribution of surface soil types in South Korea. The National Institute of Agricultural Sciences (NIAS) provides GIS-based maps detailing surface soil conditions for agricultural purposes [28]. Among them, there are soil classification maps at very shallow depth (0–20 cm) and moderately shallow depth (20–100 cm), according to the USDA soil classification system [29]. The soil classification map for shallow depth (20–100 cm) and proportion of soil classification are shown in Figure 1. Our analysis of the map revealed that most of the soil, accounting for 75%, falls under the categories of loam or sandy loam (silty sand (SM) or clayey sand (SC) in the USCS system [30]). Also, Ahn et al. [31] reported that sandy loam is the predominant soil type for rice pad in South Korea. Additionally, our field visits indicated that the surface layer of the greenhouse ground often consists of SM or SC fill materials transported from other areas, chosen for their agricultural suitability. Based on these findings, we selected the soil types of SM and SC as the focus of our rebar stake pull-out resistance tests.

2.2. Sites

Given that the maximum length of rebar stakes used for greenhouse reinforcement in practice does not exceed 1 m, their pull-out resistance (Rpull-out) is influenced primarily by surface soil layers no deeper than 1 m. Additionally, it is common for the surface soil beneath greenhouses to be sourced from different locations. Therefore, we established a field test site (Site A) in proximity to our laboratory for easy access (Figure 2). The site measures 2.1 m × 1.2 m with a depth of 0.5 m. The soil was sourced from a site managed by the NIAS, where actual farming was conducted as part of in situ agricultural research. According to the USCS system, the soil is classified as SM.
Site A was compacted by human weight; the soil was spreading out with a 5 cm thickness and compacted by walking back and forth on the all surface area several times. After performing field tests on this compaction condition, the surface layer was re-compressed using a hand compactor, which has a compaction force of 14.7 kN and a base plate size of 490 mm × 360 mm, as shown in Figure 2. This mechanical compaction increased the compaction level at Site A.
In addition to Site A, we conducted rebar stake pull-out tests at two other field locations: Site B and Site C, where the site images are shown in Figure 3. Site B’s and Site C’s soil types are SC by the USCS. These sites were chosen because their soil classifications align with the most prevalent types identified in the soil condition map (as shown in Figure 1) and because they have similar soil characteristics to Site A. At Sites B and C, we carried out a series of field tests, including pull-out and cone penetration tests, along with laboratory tests on the soil samples. Figure 1a shows the locations of Sites A, B, and C, overlaying them onto the soil condition map.
Figure 4 shows the grain size distributions of samples from each of Sites A, B, and C, and Table 1 lists the index properties (water content, plastic limit, liquid limit, plasticity index, and soil classifications). The grain size distribution indicates the weight percent of soil passing through each sieve versus the sieve’s opening size (e.g., #4 sieve has a 4.75 mm opening size), which is considered the particle diameter of soil. Site A consists of the coarsest material, and Site C is composed of the finest material among the three sites. The plastic limit (PL) and liquid limit (LL) were measured following ASTM D4318-17 [33], and the plasticity index (PI) is calculated as the difference in LL and PL. Sites A and B are classified as loam, and Site C is classified as sandy loam according to the USDA criteria, and they all conform to the SM or SC categories by the USCS.

2.3. Laboratory and Field Tests

We conducted a comprehensive series of laboratory and field tests: (compaction test, soil compaction meter test, soil box test) as laboratory tests, and (cone penetration test, pull-out test) as field tests. These tests were designed to thoroughly evaluate the Rpull-out of rebar stakes under various soil conditions and soil properties. The method of each test is described in this section.

2.3.1. Compaction Test

The level of soil compaction directly influences the Rpull-out of rebar stakes. Higher compaction levels result in increased Rpull-out, whereas lower compaction levels lead to decreased resistance. By performing compaction tests with varying energy levels, we identified the optimal water content (wopt) and maximum dry unit weights (γd,max) for specific compaction energies.
In South Korea, the compaction standard specifies five compaction types, which essentially represent two levels of energy [34]. Compaction types A and B are executed with an energy of 550 N·mm/mm3, while types C, D, and E use 2500 N·mm/mm3. However, these compaction types are designed for geotechnical applications, such as road pavement and embankment construction, and they typically apply more energy than what is suitable for agricultural purposes. Therefore, a compaction method with less energy than type A or B is needed in our study. In response, this study introduced a new compaction type, termed A0. This type was developed by reducing the number of layers and blows per layer from type A. By adjusting the number of blows per layer to 15 and the number of layers to 2, we were able to achieve a compaction energy of 220 N·mm/mm3, which is less than half of that used in type A. Table 2 presents the specifications of the compaction test for compaction types A0, A, and C.
Figure 5 presents the compaction curves for soil samples obtained from Sites A, B, and C, tested with compaction types of A0, A, and C. The similarity in soil classification across all sites—as they are all categorized as SM or SC by the USCS—results in similar trends in their compaction curves, regardless of the compaction types used. The compaction curve of Site A (SM) is slightly lower than those of Sites B and C (SC) for compaction type A0, but they become similar for compaction types A and C. This uniformity in the compaction behavior of the soils from different sites reinforces the consistency of soil behavior between the SM and SC classifications. It also provides valuable insights into how such soils respond to various levels of compaction energy. The higher energy ends up with the higher γd,max and the lower wopt.

2.3.2. Soil Compaction Meter Test

The soil compaction meter test (SCT) is employed to measure the compaction level of the surface soil. This device operates by pushing a cone into the soil surface and measuring the spring displacement (dsct), which reflects the soil’s reaction stress. Figure 6 illustrates the SCT device and depicts the relationship between dsct and soil reaction stress. The reaction stress increases exponentially with dsct.
Although the SCT was originally designed to assess surface soil compaction for optimal crop growth [35,36], we adapted the SCT in our study to evaluate the compaction level by correlating it to the dry unit weight (γd) of the soil. The advantage of SCT is that it is easy to carry and perform, so the compaction level at the field can be easily achieved. In Figure 7, we present the results of SCT tests conducted for compacted samples of Sites A, B, and C, during three types of compaction tests (A0, A, and C), which are shown in Figure 5. Also, Table 3 shows the results (i.e., γd,max and wopt) of the compaction tests with types A0, A, and C with corresponding dsct at wopt (dsct,opt). The data show a direct relationship between the dsct,opt and the level of compaction. The compaction type C has the greatest dsct,opt similar to the case of γd,max. Note that the maximum dsct was shown at a water content lower than wopt. This might be due to the fact that the moisture in the soil reduces the shear strength.

2.3.3. Compaction Rate

The compaction rate (CR) is an important indicator of the degree of soil compaction of the soil in the field. The CR is calculated as the ratio of γd to γd,max, representing the relative compaction state of soil. The γd refers to the unit weight of the soil measured in the field, and γd,max represents the maximum dry unit weight that is achieved in the lab by compaction tests with a specific compaction type. In previous studies, the CR was used to represent the compaction level of soil [10,14,24,25,26,27]. Those studies commonly used compaction type A to estimate γd,max and decide the CR.
For the estimation of γd and eventually CR, field tests like the sand cone and balloon tests can be used. However, they are less practical for small areas and require time for the measurement of the volume of soil and moisture evaporation. In our study, we aimed to simplify this process by establishing a correlation model between γd and dsct. By conducting multiple compaction tests with varying energies (types A0, A, and C), we measured dsct alongside γd and water content (wc), as demonstrated in Figure 5 and Figure 7. These results indicated a relationship between γd, dsct, and wc, suggesting that γd could be effectively modeled using dsct and wc. The correlation model between γd, dsct, and wc is presented in the results section.

2.3.4. Soil Box

A soil box, sized at 400 mm × 400 mm with a depth of 800 mm, was used for pull-out tests. This box allows uniform soil compaction with controlled soil conditions. Figure 8 shows photos of the rammer, which was used to compact soil, and the soil box. We compacted soil from Sites B and C within the soil box with different compaction energies and performed rebar stake pull-out tests. The compaction method is as follows:
  • Rammer size: 200 mm × 200 mm;
  • Rammer weight: 95 N;
  • Drop height: 1190 mm;
  • Layer thickness: 2.5 cm to 5 cm;
  • Total soil height: 70 cm;
  • Number of blows: 1, 5, 10, and 15 per section (total 4 sections).
The compaction energy was controlled by the number of blows. After compaction, rebar stakes were vertically installed at 20 cm and 40 cm depths, and pull-out tests were performed.

2.3.5. Rebar Stake Pull-Out Test

The rebar stake pull-out test (RPT) involves applying a strain-controlled pull-out force to a rebar stake and measuring the force increment until the stake is extracted from the soil. This direct measurement of pull-out force provides the essential data for our analysis of rebar stake Rpull-out.
The RPT procedure is as follows:
  • Install a rebar stake into the soil at a predetermined embedded length;
  • After certain periods, apply a pull-out force to extract the stake with recording the force throughout the process.
Figure 9 shows a photograph of the RPT in action, along with a graph showing the relationship between the pull-out force and displacement. This test was conducted on Sites A, B, and C, as well as on the soil box.

2.3.6. Cone Penetration Test

The cone penetration test (CPT) is a method used to measure the resistance of soil against the penetration of a cone-shaped device [37]. This test offers valuable insights into the soil’s compactness and variation continuously. For our study, we repurposed the device used for the RPT by modifying it to exert force on the soil, as depicted in Figure 10. The device features a cone with a tip diameter of 25 mm (area = 491 mm2), which is pushed into the soil using a motor. A load cell (maximum capacity = 5000 N) is attached at the top of the rod to measure the tip resistance (qc). Although the sleeve friction was not measured, the larger diameter of the cone compared to the rod (rod diameter = 16 mm) and the relatively shallow penetration depth (less than 200 mm) suggest that the sleeve friction does not affect qc. The device is sufficiently weighted to enable penetration up to 1833 kPa reaction force.
Figure 10c shows the relationship between qc and penetration depth under varying soil conditions. For Site A, the qc increases with depth if no surface compaction is applied, while the maximum qc value occurs at a depth of 5 cm when the surface soil is compacted using the hand compactor. Nonetheless, soil with surface compaction is associated with increased qc. However, at Site B, a natural field, we noted that qc values were consistent in the range of 40 to 150 mm, beyond which an increasing trend was observed. From 40 to 140 mm depth, qc at Site B was lower than at Site A with the compacted condition using a compactor. However, at depths greater than 140 mm, Site B exhibited higher qc values. Note that in a particular test at Site B, we encountered a scenario where the cone could not penetrate beyond 40 mm and the qc reached as high as 2000 kPa. This unusually high resistance is indicative of significant subsurface heterogeneity, potentially due to the presence of gravel. This suggests that gravel within the soil can significantly influence penetration resistance, leading to higher qc values and measurement challenges.

3. Results

This section describes the results of the laboratory and field experiments. We first evaluated the correlation between dsct and compaction level and then evaluated the ultimate Rpull-out with respect to the compaction rate, rebar stake embedment depth, installation angle, and time.

3.1. Correlation Model for CR

The data shown in Figure 5 and Figure 7 indicate γd, dsct, and wc from the same compaction test. These data were utilized to develop the correlation model, as displayed in Figure 11. For the development of a regression function, we performed two-stage regressions: (1) we first fit a linear function to the subset of data with a narrow range of wc with respect to dsct, and (2) using the functional form of the logistic regression, the slope coefficient of the first regression is fitted with respect to the median wc at each subset. The resulting function regressed is as follows:
γ d = 0.17 1 + exp w c 11.5 0.78 + 0.11 × d s c t 40 + 20
where dsct is measured in mm, wc in %, and γd in kN/m3. The MSE of the regression is 0.288. With Equation (1), γd—and thus CR (equal to γdd,max)—can be computed if dsct and wc are known. This correlation provides a straightforward method to access CR, as SCT execution is simple: pushing a cone into the soil and measuring dsct. This model enables efficiently determining soil compaction levels, which is vital for predicting the Rpull-out of rebar stakes in various soil conditions.
While our correlation model (Equation (1)) effectively relates dsct to CR, it is important to note that its applicability is constrained to very shallow depths, limited to a maximum penetration depth of 40 mm by the SCT. This limitation becomes critical when considering that CR can vary significantly with depth, and measuring dsct at the surface may not accurately represent the CR at effective depths for estimating Rpull-out. Figure 12 presents the variation of qc from CPT, dsct, and wc at varying depths for Site A under compactor compaction conditions. By excavating soil at 5 cm intervals, we measured dsct at each depth and took soil samples for wc measurements. The results from different days illustrate how surface wc changes due to weather conditions, impacting dsct readings. On Day 1, four days after rainfall, the surface wc was high, leading to lower dsct values. Conversely, on Day 3, seven days after rainfall, as the surface dried, wc decreased and dsct increased. Note that the total amount of precipitation on the rainy day was 14.5 mm, and after that day, the weather condition was dried (sunny days). However, at a depth of 200 mm, the wc and the dsct values remained relatively constant across the different days. These observations indicate a crucial point; the embedment depth for greenhouse foundation reinforcement using rebar stakes is typically at least 40 cm. Hence, surface dsct measurements, which can vary significantly with surface water content, may not provide a reliable indicator for estimating Rpull-out at deeper, more relevant depths. The qc profiles corroborate this, showing convergence at around 20 cm depth despite variations at shallower depths.

3.2. Ultimate Pull-Out Resistance of Rebar Stake

3.2.1. Effect of Compaction Rate

We investigated the effect of CR on the Rpull-out of rebar stakes using a soil box uniformly compacted from bottom to top. The soil box underwent five distinct levels of compaction, achieved by applying 1, 5, 10, and 15 hammer drops per layer, as illustrated in Figure 8. For each level of soil preparation, we performed the SCT to measure dsct and wc. Table 4 presents the observed dsct, wc, the derived CR using Equation (1), and the corresponding Rpull-out of rebar stakes. We used rebar stakes with vertically embedded lengths of 20 cm and 40 cm and conducted RPTs on the same day.
Figure 13 shows the ultimate Rpull-out for rebar stakes at two different embedded lengths (20 cm and 40 cm), analyzed in relation to varying CRs. The data reveal a direct correlation between the increase in Rpull-out, CR, and embedded length. At a length of 20 cm, Rpull-out exhibited a linear increase with CR. However, for stakes with an embedded length of 40 cm, the increment ratio was higher compared to the 20 cm (except for CR between 80 and 90%), resulting in Rpull-out values exceeding 1000 N for CRs ranging from 90 to 100%. The significant disparity in Rpull-out between the two embedded lengths, with increases varying from 129% to 319% at each CR level, suggests varying levels of soil-stake adherence. Lower increments from 20 cm to 40 cm (e.g., 80–90% CR) imply a weaker adherence and hence only a minimal improvement in resistance. In contrast, the higher increases observed at 40 cm (e.g., 90–100% CR) indicate stronger adherence between the stake and the soil, suggesting that the stakes are more effectively anchored. This observation implies that additional measures, such as enhanced compaction after installation or tailored soil moisture management, could significantly augment the Rpull-out of rebar stakes.

3.2.2. Effect of Time

The Rpull-out of rebar stakes is significantly influenced by the bond between the stake surface and the surrounding soil, which develops over time. Post-installation, gaps may initially exist between the stake and the soil. However, repeated cycles of soil wetting and drying, often occurring due to weather changes, tighten this bond, leading to an increase in Rpull-out. Figure 14 illustrates how Rpull-out varies over time under different compaction levels: human weight and mechanical compactor at Site A.
Human Weight Compaction. The immediate Rpull-out, measured on the installation day, showed minimal difference between 20 cm (Rpull-out = 21 N) and 40 cm (Rpull-out = 24 N) embedded lengths. However, stakes installed 50 days prior exhibited a substantial increase in Rpull-out—72 N at 20 cm and 154 N at 40 cm lengths. This trend suggests an approximate 3.4-fold increase for 20 cm and a 6.4-fold increase for 40 cm compared to the initial test. The more significant increment at longer embedded length indicates that over time, the adherence between the rebar stake and soil fully develops.
Mechanical Compactor Compaction. For mechanically compacted sites, the immediate Rpull-out values were 176 N for 20 cm and 194 N for 40 cm depths. Stakes installed 30 days earlier showed increases to 277 N (20 cm) and 441 N (40 cm), corresponding to 1.5 and 2.3 times increases, respectively. Though these increments are lower than those observed with human weight compaction, the pattern of higher increases at greater lengths remains consistent.
These observations indicate the importance of early installation of rebar stakes for achieving enhanced Rpull-out. The longer the stakes are installed, the more pronounced the resistance becomes. This finding has significant implications for optimizing the installation timing of rebar stakes, suggesting that earlier installation and longer stakes can lead to stronger soil-stake adherence and improved Rpull-out.

3.2.3. Effect of Water Content

This section examines how variations in surface wc influence the Rpull-out of rebar stakes in field conditions. As established in Section 3.2.1, water within the soil tends to reduce soil cohesion and decrease its density, subsequently leading to a reduction in Rpull-out.
Figure 15 illustrates the relationship between fluctuations in wc and Rpull-out at embedded lengths of 20 cm and 40 cm across different sites. At Site A, under human weight compaction conditions, we observed that an increase in wc from 8.8% to 16.4% over 30 to 50 days, typically due to rainfall, significantly decreased Rpull-out. For stakes with an embedded length of 20 cm, the resistance dropped from 221 N to 72 N (a 67% reduction), and 40 cm length, from 273 N to 154 N (44% reduction). Conversely, at Sites B and C, which are naturally compacted, a decrease in wc from 14.4% to 8.2% over 30 to 90 days, attributed to drier weather, resulted in an increase in Rpull-out. The average Rpull-out for stakes of 20 cm embedded length increased from 160 N to 654 N (308% increase), and at 40 cm length, it increased from 242 N to 602 N (149% increase).
These findings demonstrate that Rpull-out is highly sensitive to changes in surface soil wc, particularly at shallower embedded lengths. The inconsistencies, such as higher resistance at 20 cm than 40 cm, might arise due to the uncertainties inherent in field testing. During typhoon conditions, which typically bring heavy rainfall, the surface wc can be increased significantly. Combining these observations with the results from Figure 12, it is evident that in wet conditions, longer rebar stakes are essential for maintaining adequate Rpull-out. This is because the increase in wc at deeper depths is minimal, allowing for higher shear strength in the deeper soil layers, which in turn secures the Rpull-out.

3.2.4. Effect of Inclination Angle

In this section, we assess the impact of installation and pull-out inclination angles (α and β) on the Rpull-out of rebar stakes. The tests, conducted at Site A with soil surface compacted using a compactor and stakes with embedded length of 40 cm, evaluated different installation angles (α: 0°, 20°, 40°) and pull-out directions (β: 0°, 10°), as depicted in Figure 16a. Figure 16b provides a typical greenhouse setup with stakes installed vertically (α = 0°) and inclined towards the greenhouse walls (β > 0°).
The RPTs were conducted at Site A with a consistent 40 cm embedded length on different days. Figure 17 shows variation in dsct and wc at each depth. The dsct ranged from 20 to 30 mm on Day 1 and 20 to 26 mm on Day 2, with wc between 10 and 21% and 14 and 19%, respectively, where surface wc at Day 1 was 10% and 14% at Day 2. Despite an increase in surface wc due to rain between those days, the deeper layers (e.g., 20 cm) showed minimal variation in dsct and wc, maintaining an average CR above 95% in the range of 0 to 20 cm depth. Comparing Day 1 and Day 2, Day 1, with a lower wc at surface, has a higher Rpull-out than one of Day 2 (Day 1: solid lines; Day 2: dotted lines in Figure 18).
Figure 18 presents the pull-out forces against displacements for each angle combination. The variation of Rpull-out is greater with changes in α and β than changes in wc. With α at 0°, the average Rpull-out was 196 N for β = 0° and 350 N for β = 10°. Increasing α to 20° resulted in average resistances of 653 N (β = 0°) and 962 N (β = 10°), indicating a substantial effect of the installation angle on resistance, with increases ranging from 2.5 to 3.5-fold compared to α = 0°. For α at 40°, with β at both 0° and 10°, the measured values were 847 N and 856 N, respectively, higher than α = 0° but similar to α = 20° cases. For α = 20° and 40° cases, the increase in β from 0° to 10° did not significantly alter Rpull-out.
These increases in Rpull-out for inclined installations can be attributed to the additional mechanism where the stake pushes against the soil, triggering passive soil failure. This phenomenon significantly enhances Rpull-out. Also, during our tests, we observed ductile fractures in rebar stakes under inclined conditions. Ductile fractures provide a form of safety prior to complete failure, allowing for early detection and preventive measures in greenhouse structures.

4. Discussion

4.1. Suggestion of Reba Stake Installation

Based on our analysis of factors influencing rebar stake Rpull-out, we propose the following guidelines for their optimal installation, particularly in greenhouse environments.
Compaction Level. Our findings demonstrate the significant role of soil compaction level in enhancing Rpull-out. Rpull-out at a CR of 90–100% relative to type A compaction (with γd,max of 18.1 kN/m3) was observed to be ten times higher than at 60–70% CR, particularly for rebar stakes with an embedded length of 40 cm. This increase highlights the importance of achieving a high CR for maximized Rpull-out. Additionally, surface compaction using mechanical compactors proved to be beneficial in forming a densely compacted soil layer approximately 5 cm deep. This compacted layer effectively reduces water infiltration into deeper layers [38], which is advantageous in minimizing the loss of Rpull-out during conditions of heavy rain. Given these observations, we recommend assessing dsct at a minimum depth of 5 cm, not surface. This is crucial because surface dsct readings can be highly variable due to weather conditions, whereas Rpull-out is more reliant on the compaction at deeper depths. If dsct readings exceed 20 mm at depth in wet conditions (wc > 16%), it can be inferred that the CR is above 90%, which we identify as the recommended condition for securing optimal Rpull-out.
Embedded Length. The Rpull-out with 40 cm embedded length has 2 to 3 folds of Rpull-out compared to the 20 cm embedded length in the case of vertical installation. Based on these findings, we recommend an embedded length of greater than 40 cm for rebar stakes. This recommendation is particularly pertinent considering heavy rainfall. During rainfall, the surface soil tends to become saturated, leading to a reduction in shear strength. However, for rebar stakes with greater embedded length, the impact of surface wetness is mitigated. As stated above, the filtration of water into the soil is reduced in deeper, especially compacted, soil layers. As a result, the reduction in Rpull-out due to rain conditions is limited. Therefore, a minimum embedded length of 40 cm not only enhances the Rpull-out under normal conditions but also ensures reliability and effectiveness during heavy rainfall.
Inclination Angles. The installation angle (α) and the angle of pull-out direction (β) greatly affect the Rpull-out. Rebar stakes installed with α = 20° have 2.5 to 3.5 folds higher Rpull-out compared to the α = 0° case, and the change in β = 0° to 10° increases Rpull-out by 150% at α = 0° case. We suggest an α of approximately 20° and a β > 0°. This configuration has been shown to maximize Rpull-out where the passive soil failure mechanism provides enhanced resistance.
Installation Time. Our findings indicate an increase in Rpull-out when there is sufficient time for the soil to bond with the rebar stake surface through wetting and drying cycles. Compared to immediate Rpull-out, the increment ratio of post-installation is in the range of 150% to 640%, depending on the embedded length and compaction level, where Rpull-out increased in all cases. Therefore, we advise installing rebar stakes at least one month before the strong wind season to take advantage of this bonding process.

4.2. Comparison of Pull-Out Resistance with Other Foundation Types

In this section, we compare the Rpull-out of rebar stakes to that of other foundation types, including rafter pipe, spiral steel peg, spiral bar, and continuous pipe foundations, as evaluated in previous studies [10,14,24,25]. Each foundation type is visually shown in Figure 19.
Figure 20a presents the Rpull-out of rebar stakes from this study at different installation angles (refer to Figure 18) alongside the Rpull-out of rafter pipe, spiral steel peg, and spiral bar from previous studies [10,14,25], which used sandy loam in soil box experiments. The embedded lengths in all other studies were consistent at 40 cm, and the installation and pull-out directions were vertical. Previous studies conducted similar experiments in sandy loam within a soil box measuring 800 mm × 1000 mm × 600 mm with 65, 75, and 85% CR. The wc used was wopt (=16.2%) at compaction, and they tested Rpull-out on the same day of installation. At an 85% CR, the Rpull-out of rafter pipes (diameter of 31.8 mm) was higher at 521 N compared to the vertical Rpull-out of rebar stakes (diameter of 13 mm), which was 226 N. However, when rebar stakes were installed at an angle (α) of 20° or more, their resistance increased to 962 N (Figure 18b). This indicates that the installation angle enhances the efficacy of rebar stakes. The Rpull-out for spiral steel pegs was found to be 1144 N, which is similar to the inclined rebar stake. The spiral bar, with a diameter of 50 mm, exhibited a significantly higher Rpull-out of 3359 N, about three times that of the rebar stake.
A further comparison was made with continuous pipe foundations composed of rafter pipes and crossbars (illustrated in Figure 19d), based on previous studies [24,25]. Similarly, these studies used wc in a range of 16.2% to 16.6%, and the immediate Rpull-out values were measured. Variations in Rpull-out were observed depending on the binder and compaction rate (Figure 20b). The steel wire binder at a 50 cm embedment depth yielded an Rpull-out of only 186 N, likely due to binder slippage before soil failure. Conversely, stronger binders against slippage like steel plates and U-clamps significantly increased the Rpull-out, with the U-clamp method at a 40 cm embedment depth reaching an Rpull-out of 2953 N. This Rpull-out is also about three times that of rebar stakes.
Table 5 summarizes the Rpull-out values for each foundation type from the various studies and this study. This comparative analysis highlights that continuous pipe foundations, as recommended by disaster-resistant criteria, offer higher Rpull-out values at the same embedment depth than other foundation types. Similarly, the spiral bar is also effective against uplift forces. If at least three rebar stakes were installed at a horizontal length of 800 mm, the Rpull-out would be comparable to one of a continuous pipe foundation. Note that the cost of reinforcing existing greenhouses with continuous pipe or spiral bar foundations is higher compared to installing rebar stakes.

5. Conclusions

This study evaluated the pull-out resistance of rebar stakes, commonly used for reinforcing the foundations of greenhouses not constructed following disaster-resistant standards. The evaluation was conducted considering various factors, such as compaction level, installation angle, time, and water content, through a combination of field and laboratory tests. The findings for enhancing the pull-out resistance of rebar stakes can be summarized as follows:
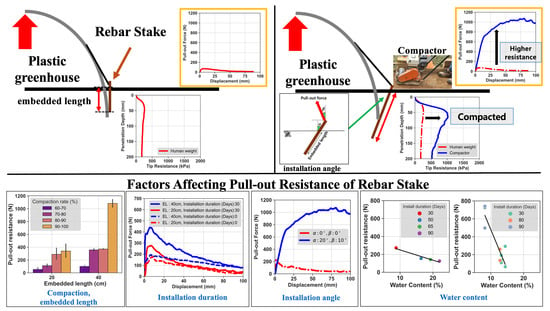
  • Both this study and previous studies indicate that soil compaction significantly impacts the pull-out resistance of greenhouse foundations. A higher compaction rate leads to increased pull-out resistance. The use of compactors to densify the surface layer of soil creates a compacted layer underneath, reducing water infiltration during heavy rainfall and minimizing the loss of pull-out resistance. Given the potential impact of soil moisture on pull-out resistance, an embedded length of at least 40 cm for rebar stakes is advised.
  • Post-installation, the pull-out resistance of rebar stakes increases over time. Weather-induced fluctuations in soil moisture content enhance the bond between the stake surface and the soil, thereby increasing the pull-out resistance. For optimal resistance, it is recommended to install rebar stakes at least a month ahead of the anticipated strong wind season.
  • This study highlights that the installation angle critically affects pull-out resistance. While vertical installations rely solely on the cohesion between the stake and soil during pull-out, inclined installations benefit from passive soil failure, increasing resistance. An installation angle (α) of 20° and a pull-out direction (β) exceeding 0° are suggested to effectively enhance the resistance.
  • Rebar stakes with a 40 cm embedded length, a compaction rate over 90%, and an α of 20° exhibited a pull-out resistance of around 1000 N. This resistance is greater than that of a single vertical rafter pipe and is similar to that of a spiral steel peg foundation. To match the performance of a 50 mm diameter spiral bar or an 800 mm length continuous pipe foundation, the installation of three appropriately positioned rebar stakes is necessary.
These conclusions highlight critical factors affecting rebar stake pull-out resistance and offer actionable guidelines for their optimal use in greenhouse foundations. The limitation of the test results in this study is that due to the heterogeneity of soil material and anisotropic field compaction level at each test location, the values of Rpull-out at each condition would be varied. However, the suggested Rpull-out of 1000 N with a longer than 40 cm embedded length, a compaction rate over 90%, and 20° inclination conditions is at the lower end, so it can be used as a design value. Future research directions include numerical simulations of rebar stake pull-out resistance, focusing on combination effects of factors and fine-tuning the optimal installation angle and stake length for maximum efficacy.

Author Contributions

Conceptualization, G.H., I.C., H.L., S.L. and D.K.; methodology, G.H., I.C. and D.K.; software, G.H.; validation, G.H., I.C. and J.L.; formal analysis, G.H.; investigation, G.H., I.C. and J.L.; resources, H.L. and S.L.; data curation, G.H. and I.C.; writing—original draft preparation, G.H. and D.K.; writing—review and editing, G.H., I.C., J.L., H.L., S.L. and D.K.; visualization, G.H.; supervision, D.K.; project administration, S.L.; funding acquisition, S.L. and D.K. All authors have read and agreed to the published version of the manuscript.

Funding

This research was funded by the Rural Development Administration, grant number RS-2021-RD009628, and the Basic Research Program through the National Research Foundation of Korea, grant number RS-2023-00220751.

Data Availability Statement

The data presented in this study are available on request from the corresponding author. The data are not publicly available due to privacy.

Conflicts of Interest

The authors declare no conflicts of interest. The funders had no role in the design of the study; in the collection, analyses, or interpretation of data; in the writing of the manuscript; or in the decision to publish the results.

References

  1. Uematsu, Y.; Takahashi, K. Collapse and reinforcement of pipe-framed greenhouse under static wind loading. J. Civ. Eng. Archit. 2020, 14, 583–594. [Google Scholar]
  2. Wang, C.; Nan, B.; Wang, T.; Bai, Y.; Li, Y. Wind pressure acting on greenhouses: A review. Int. J. Agric. Biol. Eng. 2021, 14, 1–8. [Google Scholar] [CrossRef]
  3. Jung, I.W.; Bae, D.H.; Kim, G. Recent trends of mean and extreme precipitation in Korea. Int. J. Climatol. 2011, 31, 359–370. [Google Scholar] [CrossRef]
  4. Kim, J.S.; Kang, H.W.; Son, C.Y.; Moon, Y.I. Spatial variations in typhoon activities and precipitation trends over the Korean Peninsula. J. Hydro-Environ. Res. 2016, 13, 144–151. [Google Scholar] [CrossRef]
  5. Ha, T.; Kim, J.; Cho, B.H.; Kim, D.J.; Jung, J.E.; Shin, S.H.; Kim, H. Finite element model updating of multi-span greenhouses based on ambient vibration measurements. Biosyst. Eng. 2017, 161, 145–156. [Google Scholar] [CrossRef]
  6. Yoon, Y.C.; Suh, W.M.; Yoon, C.S. A Study on the Typhoon Disaster of Greenhouse. J. Bio-Environ. Control 1995, 4, 167–174. (In Korean) [Google Scholar]
  7. Rural Development Administration (RDA). Symposium for Reducing of Meteorological Disasters of Agricultural Facilities; RDA: Suwon, Republic of Korea, 2007; pp. 160–161. (In Korean)
  8. Statistics Korea. Korean Statistical Information Service (KOSIS). Damage by Causes of Natural Disasters. 2023. Available online: https://kosis.kr/statHtml/statHtml.do?orgId=110&tblId=DT_156003_014&vw_cd=MT_ZTITLE&list_id=C_21 (accessed on 6 January 2023). (In Korean).
  9. Ministry of Agriculture, Food and Rural Affairs (MAFRA). Design and Specifications of Standardized Anti-Disaster Prototypes for Greenhouses; Specification 2014–2078; MAFRA: Sejong, Republic of Korea, 2014. (In Korean)
  10. Choi, M.K.; Yun, S.W.; Kim, H.N.; Lee, S.Y.; Kang, D.H.; Yoon, Y.C. Uplift capacity of spiral bar through the model experiment. J. Bio-Environ. Control 2015, 24, 202–209. (In Korean) [Google Scholar] [CrossRef]
  11. Fernández-García, M.S.; Vidal-López, P.; Rodríguez-Robles, D.; Villar-García, J.R.; Agujetas, R. Numerical simulation of multi-span greenhouse structures. Agriculture 2020, 10, 499. [Google Scholar] [CrossRef]
  12. Kim, M.H. Effects of Uplift Resistance on Continuous-Pipe-Foundation of Single-Span Plastic Greenhouse by Steel Plate Pipe Connector. Agriculture 2022, 12, 1998. [Google Scholar] [CrossRef]
  13. Kim, M.H.; Song, C.M. Deep Neural Network Analysis on Uplift Resistance of Plastic Greenhouses for Sustainable Agriculture. Sustainability 2023, 15, 5632. [Google Scholar] [CrossRef]
  14. Lee, B.G.; Yun, S.W.; Choi, M.K.; Lee, S.Y.; Moon, S.D.; Yu, C.; Yoon, Y.C. Uplift bearing capacity of spiral steel peg for the single span greenhouse. J. Bio-Environ. Control 2014, 23, 109–115. (In Korean) [Google Scholar] [CrossRef]
  15. Lee, S.I.; Lee, J.H.; Jeong, Y.J.; Choi, W. Development of a structural analysis model for pipe structures to reflect ground conditions. Biosyst. Eng. 2020, 197, 231–244. [Google Scholar] [CrossRef]
  16. Lee, W.G.; Woo, J.H.; Lee, H.D.; Shin, K.J. Analysis of Uplift Capacity on Single-span Greenhouse’s Foundation According to Wind Load and Evaluation for Reinforcing Methods. J. Reg. Assoc. Archit. Inst. Korea 2022, 24, 33–39. (In Korean) [Google Scholar]
  17. Pack, M.; Mehta, K. Design of affordable greenhouses for East Africa. In Proceedings of the 2012 IEEE Global Humanitarian Technology Conference, Seattle, WA, USA, 21–24 October 2012; pp. 104–110. [Google Scholar]
  18. Peña, A.; Valera, D.; Pérez, F.; Ayuso, J.; Pérez, J. Behavior of greenhouse foundations subjected to uplift loads. Trans. ASAE 2004, 47, 1651–1657. [Google Scholar] [CrossRef]
  19. Peña, A.A.; Martínez, D.L.V.; Alonso, J.P. Estimate of the Load Capacity to Traction of Foundations for Greenhouses. In Proceedings of the 2002 ASAE Annual Meeting, Chicago, IL, USA, 28–31 July 2002; p. 024011. [Google Scholar]
  20. Tsai, M.-H.; Lee, Y.-C. Practical Structural Design and Construction of an Innovative Composite Plastic Greenhouse. Agriculture 2021, 11, 1051. [Google Scholar] [CrossRef]
  21. Von Elsner, B.; Briassoulis, D.; Waaijenberg, D.; Mistriotis, A.; Von Zabeltitz, C.; Gratraud, J.; Russo, G.; Suay-Cortes, R. Review of structural and functional characteristics of greenhouses in European Union countries: Part I, design requirements. J. Agric. Eng. Res. 2000, 75, 1–16. [Google Scholar] [CrossRef]
  22. Yun, S.W.; Choi, M.K.; Yu, C.; Lee, S.Y.; Yoon, Y.C. Analysis of Working Load based on Wind and Snow Load for Greenhouse Foundation. J. Agric. Life Sci. 2014, 48, 183–188. [Google Scholar] [CrossRef]
  23. Yun, S.W.; Shin, Y.S.; Yu, C.; Yoon, Y.C. Analysis of working load on greenhouse foundation considering wind and snow load. Acta Hortic. 2014, 1037, 99–104. [Google Scholar] [CrossRef]
  24. Yun, S.Y.; Choi, M.K.; Lee, Y.S.; Yoon, Y.C. Uplift Capacity of Continuous Pipe Foundation for Prevention of Meteorological Disaster. J. Agric. Life Sci. 2015, 49, 303–310. (In Korean) [Google Scholar] [CrossRef]
  25. Choi, M.K.; Yun, S.W.; Kim, H.N.; Lee, S.Y.; Yu, C.; Yoon, Y.C. Uplift capacity of pipe foundation for single-span greenhouse. J. Bio-Environ. Control 2015, 24, 69–78. (In Korean) [Google Scholar] [CrossRef]
  26. Lim, S.Y.; Kim, Y.Y.; Yu, S.C.; Kim, M.H. Characteristics of uplift capacity of a embedded foundation and soil type. J. Korean Soc. Agric. Eng. 2019, 61, 23–30. (In Korean) [Google Scholar]
  27. Song, C.S.; Jang, U.H.; Choi, D.H.; Kim, J.C. Characteristics of uplift capacity of house pipe foundation according to foundation types and soil conditions. J. Korean Soc. Agric. Eng. 2020, 62, 117–126. (In Korean) [Google Scholar]
  28. Korean Soil Information System (KSIS). Categorization of Agricultural Soil by Type in Republic of Korea, KSIS. Available online: http://soil.rda.go.kr/geoweb/soilmain.do (accessed on 6 January 2023). (In Korean)
  29. United States Department of Agriculture (USDA). Soil Taxonomy: A Basic System of Soil Classification for Making and Interpreting Soil Surveys; Agriculture handbook Number 436; United States Department of Agriculture Natural Resources Conservation Service: Washington, DC, USA, 1999; 869p.
  30. Casagrande, A. Classification and identification of soils. Trans. Am. Soc. Civ. Eng. 1948, 113, 901–930. [Google Scholar] [CrossRef]
  31. Ahn, B.K.; Lee, J.H.; Kim, K.C.; Kim, H.G.; Jeong, S.S.; Jeon, H.-W.; Zhang, Y.-S. Changes in chemical properties of paddy field soils as influenced by regional topography in Jeonbuk Province. Korean J. Soil Sci. Fertil. 2012, 45, 393–398. (In Korean) [Google Scholar] [CrossRef]
  32. Choi, I.H.; Heo, G.S.; Lee, J.Y.; Kwak, D.Y. Prediction of Pull-Out Force of Steel Pegs Using the Relationship Between Degree of Compaction and Hardness of Soil Conditioned on Water Content. J. Korean Geotech. Soc. 2023, 39, 23–35. (In Korean) [Google Scholar]
  33. ASTM D4318-17; Standard Test Methods for Liquid Limit, Plastic Limit, and Plasticity Index of Soils. ASTM: West Conshohocken, PA, USA, 2018.
  34. KS F 2312; Test Method for Soil Compaction in Laboratory. Korea Industrial Standards Commission: Seongnam, Republic of Korea, 2011. (In Korean)
  35. de Moraes, M.T.; da Silva, V.R.; Zwirtes, A.L.; Carlesso, R. Use of penetrometers in agriculture: A review. Eng. Agrícola 2014, 34, 179–193. [Google Scholar] [CrossRef]
  36. Nakayama, Y. Theory and practice of a soil hardness tester YH-62. In Penetration Testing; Routledge: Abingdon, UK, 2021; Volume 1, pp. 303–308. [Google Scholar]
  37. KS F 2592; Standard Test Method for Electronic Cone Penetration of Soils. Korea Industrial Standards Commission: Seongnam, Republic of Korea, 2014. (In Korean)
  38. Tekeste, M.Z.; Raper, R.L.; Schwab, E.B. Soil drying effects on soil strength and depth of hardpan layers as determined from cone index data. Agric. Eng. Int. CIGR J. 2008, X, 1–17. [Google Scholar]
Figure 1. (a) Distribution map of surface soil type per classification in South Korea and locations of sites [32] and (b) proportion of surface soil type covering entire country.
Horticulturae 10 00277 g001
Figure 2. Site preparation process of Site A includes (a) installation of a soil box, (b) initial soil compaction using human weight, and (c) application of a hand compactor after testing under initial compaction condition.
Horticulturae 10 00277 g002
Figure 3. Field view of (a) Site B and (b) Site C.
Horticulturae 10 00277 g003
Figure 4. Grain size distributions of samples from the source site (Site A) and field test sites (Sites B and C).
Horticulturae 10 00277 g004
Figure 5. Compaction curves with compaction types of (a) A0, (b) A, and (c) C for soil samples from Sites A, B, and C.
Horticulturae 10 00277 g005
Figure 6. Soil compaction meter. (a) Photo [32]; (b) spring displacement versus soil reaction stress.
Horticulturae 10 00277 g006
Figure 7. Spring displacement (dsct) of soil compaction meter versus water content for soil samples from compaction types of (a) A0, (b) A, and (c) C.
Horticulturae 10 00277 g007
Figure 8. Photos of soil box test: (a) compaction rammer [32] and (b) soil box.
Horticulturae 10 00277 g008
Figure 9. Rebar stake pull-out test. (a) Photo; (b) example of the measurement of pull-out force versus pull-out displacement.
Horticulturae 10 00277 g009
Figure 10. (a) Schematic drawing and (b) photo of portable cone penetrometer developed in this study. (c) Tip resistances at Site A with varying field compaction levels (human weight and compactor) and at Site B (field).
Horticulturae 10 00277 g010
Figure 11. Relationship of dry unit weight to spring displacement dependent on water content. Correlation models are shown as solid lines.
Horticulturae 10 00277 g011
Figure 12. (a) Water content, (b) spring displacement of soil compaction meter, and (c) tip resistance of cone penetration test, showing the variations at each depth according to climatic changes at Site A.
Horticulturae 10 00277 g012
Figure 13. Ultimate pull-out resistance of rebar stakes with varying compaction rates and embedded lengths. (a) Scatter plot for pull-out resistance versus compaction rate and (b) bar chart for pull-out resistance versus embedded length.
Horticulturae 10 00277 g013
Figure 14. Pull-out resistance with different installation period (IP) and embedment depth (ED) at Site A by different compaction levels: (a) human weight and (b) compactor.
Horticulturae 10 00277 g014
Figure 15. Ultimate pull-out resistance of rebar stakes with different embedded lengths versus variation of water contents over time. Site A with human weight compaction, (a) 20 cm depth, and (b) 40 cm depth. Sites B and C with natural compaction, (c) 20 cm depth, and (d) 40 cm depth.
Horticulturae 10 00277 g015
Figure 16. (a) Description of inclination angles of installation (α) and pull-out direction (β) and (b) photos of field installation conditions.
Horticulturae 10 00277 g016
Figure 17. Variation in (a) spring displacement and (b) water content at Site A.
Horticulturae 10 00277 g017
Figure 18. Pull-out forces versus displacements with different installation inclinations angles (α): (a) 0 degree, (b) 20 degrees, and (c) 40 degrees with 0 and 10 degrees of pull-out direction inclination angles (β).
Horticulturae 10 00277 g018
Figure 19. Examples of (a) rafter pipe, (b) spiral steel peg, (c) spiral bar, and (d) continuous pipe foundation.
Horticulturae 10 00277 g019
Figure 20. Comparison of pull-out resistance among (a) non-continuous pipe foundations and (b) continuous pipe foundations among this study and previous studies (Choi et al. [10] as C15A, Choi et al. [25] as C15B, Lee et al. [14] as L14, and Yun et al. [24] as Y15).
Horticulturae 10 00277 g020
Table 1. Soil properties from the source site (Site A) and field test sites (Site B and C).
Sitew (%)PL (%)LL (%)PI (%)USDAUSCS
Site A-27358LoamSM
Site B12.8–14.4183214LoamSC
Site C8.2–13.2143218Sandy LoamSC
Table 2. Compaction test specification of A0 proposed in this study and A and C types following the South Korea standard [34].
TypeEnergy
(N·mm/mm3)
Hammer Weight (kg)Drop Height (cm)Blow per LayerNumber of Layers
A02202.530152
A5502.530253
C25004.545255
Table 3. Maximum dry unit weight and spring displacement per A0, A, and C type compaction tests.
TypeMaximum Dry Unit Weight, γd-max
(kN/m3)
wopt (%)Spring Displacement at wopt, dsct,opt (mm)Compaction Rate with Respect to Type A (%)
A017.115.42294.5
A18.113.126100
C19.210.433106.1
Table 4. Pull-out resistances with different compaction levels using soil box tests.
Embedded Length (cm)Hammer Dropsdsct (mm)wc (%)Compaction Rate (%)Pull-Out Resistance (N)
2019.936453
518.24.877112
10234.384289
1528.87.594340
4017360100
519.14.778359
10254.187373
1529.38951084
Table 5. The Rpull-out values for each foundation type from various studies.
TypeReferenceFoundationwc (%)Compaction RatePull-Out Resistance (N)
30 cm40 cm50 cm
Non-continuous pipe foundationChoi et al. [10] (C15A)Spiral bar16.265%-53-
75%-563-
85%-3359-
Lee et al. [14] (L14)Spiral steel peg16.265%-43-
75%-396-
85%-1144-
Choi et al. [25] (C15B)Rafter pipe16.265%-20-
75%-216-
85%-521-
This studyRebar stake13.190–100%-196 (α = 0°, β = 0°)-
-341 (α = 0°, β = 10°)-
-653 (α = 20°, β = 0°)-
-962 (α = 20°, β = 10°)-
-847 (α = 40°, β = 0°)-
-860 (α = 40°, β = 10°)-
Continuous pipe foundationYun et al. [24] (Y15)Steel wire16.685%--186
Steel plate85%--1601
U-clamp85%--3303
Choi et al. [25] (C15B)U-clamp16.265%177384582
75%92917882729
85%102229534413
Disclaimer/Publisher’s Note: The statements, opinions and data contained in all publications are solely those of the individual author(s) and contributor(s) and not of MDPI and/or the editor(s). MDPI and/or the editor(s) disclaim responsibility for any injury to people or property resulting from any ideas, methods, instructions or products referred to in the content.

