Aerated Irrigation and Pruning Residue Biochar on N2O Emission, Yield and Ion Uptake of Komatsuna


1
Institute for Agro-Environmental Science, National Agriculture and Food Research Organization, 3-1-3 Kannondai Tsukuba, Ibaraki 305-8604, Japan
2
Central Regional Agricultural Research Center, National Agriculture and Food Research Organization, Kannondai 2-1-18, Tsukuba 305-8666, Japan
3
Horticultural Institute, Ibaraki Agricultural Center, 3165-1, Kasama, Ibaraki 319-0292, Japan
*
Authors to whom correspondence should be addressed.
†
Current Address: Natural Science Research Unit, Tokyo Gakugei University, Koganei, Tokyo 184-8501, Japan.
Horticulturae 2018, 4(4), 33; https://doi.org/10.3390/horticulturae4040033
Submission received: 2 September 2018
/
Revised: 9 October 2018
/
Accepted: 12 October 2018
/
Published: 15 October 2018
(This article belongs to the Special Issue Water Management of Horticultural Crops)
Abstract
:After irrigation in intensive vegetable cultivation, the soil is filled with water leading to reduced oxygen content of the soil air which will affect vegetable growth and soil N2O emission. In this study, the effect of aerated irrigation and residue biochar on soil N2O emission, yield, and ion uptake of komatsuna grown in Andosol was explored. The experiment included four treatments; control (tap water irrigation), aerated water irrigation, pruning residue biochar with tap water irrigation, and a combination of aerated irrigation and biochar. The results showed that aerated irrigation had no effect on plant growth, but it also increased N2O emission by 12.3% for several days after planting. Plant ion uptake was not affected by aerated irrigation. Biochar amendment increased shoot dry weight and significantly reduced soil N2O emission by 27.9% compared with the control. Plant uptake of N and K also increased with biochar. This study showed that pruning residue biochar has the potential to mitigate N2O emission while increasing vegetable growth and plant nutrient uptake. However, the study soil, Andosol, already has high soil porosity with low bulk density. Thus, further injection of air through irrigation showed no effect on plant growth but increased N2O emission, hence soil aeration was not a limiting factor in Andosol.
1. Introduction
Nitrous oxide (N2O) is a potent and long-lived atmospheric greenhouse gas and the single most important ozone-depleting compound emitted to the atmosphere [1]. Moreover, it has a global warming potential 296 times stronger than CO2 [2]. Due to widespread use of synthetic nitrogen fertilizer, agricultural soil is the single largest source of global anthropogenic N2O emission [3] and therefore, contributes significantly to increase N2O concentrations in the atmosphere [4]. Hence, it is important to reduce soil N2O emissions induced by N fertilizer to help mitigate anthropogenic contributions to global warming and ozone depletion.
Currently, research on N2O emissions from agricultural soil are mostly focused on field crops and little has been reported from the soils of vegetable crops [5], especially in Asia. Intensive vegetable cultivation is likely to use a high N fertilizer with a high cropping index, which is considered to be an important source of N2O [6]. Moreover, constant irrigation of vegetable crops influenced organic matter decomposition, microbial biomass and activity, root biomass, soil aeration and nitrogen turnover, which in turn influence soil N2O production [7,8]. Irrigation increases the soil water content surrounding the roots, reducing air-filled porosity. The root zone of the crop remains nearly saturated during and for some time after irrigation events, reducing availability and mobility of oxygen that remains trapped in soil pores, resulting in poor soil aeration in the crop root-zone during and following irrigation events [9,10]. To solve soil O2 deficiency, aerated irrigation has been proposed as an effective tool to mitigate hypoxia in the crop root zone [11]. Aerating the soil through irrigation can affect crop growth and soil microbial activity [12,13]. Chen et al. [12] reported that aerating irrigation improved the growing environment in the root zone, promoting plant growth and thus increasing production and quality. The change of O2 content in soil caused by aerating irrigation must inevitably affect the production and emissions of soil N2O [5]. Due to its effect on O2 diffusion, water filled pore space regulates the proportion of N2O emission from nitrification and denitrification [14]. Machefert et al. [14] discussed that emission of NO should dominate in soils with good oxygen supply while N2O may be the main product in moderately aerated soils. However, there is still limited information on the effect of aerated irrigation on soil N2O emissions from vegetable soils.
Recently, biochar has received attention for possible use in agricultural soils. Conversion of crop residue into biochar and its application in soil as a soil amendment is a novel approach as a soil improver, as well as for carbon sequestration, improved soil fertility and crop production [15] and decreased greenhouse gas emission [16,17,18,19]. However, no difference or even an increase in soil N2O emissions after biochar application was observed in other studies [20,21]. This was likely due to the variation in the physical and chemical characteristics of the different biochars, soil types and crop species [22,23]. In this study, biochar fabricated from pruning residues of orchards by the specific carbonization method (open burn kiln) was used to study its effect on vegetable growth and N2O emission from volcanic ash soil.
Komatsuna (Brassica rapa var. perviridis) is a popular leafy vegetable grown in Japan. It requires the application of a high level of N fertilizers within a short growth cycle, contributing to N2O emission to the atmosphere [24,25]. It is essential to investigate effective mitigation options of soil N2O emission during intensive vegetable cropping while increasing vegetable yield under different management practices. In this study, a pot experiment was conducted to investigate the effects of soil aeration and/or biochar amendment on soil N2O emission and yield of komatsuna. The objectives of this study were to (1) evaluate the effect of air nano-bubble water irrigation and biochar amendment on N2O emissions during komatsuna growth and (2) to study their effects on soil properties, growth, and ion uptake of komatsuna. In this study, Andosol from volcanic ash, the most common arable soil in Japan, about 82% of vegetables are grown on Andosol in Ibaraki prefecture alone, was used.
2. Materials and Methods
A pot experiment was carried out at the Institute for Agro-Environmental Sciences, National Agriculture and Food Research Organization, Tsukuba, Ibaraki, Japan. The soil used in this study was collected in February 2018 from an upland field at the Horticultural Research Institute of the Agricultural Research Center in Ibaraki Prefecture, Ibaraki, Japan. The soil was classified as an Andosol, and soil properties are shown in Table 1. Biochar used in this study was produced from carbonization of pruning residues of the Japanese nashi pear tree under an open fire using an open burn kiln [18]. The biochar had a pH (H2O) of 10.3, 5.7 g kg−1 total N, 374 g kg−1 total C, a surface area (Brunauer–Emmett–Teller Method) of 65.6 m2 g−1, 9.8% ash, 9.7% volatile matter, and 80.5% fixed C [18].
Four treatments were assigned in a completely randomized design with three replications. The treatments were (1) control (no biochar amendment with tap water irrigation), (2) aerated water irrigation with nano-bubbles (AI), (3) pruning residue biochar with tap water irrigation (BC), and (4) a combination of AI and BC (AI + BC). The air nano-bubble water for aerated irrigation was generated using a commercially available nano-bubble generator that employs a two-phase flow swirling method (compact bubble generator manufactured by AQUAAIR Co., Ltd., Tokyo, Japan). Air was injected continuously for 30 min six times a day [26]. Fresh aerated water was immediately used for daily irrigation. The DO and pH value of air nano-bubble water were 8.04 mg L−1 and 7.13 while those of tap water were 7.78 mg L−1 and 7.32, respectively.
The biochar application rate was 60 g pot−1 which was equivalent to 30 t ha−1. For all treatments, N (urea), P (superphosphate), and K (muriate of potash) fertilizers were applied at the same rate of 120 kg ha−1. All pots (1/5000 a Wenger pot, height 20 cm, and diameter 16 cm) were filled with about 3 kg of soil. All pots were placed on the ground under open-field conditions. To avoid precipitation, the pots were transferred to a greenhouse during rainfall events. Biochar and fertilizer were applied as a single dose and thoroughly mixed with top soil (0–15 cm soil layer) prior to seedling transplanting. Seeds of komatsuna were sown in plug trays in the greenhouse. Seedling emergence started four days after planting. One seedling of komatsuna (14-days old) was transplanted to each pot on 9 April 2018. The water content in the pots was maintained similarly for all treatments throughout the growing season. Irrigation was performed with the same amount of nano-bubble water or tap water three times per week to avoid soil surface drying. Komatsuna were harvested once they reached marketable size on 11 May 2018.
A closed chamber method was used to determine the N2O flux from each pot. At the time of sampling, the pots were covered with a small chamber and gas samples were collected at 0, 10, and 20 min from the time the chambers were deployed. The chamber deployment duration was set according to Parkin and Venterea [27] and Rochette [28]. The sample gasses were then transferred to 15-mL vacuum glass vials with rubber stoppers. The collected air samples were analyzed for N2O concentrations using a gas chromatograph (GC 2014, Shimadzu Corporation, Kyoto, Japan) equipped with an electron capture detector (ECD). The N2O fluxes were calculated from the temporal increase of the gas concentration inside the chamber per unit time. Cumulative emissions of soil N2O were calculated by multiplying the daily fluxes at each measurement for the time interval and then by summing up the obtained values.
Soil temperature at a depth of 10 cm was recorded at the time of air sampling. At harvest, shoot length and shoot weight were recorded. Top soil samples were collected after harvest of komatsuna for each pot to analyze soil pH, total N and C content. Total N and C contents were analyzed by a NC analyzer ((Sumigraph NC-80; Sumika Chemical Analysis Service Co., Tokyo, Japan). The soil pH was determined in the supernatant suspension of 1:5 soil: water solution using a pH meter (FiveEasy, FE20, Mettler Toledo, Tokyo, Japan). N uptake (mg pot−1) was calculated using the equation: N uptake (mg pot−1) = dry matter weight (mg pot−1) × N content of shoot dry matter (%). Bulk density (0–5 cm soil depth) was determined by the core method using a sample ring of 5 cm3.
Soil porosity was calculated after analyzing soil samples using a Three Phase Meter, DIK 1120 (Daiki Rika Kogyo, Tokyo, Japan). For the quantification of ion content in the shoots, dried samples (0.2 g) were digested in concentrated nitric acid (HNO3), and volumes made up to 10 mL with mili-Q water. Mineral element analysis of plant extracts was determined by atomic absorption spectrophotometer (Shimaszu AA-6300, Tokyo, Japan) and UV–Vis spectrophotometer (Shimadzu UV-1800, Tokyo, Japan).
The data collected were analyzed by analysis of variance (ANOVA) using CropStat 7.2 statistical software program (International Rice Research Institute, IRRI, Philippines). Treatment means were compared using the least significant difference (LSD) test at P ≤ 5%.
3. Results
3.1. Soil Properties and Soil Temperature Changes
Soil pH showed significant differences among the treatments after harvest of komatsuna (Table 2). Aerated irrigation and biochar, either alone or combined, showed significant increases in soil pH compared with control. However, the highest soil pH values were observed in treatments containing biochar. Soil pH increased by 0.22, 0.58, and 0.71 unit for AI, BC, and AI + BC treatments compared with control. There was no significant difference in soil total N content with aerated irrigation and/or biochar amendment (Table 2). The mean soil total N contents were 4.66, 4.82, 5.10, and 5.34 g kg−1 soil for control, AI, BC, and AI + BC, respectively. Soil total C content showed significant differences among the treatments (Table 2). Biochar with or without AI significantly increased total C by 72–79% compared with control soil. On the other hand, no difference in soil total C was observed between AI treatment and control soil. The soil C: N ratio was significantly affected by biochar amendment. High soil C: N ratios were observed in BC and AI + BC treatments compared with control. BC amendment decreased soil bulk density and increased soil porosity, because biochar itself had a much lower bulk density and higher porosity.
Soil temperature was low at the beginning of the growing period and subsequently increased (Figure 1). A large increase in soil temperature at nine days after transplanting was associated with warm air temperatures on that day. After that period, soil temperature fluctuated through 25 days and then declined until the end of the growing period.
3.2. N2O Emissions
Soil N2O emissions dramatically increased due to the application of N fertilizer, and the highest emissions occurred at nine days after transplanting of komatsuna (Figure 2). Then, a sharp decrease in soil N2O emission was observed from 9 to 14 days, after which emissions remained steady with only small variation until the end of the growing period. Aerated irrigation showed the highest emission peak followed by the control and the lowest peak was observed in biochar treatment.
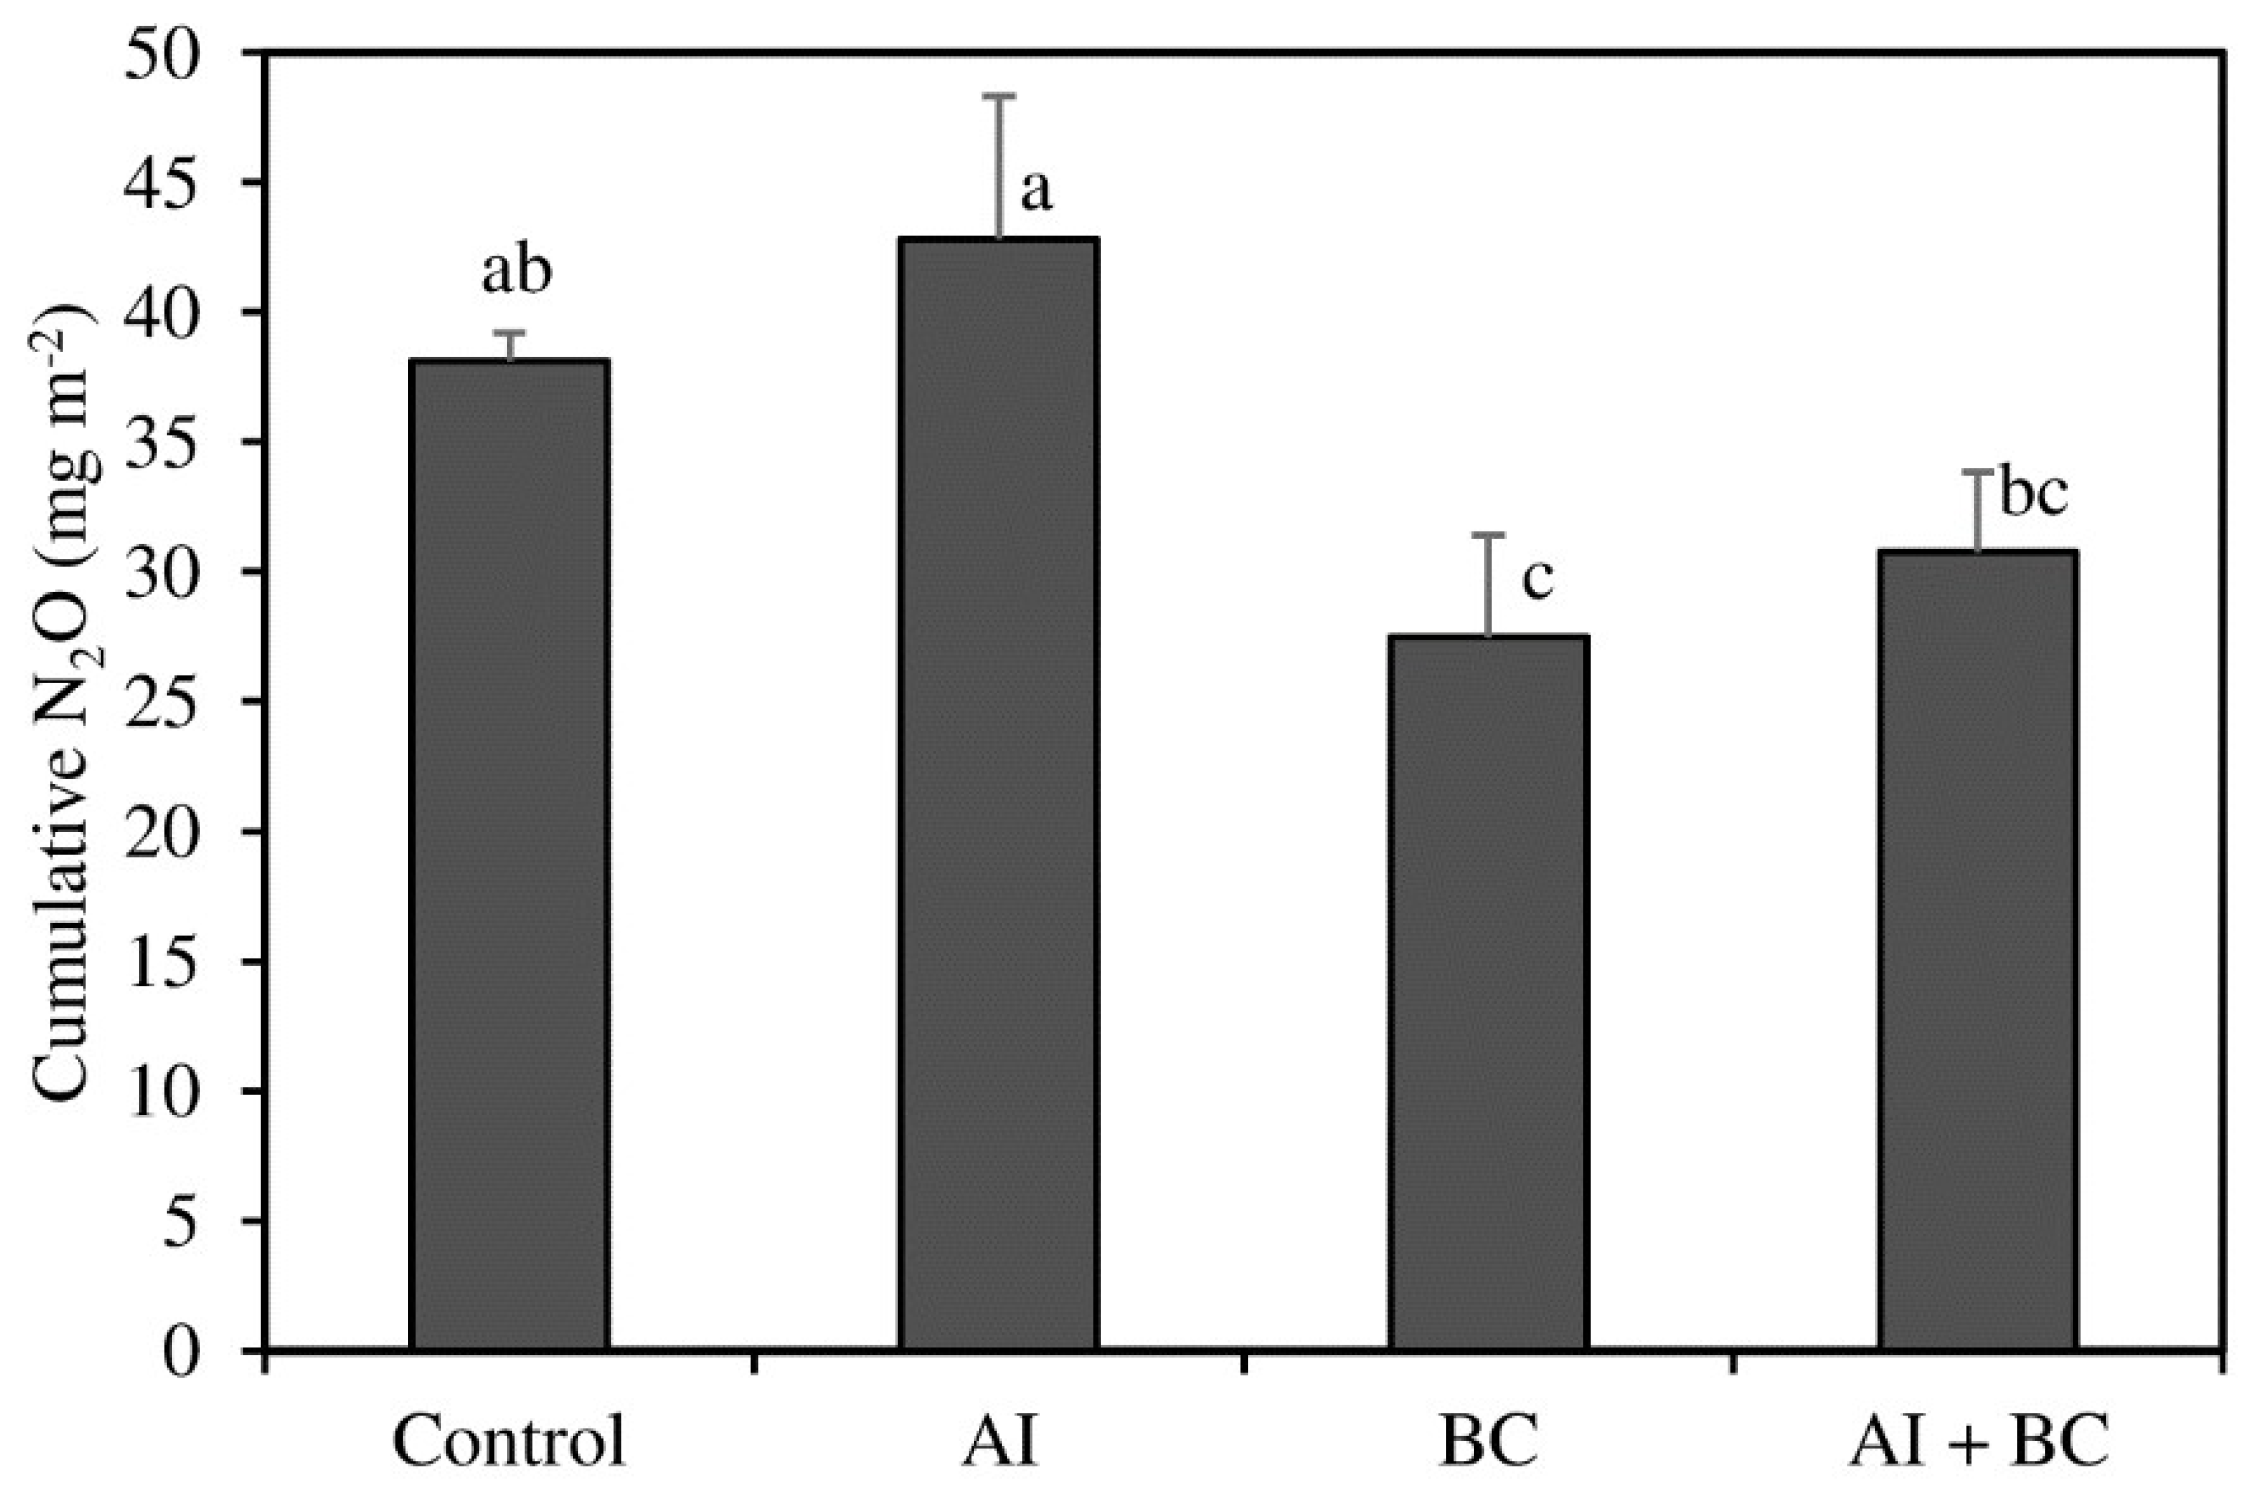
A significant (P < 0.05) difference in cumulative N2O emission was observed among the treatments (Figure 3). Cumulative N2O emission for control, AI, BC, and AI + BC were 38.1, 42.8, 27.5, and 30.7 mg m−2, respectively. Biochar amendment was the only treatment that significantly affected N2O emission, decreasing it by 27.9%.
3.3. Growth and Yield of Komatsuna
There were significant differences among the treatments in the shoot growth parameters of komatsuma at harvest (Table 3). AI treatment showed a lower shoot length and shoot fresh and dry weight compared with BC treatment, but neither differed from the control or AI + BC.
3.4. Ion Concentration and Uptake of Komatsuna
There were no significant treatment effects on shoot N, P, and Mg (Table 4). Shoot K and Ca contents were not affected by AI, but BC showed a higher shoot K content than control. Higher shoot Ca content was observed in the control compared with BC and AI + BC treatments.
N, P, K, and Mg uptake by komatsuna were not affected by AI treatment (Table 5). However, higher N and K, and lower Ca, uptake by komatsuna was observed for BC. A significantly lower Ca uptake was also observed for AI treatment compared with the control, and AI + BC Ca uptake was significantly lower than AI and BC alone.
4. Discussion
4.1. Aerated Irrigation and Biochar on Yield and Ion Uptake of Komatsuna
The AI treatment had no effect on shoot fresh and dry weight of komatsuna compared with control (Table 3), though means were slightly lower than controls. Our results suggest that soil aeration was not a limiting factor for plant growth with Andosol which is known to exhibit high porosity and low bulk density (Table 2). Therefore, hypoxic stress (situations in which the oxygen concentration is a limiting factor) might not occur in this soil and further injection of air into the soil through irrigation showed no effect on plant growth. This result differed with the study of Ahmed et al. [29], who observed that air nano-bubbled into water not only had a negative effect on tomato growth also appeared to slow down the growth rates of the hypocotyl length compared to tap water. Li et al. [30] reported that, once aeration had eliminated hypoxic stress, more air injected resulted in a reduction in root to soil contact which had a negative effect on the rhizosphere, and decreased tomato fruit yields. In this study, we injected nanobubbles into the soil through irrigation which had long-term stability in water (e.g., up to 70 days according to Ushikubo et al. [31]). Due to high stability of nanobubbles and high aeration in AI-treatments, there might have been a reduction in root to soil contact according to Li et al. [30]. Du et al. [32] reported that high N application under aerated irrigation caused exorbitant plant N uptake which, combined with vigorous leaf transpiration, resulted in large water and nitrogen losses, thus reducing celery yield. In this study, only slightly higher N uptake was observed in the AI treatment. Biomass reduction might also be due to high nitrogen losses by increasing soil microbial abundance and enzyme activity under aerated irrigation [32].
Other studies have reported that oxygenation significantly improved crop yield compared with traditional irrigation [9,12]. Addition of hydrogen peroxide to irrigation water released oxygen to the root zone soil. It affected above ground biomass and increased in root mass, root length and soil respiration, and also enhanced water use efficiency for pod and lint yield as well as increased leaf photosynthetic rate [11].
In hydroponic culture, microbubbles have proven to facilitate the growth of lettuce [33] while nanobubbles were shown to enhance the growth of plants by improving the oxygen supply as nutrient elements [34]. Chen et al. [12] suggested that the benefits of oxygenation were notable not only for dicotyledonous cotton but also for monocotyledonous wheat and pineapple grown in red soil and black cracking clay soil. Carter et al. [35] and Czyz [36] reported that insufficient oxygenation of compacted soil may limit the development of root systems, plant growth and crop yield. Li et al. [30] observed that increasing aeration volume resulted in higher total fresh tomato fruit yield at 40 cm irrigation line depth, but under the 15 cm line depth treatments yields first increased and then decreased with increasing aeration in silty clay loam soil. An increase in crop yield in their studies was due to a different soil aeration method and crops grown in clayey soil with high bulk density, while in this study, Andosol with low bulk density and high soil porosity was used (Table 2). Therefore, soil aeration was not a limiting factor in Andosol due to high soil porosity.
Increased agricultural productivity is a commonly reported benefit of biochar amendments to soils [37,38]. Our results showed that biochar amendment increased shoot dry weight compared with the control (Table 3). Biochar increased soil pH, total N, and soil porosity and decreased the bulk density of the soil (Table 2), which improved soil quality for plant growth. Zhang et al. [39] reported positive effects of lower bulk density due to BC amendment of soil which included nutrient cycling, retention of plant available water, reduced soil compaction, increased soil aeration, and increased crop yield.
Addition of biochar may have improved the availability of N and K due to its liming effect [40,41]. Many studies have reported that biochar improved soil physical and chemical properties and soil fertility via effects on the microbial community, thus increasing crop production [40,42,43]. However, Jeffery et al. [15] reported that high-nutrient biochar inputs stimulated yield substantially more than low-nutrient biochar in tropical soils, but arable soils in temperate regions are moderate in pH, higher in fertility, and generally receive higher fertilizer inputs, leaving little room for additional benefits from biochar. In this study, we observed higher shoot dry weight with a temperate soil and biochar amendment. However, the current result was only from the effect of fresh biochar and thus, it will be necessary to study the effect of biochar aging on vegetable growth and greenhouse gas emission during subsequent crop cycles in temperate soils.
N and K uptakes by komatsuna were increased by biochar amendment (Table 4). The increase in soil microbial activity under biochar amendment could also be one of the reasons for high nutrient uptake of komatsuna in biochar-treated soils. Van Zwieten et al. [44] and Chan et al. [45] also reported that high N uptake of vegetable crops grown in biochar-amended soils. Fresh biochar may contain significant amounts of soluble P and K [46], which contribute to the plant available pool upon incorporation in the soil, and thus increased plant uptake of K with BC amendment (Table 4). However, there was no effect on Mg uptake and lower Ca uptake was observed in biochar-treated soil. This result was in agreement with that of Alburquerque et al. [47], who also found decreased Ca after different biochar additions to a nutrient-poor, slightly acid soil. The increase in major nutrient uptake under biochar amendment indicated a potential effect of biochar for improving fertilizer use efficiency in vegetable soils.
Plant nutrient uptake in the aerated irrigations of AI and AI + BC treatments was not significantly different compared with control, except that Ca was reduced (Table 4). Morard et al. [48] stated that root oxygen deficiency caused a reduction in plant water and mineral uptake. However, in this study soil, due to high soil porosity with low bulk density, aerated irrigation to Andosol soil had no effect on macronutrient uptake compared with control.
4.2. Aerated Irrigation and Biochar on Soil N2O Emissions
The results showed that application of nitrogen fertilizer caused an initial sharp increase in soil N2O emissions. This result was in line with other studies [18,19,49]. The increase in N2O emissions during the early growing period suggested that N fertilizer and decomposition of crop residue can provide a temporary abundance of C and N to microorganisms resulting in a rapid increase in N2O emission [50]. The initial high N2O flux during early growth especially the emission peak at 9 days may have partly been a result of the high soil temperature in that period (Figure 1).
In the present study, aerated irrigation had no overall effect on soil N2O emission (Figure 3), but appeared to increase it at days 4-9 (Figure 2). Hou et al. [5] observed that the cumulative emission for N2O increased by 10% in aerated irrigation compared with that of control. Hui et al. [51] also stated that there was no significant difference between aeration and non-aeration in soil N2O emissions in the spring-summer season, whereas aeration enhanced N2O emissions significantly in the autumn–winter season. They discussed that the increased soil porosity and the reduced soil moisture due to aeration were bound to reduce soil N2O emissions in the spring–summer season, while higher water-filled pore space under aerated irrigation during the autumn–winter period was beneficial to N2O production. The soil oxygen content variation caused by aerated irrigation might affect the condition of nitrification and denitrification [14,52], which influences soil N2O emissions [5,14]. Machefert et al. [14] stated that, in soils with good oxygen supply, emission of NO should dominate while N2O may be the main product in moderately aerated soils. Li et al. [53,54] found that aerated irrigation significantly increased soil catalase and urease activity and the activity was highest in the flowering period which favored high N2O emissions from greenhouse tomatoes. Minamikawa et al. [26] working with potted rice observed that, although rice growth showed no difference between plants irrigated with nano-bubble water and control water, a significant reduction in cumulative CH4 emission was observed in the nano-bubble water treatment. Increased in soil N2O emissions from aerated irrigation treatment might be due to changes in soil microbial populations and activities under aerated conditions. Du et al. [32] showed that soil microbial abundance and enzyme activity were significantly higher in aerated irrigation compared with conventional irrigation. Improving soil aeration conditions can increase soil microbial abundance and enzyme activity [30], which in turn influences soil N2O production. Due et al. [32] found that for the aerated irrigation treatment, soil nitrifiers and denitrifiers increased with increased N application and their abundances; a treatment with 250 kg N ha−1 were 2.9- and 1.7-fold greater than the nitrifier and denitrifier abundances in the CK treatment, respectively.
The high N2O emission flux under AI treatment was observed during the early growing period (days 4-9) soon after basal application of fertilizer (Figure 2). This might be due to high availability of N fertilizer with increased microbial activity under aerated irrigation. Du et al. [32] reported that higher soil enzyme activity under aerated irrigation also favored urea hydrolysis and increased ammonium concentration in the soil, providing sufficient substrate for nitrification and thus a higher N loss would occur by means of denitrification. In this study, we used Andosol which was characterized with low bulk density and high soil porosity (Table 2). Further injection of air through aerated irrigation into the soil did not improve plant growth (Table 3) and nutrient uptake (Table 5), but increased soil N2O production (Figure 2).
Although soil aeration increased N2O emission, addition of pruning residue biochar significantly reduced N2O emission by 27.9% compared with control (Figure 3). This result was in line with other studies [16,17,18,23]. Addition of biochar decreased soil bulk density and increased soil porosity (Table 2) compared with control, and therefore its addition might reduce soil denitrification. Downie et al. [55] reported that increased soil aeration upon biochar addition might also be responsible for reducing N2O emissions. Rogovska et al. [56] also reported that biochar amendment decreased soil N2O emissions by affecting soil physical properties, reducing soil compaction and bulk density. Another study also reported that an increase in soil porosity and aeration are major factors governing N2O generation and diffusion [57]. However, biochar-related soil aeration (Table 2) might not be the sole reason for reducing N2O emission in this study, because the same effect was not replicated by soil aeration through AI treatment. Therefore, there might also be other factors influencing reduction in N2O emission by biochar amendment.
The reduction in N2O emission by biochar amendment might also be due to an increase in soil pH (Table 2), since low pH prevents the assembly of functional N2O reductase (N2OR), the enzyme that reduces N2O to N2 during the process of denitrification [58,59]. Increased N2OR activity due to higher pH by biochar might be one of the reasons for reduced N2O emission from acid soils [19]. The underlying mechanism for a reduction in soil N2O emission by biochar amendment was reported due to microbial reduction of N2O to N2 via nosZ gene-containing microorganisms [23].
Changes in soil C content and C: N ratio by biochar amendment (Table 2) might be an important parameter affecting soil N utilization and N2O emission in this study. Geisseler et al. [60] and Guo et al. [61] found that the soil C: N ratio is a key parameter that determines pathways of soil N utilization and thus impacts nitrification and denitrification. As the relative C content increases in soil, the N demand of microbes increases above the N availability and N becomes a limiting factor relative to C for nitrification or denitrification and, thus, N2O emission becomes relatively low [62]. Therefore, a biochar-induced change in soil C and C:N ratio was probably the dominant factor for the reduction in soil N2O emission (Table 2). Improved plant N uptake under biochar amendment might also be one of the reasons reducing soil N2O emission (Table 4).
Although the combination of biochar and aerated irrigation (AI + BC) decreased N2O emission by 19.5% compared with the control, the significant effect of biochar (27.9% reduction) was slightly diminished by adding AI. Biochar addition increased soil porosity and improved soil aeration (Table 2), but the further injection of air through aerated irrigation in the AI + BC treatment did not show a further reduction in N2O; rather it partially reduced the significant effect of biochar. This might be due to the fact that aerated irrigation could potentially lead to N2O production due to increased microbial population and activity, and provide a sufficient substrate for nitrification [32], thus N loss might have occurred by nitrification due to the biochar amendment in AI + BC treatment.
5. Conclusions
Our results indicated that aerated irrigation using nano-bubbles had a negative impact on komatsuna plant growth and soil N2O emission from soil with low bulk density and high soil porosity. Therefore, it may be recommended that aerated irrigation should be practiced in soils with high clay content and high bulk density to mitigate N2O emission while increasing vegetable crop yield. As expected, pruning residue biochar amendment significantly reduced soil N2O emission. Changes in soil pH, soil C:N ratio, bulk density, and soil porosity under biochar amendment were recognized as the driving factor for N2O emission change after application of pruning waste biochar. Moreover, biochar also enhanced vegetable growth and plant nutrient uptake of komatsuna. The results suggested that pruning residue biochar has the potential to mitigate N2O emission while increasing vegetable growth and plant nutrient uptake from temperate soils. However, this study was conducted in a single growing season with limited replications, thus the findings cannot be extrapolated to broad conclusions. Further research is needed to investigate the effects of aerated irrigation using nano-bubbles and biochar on vegetable plant growth and N2O emission from different soils.
Author Contributions
Conceived and designed the experiments: A.Z.O., S.S., S.M., K.T.W., and T.G. Performed the experiments: A.Z.O. and S.S. Analyzed the data: A.Z.O. and K.T.W. Wrote the paper: A.Z.O. and S.S. All authors have read and approved the final manuscript.
Funding
This research received no external funding.
Acknowledgments
The authors thank Kazunori Minamikawa (Japan International Research Center for Agricultural Sciences) for technical support. We would like to thank the editor and reviewers for their time spent reviewing our manuscript and their comments helping us to improve the article.
Conflicts of Interest
The authors have declared that no competing interests exist.
References
- Ravishankara, A.R.; Daniel, J.S.; Portmann, R.W. Nitrous Oxide (N2O): The Dominant Ozone-Depleting Substance Emitted in the 21st Century. Science 2009, 326, 123–125. [Google Scholar] [CrossRef] [PubMed]
- Intergovernmental Panel on Climate Change (IPCC). Climate Change 2013: The Physical Science Basis; Contribution of Working Group I to the Fifth Assessment Report of the Intergovernmental Panel on Climate Change; Cambridge University Press: Cambridge, UK; New York, NY, USA, 2013. [Google Scholar]
- Smith, K.A.; Crutzen, P.J.; Mosier, A.; Winiwarter, W. The global N2O budget: A reassessment. In Nitrous Oxide and Climate Change; Smith, K., Ed.; Earthscan: London, UK, 2010; ISBN 9781844077571. [Google Scholar]
- Organization for Economic Cooperation and Development (OECD). Environmental indicators for agriculture. In Methods and Results; Publications Service, OECD: Paris, France, 2001; Volume 3, pp. 281–283. [Google Scholar]
- Hou, H.; Chen, H.; Cai, Hi.; Yang, F.; Li, D.; Wang, F. CO2 and N2O emissions from Lou soils of greenhouse tomato fields under aerated irrigation. Atmos. Environ. 2016, 132, 69–76. [Google Scholar] [CrossRef]
- Zhang, M.; Fan, C.H.; Li, Q.L.; Li, B.; Zhu, Y.Y.; Xiong, Z.Q. A 2-yr field assessment of the effects of chemical and biological nitrification inhibitors on nitrous oxide emissions and nitrogen use efficiency in an intensively managed vegetable cropping system. Agric. Ecosyst. Environ. 2015, 201, 43–50. [Google Scholar] [CrossRef]
- Huang, S.; Pant, H.K.; Lu, J. Effects of water regimes on nitrous oxide emission from soils. Ecol. Eng. 2007, 131, 9–15. [Google Scholar] [CrossRef]
- Scheer, C.; Grace, P.R.; Rowlings, D.W.; Payero, J. Soil N2O and CO2 emissions from cotton in Australia under varying irrigation management. Nutr. Cycl. Agroecosyst. 2013, 95, 43–56. [Google Scholar] [CrossRef] [Green Version]
- Abuara, M.; Mostafa, E.; Ibrahim, M. Effect of air injection under subsurface drip irrigation on yield and water use efficiency of corn in a sandy clay loam soil. J. Adv. Res. 2013, 4, 493–499. [Google Scholar] [CrossRef] [PubMed]
- Heuberger, H.; Livet, J.; Schnitzler, S.W. Effect of soil aeration on nitrogen availability and growth of selected vegetables-preliminary results. Acta Hortic. 2001, 563, 147–154. [Google Scholar] [CrossRef]
- Bhattarai, S.P.; Huber, S.; Midmore, D.J. Aerated subsurface irrigation water gives growth and yield benefits to Zucchini, vegetable soybean and cotton in heavy clay soils. Ann. Appl. Biol. 2004, 144, 285–298. [Google Scholar] [CrossRef]
- Chen, X.; Dhungel, J.; Bhattarai, S.P.; Torabi, M.; Pendergast, L.; Midmore, D.J. Impact of oxygation on soil respiration, yield and water use efficiency of three crop species. J. Plant Ecol. 2011, 4, 236–248. [Google Scholar] [CrossRef]
- Zhu, L.F.; Yu, S.M.; Jin, Q.Y. Effects of aerated irrigation on leaf senescence at late growth stage and grain yield of rice. Rice Sci. 2012, 19, 44–48. [Google Scholar] [CrossRef]
- Machefert, S.E.; Dise, N.B.; Goulding, K.W.T.; Whitehead, P.G. Nitrous oxide emission from a range of land uses across Europe. Hydrol. Earth Syst. Sci. 2002, 6, 325–337. [Google Scholar] [CrossRef]
- Jeffery, S.; Abalos, D.; Prodana, M.; Bastos, A.; van Groenigen, J.W.; Hungate, B.; Verheijen, F. Biochar boosts tropical but not temperate crop yields. Environ. Res. Lett. 2017, 12, 053001. [Google Scholar] [CrossRef] [Green Version]
- Fan, C.; Chen, H.; Li, B.; Xiong, Z. Biochar reduces yield-scaled emissions of reactive nitrogen gases from vegetable soils across China. Biogeosciences 2017, 14, 2851–2863. [Google Scholar] [CrossRef] [Green Version]
- Oo, A.Z.; Sudo, S.; Akiyama, H.; Win, K.T.; Shibata, A.; Yamamoto, A.; Hirono, Y.; Sano, T. Effect of dolomite and biochar addition on N2O and CO2 emissions from acidic tea field soil. PLoS ONE 2018, 13, E0192235. [Google Scholar] [CrossRef] [PubMed]
- Oo, A.Z.; Sudo, S.; Win, K.T.; Shibata, A.; Gonai, T. Influence of pruning waste biochar and oyster shell on N2O and CO2 emissions from Japanese pear orchard soil. Heliyon 2018, 4, e00568. [Google Scholar] [CrossRef] [PubMed]
- Oo, A.Z.; Sudo, S.; Win, K.T.; Shibata, A.; Sano, T.; Hirono, Y. Returning Tea Pruning Residue and Its Biochar Had a Contrasting Effect on Soil N2O and CO2 Emissions from Tea Plantation Soil. Atmosphere 2018, 9, 109. [Google Scholar] [CrossRef]
- Clough, T.; Bertram, J.; Ray, J.; Condron, L.; O’Callaghan, M.; Sherlock, R.; Wells, N. Unweathered wood biochar impact on nitrous oxide emissions from a bovine-urine-amended pasture soil. Soil Sci. Soc. Am. J. 2010, 74, 852–860. [Google Scholar] [CrossRef] [Green Version]
- Saarnio, S.; Heimonen, K.; Kettunen, R. Biochar addition indirectly affects N2O emissions via soil moisture and plant N uptake. Soil Biol. Biochem. 2013, 58, 99–106. [Google Scholar] [CrossRef]
- Field, J.L.; Keske, C.M.H.; Birch, G.L.; Defoort, M.W.; Cotrufo, M.F. Distributed biochar and bioenergy coproduction: A regionally specific case study of environmental benefits and economic impacts. Glob. Chang. Biol. Bioenergy 2013, 5, 177–191. [Google Scholar] [CrossRef]
- Cayuela, M.; Van Zwieten, L.; Singh, B.; Jeffery, S.; Roig, A.; Sánchez-Monedero, M. Biochar’s role in mitigating soil nitrous oxide emissions: A review and meta-analysis. Agric. Ecosyst. Environ. 2014, 191, 5–16. [Google Scholar] [CrossRef]
- Ebid, A.; Ueno, H.; Ghoneim, A.; Asagi, N. Uptake of carbon and nitrogen derived from carbon-13 and nitrogen-15 dual-labeled maize residue compost applied to radish, komatsuna, and chingensai for three consecutive croppings. Plant Soil 2008, 304, 241–248. [Google Scholar] [CrossRef]
- Amkha, S.; Sakamoto, A.; Tachibana, M.; Inubushi, K. Controlled mineralizing acetaldehyde condensation urea (CM-CDU) fertilizer can reduce nitrate leaching and N2O emission from an Andisol with continuous cropped komatsuna (Brassica napa L.). Soil Sci. Plant Nutr. 2009, 55, 772–777. [Google Scholar] [CrossRef]
- Minamikawa, K.; Takahashi, M.; Makino, T.; Tago, K.; Hayatsu, M. Irrigation with oxygen-nanobubble water can reduce methane emission and arsenic dissolution in a flooded rice paddy. Environ. Res. Lett. 2015, 10, 084012. [Google Scholar] [CrossRef] [Green Version]
- Parkin, T.B.; Venterea, R.T. Chamber-Based Trace Gas Flux Measurements. In Sampling Protocols; Follet, R.F., Ed.; 2010; Chapter 3; pp. 3-1–3-39. Available online: http://www.ars.usda.gov/research/GRACEnet (accessed on 29 September 2018).
- Rochette, P.; Chadwick, D.R.; de Klein, C. Deployment Protocol. In Nitrous Oxide Chamber Methodolog Guidelines; De Klein, C., Harvey, M., Eds.; Ministry for Primary Industries: Wellington, UK, 2013; Chapter 3. [Google Scholar]
- Ahmed, A.K.A.; Shi, X.; Hua, L.; Manzueta, L.; Qing, W. Influences of Air, Oxygen, Nitrogen, and Carbon Dioxide Nanobubbles on Seed Germination and Plant Growth. J. Agric. Food Chem. 2018, 66, 5117–5124. [Google Scholar] [CrossRef] [PubMed]
- Li, Y.; Niu, W.Q.; Wang, J.W.; Liu, L.; Zhang, M.Z.; Xu, J. Effects of artificial soil aeration volume and frequency on soil enzyme activity and microbial abundance when cultivating greenhouse tomato. Soil Sci. Soc. Am. J. 2016, 80, 1208–1221. [Google Scholar] [CrossRef]
- Ushikubo, F.Y.; Furukawa, T.; Nakagawa, R.; Enaria, M.; Makino, Y.; Kawagoe, Y.; Shiina, T.; Oshita, S. Evidence of the existence and the stability of nano-bubbles in water. Colloids Surf. A: Physicochem. Eng. Asp. 2010, 361, 31–37. [Google Scholar] [CrossRef]
- Du, Y.; Niu, W.; Zhang, Q.; Cui, B.; Gu, X.; Guo, L.; Liang, B. Effects of Nitrogen on Soil Microbial Abundance, Enzyme Activity, and Nitrogen Use Efficiency in Greenhouse Celery under Aerated Irrigation. Soil Sci. Soc. Am. J. 2018, 82, 606–613. [Google Scholar] [CrossRef]
- Park, J.; Ohashi, K.; Kurata, K.; Lee, J. Promotion of lettuce growth by application of microbubbles in nutrient solution using different rates of electrical conductivity and under periodic intermittent generation in a deep flow technique culture system. Eur. J. Hortic. Sci. 2010, 75, 198–203. [Google Scholar]
- Ikeura, H.; Takahashi, H.; Kobayashi, F.; Sato, M.; Tamaki, M. Effects of microbubble generation methods and dissolved oxygen concentrations on growth of Japanese mustard spinach in hydroponic culture. J. Hortic. Sci. Biotechnol. 2017, 92, 483–490. [Google Scholar] [CrossRef]
- Carter, D.C.; Harris, D.; Youngquist, J.B.; Persaud, N. Soil properties, crop water use and cereal yields in Botswana after additions of mulch and manure. Field Crops Res. 1992, 30, 97–109. [Google Scholar] [CrossRef]
- Czyz, E.A. Effect of traffic on soil aeration, bulk density and growth of barley. Soil Tillage Res. 2004, 79, 153–166. [Google Scholar] [CrossRef]
- Jeffery, S.; Verheijen, G.A.; van der Velde, M.; Bastos, A.C. A quantitative review of the effects of biochar application to soils on crop productivity using meta-analysis. Agric. Ecosys. Environ. 2011, 144, 175–187. [Google Scholar] [CrossRef]
- Biederman, L.A.; Harpole, W.S. Biochar and its effects on plant productivity and nutrient cycling: A meta-analysis. GCB Bioenergy 2013, 5, 202–214. [Google Scholar] [CrossRef]
- Zhang, A.; Liu, Y.; Pan, G.; Hussain, Q.; Li, L.; Zheng, J.; Zhang, X. Effect of biochar amendment on maize yield and greenhouse gas emissions from a soil organic carbon poor calcareous loamy soil from Central China plain. Plant Soil 2012, 351, 263–275. [Google Scholar] [CrossRef]
- Chan, K.Y.; Xu, Z. Biochar: Nutrient properties and their enhancement, Biochar for environmental management. Sci. Technol. 2009, 1, 67–84. [Google Scholar]
- Major, J.; Lehmann, J.; Rondon, M.; Goodale, C. Fate of soilapplied black carbon: Downward migration, leaching and soil respiration. Glob. Chang. Biol. 2010, 16, 1366–1379. [Google Scholar] [CrossRef]
- Lehmann, J.; Rillig, M.C.; Thies, J.; Masiello, C.A.; Hockaday, W.C.; Crowley, D. Biochar effects on soil biota—A review. Soil Biol. Biochem. 2011, 43, 1812–1836. [Google Scholar] [CrossRef]
- Novak, J.M.; Busscher, W.J.; Laird, D.L.; Ahmedna, M.; Watts, D.W.; Niandou, M.A.S. Impact of biochar amendment on fertility of a Southeastern coastal plain soil. Soil Sci. 2009, 174, 105–112. [Google Scholar] [CrossRef]
- Van Zwieten, L.; Kimber, S.; Morris, S.; Chan, K.Y.; Downie, A.; Rust, J.; Joseph, S.; Cowie, A. Effect of biochar from slow pyrolysis of paper mill waste on agronomic performance and soil fertility. Plant Soil 2010, 327, 235–246. [Google Scholar] [CrossRef]
- Chan, K.Y.; Van Zwieten, L.; Meszaros, I.; Downie, A.; Joseph, S. Using poultry litter biochars as soil amendments. Aust. J. Soil Res. 2008, 46, 437–444. [Google Scholar] [CrossRef]
- Kloss, S.; Zehetner, F.; Dellantonio, A.; Hamid, R.; Ottner, F.; Liedtke, V.; Schwanninger, M.; Gerzabek, M.H.; Soja, G. Characterization of slow pyrolysis biochars: Effects of feedstocks and pyrolysis temperature on biochar properties. J. Environ. Qual. 2012, 41, 990–1000. [Google Scholar] [CrossRef] [PubMed]
- Alburquerque, J.A.; Salazar, P.; Barron, V.; Torrent, J.; del Carmen del Campillo, M.; Gallardo, A.; Villar, R. Enhanced wheat yield by biochar addition under different mineral fertilization levels. Agron. Sustain. Dev. 2013, 33, 475–484. [Google Scholar] [CrossRef]
- Morard, P.; Lacoste, L.; Silvestre, J. Effect of oxygen deficiency on uptake of water and mineral nutrients by tomato plants in soilless culture. J. Plant Nutr. 2000, 23, 1063–1078. [Google Scholar] [CrossRef]
- Yang, F.; Lee, X.; Theng, B.K.G.; Wang, B.; Cheng, J.; Wang, Q. Effect of biochar addition on short-term N2O and CO2 emissions during repeated drying and wetting of an anthropogenic alluvial soil. Environ. Geochem. Health 2016, 39, 635–647. [Google Scholar] [CrossRef] [PubMed]
- Azam, F.; Müller, C.; Weiske, A.; Benckiser, G.; Ottow, J. Nitrification and denitrification as sources of atmospheric nitrous oxide—Role of oxidizable carbon and applied nitrogen. Biol. Fertil. Soils 2002, 35, 54–61. [Google Scholar]
- Chen, H.; Hou, H.; Wang, X.; Zhu, Y.; Saddique, Q.; Wang, Y.; Cai, H. The effects of aeration and irrigation regimes on soil CO2 and N2O emissions in a greenhouse tomato production system. J. Integr. Agric. 2018, 17, 449–460. [Google Scholar] [CrossRef]
- Bhattarai, S.P.; Pendergast, L.; Midmore, D.J. Root aeration improves yield and water use efficiency of tomato in heavy clay and saline soils. Sci. Hortic. 2006, 108, 278–288. [Google Scholar] [CrossRef]
- Li, Y.; Jia, Z.; Niu, W.; Wang, J.; Zhang, M. Effect of Post-Infiltration Soil Aeration at Different Growth Stages on Growth and Fruit Quality of Drip-Irrigated Potted Tomato Plants (Solanum lycopersicum). PLoS ONE 2015, 10, e0143322. [Google Scholar] [CrossRef] [PubMed]
- Li, Y.; Niu, W.; Wang, J.; Zhang, M. Effects of aeration on rhizosphere soil enzyme activities and soil microbes for muskmelon in plastic greenhouse. Trans. Chin. Soc. Agric. Mach. 2015, 46, 121–129. [Google Scholar]
- Downie, A.; Crosky, A.; Munroe, P. Physical properties of biochar. In Biochar for Environmental Management: Science and Technology; Lehmann, J., Joseph, S., Eds.; Earthscan: London, UK, 2009; pp. 13–32. [Google Scholar]
- Rogovska, N.; Laird, D.; Cruse, R.; Fleming, P.; Parkin, T.; Meek, D. Impact of biochar on manure carbon stabilization and greenhouse gas emissions. Soil Sci. Soc. Am. J. 2011, 75, 871–879. [Google Scholar] [CrossRef]
- Heincke, M.; Kaupenjohann, M. Effects of soil solution on the dynamics of N2O emissions: A review. Nutr. Cycl. Agroecosyst. 1999, 55, 133–157. [Google Scholar] [CrossRef]
- Liu, B.; Morkved, P.T.; Frostegard, A.; Bakken, L.R. Denitrification gene pools, transcription and kinetics of NO, N2O and N2 production as affected by soil pH. FEMS Microbiol. Ecol. 2010, 72, 407–417. [Google Scholar] [CrossRef] [PubMed]
- Taghizadeh-Toosi, A.; Clough, T.J.; Condron, L.M.; Sherlock, R.R.; Anderson, C.R.; Craigie, R.A. Biochar incorporation into pasture soil suppresses in situ nitrous oxide emissions from ruminant urine patches. J. Environ. Qual. 2011, 40, 468–476. [Google Scholar] [CrossRef] [PubMed]
- Geisseler, D.; Horwath, W.R.; Joergensen, R.G.; Ludwig, B. Pathways of nitrogen utilization by soil microorganisms—A review. Soil Biol. Biochem. 2010, 42, 2058–2067. [Google Scholar] [CrossRef]
- Guo, J.; Peng, Y.; Wang, S.; Ma, B.; Ge, S.; Wang, Z.; Huang, H.; Zhang, J.; Zhang, L. Pathways and organisms involved in ammonia oxidation and nitrous oxide emission. Crit. Rev. Environ. Sci. Technol. 2013, 43, 2213–2296. [Google Scholar] [CrossRef]
- Feng, Z.; Zhu, L. Impact of biochar on soil N2O emissions under different biochar-carbon/fertilizer-nitrogen ratios at a constant moisture condition on a silt loam soil. Sci. Total Environ. 2017, 15, 584–585. [Google Scholar] [CrossRef] [PubMed]
Figure 1.
Variation in soil temperature during growing season of komatsuna. Error bars indicate standard deviation (n = 3). AI: aerated irrigation; BC: biochar.
Figure 1.
Variation in soil temperature during growing season of komatsuna. Error bars indicate standard deviation (n = 3). AI: aerated irrigation; BC: biochar.

Figure 2.
Soil N2O emissions affected by aerated irrigation (AI) and/or biochar (BC) during the growing period of komatsuna. Error bars indicate standard deviation (n = 3).
Figure 2.
Soil N2O emissions affected by aerated irrigation (AI) and/or biochar (BC) during the growing period of komatsuna. Error bars indicate standard deviation (n = 3).

Figure 3.
Cumulative N2O emissions affected by aerated irrigation (AI) and/or biochar (BC). Error bars indicate standard deviation (n = 3). Means with the same letters are not significantly different at the P ≤ 5% level by the LSD test.
Figure 3.
Cumulative N2O emissions affected by aerated irrigation (AI) and/or biochar (BC). Error bars indicate standard deviation (n = 3). Means with the same letters are not significantly different at the P ≤ 5% level by the LSD test.

Table 1.
Soil properties collected from an upland field at the Horticultural Reserarch Institute, Agricultural Research Center, Ibaraki, Japan.
Table 1.
Soil properties collected from an upland field at the Horticultural Reserarch Institute, Agricultural Research Center, Ibaraki, Japan.
| Parameter | Value |
|---|---|
| pH | 5.3 |
| EC (mS cm−1) | 0.1 |
| P2O5 (mg 100 g−1) | 4.1 |
| K2O (mg 100 g−1) | 45.9 |
| NO3-N (mg 100 g−1) | 2.4 |
| NO2-N (mg 100 g−1) | 0.2 |
| Total N (g kg−1) | 3.7 |
| Total C (g kg−1) | 45 |
| Bulk density (g cm−3) | 0.76 |
| Coarse sand (%) | 3.1 |
| Fine sand (%) | 23.6 |
| Silt (%) | 50.4 |
| Clay (%) | 22.9 |
| Classification | Silk loam |
Table 2.
Effect of aerated irrigation (AI) and/or biochar (BC) on properties of soil after harvest of Komatsuna. Values are mean ± standard deviation (n = 3). Means followed by the same letters are not significantly different at the P ≤ 5% level by the LSD test.
Table 2.
Effect of aerated irrigation (AI) and/or biochar (BC) on properties of soil after harvest of Komatsuna. Values are mean ± standard deviation (n = 3). Means followed by the same letters are not significantly different at the P ≤ 5% level by the LSD test.
| pH (H2O) | Total N (g kg−1 Soil) | Total C (g kg−1 Soil) | C: N Ratio | Bulk Density (g cm−3) | Soil Porosity (%) | |
|---|---|---|---|---|---|---|
| Control | 6.54 ± 0.05 d | 4.66 ± 0.27 a | 52.1 ± 2.0 b | 11.19 ± 0.21 b | 0.70 ± 0.07 | 53.0 ± 3.6 |
| AI | 6.76 ± 0.07 c | 4.82 ± 0.16 a | 53.5 ± 0.4 b | 11.12 ± 0.29 b | - | - |
| BC | 7.12 ± 0.11 b | 5.10 ± 0.24 a | 90.1 ± 22.7 a | 17.56 ± 3.82 a | 0.63 ± 0.03 | 59.4 ± 1.9 |
| AI + BC | 7.25 ± 0.05 a | 5.34 ± 0.39 a | 93.9 ± 14.5 a | 17.53 ± 1.49 a | - | - |
| Analysis of variance P value | ||||||
| Treatment | <0.01 | >0.05 | <0.05 | <0.05 | - | - |
Table 3.
Effect of aerated irrigation (AI) and/or biochar (BC) on shoot length, yield, and N content of komatsuna at harvest. Values are mean ± standard deviation (n = 3). Means followed by the same letters are not significantly different at the P ≤ 5% level by the LSD test.
Table 3.
Effect of aerated irrigation (AI) and/or biochar (BC) on shoot length, yield, and N content of komatsuna at harvest. Values are mean ± standard deviation (n = 3). Means followed by the same letters are not significantly different at the P ≤ 5% level by the LSD test.
| Shoot Length (cm) | Shoot Fresh wt. (g pot−1) | Shoot Dry wt. (g pot−1) | |
|---|---|---|---|
| Control | 23.6 ± 2.2 ab | 59.5 ± 3.2 ab | 7.20 ± 0.08 b |
| AI | 21.5 ± 0.9 b | 55.5 ± 3.3 b | 6.73 ± 0.39 b |
| BC | 25.3 ± 1.2 a | 65.6 ± 0.8 a | 7.80 ± 0.08 a |
| AI + BC | 24.5 ± 1.9 ab | 60.3 ± 5.6 ab | 7.54 ± 0.36 ab |
| Analysis of variance P value | |||
| Treatment | ≤0.05 | ≤0.05 | ≤0.05 |
Table 4.
Effect of aerated irrigation (AI) and/or biochar (BC) on tissue ion concentration of komatsuna. Values are mean ± standard deviation (n = 3). Means followed by the same letters are not significantly different at the P ≤ 5% level by the LSD test.
Table 4.
Effect of aerated irrigation (AI) and/or biochar (BC) on tissue ion concentration of komatsuna. Values are mean ± standard deviation (n = 3). Means followed by the same letters are not significantly different at the P ≤ 5% level by the LSD test.
| Concentration (mg g−1) | |||||
|---|---|---|---|---|---|
| N | P | K | Mg | Ca | |
| Control | 16.72 ± 2.7 a | 0.64 ± 0.06 a | 13.9 ± 2.7 b | 2.16 ± 0.05 a | 20.9 ± 0.2 a |
| AI | 20.26 ± 0.9 a | 0.63 ± 0.17 a | 15.6 ± 1.9 ab | 2.16 ± 0.21 a | 21.0 ± 3.1 a |
| BC | 19.63 ± 3.1 a | 0.73 ± 0.03 a | 18.5 ± 2.4 a | 1.97 ± 0.24 a | 16.9 ± 0.6 b |
| AI + BC | 18.45 ± 1.0 a | 0.76 ± 0.09 a | 16.8 ± 2.8 ab | 2.04 ± 0.21 a | 15.7 ± 1.2 b |
| Analysis of variance P value | |||||
| Treatment | >0.05 | >0.05 | ≤0.05 | >0.05 | ≤0.05 |
Table 5.
Effect of aerated irrigation (AI) and/or biochar (BC) on total mineral nutrient uptake of komatsuna. Values are mean ± standard deviation (n = 3). Means followed by same letters are not significantly different at the P ≤ 5% level by the LSD test.
Table 5.
Effect of aerated irrigation (AI) and/or biochar (BC) on total mineral nutrient uptake of komatsuna. Values are mean ± standard deviation (n = 3). Means followed by same letters are not significantly different at the P ≤ 5% level by the LSD test.
| Uptake (mg pot−1) | |||||
|---|---|---|---|---|---|
| N | P | K | Mg | Ca | |
| Control | 120.7 ± 11.8 b | 99.4 ± 9.9 ab | 100.5 ± 20.9 b | 15.6 ± 0.7 a | 150.5 ± 3.0 a |
| AI | 136.3 ± 14.5 ab | 89.9 ± 18.0 b | 104.2 ± 11.6 ab | 14.5 ± 0.4 a | 139.8 ± 6.5 b |
| BC | 152.9 ± 12.9 a | 121.9 ± 6.1 ab | 143.9 ± 17.9 a | 15.4 ± 1.8 a | 131.6 ± 5.7 b |
| AI + BC | 139.2 ± 10.6 ab | 122.8 ± 10.1 a | 127.4 ± 26.9 ab | 15.5 ± 2.3 a | 118.6 ± 9.8 c |
| Analysis of variance P value | |||||
| Treatment | ≤0.05 | ≤0.05 | ≤0.05 | >0.05 | ≤0.05 |
© 2018 by the authors. Licensee MDPI, Basel, Switzerland. This article is an open access article distributed under the terms and conditions of the Creative Commons Attribution (CC BY) license (http://creativecommons.org/licenses/by/4.0/).
Share and Cite
MDPI and ACS Style
Oo, A.Z.; Sudo, S.; Matsuura, S.; Win, K.T.; Gonai, T. Aerated Irrigation and Pruning Residue Biochar on N2O Emission, Yield and Ion Uptake of Komatsuna. Horticulturae 2018, 4, 33. https://doi.org/10.3390/horticulturae4040033
AMA Style
Oo AZ, Sudo S, Matsuura S, Win KT, Gonai T. Aerated Irrigation and Pruning Residue Biochar on N2O Emission, Yield and Ion Uptake of Komatsuna. Horticulturae. 2018; 4(4):33. https://doi.org/10.3390/horticulturae4040033
Chicago/Turabian StyleOo, Aung Zaw, Shigeto Sudo, Shoji Matsuura, Khin Thuzar Win, and Takeru Gonai. 2018. "Aerated Irrigation and Pruning Residue Biochar on N2O Emission, Yield and Ion Uptake of Komatsuna" Horticulturae 4, no. 4: 33. https://doi.org/10.3390/horticulturae4040033
Note that from the first issue of 2016, this journal uses article numbers instead of page numbers. See further details here.