Trends in the Use of New-Media Marketing in U.S. Ornamental Horticulture Industries


1
Department of Applied Economics, University of Minnesota, 1994 Buford Ave., St. Paul, MN 55108, USA
2
Department of Horticulture and Natural Resources, Kansas State University 1712 Claflin Rd., Manhattan, KS 66506, USA
3
Department of Communications and Agricultural Education, Kansas State University, 1612 Claflin Rd., Manhattan, KS 66506, USA
4
Department of Agricultural Economics, Kansas State University, 1603 Old Claflin Place, Manhattan, KS 66506, USA
*
Author to whom correspondence should be addressed.
Horticulturae 2018, 4(4), 32; https://doi.org/10.3390/horticulturae4040032
Submission received: 31 July 2018
/
Revised: 9 September 2018
/
Accepted: 10 October 2018
/
Published: 13 October 2018
(This article belongs to the Special Issue Marketing Strategies of the Horticultural Production Chain)
Abstract
:Ornamental horticulture businesses in the United States (U.S.) face challenges to stay economically viable, particularly in rural areas. Marketing with new-media tools (e.g., websites, HTML newsletters, social media, and blogs) has the potential to increase sales over traditional methods of advertising. A survey was conducted to gauge the extent of the use of new-media marketing by ornamental horticulture businesses across the U.S. Responses from 161 businesses showed that marketing practices varied widely across business size in terms of expenses and the labor hours allocated. A majority of the sample (89%) were involved in new-media marketing, and all new-media users made use of at least one new-media tool. Facebook was used by more than 90% of new-media users, followed by the business’ own website, which was used by 82% of respondents. Respondents’ perception of how various new-media marketing tools affected sales followed the extent of use, in general.
1. Introduction
Ornamental horticulture businesses ranked among the fastest growing segments of U.S. agriculture in 2004, as a result of two decades of steady growth [1]. However, sales by individual nurseries have decreased over the last decade, mainly attributed to the Great Recession [2]. From 2007 to 2012, total sales of U.S. nursery and garden center products shrunk by 12.7%, whereas the number of nurseries and garden centers increased by 3.9% [3]. The ornamental horticulture industry is faced with numerous challenges to maintain successful businesses, including competition from mass merchants, which have acquired almost half the market share from smaller, local garden centers [4]. Ornamental horticulture business owners need to reevaluate marketing practices to meet changing consumer preferences, especially with the integration of the internet in the everyday lives of consumers [5,6].
New-media marketing—using digital methods including websites, HTML newsletters, and social media [7]—has provided new opportunities in the last decade for businesses to engage with customers. Marketing through social-media platforms such as Facebook and Pinterest, in particular, has allowed businesses to build and maintain stronger relationships with clientele based on customer-generated content [7,8]. In other sectors, businesses have incorporated social media into marketing practices at a rapid pace. A 2010 survey showed more than three-quarters (79%) of the 2100 organizations surveyed reported having adopted, or were preparing, social-media initiatives [9]. According to a 2014 national survey of marketers, with 2800 respondents, 89% had adopted social media within the last five years [10].
The reasonable costs associated with deploying new-media marketing strategies are encouraging to family-owned horticulture businesses [6]. In the Marketing in a Digital World, Small- and Medium-Sized Business and Consumer Survey, Karr [11] showed that a majority of businesses surveyed (59%) spent less than $100 per year to use social-media marketing on various channels. Onishi and Manchanda [12] noted new media, involving user-generated content, are primarily available for free, which is in contrast to traditional media. Moreover, new-media marketing tools can be used in conjunction with traditional-media marketing tools to increase business sales [12].
Little is known about the extent of new-media marketing activities in ornamental horticulture industries. One study, examining the level of Pinterest use by agricultural producers and businesses, showed considerable differences, between agricultural segments, in the degree of Pinterest use to reach customers [13]. The specialty crop segment, which includes ornamental horticulture industries, accounted for 9.1% (39 out of 428) of users, suggesting low use of new-media marketing tools by ornamental horticulture businesses. This study further indicated that agribusinesses and agricultural organizations were not using new-media marketing tools to their full potential.
This study aimed to explain how ornamental horticulture businesses are currently using new-media marketing, including engagement with customers, so that future outreach programs can be designed to help them make the most of new-media marketing efforts. Since this is the first study of its kind, it is limited in scope to get benchmark data on ornamental horticulture businesses. A questionnaire was developed to understand the scope of business, marketing practices, perceptions of new-media marketing, and the technological environment of business operators.
2. Materials and Methods
A questionnaire was developed to collect information from ornamental horticulture businesses. It consisted of 40 questions pertaining to businesses’ online new-media marketing practices (we used the term “online” in the questionnaire, which was likely more familiar to the respondents than “new media,” but we use the terms interchangeably), including their relationships with customers. Questions were formulated around four factors: (1) Business characteristics, (2) overall marketing practices, (3) online marketing practices, and (4) respondent demographics. The questionnaire was described in the introductory email as covering business characteristics and marketing practices, requesting respondents to collaborate with colleagues, if needed, to complete the questionnaire.
The questionnaire was designed to account for three types of respondents: Those not using any new-media marketing; those using some new-media marketing, but not social-media marketing; and those using new- and social-media marketing. After collecting information about their scope of business, a question asked what the frequency of use of various marketing venues was, including “print advertisements” (newspapers, store circulars, and postal mailings), “personal interactions” (phone calls, emails, and visits), “television/radio,” “fairs/trade shows/garden shows,” and “online marketing” (websites, blogs, social media, and e-newsletters). Those who indicated that they never used online marketing were routed to answer reasons for their non-use. Those who indicated they had used online marketing at least once proceeded to answer additional questions about their new-media marketing practices. Then, a question asked for the frequency of reaching their customers through different online marketing tools, including “websites,” “HTML newsletters” (e.g., Constant Contact and MailChimp), “blogs,” and “social-media platforms” (e.g., Facebook and Twitter). Those who indicated some use of social-media platforms proceeded to answer questions related to their experience with social-media marketing, while those who never used any social-media platforms were diverted to answering questions related to their reasons for not using social media.
The questionnaire was designed and distributed using Qualtrics software (Qualtrics, LLC, Salt Lake City, UT, USA), which was compatible for access on computers and mobile devices [14]. Following Dillman et al. [14], respondents could return to previous questions, and forced responses were imposed on 23 key questions, including marketing expenses, annual gross sales, and perceived importance of social media, to ensure that responses were provided. Responses to multiple-choice questions were randomized to minimize order effects [15]. The questionnaire was pre-tested by a nursery-marketing specialist and two other people with no relationship to ornamental horticulture industries. Suggestions made by these respondents were considered for the final version of the questionnaire.
According to the 2012 Economic Census, there were 13,928 establishments classified as nursery, garden center, and farm supply stores (NAICS code 444220) nationwide, and 634 in the North Plains region, including Kansas [16]. (The Northern Plains region is one of twelve regions defined by the USDA National Agricultural Statistics Service and includes North Dakota, South Dakota, Nebraska, and Kansas.) Without a comprehensive directory of these businesses coupled with the exploratory nature of the study, convenience sampling was adopted. Distribution of the questionnaire was planned with a goal to reach as many ornamental horticulture businesses, including nurseries, garden-center businesses, and landscape businesses, as possible in the 48 contiguous states of the United States, in both rural and urban areas. Businesses did not have to be new-media users to participate.
After obtaining approval from the Institutional Review Board at Kansas State University, data were collected in two waves in March and September of 2015. The questionnaire link was distributed through 87 regional and national ornamental horticulture associations and trade publications or magazine email lists. Instructions to obtain a paper copy of the questionnaire were included in the email invitation to participate in the study. The link was also emailed to email addresses for ornamental horticulture businesses that could be collected from publicly-available directories of “live plant dealer licensees” in the North Central United States region, followed by two reminders sent at weekly intervals [14]. Participants were invited to enter into a drawing for two $50 Amazon (www.amazon.com, Seattle, WA) gift cards as an incentive to take the survey, as recommended by Dillman et al. [14]. At the beginning of the second wave, those with postal addresses received a postcard with the link, followed by two email reminders sent at weekly intervals to those with email addresses.
3. Results
3.1. Sample Characteristics
Of the 192 responses obtained, 161 were complete and were included in the subsequent analysis at a 95% confidence rate, which indicated a confidence interval of 7.68. Responses were obtained from all USDA National Agricultural Statistics Service regions, with the largest number of responses (40.5%) from the Northern Plains states where the survey was administered, followed by 15.7% from the Northeastern states. Sixty-five responses from the Northern Plains region would represent 10.3% of the establishments identified by the 2012 Economic Census. There were also four responses from Canada. Based on the zip codes of the business location, 42.9% were located in communities with less than 10,000 people.
Respondents represented businesses of various sizes, with a disproportionate number of businesses grossing sales over $500,000 annually (Table 1), compared to the distribution of horticultural specialty operations in the 2014 Census of Horticultural Specialties [17] across the sales categories. More than half (57.1%) of the businesses in the sample sold $500,000 or more in 2014, with the median response category of sales being between $500,000 and $1 million. In comparison, 8.7% sold less than $25,000. For reference, the average market value of products sold by nurseries, greenhouses, and floriculture farms, according to the 2012 Census of Agriculture, was $353,788 [3]. While the Census data are likely skewed to the right, suggesting the average would exceed the median, our sample was skewed to the left.
Most businesses (87.6%) in the sample were well established, having been in operation for more than 10 years. Overall, response categories were represented almost uniformly in the sample, with a small number of businesses having been in operation for more than 100 years (5.0%). Nearly two-thirds (64.0%) of businesses were open year-round.
The primary marketing channel was retail to consumers, accounting for 90% or more of total sales for half of the respondents (Table 2). The second most popular marketing channel was wholesalers to landscapers, other garden centers, and re-wholesalers. “Re-wholesalers” generally do not own production facilities, but instead buy products wholesale from producers to sell at a wholesale price to allied horticulture industry businesses, such as landscapers and garden centers. In contrast, 95.6% of respondents did not sell any of their products through the mass merchandisers’ channel. Respondents also reported selling up to 10% of their products through channels not listed in the questionnaire including construction and maintenance firms, municipalities, universities, and non-profit organizations.
Adopting the description of ornamental horticulture-industry products and services by Hall et al. [1], the questionnaire asked respondents to identify products and services their business offered. Consistent with the marketing channels, retail product offering was the most prevalent (Table 3). Within the retail product category, bedding and nursery stock was offered by 73.3% of respondents, followed by lawn and garden products (54.7%), general merchandise (54.0%), and landscape materials (42.2%). Bedding and nursery stock and landscape materials were the most common products among those who wholesaled. According to the 2012 Agricultural Census, nursery stock crops and bedding and garden plants were the highest valued ($5 billion and $3.6 billion, respectively) in ornamental horticulture industries [3]. Respondents mentioned various other activities including pottery, gift and jewelry retail, herbs, vegetables, pet shop, agritourism, educational services, and vocational training for individuals with disabilities.
Individuals who responded to the questionnaire on behalf of the businesses were on average 50 years of age, with slightly fewer female respondents (48.5%) than male respondents. More than half of the respondents held a baccalaureate degree (67.1%), with most (88.8%) attending some amount of college. Nearly two-thirds (63.4%) of the respondents were business owners, while 23.6% were managers. Thirteen respondents (8.1%) were marketing managers. This low representation of marketing managers might suggest that either owners or managers conduct their own marketing activities, including social media, or contract their marketing services to third-party consultants. Other respondent roles included extension master gardener, office manager, sales manager, and search engine optimizer. The majority (62.7%) of respondents had worked at the business for 10 years or more. Only 3.1% of the respondents had joined or owned the business within one year. Most owners (76%) had worked at their business for at least 10 years.
3.2. Marketing Practices
The extent of marketing efforts, in terms of expenses and hours, was asked in open-ended questions. Reported marketing expenses for 2014 ranged from $0 to $1 million, with an average of $53,050 and median of $10,000 (Table 4, first column). On the lower end, nearly half (42.9%) reported marketing expenses under $4,000, almost half (43.5%) of which reported less than $500. On the upper end, 11 businesses (6.8%) reported marketing expenses over $200,000. In terms of hours allocated to marketing efforts, the businesses reported spending on average 13.7 h per week performing various marketing activities, with half of the businesses spending four or fewer hours. Six businesses reported spending 40 to 60 h per week, suggesting two individuals were allocating at least half of their time to marketing, while five businesses reported more than 90 h per week, suggesting more than one full-time individual was assigned to marketing efforts.
Given the large disparity in size, businesses were grouped into three sales categories (less than $250,000, $250,000 to less than $1 million, and $1 million or more) for additional insight. The categories corresponded to intervals used in the Census report, placing 50, 41, and 70 businesses into the respective sales categories. Though the subsamples were too small to establish any statistical significance of differences observed, the categorization offered additional insight.
In Table 4, responses by the three groups are reported in respective columns. The average marketing expenses for the smallest businesses ($2,844) was 18.9% of that for the large businesses (grossing $250,000 or more, but less than $1 million), and 2.6% of that for the largest businesses (grossing $1 million or more). While there were businesses that spent at least 10% of their sales on marketing, there were some reporting $0 and zero hours for marketing efforts, even among businesses selling more than $1 million. Similarly, in terms of hours allocated to marketing efforts, the largest businesses had, on average, one half-time person tasked with marketing, while marketing activities at smaller businesses were mostly carried out by individuals with other primary tasks.
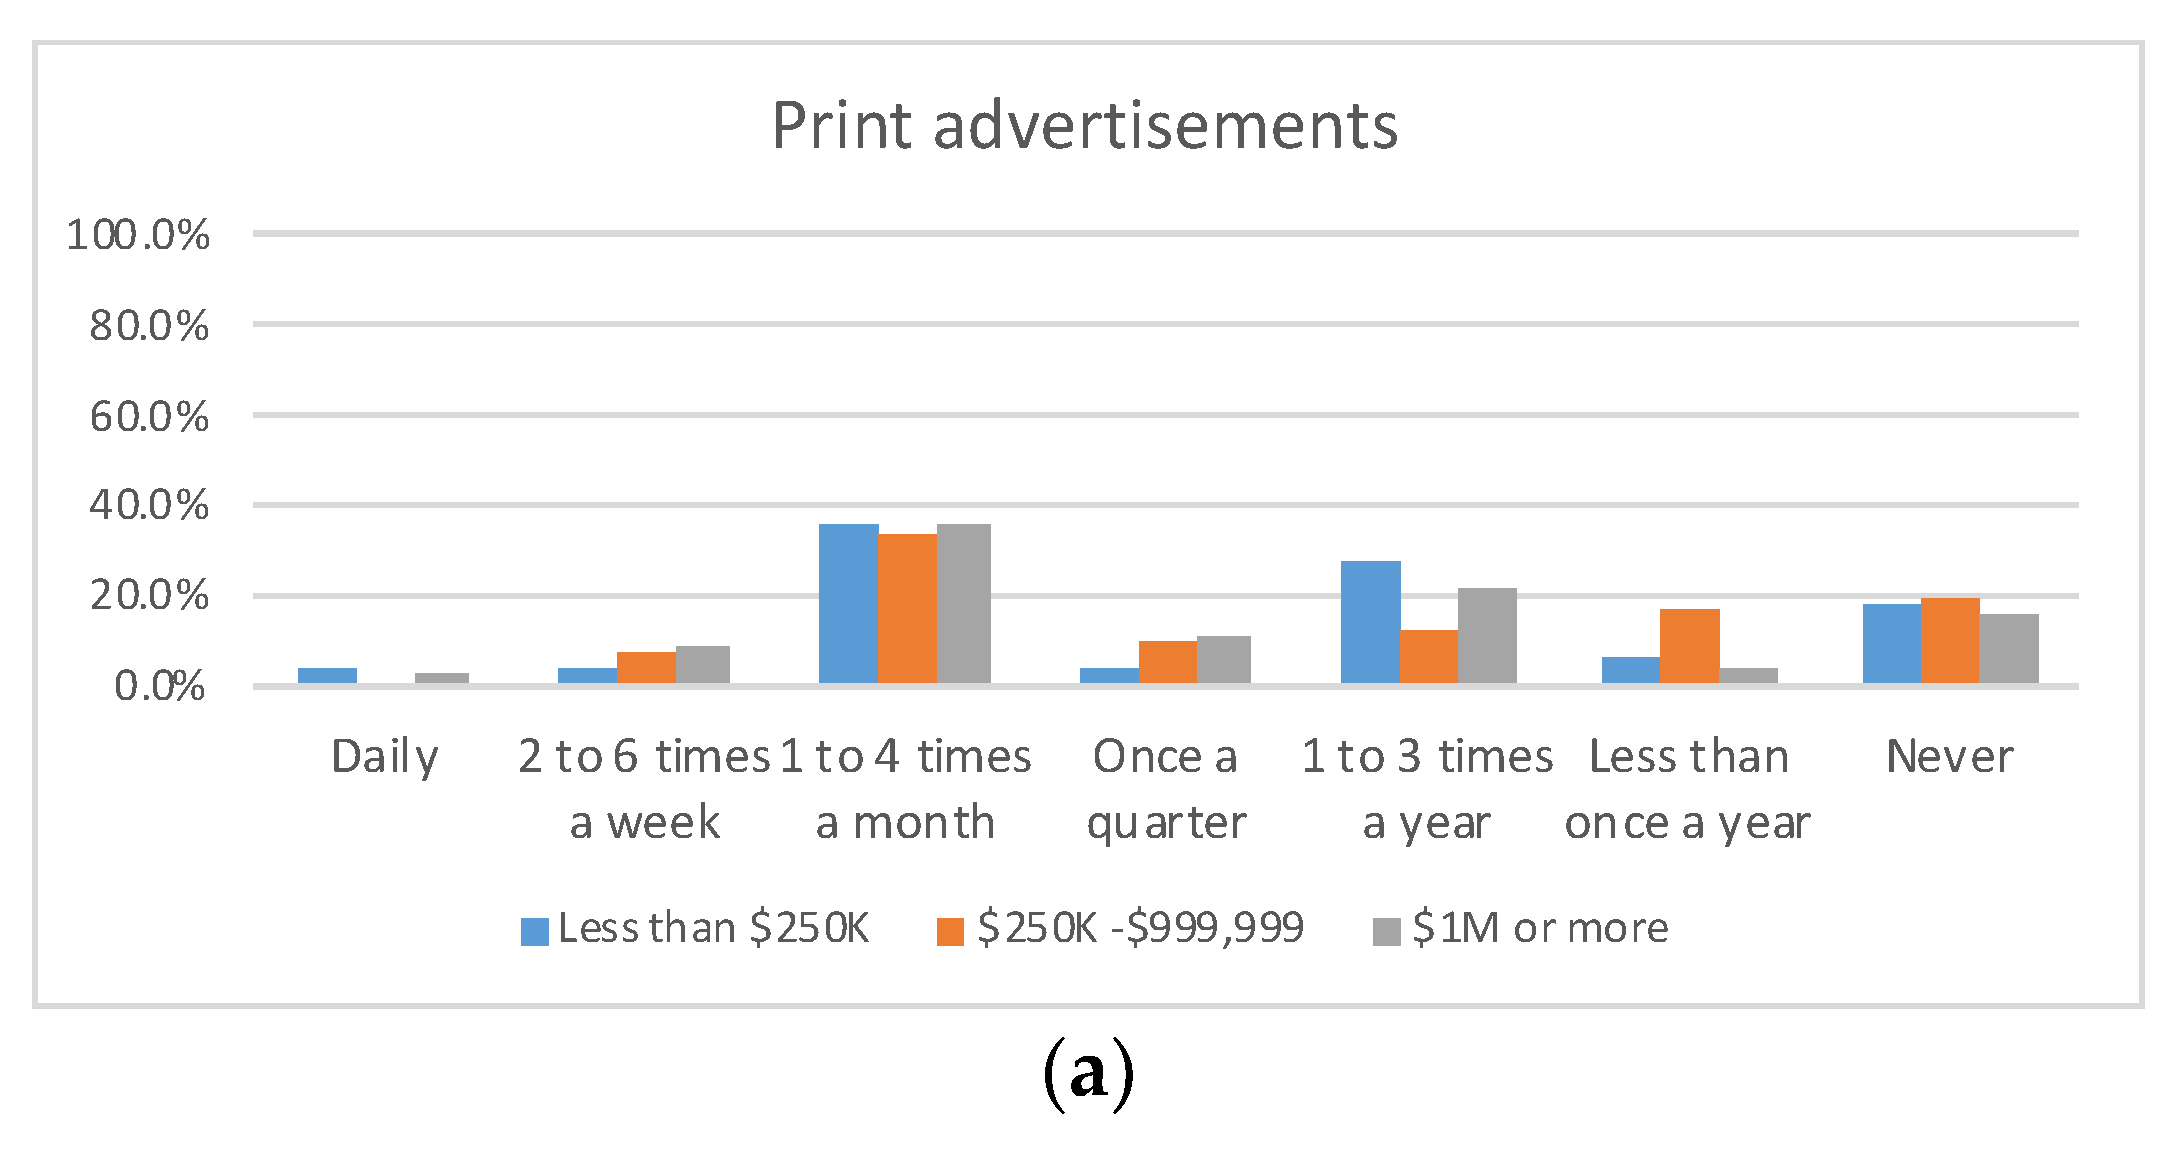
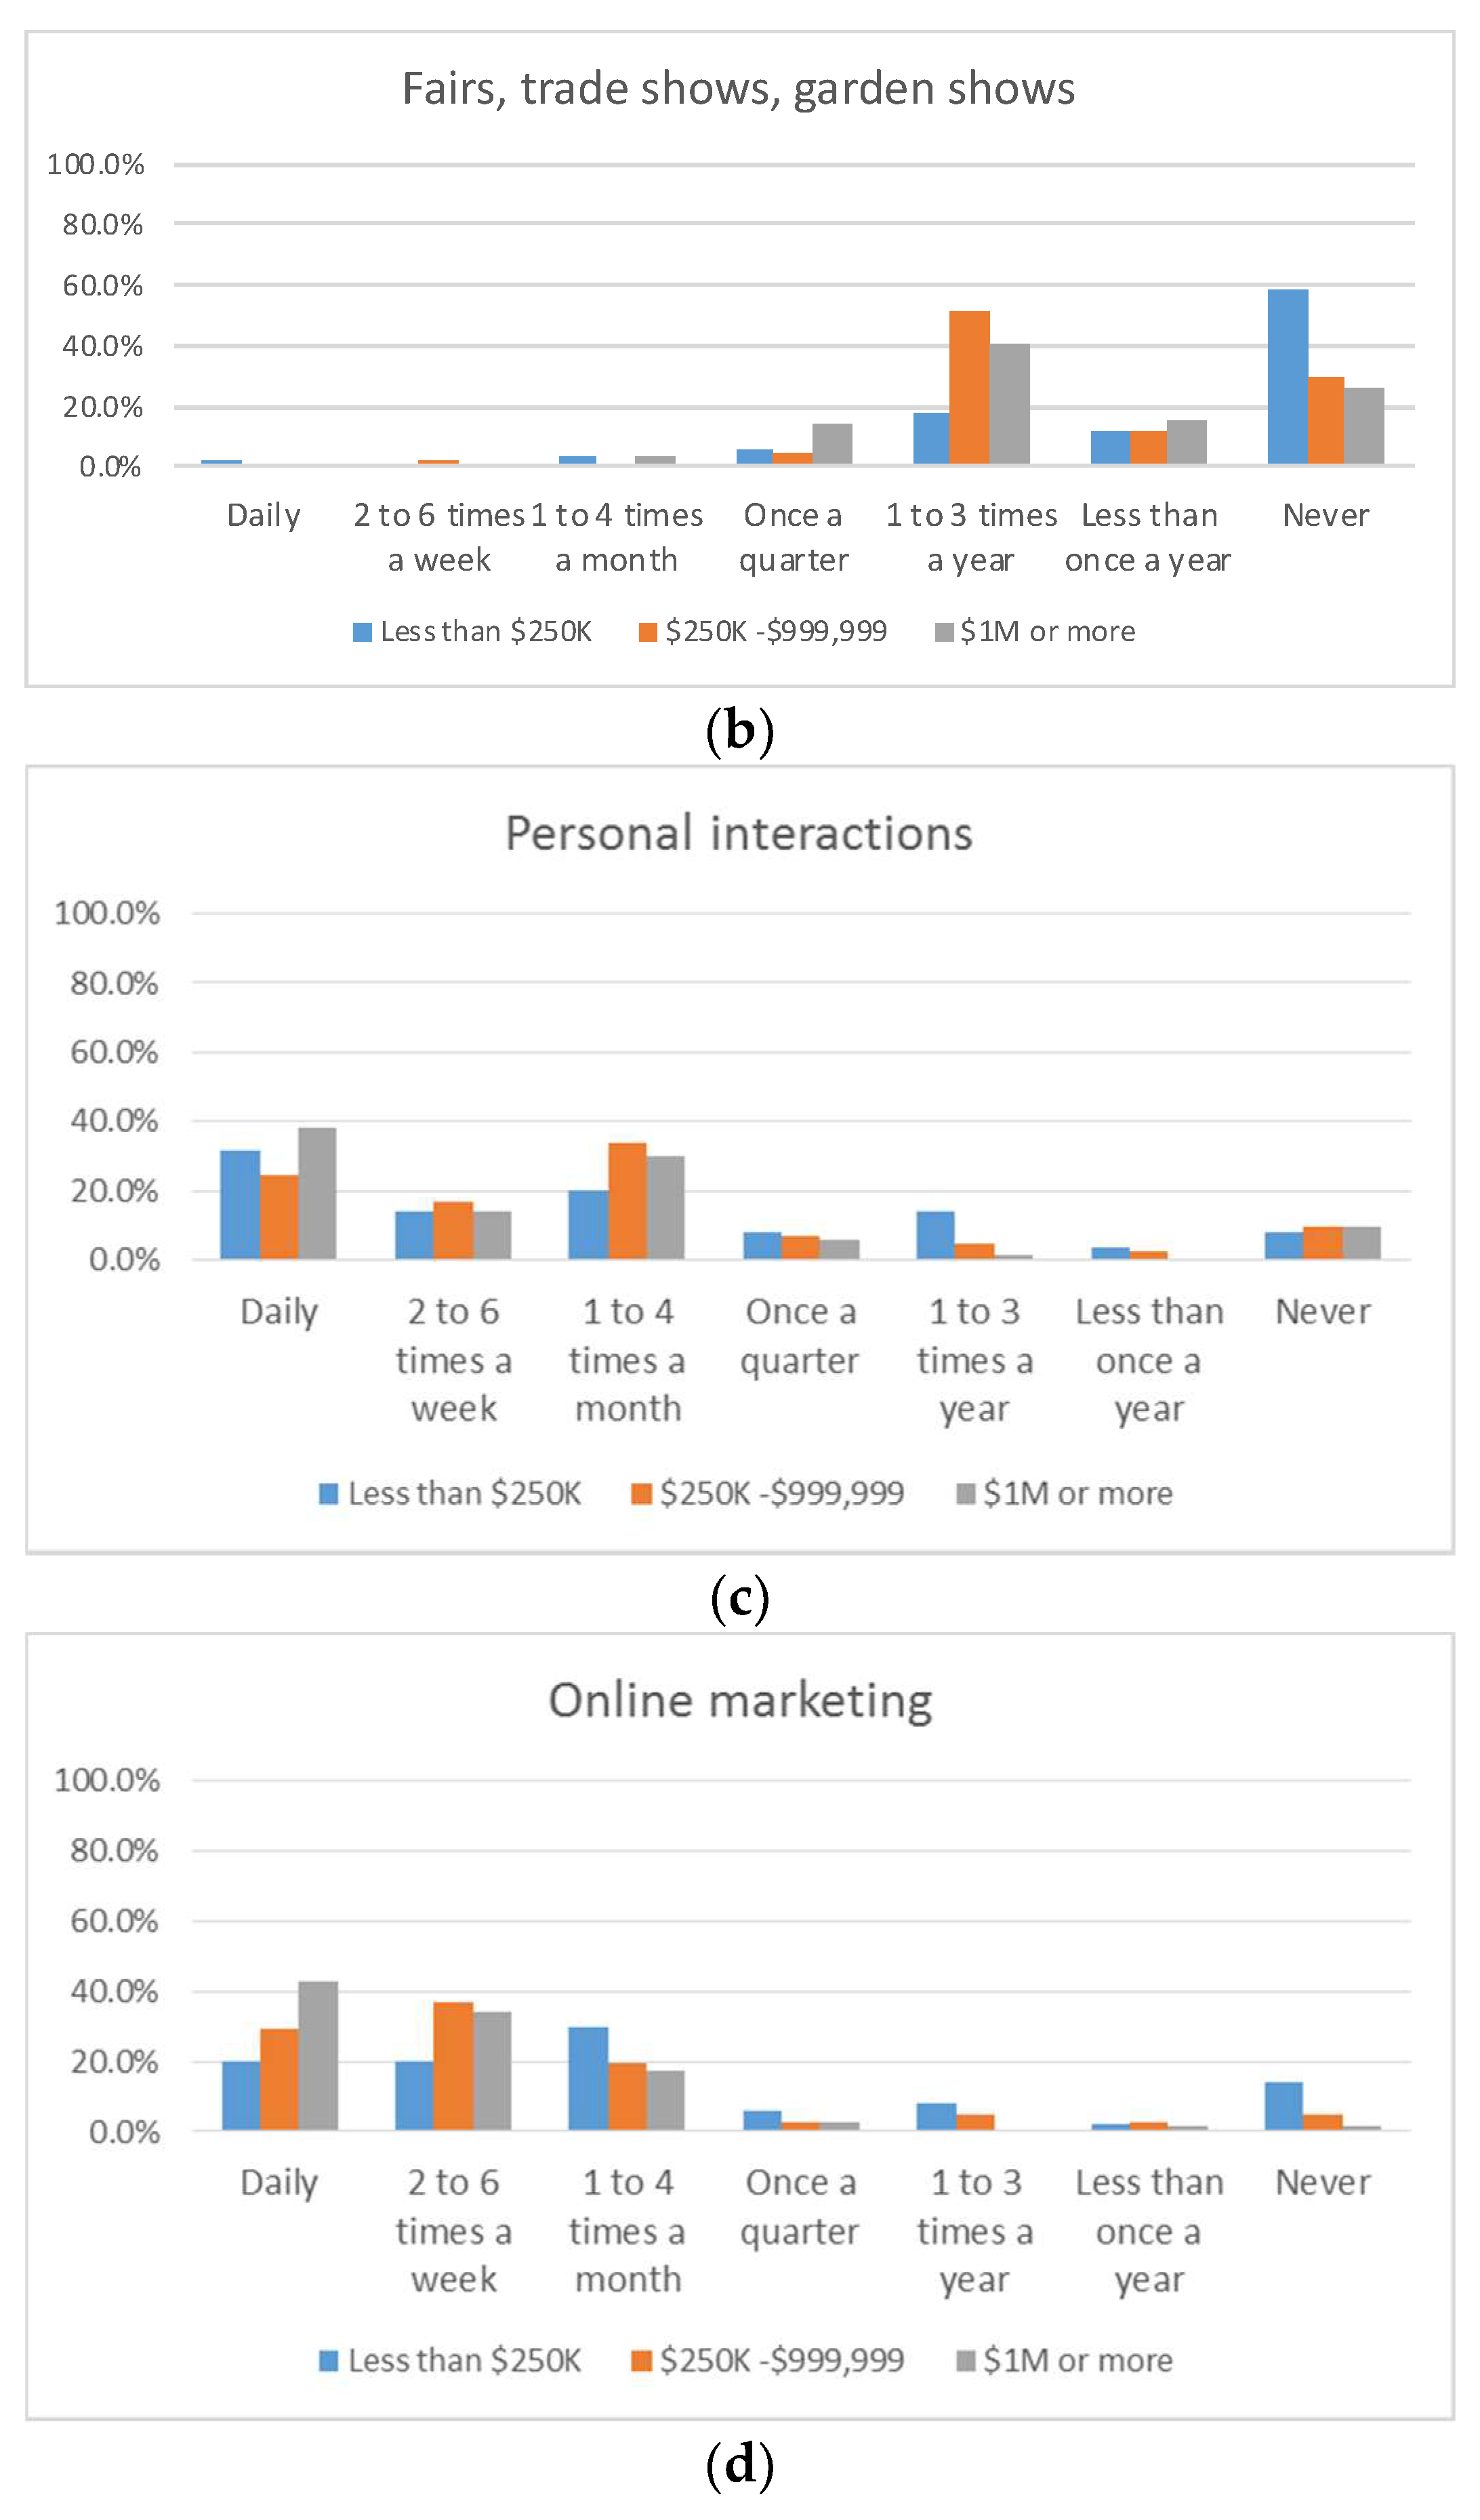
Figure 1 depicts the frequency of use of selected marketing channels for the smallest, large, and largest businesses. Use of print advertisements and personal interactions were relatively similar across the groups. About 35% of businesses used print advertisements one to four times per month, and 17% did not use these at all. Nearly half (47.8%) reported reaching out to their customers with phone calls, emails, and visits more than once a week. In contrast, use patterns varied by sales category for fairs and trade/garden shows and online marketing. Nearly 60% of businesses grossing $250,000 or more attended fairs and trade/garden shows at least once a year, whereas 58% of the smaller businesses never did. Average proportions of non-users of online marketing varied from 14% among smaller businesses to 5% of large businesses and 1.4% of the largest businesses. Among online marketing users, larger businesses used it more frequently than smaller businesses.
Delving deeper into use of online marketing, Table 5 summarizes the status of online-platform accounts used by businesses. Facebook was the predominant platform, regardless of business size (Table 5). The use of Twitter and blogs was limited among the smallest and large businesses, with blogs being the least popular platform for both size groups. Conversely, more than 40% of the largest businesses were actively using Twitter and blogs. The use of HTML newsletters was linearly associated with business size, currently by 30%, 54%, and 83% of the smallest, large, and largest businesses, respectively. The variation in use of blogs, Twitter, and HTML newsletters, between small, medium, and large business, might reflect that these tools require specific writing skills and a significant time commitment, for which only larger business can afford to seek out and allocate resources to actively and effectively use these platforms.
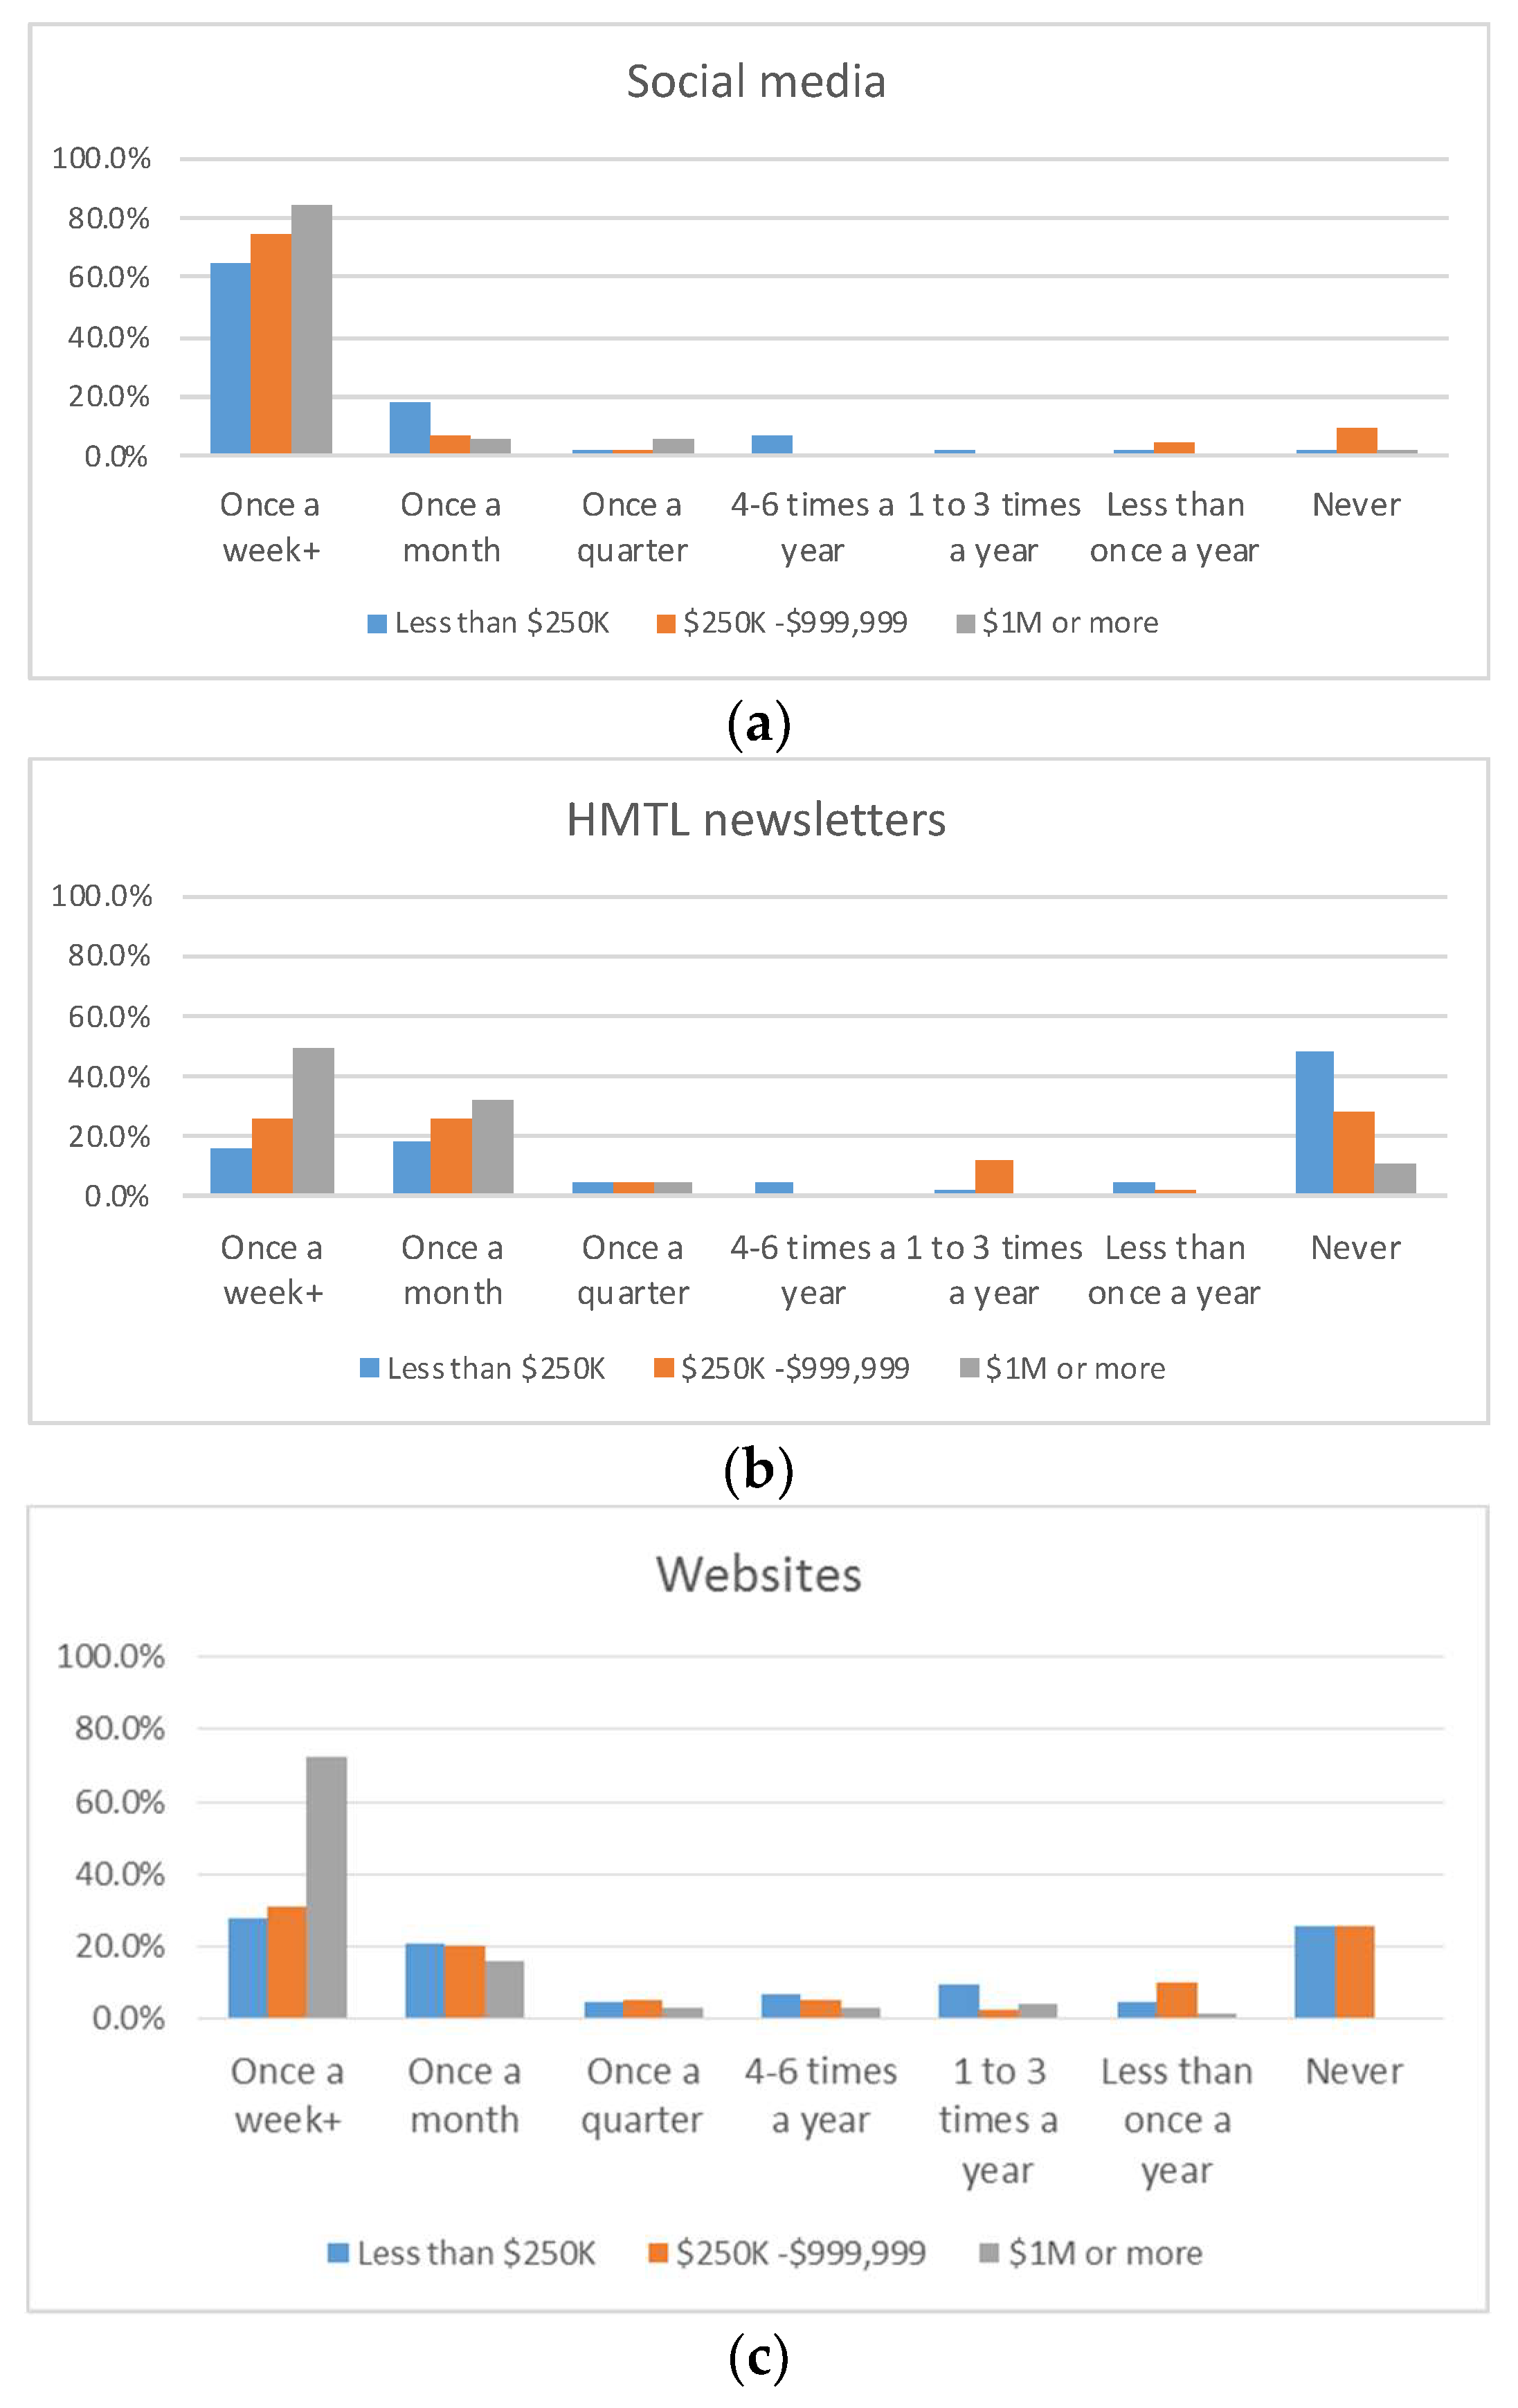
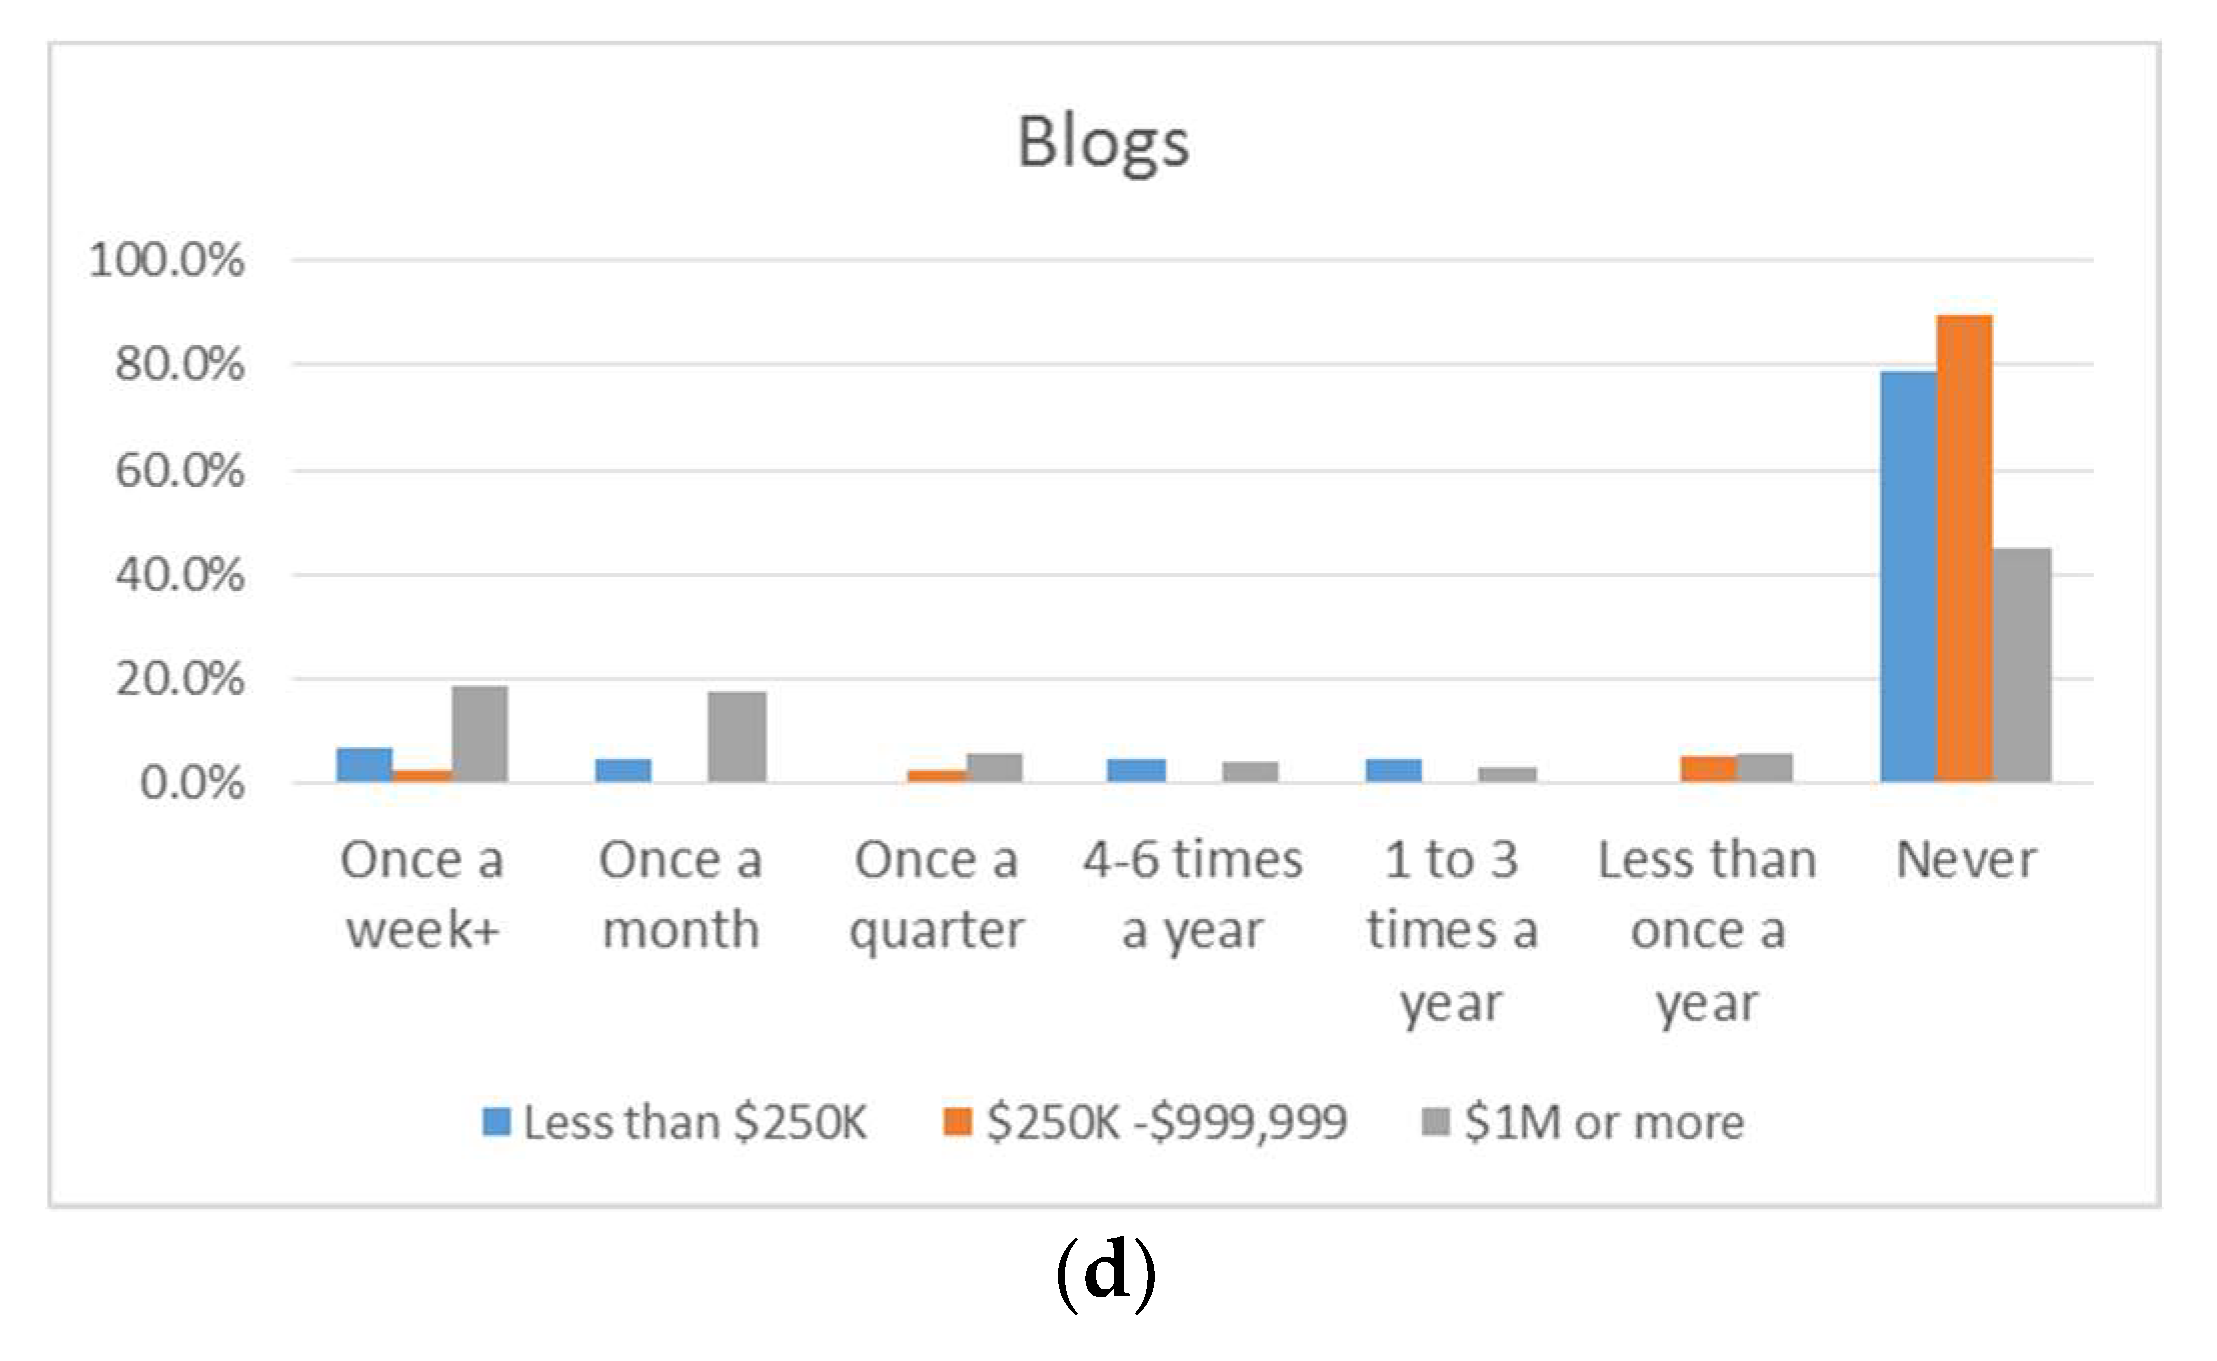
Figure 2 illustrates the frequency of use of online platforms to reach customers. The three charts show similar trends across platforms in all sales categories, with the most frequent activity being on social media, followed by websites, HTML newsletters, and blogs. In general, larger businesses used all platforms more frequently than smaller businesses, except a larger portion of the middle-size businesses were less frequently active on blogs than the smallest businesses. Overall, 76.2% of businesses used social media once a week or more, while 9.3% of businesses (14.0% of smaller businesses and about 7% of both groups of larger businesses) used social media once a quarter or less. Frequency of posting is a difficult concept to manage and depends on the needs of each businesses’ customer, but posting once a quarter may make it appear that a business is inactive and/or no longer in business [18,19].
Specifically related to social media, all businesses that engaged in online marketing reported using some form of social media, with the range of use from one to 15 years, and a median of five years. This may indicate that the sample included more businesses that had a social-media presence. Eighty-nine point six percent of businesses indicated their social-media account was created by the owner, manager, or an employee. Others (6.3%) received free help from friends or family, while a few (3.5%) hired a consultant or third-party company.
Twelve point six percent of respondents hired a third party to conduct their social-media activity in 2014. Social-media marketing expenses through consulting services averaged $11,700, representing 22% of total marketing expenses. This result indicated that new-media marketing generally received less attention from ornamental horticulture businesses than traditional marketing venues. The Pearson correlation coefficient between the amount allocated to social-media services and the sales dollar amount was 0.58, indicating that bigger firms allocated more resources to social-media marketing.
3.3. Perceptions of New-Media Marketing
To assess perceived usefulness of new-media marketing by ornamental horticulture industries, respondents were asked to rank online-marketing venues based on their perceived impacts on sales. Table 6 reports the aggregated response, because responses were similar across businesses of different size. The new-media marketing tool that received the largest percentage (45.0%) of first rankings was social media, followed by websites and HTML newsletters, which mirrors how intensively these channels are currently being used. The notable exception was HTML newsletters, which was not as frequently used but was ranked as having a relatively high impact. This may be reflective of the tool itself, as HTML newsletters typically follow an editorial calendar with release dates that vary [7].
Again, specifically on social media, respondents were asked to indicate its perceived importance on various aspects of the business, including customer engagement elements, using a five-point scale (Table 7). The strongest agreement was on its importance “to build a positive community with customers.” They also agreed on its importance “to have an active online presence” and “to educate consumers,” but the support was less among smaller businesses. This may be a result of smaller businesses investing less time in social media. Notably, it was the smallest businesses that believed in social media’s value “to improve sales” and “to increase customer traffic into the store.” Among the list of aspects provided to respondents, businesses placed the lowest value on social media as a means “to learn about the marketplace.” Results suggested the prevalence of perceptions, particularly among larger businesses, that social media is used only to push their messages out and are underutilizing it as a resource for two-way customer interaction.
3.4. Technical Environment
To understand their technical environment at work, respondents were asked to identify the type of internet connection available at the business location, as well as the device used for their new-media marketing activities. Regarding the type of connection, wireless (45.3%), cable (30.4%), and digital subscriber line (DSL) (24.2%) were the connections respondents reported using. Results also show that more than one type of connection was available in many businesses. Pertaining to the device used for new-media marketing, desktops (73.3%) and smartphones (62.1%) were the most prominent, followed by laptops (51.6%) and tablets (34.2%). Similar to the type of connection, businesses used more than one device for their new-media marketing activity.
As a measure of online activeness, respondents were asked for the number of businesses they followed online on a regular basis. The term “regularly” stressed a relatively permanent contact with the group. “Number of businesses monitored online” represents the breadth of their online network, a group from which the business owner or manager can learn online marketing tips or imitate what peers are doing by observing. For all businesses in the sample, the numbers of businesses were relatively uniformly distributed over the network size, from one to six, but the network size on average was bigger for larger businesses. One-third of the large and largest businesses had a network size of 10 or more, compared to 14.0% among the smallest businesses, and 8.7% of the largest businesses had a network size of 0 compared to 14.0% and 12.8% among the smallest and large businesses, respectively.
The individual’s technical environment at home was assessed by way of their personal use of social media, and the size of their personal online network was measured by the number of people (likes or friends on Facebook, Twitter, LinkedIn, etc.) they personally followed on a regular basis. More than half of the respondents (58.4%, n = 161) were daily social-media users, while only 11.2% did not use social media for personal purposes. There was a notably large proportion (22.0%) of individuals at large businesses who were non-users for personal purposes, and consequently had no personal online network. Otherwise, the size of the personal online network tended to be positively correlated with the size of the business, averaging 126 and 256 individuals among the smallest and the largest businesses, respectively.
3.5. Why Not Using New-Media Marketing
Although most respondents were new-media users, 17 ornamental horticulture businesses did not carry out marketing activities through new media. These respondents were asked to identify how applicable each reason, from a list, was for their business not using social-media marketing at that time. Results show that a preference for direct interactions with customers and lack of time were the two main reasons precluding businesses incorporating social media into their marketing efforts (Table 8). In contrast, 47% of non-social-media users reported that lack of training did not prevent them from using social media.
4. Discussion
Ornamental horticulture industries mirror other businesses in their use of online- and social-media marketing, with only 17 of the 161 businesses reporting that they did not use online tools to market to customers, and 144 (89.4%) of the businesses reporting using online and social media to market their business. This is similar to a 2014 national (U.S.) survey of marketers, with 2,800 respondents, where 89% had adopted social media for marketing purposes [10].
One striking feature of the study sample was its range in size of business. Responses showed clearly that marketing practices and the approach to new-media marketing vary by size of business. Any educational program to assist ornamental horticulture businesses with new-media marketing, as well as studies to examine the impact of new-media marketing efforts on business performance, must account for business size.
In contrast, rankings of various new-media channels regarding their perceived impact on sales were consistent across businesses of all sizes. The new-media channel that received the largest percentage of first rankings was social media, followed by websites and HTML newsletters, which mirrors how intensively these channels are currently being used. The notable exception is HTML newsletters, which was not as frequently used but was ranked as having a relatively high impact. A qualitative study of garden centers indicated this was a medium that businesses spent time planning to use strategically; that is, it would take more time to create and would be released less often, but it would be more impactful [7].
The respondents’ perceived importance of social media aligns with past findings. In particular, the strongest argument for using social-media marketing was due to its ability to build a positive community with customers, and the weakest argument of use was to learn about the marketplace, suggesting that garden centers were not learning about their customers online [7]. Notably, it was the smaller businesses that believed in social media’s value to improve sales and to increase customer traffic into the store. Whether social-media marketing is indeed effective in improving profits needs to be further examined. Stebner et al. [6] showed that both large and small businesses used social media to increase profits, even though they did not know if it actually was increasing their profits because they were not measuring it.
Larger businesses spent considerably more on marketing efforts and smaller businesses were spending markedly less, which was expected. While this study did not ask specifically about dollars allocated to new- and social-media marketing, it did ask about dollars spent on social-media consultants, which was 22% of the total marketing expenses. This may indicate that ornamental horticulture businesses are not allocating as many dollars, or focusing as much time, on new- and social-media marketing as traditional marketing, which aligns with Behe et al. [20]. It is also similar to the small and medium businesses surveyed in The Marketing in a Digital World Small- and Medium-Sized Business and Consumer Survey [11], which found a majority (59%) spent less than $100 to conduct social-media marketing. Social media offers a way for small businesses to compete with larger businesses through targeted social-media campaigns, building relationships with customers, and brand loyalty [8] with a lower investment than traditional media.
Although new-media marketing is increasingly being adopted by small and medium businesses, observations reveal little interest or understanding among rural ornamental horticulture businesses. Only a few maintain a social-media account or a website. For the non-users in the study, direct interactions with customers and lack of time were the two main reasons precluding them from incorporating new media into their marketing efforts. This is consistent with Stebner et al. [6], indicating businesses lacked time to use new media and that they enjoyed doing other aspects of their job more, such as interacting with customers in person. This study shows varying numbers of hours and expenses spent on new-media marketing, reflecting availability and allocation of resources. Other reasons for this seeming reticence could be lack of expertise, particularly related to new-media management, and risk aversion. New-media marketers faced five main issues related to social media management: Finding the most effective tactics, engaging audiences, measuring the return, picking the best management tools, and finding their target audience [10].
5. Conclusions
This study examined the current state of the use of new-media marketing among ornamental horticulture businesses. The sample of 161 businesses, while lacking in representativeness of those that are involved in new-media marketing without social media, offers insight that can be used to develop outreach programs or future research projects.
New-media marketing, with its cost structure and extensive reach, offers a game-changing opportunity, particularly for smaller businesses in ornamental horticulture industries. Studies suggest enormous potential if a new-media marketing strategy is skillfully employed. For example, the search for gardening information through the internet increased a customer’s likelihood to purchase horticultural products online by 19% [5]. The task ahead is for research efforts to assist the ornamental horticulture industries in identifying the most effective practices for its members of various size and by specific business type.
As with any study, there were some limitations that should be noted. The sampling in the study was limited to those business that responded, which resulted in 161 total usable responses. This offered a reasonable amount in order to generalize to the larger population, with a confidence interval of 7.68 at a 95% confidence rate. However, there are likely some businesses who do not match the findings in this study. Future work to build on this exploratory study should seek a stratified random sample across all ornamental horticulture business types. Additionally, there were some variables that would have been valuable to the study that were left out due to survey length. These include items such as details about business-type and economic data beyond self-reported data.
Author Contributions
H.P., C.B., and L.B. obtained funding, designed the study, and completed manuscript writing. B.Y. planned, deployed the survey, analyzed the data, and wrote the first draft of the manuscript. H.P. analyzed the data and revised the manuscript. C.B. assisted with survey deployment to stakeholders across the United States, corresponded, and finalized the manuscript.
Funding
This research was supported by the United States Department of Agriculture—Agricultural Marketing Service—Federal State Marketing Improvement Program (number 11402984), James L. Whitten Building 1400 Independence Ave., S.W. Washington, DC 20250. Contribution no. 16-338-J from the Kansas Agricultural Experiment Station.
Acknowledgments
The Kansas State University Center for Rural Enterprise Engagement coordinated research, teaching, and extension activities related to this project.
Conflicts of Interest
The authors declare no conflicts of interest.
References
- Hall, C.R.; Hodges, A.W.; Haydu, J.J. The economic impact of the green industry in the United States. HortTechnology 2006, 16, 345–353. [Google Scholar]
- Hodges, A.W.; Hall, C.R.; Palma, M.A. Economic contributions of the green industry in the United States in 2013. HortTechnology 2015, 25, 805–814. [Google Scholar]
- USDA. 2012 Census of Agriculture. 2014. Available online: Https://www.agcensus.usda.gov/Publications/2012/Full_Report/Volume_1,_Chapter_1_US/usv1.pdf (accessed on 1 May 2014).
- Hodges, A.W.; Khachatryan, H.; Hall, C.R.; Palma, M.A. Production and Marketing Practices and Trade Flows in the United States Green Industry, 2013; University of Florida Agricultural Experiment Station: Gainesville, FL, USA, 2015. [Google Scholar]
- Behe, B.K.; Campbell, B.L.; Hall, C.R.; Khachatryan, H.; Dennis, J.H.; Yue, C. Smartphone use and online search and purchase behavior of North Americans: Gardening and non-gardening information and products. HortScience 2013, 48, 209–215. [Google Scholar]
- Stebner, S.; Boyer, C.R.; Baker, L.M.; Peterson, H.H. Relationship marketing: A qualitative case study of new-media marketing use by Kansas garden centers. Horticulturae 2017, 3, 26. [Google Scholar] [CrossRef]
- Stebner, S.; Baker, L.M.; Peterson, H.H.; Boyer, C.R. Marketing with more: An in-depth look at relationship marketing with new media in the green industry. J. Appl. Commun. 2017, 101. [Google Scholar] [CrossRef]
- Verma, V.; Sharma, D.; Sheth, J. Does relationship marketing matter in online retailing? A meta-analytic approach. J. Acad. Mark. Sci. 2016, 44, 206–217. [Google Scholar] [CrossRef]
- Harvard Business Review. The New Conversation: Taking Social Media from Talk to Action; Harvard Business Review Analytics Services: Boston, MA, USA, 2010. [Google Scholar]
- Stelzner, M.A. 2014 Social Media Marketing Industry Report: How Marketers Are Using Social Media to Grow Their Businesses; Social Media Examiner: Poway, CA, USA, 2014. [Google Scholar]
- Karr, D. Marketing in a Digital World: Small- and Medium-Sized Business and Consumer Survey 2011 Infographic; DK New Media: Indianapolis, IN, USA, 2011; Available online: https://marketingtechblog.com/wp-content/uploads/2011/10/infographic-zoomerang-midw2011.pdf. (accessed on 12 October 2018).
- Onishi, H.; Manchanda, P. Marketing activity, blogging and sales. Intl. J. Res. Mark. 2012, 29, 221–334. [Google Scholar] [CrossRef]
- Topp, J.; Stebner, S.; Barkman, L.A.; Baker, L.M. Productive pinning: A quantitative content analysis determining the use of Pinterest by agricultural businesses and organizations. J. Appl. Commun. 2014, 98, 6–14. [Google Scholar] [CrossRef]
- Dillman, D.A.; Smyth, J.D.; Christian, L.M. Internet, Phone, Mail, and Mixed-Mode Surveys: The Tailored Design Method, 4th ed.; Wiley: Hoboken, NJ, USA, 2014; ISBN 978-1-118-45614-9. [Google Scholar]
- Krosnick, J.A. Response strategies for coping with the cognitive demands of attitude measures in surveys. Appl. Cogn. Psychol. 1991, 5, 213–236. [Google Scholar] [CrossRef]
- U.S. Census Bureau. 2012 Economic Census. 2016. Available online: https://www.census.gov/econ/census/ (accessed on 9 September 2016).
- USDA. 2014 Census of Horticultural Specialties. 2015. Available online: https://www.agcensus.usda.gov/Publications/2012/Online_Resources/Census_of_Horticulture_Specialties/ (accessed on 14 December 2015).
- Bly, R.W. The Marketing Plan Handbook: Develop Big-Picture Marketing Plans for Pennies on the Dollar, 2nd ed.; Entrepreneur Press: Irvine, CA, USA, 2015; ISBN 978-1-59918-559-0. [Google Scholar]
- Stamoulis, N. Reasons to Be Active in Social Media; Brick Marketing: Boston, MA, USA, 2017. Available online: http://www.brickmarketing.com/blog/active-social-media.htm. (accessed on 12 October 2018).
- Behe, B.K.; Dennis, J.H.; Hall, C.R.; Hodges, A.W.; Brumfield, R.G. Regional marketing practices in U.S. nursery production. HortScience 2008, 43, 2070–2075. [Google Scholar]
Figure 1.
Frequency of use of various traditional marketing venues by ornamental horticulture industry respondents in the study questionnaire: (a) print advertisements, (b) fairs/trade or garden shows, (c) personal interactions, and/or (d) online marketing. Categorized by 2014 sales: less than $250,000 (n = 50); $250,000–$999,999 (n = 41); and $1 million or more (n = 70).


Figure 2.
Frequency of use of new-media marketing tools by ornamental horticulture industry respondents in the study questionnaire: (a) Social media, (b) HTML newsletters, (c) websites, and (d) blogs. Categorized by 2014 sales: less than $250,000 (n = 43); $250,000–$999,999 (n = 39); and $1 million or more (n = 69).


Table 1.
Total gross business sales in 2014 of the ornamental horticulture industry respondents in the study.
Table 1.
Total gross business sales in 2014 of the ornamental horticulture industry respondents in the study.
| Total Gross Business Sales | (n = 161) | 2014 Census of Horticultural Specialties (n = 23,211) |
|---|---|---|
| Less than $25,000 | 8.7% | 24.9% |
| $25,000 to $49,999 | 6.8% | 18.1% |
| $50,000 to $99,999 | 3.7% | 16.3% |
| $100,000 to $249,999 | 11.8% | 14.4% |
| $250,000 to $499,999 | 11.8% | 9.2% |
| $500,000 to $999,999 | 13.7% | 6.9% |
| $1 million to $4,999,999 | 28.6% | 5.9% |
| $5 million or greater | 14.9% | 4.3% |
Table 2.
Distribution of 2014 business sales, across marketing channels, of ornamental horticulture industry respondents in the study questionnaire.
Table 2.
Distribution of 2014 business sales, across marketing channels, of ornamental horticulture industry respondents in the study questionnaire.
| Retail (Direct to Consumers) | Landscapers | Other Garden Centers | Re-Wholesalers | Mass Merchandisers | |
|---|---|---|---|---|---|
| % Sales | |||||
| Average | 69.6% | 12.0% | 5.4% | 3.1% | 0.3% |
| Median | 90.0% | 4.0% | 0.0% | 0.0% | 0.0% |
| Min | 0.0% | 0.0% | 0.0% | 0.0% | 0.0% |
| Max | 100.0% | 100.0% | 100.0% | 90.0% | 10.0% |
Table 3.
The percentage of ornamental horticulture industry respondents that indicated they carry these general categories of items or provide these services.
Table 3.
The percentage of ornamental horticulture industry respondents that indicated they carry these general categories of items or provide these services.
| Categories | (n = 161) |
|---|---|
| Retail bedding and nursery stock | 73.3% |
| Greenhouse/annuals | 58.4% |
| Retail lawn and garden products | 54.7% |
| Retail general merchandise | 54.0% |
| Retail landscape materials | 42.2% |
| Nursery container and field | 41.0% |
| Landscape services/build | 34.8% |
| Landscape architecture/design | 28.6% |
| Wholesale bedding and nursery stock | 26.7% |
| Retail garden equipment | 17.4% |
| Wholesale landscape materials | 13.7% |
| Other (specify) | 11.8% |
| Retail florist and florist supplies | 10.6% |
| Retail food and beverage | 9.9% |
| Lawn and garden equipment | 6.2% |
| Wholesale lawn and garden products | 6.2% |
| Wholesale florist and florist supplies | 2.5% |
| Wholesale garden equipment | 1.2% |
Table 4.
Marketing efforts of ornamental horticulture industry, in terms of expenses and hours allocated, as reported by respondents in the study questionnaire.
Table 4.
Marketing efforts of ornamental horticulture industry, in terms of expenses and hours allocated, as reported by respondents in the study questionnaire.
| Full Sample | Less than $250,000 in 2014 Sales | $250,000 to $999,999 in 2014 Sales | $1 Million or More in 2014 Sales | |
|---|---|---|---|---|
| n | (n = 161) | (n = 50) | (n = 41) | (n = 70) |
| Annual expense | ||||
| Average | $53,050 | $2844 | $15,081 | $111,150 |
| Median | $10,000 | $875 | $10,000 | $50,000 |
| Min | $0 | $0 | $100 | $0 |
| Max | $1,000,000 | $25,000 | $60,000 | $1,000,000 |
| Weekly hours allocated | ||||
| Average | 13.7 | 4.0 | 8.3 | 23.7 |
| Median | 4.0 | 2.0 | 2.5 | 8.0 |
| Min | 0.0 | 0.0 | 0.0 | 0.0 |
| Max | 200.0 | 20.5 | 50.0 | 200.0 |
Table 5.
Status of online platform accounts of ornamental horticulture industry respondents in the study questionnaire.
Table 5.
Status of online platform accounts of ornamental horticulture industry respondents in the study questionnaire.
| HTML Newsletters | Websites | Blogs | ||||
|---|---|---|---|---|---|---|
| % Responses | ||||||
| Full sample (n = 161) | ||||||
| Currently using | 91.4% | 29.8% | 60.3% | 81.5% | 23.2% | |
| No longer active | 5.3% | 26.5% | 6.0% | 7.3% | 15.9% | |
| Never signed up | 3.3% | 43.7% | 33.8% | 11.3% | 60.9% | |
| Less than $250,000 in 2014 sales (n = 50) | ||||||
| Currently using | 90.7% | 20.9% | 30.2% | 69.8% | 9.3% | |
| No longer active | 4.7% | 20.9% | 14.0% | 7.0% | 11.6% | |
| Never signed up | 4.7% | 58.1% | 55.8% | 23.3% | 79.1% | |
| $250,000 to $999,999 in 2014 sales (n = 41) | ||||||
| Currently using | 84.6% | 12.8% | 53.8% | 71.8% | 5.1% | |
| No longer active | 10.3% | 30.8% | 2.6% | 12.8% | 15.4% | |
| Never signed up | 5.1% | 56.4% | 43.6% | 15.4% | 79.5% | |
| $1 million or more in 2014 sales (n = 70) | ||||||
| Currently using | 95.7% | 44.9% | 82.6% | 94.2% | 42.0% | |
| No longer active | 2.9% | 27.5% | 2.9% | 4.3% | 18.8% | |
| Never signed up | 1.4% | 27.5% | 14.5% | 1.4% | 39.1% | |
Table 6.
Ranking of perceived impacts on sales of ornamental horticulture industry respondents in the study questionnaire (n = 131).
Table 6.
Ranking of perceived impacts on sales of ornamental horticulture industry respondents in the study questionnaire (n = 131).
| New-Media Marketing Tools | % Responses | |||||
|---|---|---|---|---|---|---|
| First | Second | Third | Fourth | Fifth | ||
| Websites | 26.0% | 33.6% | 30.5% | 8.4% | 1.5% | |
| HTML newsletters (e.g., Constant Contact, MailChimp) | 26.0% | 27.5% | 24.4% | 18.3% | 3.8% | |
| Blogs | 0.8% | 7.6% | 17.6% | 58.8% | 15.3% | |
| Social-media platforms (Facebook, Twitter, etc.) | 45.0% | 25.2% | 22.9% | 6.1% | 0.8% | |
| Other | 2.3% | 6.1% | 4.6% | 8.4% | 78.6% | |
Table 7.
Perceived importance of social media by ornamental horticulture industry respondents in the study questionnaire a.
Table 7.
Perceived importance of social media by ornamental horticulture industry respondents in the study questionnaire a.
| Full Sample | Less Than $250,000 in 2014 Sales | $250,000 to $999,999 in 2014 Sales | $1 Million or More in 2014 Sales | $250,000 or More in 2014 Sales | |
|---|---|---|---|---|---|
| (n = 144) | (n = 42) | (n = 41) | (n = 70) | (n = 102) | |
| To build a positive community with customers | 4.22 | 4.24 | 4.14 | 4.24 | 4.21 |
| To have an active online presence | 4.14 | 4.05 | 4.09 | 4.22 | 4.18 |
| To educate customers | 4.06 | 4.00 | 3.91 | 4.18 | 4.09 |
| To improve sales | 3.93 | 4.21 | 3.83 | 3.81 | 3.81 |
| To increase customer traffic into the store | 3.92 | 4.12 | 3.80 | 3.87 | 3.84 |
| To learn about the marketplace | 3.51 | 3.64 | 3.23 | 3.58 | 3.46 |
a Average scores: 1 = “not at all important,” 2 = “slightly important,” 3 = “moderately important,” 4 = “quite important,” and 5 = “extremely important”.
Table 8.
Reasons “why not using social-media marketing” of ornamental horticulture industry respondents in the study questionnaire a.
Table 8.
Reasons “why not using social-media marketing” of ornamental horticulture industry respondents in the study questionnaire a.
| Reasons | (n = 17) |
|---|---|
| I would prefer face-to-face interactions with my customers. | 4.06 |
| I don’t have time. | 3.47 |
| Returns from social-media marketing are low. | 3.35 |
| Returns from social-media marketing are uncertain. | 3.29 |
| My customers do not think it is important. | 3.24 |
| It is a costly investment. | 2.88 |
| I do not think it is important. | 2.88 |
| Technology changes so quickly that I cannot keep up with it. | 2.76 |
| I do not know how to get started. | 2.65 |
a Average scores: 1 = “strongly disagree,” 2 = “disagree,” 3 = “neither agree or disagree,” 4 = “agree,” and 5 = “strongly agree.”
© 2018 by the authors. Licensee MDPI, Basel, Switzerland. This article is an open access article distributed under the terms and conditions of the Creative Commons Attribution (CC BY) license (http://creativecommons.org/licenses/by/4.0/).
Share and Cite
MDPI and ACS Style
Peterson, H.H.; Boyer, C.R.; Baker, L.M.; Yao, B.H. Trends in the Use of New-Media Marketing in U.S. Ornamental Horticulture Industries. Horticulturae 2018, 4, 32. https://doi.org/10.3390/horticulturae4040032
AMA Style
Peterson HH, Boyer CR, Baker LM, Yao BH. Trends in the Use of New-Media Marketing in U.S. Ornamental Horticulture Industries. Horticulturae. 2018; 4(4):32. https://doi.org/10.3390/horticulturae4040032
Chicago/Turabian StylePeterson, Hikaru H., Cheryl R. Boyer, Lauri M. Baker, and Becatien H. Yao. 2018. "Trends in the Use of New-Media Marketing in U.S. Ornamental Horticulture Industries" Horticulturae 4, no. 4: 32. https://doi.org/10.3390/horticulturae4040032
Note that from the first issue of 2016, this journal uses article numbers instead of page numbers. See further details here.