Article

The Effect of Biostimulants on Fruit Quality of Processing Tomato Grown under Deficit Irrigation

by
Vasiliki Liava
1,†,
Christina Chaski
1,†,
Mikel Añibarro-Ortega
2,3,
Alexis Pereira
2,3,
José Pinela
2,3,
Lillian Barros
2,3,* and
Spyridon A. Petropoulos
1,*
1
Laboratory of Vegetable Production, University of Thessaly, Fytokou Street, 38446 Volos, Greece
2
Centro de Investigação de Montanha (CIMO), Instituto Politécnico de Bragança, Campus de Santa Apolónia, 5300-253 Bragança, Portugal
3
Laboratório Associado para a Sustentabilidade e Tecnologia em Regiões de Montanha (SusTEC), Instituto Politécnico de Bragança, Campus de Santa Apolónia, 5300-253 Bragança, Portugal
*
Authors to whom correspondence should be addressed.
These authors contributed equally to this work.
Horticulturae 2023, 9(11), 1184; https://doi.org/10.3390/horticulturae9111184
Submission received: 3 October 2023 / Revised: 21 October 2023 / Accepted: 25 October 2023 / Published: 30 October 2023
(This article belongs to the Special Issue Irrigation in Horticulture Production: Latest Advances and Prospects)

Abstract

:
Water shortage can be a restrictive factor for the growth and quality of vegetable crops. Considering the alleviating effects of biostimulant application against water stress, this study aimed to investigate the effect of four biostimulant products (protein and amino acids with carboxylic acids (Tr1); protein and amino acids with seaweed extracts (Tr2); humic and fulvic acids with seaweed extracts (Tr3); SiO2 (Tr4); and control (no biostimulants added)) and two irrigation systems (regulated deficit irrigation (RDI)—65% of field capacity and regular irrigation (RI)—100% of field capacity) on quality parameters of processing tomato fruit. Regulated deficit irrigation and biostimulant application increased the energetic value, carbohydrates, and free sugars content, while organic acids showed a variable response to biostimulant use. In terms of tocopherols (α-, β-, γ-, δ-) and carotenoids (lycopene and β-carotene), regular irrigation and biostimulant application negatively affected their content, while Tr3 treatment had a beneficial impact on these lipophilic compounds under RDI conditions. The main fatty acids were palmitic (C16:0) and linoleic (C18:2n6) acids, which increased when plants were treated with Tr3 and Tr1 biostimulants under a deficit regime. Antioxidant activity (assessed by TBARS and OxHLIA assays) and total phenolic and flavonoids content also showed a variable response to the studied factors. In particular, the application of Tr3 and the control treatment under RDI increased the total phenolic content, while the control and Tr3 treatments under the same irrigation regime recorded the highest antioxidant activity. In conclusion, our results indicate that the adoption of eco-friendly strategies such as regulated deficit irrigation and biostimulant application can beneficially affect the quality traits of processing tomatoes.

1. Introduction

Tomato (Solanum lycopersicum L.) belongs to the Solanaceae family and is one of the most consumable vegetables worldwide [1]. This fruit has high nutritional value due to its rich content in carbohydrates, mainly free sugars, and also dietary fiber, protein, and lipids [2,3,4]. The most important fatty acids are palmitic and linoleic acids, followed by oleic, linolenic, and stearic acids in descending order [4]. Moreover, tomatoes contain minerals such as magnesium (Mg), phosphorus (P), and calcium (Ca) and vitamins such as B1, B2, B3, B5, and B6 [2]. They also have great antioxidant activity owing to carotenoids such as β-carotene, lycopene, and lutein [5], which increases their value as a functional food product [6].
Recent changes in climate conditions have led to an increase in global temperature and uneven distribution of annual precipitation [7,8], imposing extreme environmental stresses on plants [9]. The limited availability of irrigation water throughout the growing period requires the redesign of commonly applied farming practices [10], and farmers need to shift to new, more sustainable cultivation methods [11]. In response to water shortage, sustainable use of water resources through the adoption of water deficit irrigation scenarios could save large amounts of water in the Mediterranean region [12,13,14,15]. Deficit irrigation is an irrigation management strategy based on supplying water at levels lower than the crop requirements at specific growth stages, thus helping to achieve water saving, while the plants deal with regulated stress [16,17,18]. In particular, the proper use of deficit irrigation not only improves water use efficiency but may also lead to balanced yield and fruit quality, as soon as the impact of regulated water stress on tomato fruit quality has been properly established [19,20,21]. For instance, the application of mild water stress in tomato plants beneficially affected irrigation water use efficiency (IWUE) without resulting in reduced yield compared to untreated (control) plants. [22]. In general, controlled deficit irrigation strategies may affect fruit quality through the induction of bioactive compounds accumulation which may beneficially affect consumers’ health [19]. Recent reports suggested that the application of deficit irrigation in tomato crops may increase the accumulation of carotenoids [23], reducing sugars, soluble solids content, total acids, and vitamin C and enhancing their taste and sweetness [24]. Moreover, water deficit can increase antioxidant activity, total flavonoids and total phenolic compounds content, and further increase the bioactive properties of tomato fruit [19].
Non-microbial biostimulants are complex products that contain various compounds of natural origin [25] and can be categorized into three main classes: humic substances, seaweed extracts, and products that contain hydrolyzed proteins and amino acids [26,27]. The application of biostimulants on crops is a novel agronomic tool that can be integrated in a green and sustainable crop production strategy [28], while recently they have been extensively used in horticultural crops to improve their yield and quality and minimize the negative effects of abiotic stresses through improving stress tolerance [9,29,30]. Their beneficial effects on crops could be attributed to the adjustment of plant metabolic processes that are involved in stress responses [31], the improvement of nutrients and water use efficiency, and the increase of tolerance to biotic and abiotic stresses [26]. Particularly in tomato crops, biostimulant products based on seaweed extracts and protein hydrolysates have been associated with improvement in plant growth, yield, and quality of fruit under drought stress and deficit irrigation [18,32,33,34,35,36]. Moreover, Wang et al. [34] suggested that animal-derived biostimulants (pig blood-derived protein hydrolysate) may alleviate the negative effects of water stress through the regulation of photosynthetic processes and osmoregulation, as well as by triggering the antioxidant mechanisms of tomato plants. Similarly, Rouphael et al. [37] reported that the application of a legume-derived protein hydrolysate (Trainer®) may improve the fruit yield and quality of greenhouse tomato, while Ascophyllum nodosum extracts (Rygex (R) and Super Fifty (SF)) may allow tomato plants to cope and adapt to salinity stress and eventually improve plant growth and fruit quality. The application of a plant-based biostimulant that contained flavonoids and organic acids on the foliage of tomato subjected to stress conditions showed protective effects on the functions of photosynthetic machinery [28], while Francesca et al. [38] reported that protein hydrolysates promoted hormonal biosynthesis in tomato plants grown under heat, drought, or combined stress. Alfosea-Simón et al. [39] also highlighted the importance of amino-acid-based biostimulants in sustainable cropping systems through the reduction of agrochemical inputs. Biostimulants with complex composition such as Kendal Root that contains Ascophyllum nodosum and plant extracts or fulvic acids of various sources may alter morphological and physiological parameters and ultimately improve the yield and quality of tomato fruit in a dose-dependent manner [1,31]. Other studies also suggested the over-expression of genes that regulate physiological functions (e.g., cell homeostasis, carbohydrates translocation and metabolism and stomatal closure, nutrients metabolism osmotic regulation) following the application of biostimulants containing magnesium and polyphenols [40] or calcium [41]. Therefore, their application could counterbalance the negative impacts of climate change, improving the sustainability of agricultural and horticultural production systems and reducing inputs of valuable resources [39,40,42,43,44]. In the present study, a field experiment was carried out to evaluate the effect of biostimulant application and regulated deficit irrigation on the chemical composition and fruit quality of processing tomato. For this purpose, four biostimulant treatments combined with two irrigation systems were tested, aiming to evaluate their potential use in sustainable agronomic practices.

2. Materials and Methods

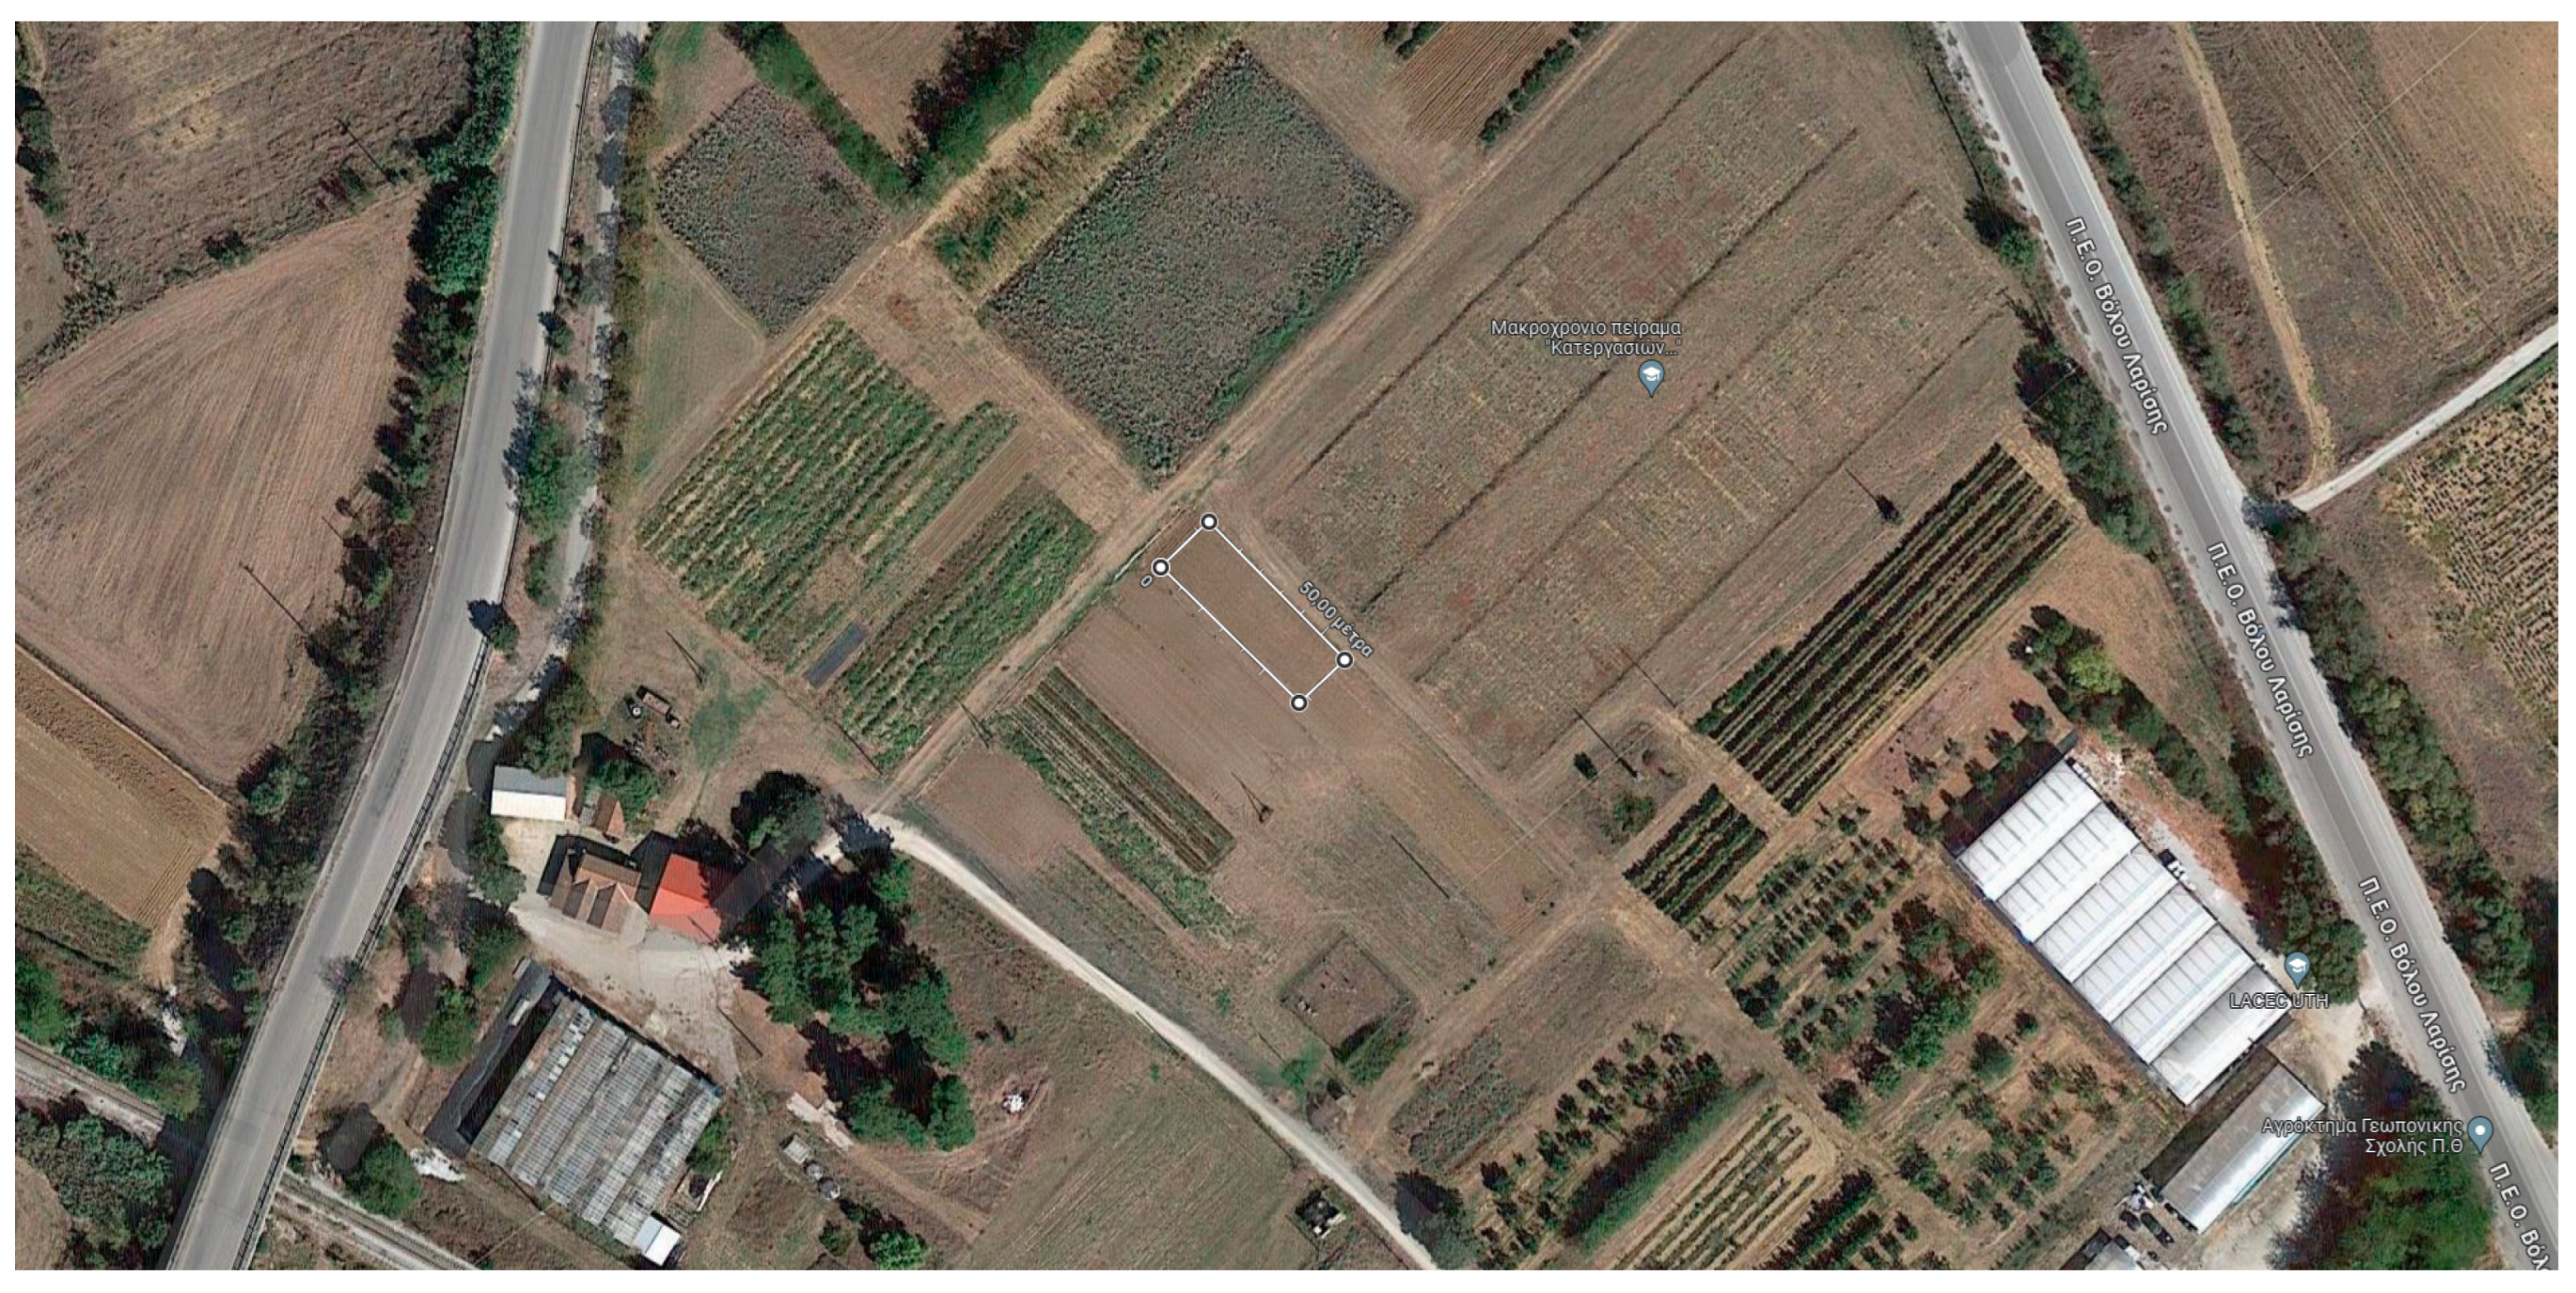
2.1. Description of Biostimulant Treatments and Experimental Design

The research was conducted at the University of Thessaly’s experimental farm during the spring–summer growing season of 2021, in Velestino Greece (22.756 E, 39.395 N; Figure 1). Τomato seedlings (Solanum lycopersicum L. cv. Heinz 1162) were transplanted in the field on May 14, while harvest took place on August 6. Each experimental plot was 10 m2, and plants were planted in rows at a distance of 0.75 × 0.45 m (plant density of approximately 30,000 plants ha−1). The soil was sandy clay loam (48% sand, 29% silt, and 23% clay), with pH 7.4 (1:1; soil:H20) and organic matter 1.3%. Four formulations of biostimulants were used, namely Tr1: proteins (20%), free L-amino acids (11%), short chain peptides (24%) of plant origin + carboxylic acids (5%); Tr2: proteins (20%), free L-amino acids (11%), short chain peptides (24%) of plant origin + algae extract (Laminaria digitata + Ascophyllum nodosum); Tr3: humic and fulvic acids balanced solution + algae extract (Laminaria digitata + Ascophyllum nodosum); Tr4: SiO2 (92%; w/w). All treatments were applied by foliar spraying; plus for the control treatment (C: no biostimulants added) plants were sprayed with water. All plants were spayed until runoff. Four applications were implemented throughout the growing period at regular intervals of 15 days, e.g., two applications before flowering and two more after fruit setting and before harvest.

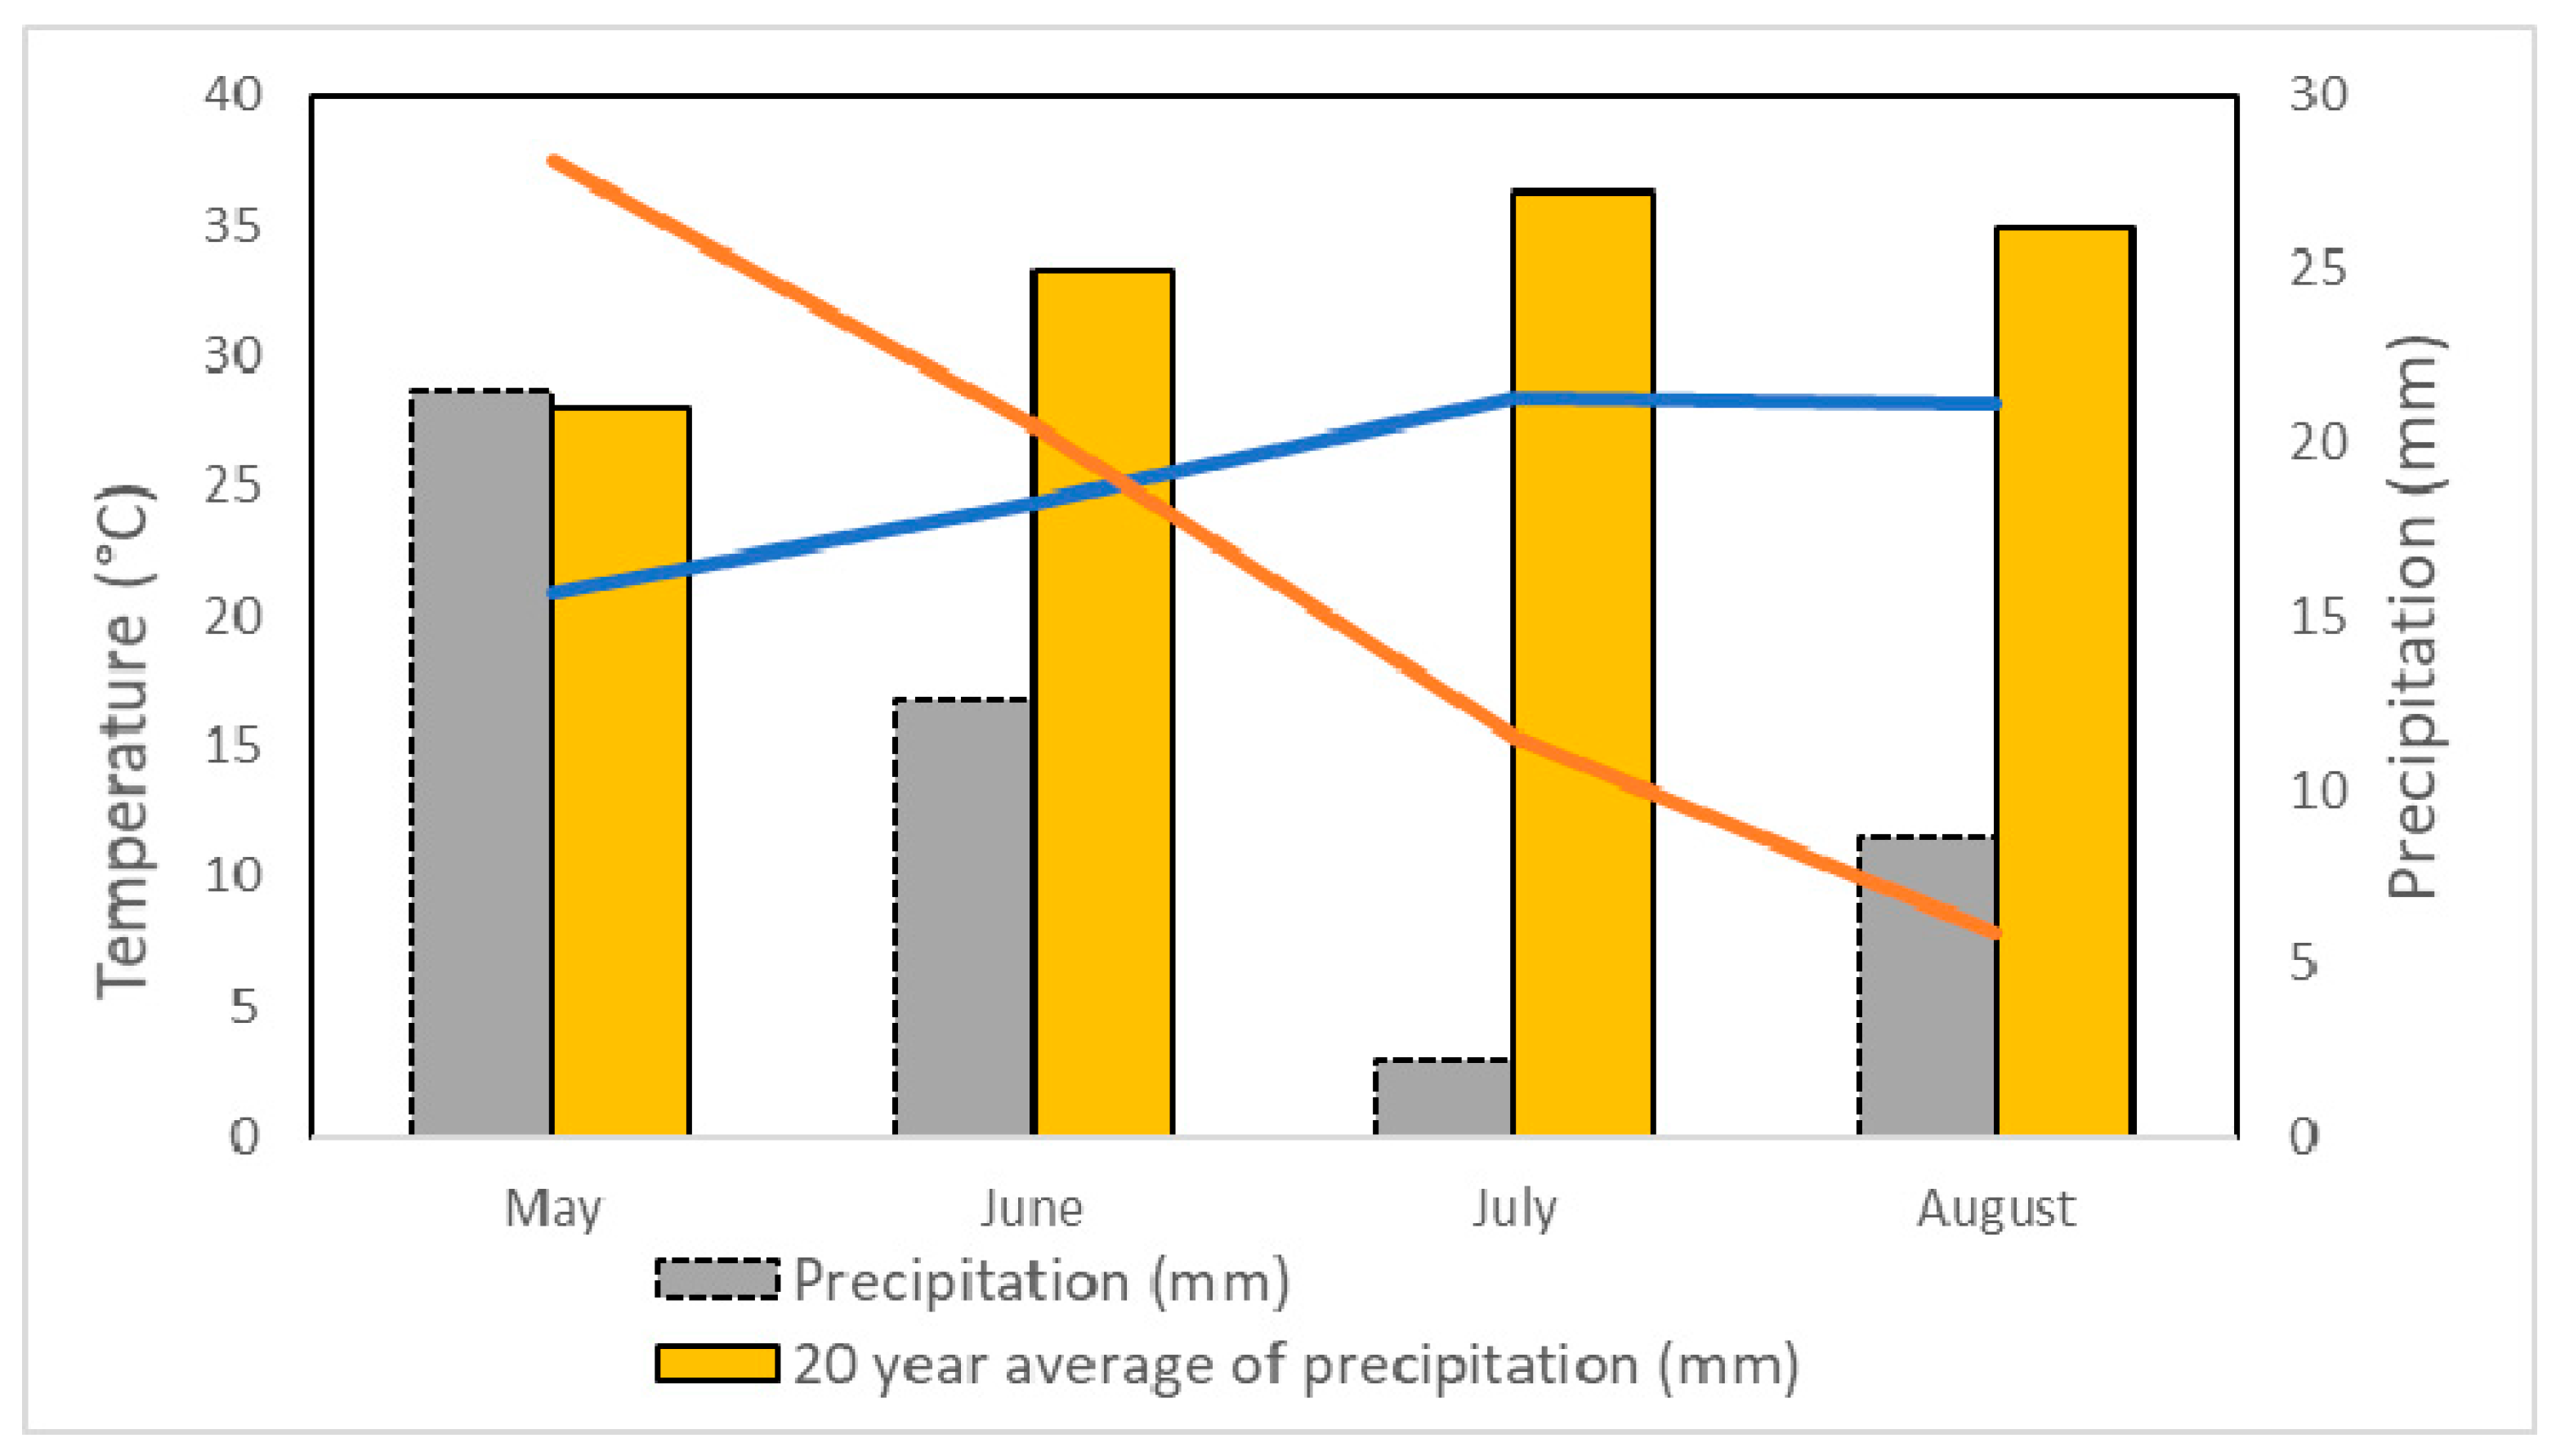
2.2. Irrigation Treatments

Two levels of irrigation were applied (100% (RI) and 65% of field capacity (RDI)) via a drip irrigation system. Irrigation was scheduled based on sensors (Delta T PR2/4 + HH2; Delta-T devices Ltd., Burwell, UK) that measured the soil moisture content at 10 cm gradients up to a depth of 40 cm. The total water input (irrigation + precipitation) throughout the growing period for RI and DI treatments was the following: RI = 3540 m3 ha−1 and DI = 2190 m3 ha−1. All plants received the same irrigation from transplantation (middle of May) to end of May (e.g., 480 m3 ha−1), while for the rest of the growing period (June until August) and till harvest, the two levels of irrigation were applied (total irrigation water: 3060 m3 ha−1 and 1710 m3 ha−1 for RI and RDI treatments, respectively). Finally, plants received 356 m3 ha−1 of water through precipitation (208 m3 ha−1 until the middle of May and 148 m3 ha−1 from the middle of May until harvest). The amounts of water that plants received are shown in Figure 2. Meteorological data are displayed in Figure 3.
At the day of harvest (6th of August), all mature fruit were collected and pooled into three batch samples for each treatment and stored in a deep-freezer for quality assessment as described below. Prior to analysis, fruit were lyophilized and ground to a 20 mesh fine powder.
The experiment was laid out according to split-plot design using irrigation treatments as the main plots and biostimulant applications as the sub-plots (Figure 4).

2.3. Chemical Composition Analysis

2.3.1. Proximate Composition and Energy

Tomato fruit samples were analyzed for protein, fat, and ash contents according to the methods of the Association of Official Analytical Chemists (AOAC) methods [45]. In brief, the crude protein content (N × 6.25) was determined with the macro-Kjeldahl method; the crude fat content was evaluated after Soxhlet extraction with petroleum ether; and the ash content was evaluated after incineration in a muffle furnace (550 ± 15 °C). For carbohydrates, the content was estimated by difference. The results are presented in 100 g of fresh weight (fw).
The energy value was determined according to the conversion factors of 9 kcal g−1 for fat and 4 kcal g−1 for proteins and carbohydrates, while the results are presented in kcal per 100 g fw.

2.3.2. Free Sugars and Organic Acids

Free sugars were determined in a high-performance liquid chromatography (HPLC) system (Knauer, Smartline system 1000, Berlin, Germany) coupled to a refraction index (RI) detector, using melezitose as internal standard, according to the protocol previously described in detail by Spréa et al. [46]. The identification of free sugars was performed after the comparison of chromatographs with commercial standards, while internal standard concentration was used for the quantification of the detected compounds (results are presented as g per 100 g fw). The content of individual free sugars was used to calculate the sweetness index (SI) of fruit through the formula [47]:
SI = fructose content × 2.30 + glucose content × 1.00 + sucrose content × 1.35
Organic acids were determined in an ultra-fast liquid chromatography (UFLC) system (Shimadzu 20A series, Kyoto, Japan) coupled to a photodiode array detector (PDA) based on the protocol previously described in detail by Pereira et al. [48]. The identification of detected compounds took place after comparing chromatographs with commercial standards and quantified (mg per 100 g fw) using the respective calibration curves (r2 ≥ 0.994) constructed with oxalic acid (y = 8 × 10⁶x + 331,789), malic acid (y = 942,562x + 38,506), ascorbic acid (y = 5 × 10⁷x + 449,262), and citric acid (y = 968,367x − 12,295). All standards were obtained from Sigma-Aldrich (St. Louis, MO, USA).

2.3.3. Fatty Acids, Tocopherols, and Carotenoids

The crude fat obtained after the Soxhlet extraction was subjected to a transesterification process, following the protocol previously described by Spréa et al. [46]. The identification of the detected fatty acids was performed by comparing the retention times of the sample chromatographs with those of the standard mixture 47885-U from Sigma-Aldrich (St. Louis, MO, USA). The results are presented as relative percentage.
Tocopherols were determined using an HPLC system coupled to a fluorescence detector (FP-2020, Jasco, Easton, MD, USA), based on the procedure previously described by Pinela et al. [49]. The identification of the detected compounds took place after comparing chromatographs with authentic standards, while quantification took place using the internal standard method (results are presented as mg per 100 g fw).
Lycopene and β-carotene were estimated following the method previously optimized by Nagata and Yamashita [50]. These compounds were extracted with acetone/hexane (4:6, v/v), and the results of the optical density of the supernatant recorded at 453, 505, 645, and 663 nm (Zuzi spectrophotometer, model 4255/50; Beriain, Navarra, Spain) were used to calculate the concentrations (mg per 100 g fw) of both carotenoids.

2.4. Evaluation of Bioactive Properties

2.4.1. Preparation of Hydroethanolic Extracts

Each fruit sample (1 g of fine powder) was stirred with 30 mL of ethanol/water (80:20, v/v) for 60 min at room temperature and then filtered through Whatman No. 4 paper. The filtrate was collected, while the solid residue was extracted once more with an additional 50 mL of solvent. After that, both filtrates were combined and evaporated under reduced pressure and then redissolved using the same solvent for further quantification of total phenolic compounds and total flavonoids or using phosphate-buffered saline (PBS) solution to assess antioxidant activity.

2.4.2. Total Phenolic and Flavonoids Contents

The total phenolic compounds (TPC) content was estimated using the Folin–Ciocalteu method after modifications, as described in detail by Añibarro-Ortega et al. [51]. Gallic acid (0.05–0.8 mg mL−1) was implemented to create the calibration curve y = 2.0372x + 0.043 (r2 = 0.9981), and the results are presented as mg of gallic acid equivalents (GAE) per g of extract.
The total flavonoids (TF) content was estimated using the aluminium chloride method, as previously described in detail by Añibarro-Ortega et al. [51]. Catechin (0.03125–1 mg mL−1) was implemented to create the calibration curve y = 0.8578x + 2 × 10⁻⁵ (r2 = 0.9999), and the results are presented as mg of catechin equivalents (CE) per g of extract.

2.4.3. Thiobarbituric Acid Reactive Substances (TBARS) Assay

The tested samples were evaluated for their capacity to inhibit the formation of thiobarbituric acid reactive substances, using the protocol previously described in detail by Pinela et al. [49], and the results are presented as EC50 values (µg mL−1).

2.4.4. Oxidative Hemolysis Inhibition (OxHLIA) Assay

The capacity of the tested samples to inhibit oxidative hemolysis was performed using the protocol previously described in detail by Lockowandt et al. [52], while PBS solution was used as negative control, Trolox as positive control, and distilled water as baseline. The results are presented as IC50 values (µg mL−1 at Δt of 60 min).

2.5. Statistical Analysis

For chemical analysis, batch samples of fruit collected from each treatment were analysed in triplicate, and the results are presented as mean ± standard deviation; the decimal place of the uncertain digit of the mean was established by rounding the standard deviation to one significant figure. Prior to analysis, normal distribution and homogeneity of variance were assessed using the Shapiro–Wilk and Levene tests, respectively. For data analysis, the one-way analysis of variance (ANOVA) was applied, while for means comparison the Tukey’s honestly significant difference (HSD) test at p > 0.05 was employed. All analyses were conducted using IBM SPSS Statistics software (Version 22.0, IBM Corp, Armonk, NY, USA).
Additionally, principal component analysis (PCA) was carried out to detect the contribution of each variable to the total diversity and classify the tested biostimulants and irrigation regimes based on chemical composition and antioxidant activities of processing tomato fruit. All statistical analyses were carried out using the StatGraphics Centurion-XVII statistical package (StatPoint Technologies Inc., Warrenton, VA, USA).

3. Results and Discussion

3.1. Nutritional Value

The results of tomato nutritional value are displayed in Table 1. In general, regulated deficit irrigation (RDI) decreased the moisture content of tomato fruits compared to regular irrigation (RI). Similarly, Mu and Fang [53] mentioned that tomato water content increased with increasing soil water content and water availability. Moreover, the application of biostimulants significantly enhanced fruit moisture content compared to the control treatment when plants received regular irrigation, whereas at regulated deficit irrigation treatments Tr2 (protein and amino acids with seaweed extract) and Tr3 (humic and fulvic acids with seaweed extract) resulted in the lowest moisture content.
According to Mannino et al. [54], the biostimulant dosage (application of Expando® three or four times throughout the growing period at 1.5 mL L−1) may affect tomato fruit moisture and can lead to decreased values at the highest application rates. The protein content ranged from 0.86 to 1.28 g 100 g−1 fw, while biostimulant application showed decreasing trends or no effects compared to the control treatments for both irrigation regimes. On the other hand, protein content increased under RDI conditions, especially in the case of Tr2, Tr3, and the control treatments. According to Wang et al. [34], biostimulant application (pig blood-derived protein hydrolysate applied at 1 g L−1, 2 g L−1 and 3 g L−1) can increase the fruit protein content in tomato plants grown under drought stress due to improved osmolyte accumulation. Moreover, Stagnari et al. [55] mentioned that drought stress favors the accumulation of proteins, a finding which is in line with the results of the present study, while Mu and Fang [53] and Jin et al. [19] also associated water stress with increased accumulation of osmolytes. In terms of fat content, biostimulant application resulted in decreased values compared to the control treatment under regular irrigation, whereas RDI had no effect or increased fat content (except for Tr4 (SiO2) where a decrease was recorded). These findings are in accordance with Fernandes et al. [4], who also mentioned that full irrigation led to increased fat content and further reported a varied response depending on the biostimulant composition (Twin-Antistress, x-Stress and Nomoren applied three times at recommended doses).
The ash content was not affected by irrigation regime; however, when RDI was combined with the application of Tr2, Tr3 and Tr4 treatments, a significant increase by up to 9% compared with the control treatment was recorded. In contrast, all the tested biostimulants led to significantly reduced ash compared with the control treatment under regular irrigation. In contrast to our study, Mannino et al. [54] reported that biostimulant usage (application of Expando® three or four times throughout the growing period at 1.5 mL L−1) had no significant impact on ash content of tomato fruit. This difference that could be attribute to the application regime, since in our study all biostimulants tested were applied before flowering and after fruit setting compared to applications after flowering that Mannino et al. [54] performed. Regulated deficit irrigation significantly increased carbohydrates and energy content for all the biostimulants tested, while treatments Tr2 and Tr3 resulted in the highest overall content. Mannino et al. [54] also suggested a positive impact of biostimulant application on sugars and energy content of tomato fruit, although they suggested a dose-dependent response.

3.2. Free Sugars and Organic Acids

The main free sugars detected in the studied tomato samples were fructose, glucose, and sucrose in descending order ranging from 2.04 to 3.3 g 100 g−1 fw, 0.57 to 1.58 g 100 g−1 fw, and 0.01 to 0.06 g 100 g−1 fw, respectively (Table 2). Lipan et al. [56] also identified fructose and glucose as the main sugars in tomato samples, while they also suggested an increase under prolonged regulated deficit irrigation. Similarly to our study, deficit irrigation led to increased reducing sugars and soluble solid content of tomato fruits has been reported in several other studies [19,23,24,53]. This finding could be associated with a concentration effect and the lower fruit moisture content under deficit irrigation, as well as to induced accumulation of sugars as an adaptation to stress conditions [55]. Under water deficit irrigation, some stress regulatory genes have been identified in tomato fruit and can enhance sugar accumulation and increase the sweet taste of tomatoes [24].
Regarding the effect of biostimulant application, regulated deficit irrigation combined with biostimulant application resulted in increased content of free sugars compared to the respective controls (no biostimulant added), apart from the case of sucrose where the highest content was measured for the control treatment. On the other hand, biostimulant application did not have a positive effect on free sugars content for plants grown under regular irrigation, thus suggesting the stress mitigation effects of the tested biostimulants. In particular, the highest values of fructose and glucose were measured for Tr1 treatment under deficit irrigation. Considering the contribution that free sugars may have on fruit taste, the sweetness index increased under RDI conditions compared to the respective treatments of RI regardless of the biostimulant application, while Tr1 treatment recorded the highest value (9.22) under deficit irrigation. Several previous studies have reported that the use of biostimulants such as seaweed extract (Ascophyllum nodosum; three doses of Kendal Root at 2.5, 5.0, and 10 L ha−1; five doses of Ascophyllum nodosum extracts at 0, 0.1, 0.2, 0.3 and 0.4%; three doses of liquid seaweed extracts at 0.2, 0.4, and 1.0%), animal-derived (pig blood-derived protein hydrolysate applied at 1 g L−1, 2 g L−1, and 3 g L−1) and legume-derived protein hydrolysate (eight applications of Bioup® TF at 0.1%, v/v; four applications of Trainer® at 4 mL L−1) may increase total sugars content [1,18,29,37,57,58]. This positive effect could be due to increased photosynthetic efficiency that was recorded after the application of biostimulant, which resulted in enhanced sugar accumulation [1], since soluble sugars can support osmotic balance and stabilize cell membranes under stress conditions [59]. In contrast, the use of biostimulants under regular irrigation resulted in decreased content of fructose, while glucose either decreased (Tr3 and Tr4 treatments) or remained unaffected (Tr1 and Tr2) compared to the control treatment. These findings are in accordance with those of Distefano et al. [60] who suggested that a plant-derived biostimulant (eight applications of Bioup® TF at 0.1%, v/v) negatively affected the accumulation of fructose and glucose in tomato fruit grown at optimum conditions. Moreover, it is interesting to highlight that Tr1 treatment had noticeable effect on free and total sugars content regardless of the irrigation regime. This finding is in accordance with the study of Alfosea-Simón et al. [39] who suggested that the use of amino acids (foliar application of tyrosine, lysine, methionine, and their mixture at 15 mM) can increase fructose and glucose content in tomato leaves as they enhance the C influx in the plant.
The main organic acids were citric acid (561–941 mg/100 g fw), followed by malic acid, oxalic acid, and ascorbic acid (Table 2). According to Fernandes et al. [4], citric, malic, and oxalic were also the main organic acids of tomato, whereas ascorbic acid was detected in trace amounts. Moreover, a varied response was recorded to the irrigation regime and biostimulant treatment of the total and individual organic acids content. In particular, the highest value of oxalic acid was observed for treatment Tr4 under regular treatment, while the same treatment was not different from the control under regular irrigation. Tr1 and Tr3 treatments increased oxalic acid content by up to 19.7% under deficit irrigation, whereas the lowest content was recorded for Tr2 treatment for both irrigation regimes. Considering the anti-nutritional effects of oxalic acid, the application of proteins and amino acids combined with seaweed extract could reduce its content and improve the nutritional value of tomato fruit.
In terms of malic acid, the values in tomato samples ranged from 276 to 616 mg 100 g−1 fw, while RDI significantly increased malic acid content compared to regular irrigation for the respective biostimulant treatments. Particularly, the highest values were recorded for treatments Tr2 and Tr4 without being significantly different from the control. According to the literature, plant-derived protein hydrolysates (four applications of Trainer® at 3 mL L−1 or 4 mL L−1) led to enhanced malic acid accumulation [58,61]. In contrast, under regular irrigation, biostimulant application reduced malic acid content in comparison with the control treatment, a finding which was also reported by Distefano et al. [60]. Regarding ascorbic acid, biostimulant application resulted in a decrease under regular irrigation, while the opposite trend was recorded for RDI (except for Tr3 treatment where a decrease over the control was noted) ranging from 7.9 to 17.0 mg 100 g−1 fw. As mentioned before, the application of amino acids can modulate the metabolic processes in plants, influencing the accumulation of organic acids [39,62], especially under water deficit conditions when they serve as osmoprotectants [19]. In contrast to the present study, the application of Ascophyllum nodosum extract (three doses of Kendal Root at 2.5, 5.0, and 10 L ha−1) and plant-derived protein (four applications of Trainer® at 3 mL L−1) led to a higher concentration of ascorbic acid [1,58], while Rouphael et al. [37] suggested that a high dose of plant-based protein (5 mL L−1) can enhance ascorbic acid accumulation by direct or indirect effects on the biosynthesis of antioxidant compounds.
Citric acid was the richest organic acid in tomato fruit, with a content that ranged from 565 to 941 mg 100 g−1 fw. It is interesting to mention that citric acid content was negatively affected by biostimulant application regardless of the irrigation regime, since the control treatments (no biostimulants added) recorded the highest content. Moreover, RDI resulted in increased citric acid content for all the biostimulant treatments in comparison to the respective treatments under regular irrigation. This trend was also recorded for total organic acids content where both control treatments (no biostimulants added) recorded the highest values compared to the rest of the biostimulant treatments of the same irrigation regime. Previously, Mu and Fang [53] suggested that increasing soil water content resulted in gradually decreased organic acids, while fruit acidity can be affected by water stress through osmotic adjustments that include the synthesis of sugars and organic acids [10,56]. Considering that the flavor of tomato fruit is determined by sugar and acid contents, the application of biostimulants and deficit irrigation may alter the balance of sugars and organic acids and improve its organoleptic properties [63].
Free sugars and organic acids content are important for fruit quality since they determine flavor and taste and eventually consumer acceptance [64], while the ratio of the content of free sugars:organic acids is a useful index for fruit quality assessment and the determination of ripening stage [65]. The combined effect of irrigation regime and biostimulant application on this index did not show a specific trend since RDI increased the ratio values only in the case of Tr1 and Tr4 treatments (3.54 and 3.25; and 3.08 and 2.53; for RDI and RI conditions, respectively), whereas the opposite trend was recorded for Tr2 treatment (2.76 and 3.32 for RDI and RI conditions, respectively). These results could be associated with the osmoregulatory role of free sugars which tend to increase under water deficit conditions [64], while biostimulant application may also alleviate negative effects of water shortage through regulation of photosynthetic and biosynthetic processes [34,66].

3.3. Tocopherols and Carotenoids

The tested tomato samples contained all the tocopherols, although α-tocopherol was most abundant, followed by γ-tocopherol with values ranging from 212 to 555 and 42 to 233 μg 100 g−1 fw for α- and γ-tocopherol, respectively (Table 3). Tocopherols occur in plant-based foods, and there are different isomers (α-, β-, γ-, and δ-), with α- and γ-tocopherol being the most common [67], while Distefano et al. [60] also mentioned that α-tocopherol is the main isoform of vitamin E in tomato fruit, whereas β-tocopherol had the lowest content. In previous reports, biostimulant application (three or four applications of Expando® throughout the growing period at 1.5 mL/L−1) increased the tocopherol content from 398 to 445 μg 100 g−1 fw [54], while Fernandes et al. [4] mentioned that biostimulant application (Twin-Antistress, x-Stress and Nomoren applied three times at recommended doses) combined with limited irrigation can lead to variable results in terms of tocopherol content. Similarly, in our study there was not a certain impact of irrigation and biostimulant application. In particular, the maximum concentrations of α-, γ- and total tocopherols were recorded in the Tr3 treatment, while the general trend showed increased contents of tocopherols under RDI conditions compared to the respective biostimulant and the control treatments under regular irrigation. The only exception was β-tocopherol where a varied response was recorded in terms of biostimulant application and irrigation regime. Pereira et al. [68] also suggested that the application of certain biostimulants under water stress conditions may increase α-tocopherol and total tocopherols in spinach plants. This finding could be attributed to the main role of tocopherols as important antioxidants involved in the mechanisms of plants responsible for adaptation to abiotic stresses such as water stress [69,70]; hence, the increased content under deficit irrigation. Finally, δ-tocopherol was detected only under RDI in Tr1, Tr2 and Tr3, with the highest value being observed in Tr1. Considering the varied response in terms of β- and δ-tocopherol, it could be suggested that biostimulant composition is important for tocopherols profile in tomato fruit. Similarly, Distefano et al. [60] also reported that the application of a plant-derived biostimulant (eight applications of Bioup TF® at 0.1%, v/v) may increase β-tocopherol content, while the same authors and Fernandes et al. [4] did not detect δ-tocopherol in any of the studied tomato fruit samples.
Lycopene and β-carotene were the main carotenoids detected in tomato fruit (Table 3), since they usually represent almost 75% of tomato carotenoids [59]. In particular, under RDI, Tr2 and Tr3 treatments increased carotenoids content in comparison to the control treatment, while all biostimulant treatments enhanced carotenoids content under deficit irrigation in comparison to the respective treatments under regular irrigation (except for Tr1 where lower content than the control was recorded). Water limitation seemed to enhance lycopene and β-carotene accumulation in fruits [55,56] and can lead to increased carotenoid biosynthesis, favoring the accumulation of lycopene [23]. Moreover, concentration effects could partly explain the increased content of carotenoids under RDI conditions, since water scarcity may lead to lower moisture content in fruit as recorded in our study [71,72]. According to literature reports, the effect of biostimulants on this trait may vary, as Hernández-Herrera et al. [59] observed that liquid seaweed extract (0.2, 0.4, and 1.0%) had no significant impact on carotenoid content, whereas Paul et al. [32] mentioned that plant-based protein hydrolysate (two foliar sprays of nine protein hydrolysates applied at 1%) may reduce the accumulation of carotenoids. In contrast, Colla et al. [57], Rouphael et al. [37], and Subramaniyan et al. [1] observed that legume-derived protein hydrolysates and seaweed extracts of Ascophyllum nodosum increased lycopene accumulation by up to 34.9%. Colla et al. [57] also suggested a positive correlation between lycopene and potassium concentration and reported that biostimulant application seemed to benefit lycopene accumulation through the increase in mineral uptake. The positive impact of biostimulant application (four applications of Trainer® at 3 mL L−1 [58] and application of corn straw-derived fulvic acids with different methods and doses [31]) improving mineral uptake has also been suggested, whereas Costan et al. [73] did not observe any effects from Si application (2 mmol L−1 K2SiO3) on mineral composition of hydroponically grown tomato fruit. Moreover, considering the importance of pigments on photosynthetic apparatus, the increase in carotenoids after biostimulant application may justify their stress alleviation effects [59].

3.4. Fatty Acids

Seventeen fatty acids were identified in total, while the main ones (those detected in amounts higher than 1%) are presented in Table 4. A variable response to the irrigation system and biostimulant application was observed. In particular, the most abundant fatty acids were palmitic acid (C16:0; values ranged between 24.9% and 52.0%), followed by linoleic acid (C18:2n6c; 21.0% and 43.0%), and oleic acid (C18:1n9; 5.0% to 24.4%). Regarding the particular treatments, Tr3 recorded the highest palmitic acid content, fruit from plants treated with Tr1 were the most abundant in linoleic and oleic acids, while Tr2 and Tr4 treatments significantly increased linolenic and myristic acids. On the other hand, no specific trends were observed regarding the effect of irrigation regime. Moreover, saturated fatty acids (SFA) were the most abundant class of fatty acids (values ranged between 26.3% and 68%), followed by monounsaturated (MUFA) and polyunsaturated (PUFA) (values ranged between 5.0% to 27% and 24% to 47.1%, respectively). Similarly, Mannino et al. [54] identified palmitic, linoleic, and oleic acids as the main fatty acids in tomato fruit, while they suggested that the use of a biostimulant based on seaweed and yeast extract (application of Expando® three or four times at 1.5 mL L−1) affected the fatty acids in a dose-dependent manner. In a previous study, Zhang et al. [74] mentioned that protein hydrolysates combined with seaweed extracts (Clever HX® at 10%, Ascovip® at 10% and their combination at 5% each) can modify the fatty acids biosynthetic pathways, thus indicating the regulatory role of biostimulants in fatty acids biosynthesis.
The ratio of PUFA/SFA evaluates the influence of diet on cardiovascular health, assuming that PUFAs can depress low-density lipoprotein cholesterol, while SFAs lead to high levels of cholesterol in serum. Therefore, a high ratio is an index of positive health effects [75]. In our study, the values of PUFA/SFA ratio were higher than 0.45 for Tr1, Tr2, and the control treatment under deficit irrigation, as well as for Tr4 and the control treatment under regular irrigation, a finding which indicates that these treatments may enhance the nutritional value of tomato fruit. Similar to our study, Fernandes et al. [4] reported that irrigation systems and biostimulants (Twin-Antistress, x-Stress and Nomoren applied three times at recommended doses) can lead to a variable response of fatty acid concentration. In terms of the n6/n3 ratio, the highest values were recorded under regular irrigation and the application of Tr2, Tr3, and Tr4 biostimulants and the control treatment, while RDI resulted in decreased values of this particular ratio. The recorded values for all the treatments were higher than 4.0, which is considered the upper threshold for high nutritional value (i.e., the ratio must be lower than 4.0) [76,77], although Tr2 treatment under RDI recorded the lowest overall value.

3.5. Total Phenolic and Flavonoids Content and Antioxidant Activity

The results of total phenolic compounds (TPC) and total flavonoids (TF) content of tomato samples are presented in Table 5. Total phenolic compounds ranged from 17.3 to 24 mg GAE g−1 extract, and the highest values were recorded in Tr3 and the control treatment under deficit irrigation, being significantly higher compared to the rest of the biostimulant treatments. Moreover, under regular irrigation treatments, Tr1 and Tr4 recorded significantly higher values than the control treatment. In terms of total flavonoids content, Tr1 under regular irrigation recorded the highest overall value, being significantly different from the rest of the treatments, whereas under RDI only treatments Tr1 and Tr2 recorded values higher than the control. Jin et al. [19] and Villa e Vila et al. [18] suggested that total phenolic compounds and total flavonoids content increased under deficit irrigation, while the content of individual compounds varied depending on the intensity of water stress and the biostimulant dose applied (five doses of Ascophyllum nodosum extracts at 0, 0.1, 0.2, 0.3, and 0.4% [18]). In contrast, Lipan et al. [56] suggested that prolonged water stress did not affect TPC content in tomato fruit for up to six weeks of regulated deficit irrigation application. These contrasting results could be due to differences in the application regime of biostimulants as well as in the intensity and duration of water deficit irrigation.
The assessment of the antioxidant activity of tomato samples showed that the results of the TBARS assay were in contrast with the OxHLIA assay (Table 5). In particular, the highest activity for the TBARS assay was observed for the control treatment under deficit irrigation, whereas the lowest one was recorded for Tr3 under the same conditions. On the other hand, the same treatment (Tr3 under deficit irrigation) was the most effective in the OxHLIA assay, whereas the lowest activity was recorded for the control treatment under regular irrigation. This finding is in accordance with the results of Fernandes et al. [4] who also observed a different response of tomato samples to the same assays. An appropriate deficit irrigation system could affect secondary metabolite biosynthesis, supporting the accumulation of bioactive compounds and increasing the antioxidant activity and therefore the nutritional quality of tomato fruit [19]. Phenolic compounds such as flavonoids and phenolic acids, as well as ascorbic acids and carotenoids, especially lycopene, contribute to the antioxidant activity of tomatoes and tomato products [78]. Considering that Tr3 treatment under RDI recorded the highest content of tocopherols and carotenoids, this could be associated with the highest antioxidant activity observed for the OxHLIA assay since the TPC and TF contents do not follow this trend (e.g., Tr3 and control treatment under RDI recorded the highest TPC content and the highest and lowest antioxidant activity in the case of the TBARS assay). Moreover, the irrigation and biostimulant application (Twin-Antistress, x-Stress and Nomoren applied three times at recommended doses) did not have a clear impact on the antioxidant activity of tomatoes [4], although biostimulants (Megafol, Aminovert, Veramin Ca and Twin Antistress applied twice at recommended dose) seemed to increase the antioxidant activity of spinach [68]. In another study where the antioxidant activity was determined via the DPPH and ABTS assays, different biostimulants led to increased antioxidant activity, although the FRAP assay did not show significant differences between treated and untreated tomatoes [54], as the efficacy of the extracts is determined by the antioxidant mechanism involved in each assay [68]. For instance, lipophilic antioxidant activity was significantly increased by biostimulant application, while the hydrophilic antioxidant activity was not affected by a high dose of biostimulant (3 and 5 mL L−1 of Trainer ®; [37,58]). Finally, it is interesting to note that treatment Tr3 under RDI recorded IC50 values lower than Trolox, which was implemented as a positive control.

3.6. Principal Component Analysis (PCA)

The principal component analysis (PCA) was performed to identify groups and indicate similarities and differences in multivariate data. The analysis of our data showed that the first seven principal components (PCs) were associated with eigenvalues higher than 1, explaining 95.7% of the cumulative variance, with PC1 accounting for 46.0%, PC2 for 18.6%, PC3 for 9.5%. PC4 for 7.0%, PC% for 5.8%, PC6 for 5.2%, and PC7 for 3.4%. In particular, PC1 showed a positive correlation with ascorbic acid, C15:0, C16:1, C17: 0, C18:1n9, C18:2n9, C18:3n3: C20:5n3, C22:1n9, C22:2, C24:1, carbohydrates, energy content, glucose, MUFA, PUFA, total tocopherols, and α-tocopherol, whereas it was negatively correlated with C16:0, C18:0, C20:0, OxHLIA, and SFA. On the other hand, PC2 showed a positive correlation with β-carotene, C16:0, C18:0, C20:0, lycopene, total phenolic compounds, proteins, SFA, sucrose, and total organic acids, whereas it was negatively correlated with C18:1n9, C18:2n6, C20:5n3, total flavonoids, moisture content, MUFA, and β-tocopherol. Finally, PC3 showed a positive correlation with γ-tocopherol, whereas a negative correlation was observed for C14:0, C15:0, C17:0, C22:2, C23:0, fructose, glucose, sucrose, total sugars, and δ-tocopherol. Therefore, PCA facilitates the discrimination of the tested factors as illustrated in the respective scatterplots and loading plots. The scatterplot in Figure 5 shows four distinct groups of the tested biostimulant and irrigation treatments based on chemical composition and bioactive properties of processing tomato fruit.
The loading plot of PC1 and PC2 correlated variables as follows: the upper left quadrant included C12:0, C16:0, C22:0, C23:0, SFA, and moisture content; the lower left quadrant included C18:0, C20:0, C24:0, TPC, OxHLIA, and oxalic acid; the upper right quadrant included TF, fat, C16:1, C17:0, C18:1n9, C18:2n6, C18:3n3, C20:5n3, C22:1, C22:1n9, MUFA, PUFA, β-tocopherol, and δ-tocopherol; the lower right quadrant included C14:0, C15:0, ash, protein, TBARS, lycopene, β-carοtene, sucrose, glucose, fructose, total sugars, ascorbic acid, citric acid, malic acid, total organic acids, carbohydrates, α-tocopherol, γ-tocopherol, total tocopherols, and energy content (Figure 6).
Moreover, the loading plot of PC1 and PC3 also revealed groups of positively correlated variables (Figure 7). The upper left quadrant included moisture content, C12:0, C16:0, C22:0, C23:0, and SFA; the lower left quadrant included C18:0, C20:0, C24:0, TPC, OxHLIA, and oxalic acid; the upper right quadrant included TBARS, ash, β-tocopherol, sucrose, C15:0, C16:1, C17:0, C22:0, glucose, fructose, total sugars, ascorbic acid, and carbohydrates; the lower right quadrant included TF, α-tocopherol, γ-tocopherol, total tocopherols, fat, protein, lycopene, citric acid, β-carotene, malic acid, total organic acids, C18:1n9, C18:2n6, C18:3n3, C20:5n3, C22:1n9, C24:1, MUFA, PUFA, and energy content.

4. Conclusions

Tomato contains several health-beneficial compounds and has high commercial importance throughout the world. Nowadays, water shortage is a challenge for agricultural production, especially for vegetable crops, and long-term and sustainable strategies should be adopted to enhance productivity without compromising the quality of fruits and vegetables. Our results indicate that regulated deficit irrigation combined with biostimulant application significantly improved the nutritional quality of processing tomato fruit by increasing carbohydrates, fructose, glucose, malic acid, ascorbic acid, citric acid, linoleic acid (C18:2n6), oleic acid (C18:1n9), and MUFA and PUFA content, as well as antioxidant compounds such as tocopherols (α-, β-, γ-), lycopene, and β-carotene. On the other hand, oxalic acid content, which is considered an antinutritional factor, decreased under these conditions, while no specific trends were recorded for antioxidant activity. In conclusion, regulated deficit irrigation and biostimulant application seemed to positively affect the quality of processing tomato, depending on biostimulant composition. Therefore, further research is needed to fine-tune the application of those formulations that had beneficial effects in order to suggest an application protocol that may improve processing tomato fruit quality under water limitation conditions.

Author Contributions

Conceptualization, S.A.P.; methodology, V.L., C.C., M.A.-O., A.P. and J.P.; software, M.A.-O., A.P. and J.P.; validation, M.A.-O., A.P. and J.P.; formal analysis, V.L., C.C., M.A.-O., A.P. and J.P.; investigation, V.L., C.C., M.A.-O., A.P. and J.P.; resources, L.B. and S.A.P.; data curation, M.A.-O., A.P., J.P., L.B. and S.A.P.; writing—original draft preparation, V.L., J.P., L.B. and S.A.P.; writing—review and editing, J.P., L.B. and S.A.P.; visualization, S.A.P.; supervision, S.A.P.; project administration, S.A.P.; funding acquisition, S.A.P. All authors have read and agreed to the published version of the manuscript.

Funding

This research has been co-financed by the European Regional Development Fund of the European Union and Greek national funds through the Operational Program Competitiveness, Entrepreneurship and Innovation, under the call RESEARCH—CREATE—INNOVATE (project code: T2EDK-05281).

Data Availability Statement

Data available upon request.

Acknowledgments

The authors are grateful to the Foundation for Science and Technology (FCT, Portugal) for financial support through national funds FCT/MCTES (PIDDAC) to CIMO (UIDB/00690/2020 and UIDP/00690/2020) and SusTEC (LA/P/0007/2020); national funding by FCT, through the individual research grants of M. Añibarro-Ortega (2020.06297.BD) and A. Pereira (2023.00954.BD), and through the scientific employment program-contract with J. Pinela (CEECIND/01011/2018) and L. Barros (CEEC Institutional).

Conflicts of Interest

The authors declare no conflict of interest.

References

  1. Subramaniyan, L.; Veerasamy, R.; Prabhakaran, J.; Selvaraj, A. Biostimulation Effects of Seaweed Extract (Ascophyllum nodosum) on Phytomorpho-Physiological, Yield, and Quality Traits of Tomato (Solanum lycopersicum L.). Horticulturae 2023, 9, 348. [Google Scholar] [CrossRef]
  2. Perveen, R.; Ansar, H.; Suleria, R.; Anjum, F.M.; Butt, M.S.; Pasha, I.; Ahmad, S. Tomato (Solanum lycopersicum) Carotenoids and Lycopenes Chemistry; Metabolism, Absorption, Nutrition, and Allied Health Claims—A Comprehensive Review. Crit. Rev. Food Sci. Nutr. 2015, 55, 919–929. [Google Scholar] [CrossRef] [PubMed]
  3. Liu, J.; Hu, T.; Feng, P.; Yao, D.; Gao, F.; Hong, X. Effect of potassium fertilization during fruit development on tomato quality, potassium uptake, water and potassium use efficiency under deficit irrigation regime. Agric. Water Manag. 2021, 250, 106831. [Google Scholar] [CrossRef]
  4. Fernandes, Â.; Chaski, C.; Pereira, C.; Kostić, M.; Rouphael, Y.; Soković, M.; Barros, L.; Petropoulos, S.A. Water Stress Alleviation Effects of Biostimulants on Greenhouse-Grown Tomato Fruit. Horticulturae 2022, 8, 645. [Google Scholar] [CrossRef]
  5. Islam, M.; Jahan, K.; Sen, A.; Urmi, T.A.; Haque, M.M. Exogenous Application of Calcium Ameliorates Salinity Stress Tolerance of Tomato (Solanum lycopersicum L.) and Enhances Fruit Quality. Antioxidants 2023, 12, 558. [Google Scholar] [CrossRef] [PubMed]
  6. Gorni, P.H.; de Lima, G.R.; Pereira, L.M.d.O.; Spera, K.D.; Lapaz, A.D.M.; Pacheco, A.C. Increasing plant performance, fruit production and nutritional value of tomato through foliar applied rutin. Sci. Hortic. 2022, 294, 110755. [Google Scholar] [CrossRef]
  7. Bantis, F.; Koukounaras, A. Ascophyllum nodosum and Silicon-Based Biostimulants Differentially Affect the Physiology and Growth of Watermelon Transplants under Abiotic Stress Factors: The Case of Drought. Horticulturae 2022, 8, 1177. [Google Scholar] [CrossRef]
  8. Kumari, A.; Lakshmi, G.A.; Krishna, G.K.; Patni, B.; Prakash, S.; Bhattacharyya, M.; Singh, S.K.; Verma, K.K. Climate Change and Its Impact on Crops: A Comprehensive Investigation for Sustainable Agriculture. Agronomy 2022, 12, 3008. [Google Scholar] [CrossRef]
  9. Gedeon, S.; Ioannou, A.; Balestrini, R.; Antoniou, C. Application of Biostimulants in Tomato Plants (Solanum lycopersicum) to Enhance Plant Growth and Salt Stress Tolerance. Plants 2022, 11, 3082. [Google Scholar] [CrossRef]
  10. Chaski, C.; Petropoulos, S.A. The Effects of Biostimulant Application on Growth Parameters of Lettuce Plants Grown under Deficit Irrigation Conditions. Horticulturae 2022, 8, 1089. [Google Scholar] [CrossRef]
  11. Shahrajabian, M.H.; Chaski, C.; Polyzos, N.; Petropoulos, S.A. Biostimulants application: A low input cropping management tool for sustainable farming of vegetables. Biomolecules 2021, 11, 698. [Google Scholar] [CrossRef] [PubMed]
  12. Atilgan, A.; Rolbiecki, R.; Saltuk, B.; Jagosz, B.; Arslan, F.; Erdal, I.; Aktas, H. Deficit Irrigation Stabilizes Fruit Yield and Alters Leaf Macro and Micronutrient Concentration in Tomato Cultivation in Greenhouses: A Case Study in Turkey. Agronomy 2022, 12, 2950. [Google Scholar] [CrossRef]
  13. Francaviglia, R.; Di Bene, C. Deficit Drip Irrigation in Processing Tomato Production in the Mediterranean Basin. A Data Analysis for Italy. Agriculture 2019, 9, 79. [Google Scholar] [CrossRef]
  14. Chartzoulakis, K.; Bertaki, M. Sustainable Water Management in Agriculture under Climate Change. Agric. Agric. Sci. Procedia 2015, 4, 88–98. [Google Scholar] [CrossRef]
  15. Hatfield, J.L.; Dold, C. Water-use efficiency: Advances and challenges in a changing climate. Front. Plant Sci. 2019, 10, 103. [Google Scholar] [CrossRef] [PubMed]
  16. Chand, J.B.; Hewa, G.; Ph, D.; Hassanli, A.; Ph, D.; Myers, B.; Ph, D. Deficit Irrigation on Tomato Production in a Greenhouse Environment: A Review. J. Irrig. Drain. Eng. 2021, 147, 04020041. [Google Scholar] [CrossRef]
  17. Turhan, A.; Kuscu, H.; Asik, B.B. The Influence of Irrigation Strategies on Tomato Fruit Yield and Leaf Nutrient Contents. Gesunde Pflanz. 2022, 74, 1021–1027. [Google Scholar] [CrossRef]
  18. Vila e Vila, V.; Marques, P.A.A.; Rezende, R.; Wenneck, G.S.; Terassi, D.d.S.; Andrean, A.F.B.A.; Nocchi, R.C.d.F.; Matumoto-Pintro, P.T. Deficit Irrigation with Ascophyllum nodosum Extract Application as a Strategy to Increase Tomato Yield and Quality. Agronomy 2023, 13, 1853. [Google Scholar] [CrossRef]
  19. Jin, N.; Jin, L.; Wang, S.; Meng, X.; Ma, X.; He, X.; Zhang, G.; Luo, S.; Lyu, J.; Yu, J. A Comprehensive Evaluation of Effects on Water-Level Deficits on Tomato Polyphenol Composition, Nutritional Quality and Antioxidant Capacity. Antioxidants 2022, 11, 1585. [Google Scholar] [CrossRef]
  20. Wu, Y.; Yan, S.; Fan, J.; Zhang, F.; Xiang, Y. Scientia Horticulturae Responses of growth, fruit yield, quality and water productivity of greenhouse tomato to deficit drip irrigation. Sci. Hortic. 2021, 275, 109710. [Google Scholar] [CrossRef]
  21. Singh, M.; Singh, P.; Singh, S.; Saini, R.K.; Angadi, S.V. A global meta-analysis of yield and water productivity responses of vegetables to deficit irrigation. Sci. Rep. 2021, 11, 22095. [Google Scholar] [CrossRef] [PubMed]
  22. Chand, J.; Hewa, G.; Hassanli, A.; Myers, B. Evaluation of Deficit Irrigation and Water Quality on Production and Water Productivity of Tomato in Greenhouse. Agriculture 2020, 10, 297. [Google Scholar] [CrossRef]
  23. Coyago-cruz, E.; Corell, M.; Moriana, A.; Hernanz, D.; Stinco, C.M.; Mapelli-brahm, P.; Meléndez-Martínez, A.J. Effect of regulated deficit irrigation on commercial quality parameters, carotenoids, phenolics and sugars of the black cherry tomato (Solanum lycopersicum L.) ‘Sunchocola’. J. Food Compos. Anal. 2022, 105, 104220. [Google Scholar] [CrossRef]
  24. Bai, C.; Zuo, J.; Watkins, C.B.; Wang, Q.; Liang, H.; Zheng, Y.; Liu, M.; Ji, Y. Postharvest Biology and Technology Sugar accumulation and fruit quality of tomatoes under water deficit irrigation. Postharvest Biol. Technol. 2023, 195, 112112. [Google Scholar] [CrossRef]
  25. Campobenedetto, C.; Agliassa, C.; Mannino, G.; Vigliante, I.; Contartese, V.; Secchi, F.; Bertea, C.M. A Biostimulant Based on Seaweed (Ascophyllum nodosum and Laminaria digitata) and Yeast Extracts Mitigates Water Stress Effects on Tomato (Solanum lycopersicum L.). Agriculture 2021, 11, 557. [Google Scholar] [CrossRef]
  26. Bulgari, R.; Franzoni, G.; Ferrante, A. Biostimulants Application in Horticultural Crops under Abiotic Stress Conditions. Agronomy 2019, 9, 306. [Google Scholar] [CrossRef]
  27. Rakkammal, K.; Maharajan, T.; Antony, S.; Manikandan, C. Biostimulants and their role in improving plant growth under drought and salinity. Cereal Res. Commun. 2023, 51, 61–74. [Google Scholar] [CrossRef]
  28. Sudiro, C.; Guglielmi, F.; Hochart, M.; Senizza, B.; Zhang, L.; Lucini, L.; Altissimo, A. A Phenomics and Metabolomics Investigation on the Modulation of Drought Stress by a Biostimulant Plant Extract in Tomato (Solanum lycopersicum). Agronomy 2022, 12, 764. [Google Scholar] [CrossRef]
  29. Hernández-Herrera, R.M.; Santacruz-Ruvalcaba, F.; Ruiz-López, M.A.; Norrie, J.; Hernández-Carmona, G. Effect of liquid seaweed extracts on growth of tomato seedlings (Solanum lycopersicum L.). J. Appl. Phycol. 2014, 26, 619–628. [Google Scholar] [CrossRef]
  30. Niu, C.; Wang, G.; Sui, J.; Liu, G.; Ma, F.; Bao, Z. Scientia Horticulturae Biostimulants alleviate temperature stress in tomato seedlings. Sci. Hortic. 2022, 293, 110712. [Google Scholar] [CrossRef]
  31. Zhang, P.; Zhang, H.; Wu, G.; Chen, X.; Gruda, N.; Li, X.; Dong, J.; Duan, Z. Dose-Dependent Application of Straw-Derived Fulvic Acid on Yield and Quality of Tomato Plants Grown in a Greenhouse. Front. Plant Sci. 2021, 12, 7366313. [Google Scholar] [CrossRef]
  32. Paul, K.; Sorrentino, M.; Lucini, L.; Rouphael, Y.; Cardarelli, M.; Bonini, P.; Miras Moreno, M.B.; Reynaud, H.; Canaguier, R.; Trtílek, M.; et al. A combined phenotypic and metabolomic approach for elucidating the biostimulant action of a plant-derived protein hydrolysate on tomato grown under limited water availability. Front. Plant Sci. 2019, 10, 493. [Google Scholar] [CrossRef] [PubMed]
  33. Domingo, G.; Marsoni, M.; Milena, Á.; Torres, M.D.; Dom, H.; Vannini, C. The Role of Protein-Rich Extracts from Chondrus crispus as Biostimulant and in Enhancing Tolerance to Drought Stress in Tomato Plants. Plants 2023, 12, 845. [Google Scholar] [CrossRef] [PubMed]
  34. Wang, W.; Zheng, W.; Lv, H.; Liang, B.; Jin, S.; Li, J. Animal-derived plant biostimulant alleviates drought stress by regulating photosynthesis, osmotic adjustment, and antioxidant systems in tomato plants. Sci. Hortic. 2022, 305, 111365. [Google Scholar] [CrossRef]
  35. Top, S.; Vandoorne, B.; Pauwels, E.; Perneel, M.; Christine, M.; Kathy, V.L. Plant Sensors Untangle the Water-Use and Growth Effects of Selected Seaweed-Derived Biostimulants on Drought-Stressed Tomato Plants (Solanum lycopersicum). J. Plant Growth Regul. 2023, 42, 5615–5627. [Google Scholar] [CrossRef]
  36. Jiménez-Arias, D.; Hernándiz, A.E.; Morales-Sierra, S.; García-García, A.L.; García-Machado, F.J.; Luis, J.C.; Borges, A.A. Applying Biostimulants to Combat Water Deficit in Crop Plants: Research and Debate. Agronomy 2022, 12, 571. [Google Scholar] [CrossRef]
  37. Rouphael, Y.; Colla, G.; Giordano, M.; El-Nakhel, C.; Kyriacou, M.C.; De Pascale, S. Foliar applications of a legume-derived protein hydrolysate elicit dose-dependent increases of growth, leaf mineral composition, yield and fruit quality in two greenhouse tomato cultivars. Sci. Hortic. 2017, 226, 353–360. [Google Scholar] [CrossRef]
  38. Francesca, S.; Najai, S.; Zhou, R.; Decros, G.; Cassan, C.; Delmas, F.; Ottosen, C.; Barone, A.; Manuela, M. Phenotyping to dissect the biostimulant action of a protein hydrolysate in tomato plants under combined abiotic stress. Plant Physiol. Biochem. 2022, 179, 32–43. [Google Scholar] [CrossRef]
  39. Alfosea-Simón, M.; Simón-Grao, S.; Zavala-Gonzalez, E.A.; Cámara-Zapata, J.M.; Simón, I.; Martínez-Nicolás, J.J.; Lidón, V.; Rodríguez-Ortega, W.M.; García-Sánchez, F. Application of biostimulants containing amino acids to tomatoes could favor sustainable cultivation: Implications for tyrosine, lysine, and methionine. Sustainability 2020, 12, 9279. [Google Scholar] [CrossRef]
  40. Hamedeh, H.; Antoni, S.; Cocciaglia, L.; Ciccolini, V. Molecular and Physiological Effects of Magnesium–Polyphenolic Compound as Biostimulant in Drought Stress Mitigation in Tomato. Plants 2022, 11, 586. [Google Scholar] [CrossRef]
  41. Cristina, M.; Lucia, D.; Baghdadi, A.; Mangione, F.; Borella, M.; Zegada-lizarazu, W.; Ravi, S.; Deb, S.; Broccanello, C.; Concheri, G.; et al. Transcriptional and Physiological Analyses to Assess the Effects of a Novel Biostimulant in Tomato. Front. Plant Sci. 2022, 12, 781993. [Google Scholar] [CrossRef]
  42. Petropoulos, S.A. Practical applications of plant biostimulants in greenhouse vegetable crop production. Agronomy 2020, 10, 1569. [Google Scholar] [CrossRef]
  43. Shahrajabian, M.H.; Petropoulos, S.A.; Sun, W. Survey of the Influences of Microbial Biostimulants on Horticultural Crops: Case Studies and Successful Paradigms. Horticulturae 2023, 9, 193. [Google Scholar] [CrossRef]
  44. Shahrajabian, M.H.; Chaski, C.; Polyzos, N.; Tzortzakis, N.; Petropoulos, S.A. Sustainable Agriculture Systems in Vegetable Production Using Chitin and Chitosan as Plant Biostimulants. Biomolecules 2021, 11, 819. [Google Scholar] [CrossRef] [PubMed]
  45. AOAC. Official Methods of Analysis of Association of Official Analytical Chemists; Horwitz, W., Latimer, G., Eds.; AOAC Inter.: Gaithersburg, MD, USA, 2019; ISBN 0935584773. [Google Scholar]
  46. Spréa, R.M.; Fernandes, Â.; Calhelha, R.C.; Pereira, C.; Pires, T.C.S.P.; Alves, M.J.; Canan, C.; Barros, L.; Amaral, J.S.; Ferreira, I.C.F.R. Chemical and bioactive characterization of the aromatic plant Levisticum officinale W.D.J. Koch: A comprehensive study. Food Funct. 2020, 11, 1292–1303. [Google Scholar] [CrossRef] [PubMed]
  47. Keutgen, A.J.; Pawelzik, E. Quality and nutritional value of strawberry fruit under long term salt stress. Food Chem. 2008, 107, 1413–1420. [Google Scholar] [CrossRef]
  48. Pereira, C.G.; Prado, J.M.; Meireles, M.A.A. Economic Evaluation of Natural Product Extraction Processes. In Natural Product Extraction: Principles and Applications; RSC Green Chemistry: Cambridge, UK, 2013; pp. 442–471. [Google Scholar]
  49. Pinela, J.; Barreira, J.C.M.; Barros, L.; Cabo Verde, S.; Antonio, A.L.; Carvalho, A.M.; Oliveira, M.B.P.P.; Ferreira, I.C.F.R. Suitability of gamma irradiation for preserving fresh-cut watercress quality during cold storage. Food Chem. 2016, 206, 50–58. [Google Scholar] [CrossRef] [PubMed]
  50. Nagata, M.; Yamashita, I. Simple method for simultaneous determination of chlorophyll and carotenoids in tomato fruit. Nippon. Shokuhin Kogyo Gakkaishi 1992, 39, 925–928. [Google Scholar] [CrossRef]
  51. Añibarro-Ortega, M.; Pinela, J.; Ćirić, A.; Martins, V.; Rocha, F.; Soković, M.D.; Barata, A.M.; Carvalho, A.M.; Barros, L.; Ferreira, I.C.F.R. Valorisation of table tomato crop by-products: Phenolic profiles and in vitro antioxidant and antimicrobial activities. Food Bioprod. Process. 2020, 124, 307–319. [Google Scholar] [CrossRef]
  52. Lockowandt, L.; Pinela, J.; Roriz, C.L.; Pereira, C.; Abreu, R.M.V.; Calhelha, R.C.; Alves, M.J.; Barros, L.; Bredol, M.; Ferreira, I.C.F.R. Chemical features and bioactivities of cornflower (Centaurea cyanus L.) capitula: The blue flowers and the unexplored non-edible part. Ind. Crops Prod. 2019, 128, 496–503. [Google Scholar] [CrossRef]
  53. Mu, L.; Fang, L. Changes in Tomato Fruit Quality and Antioxidant Enzyme Activities under Deficit Irrigation and Fertilizer Application in a Solar Greenhouse in Northwest China. Commun. Soil Sci. Plant Anal. 2016, 47, 1329–1341. [Google Scholar] [CrossRef]
  54. Mannino, G.; Campobenedetto, C.; Vigliante, I.; Contartese, V.; Gentile, C.; Bertea, C.M. The Application of a Plant Biostimulant Based on Seaweed and Yeast Extract Improved Tomato Fruit Development and Quality. Biomolecules 2020, 10, 1662. [Google Scholar] [CrossRef] [PubMed]
  55. Stagnari, F.; Galieni, A.; Pisante, M. Drought stress effects on crop quality. In Water Stress and Crop Plants: A Sustainable Approach; Ahmad, P., Ed.; John Willey & Sons, Ltd.: Hoboken, NJ, USA, 2016; Volume 2, pp. 375–392. [Google Scholar]
  56. Lipan, L.; Issa-issa, H.; Moriana, A.; Zurita, M.; Galindo, A.; Martín-Palomo, M.J.; Andreu, L.; Carbonell-Barrachina, Á.A.; Hernández, F.; Corell, M. Scheduling Regulated Deficit Irrigation with Leaf Water Potential of Cherry Tomato in Greenhouse and its Effect on Fruit Quality. Agriculture 2021, 11, 669. [Google Scholar] [CrossRef]
  57. Colla, G.; Cardarelli, M.; Bonini, P.; Rouphael, Y. Foliar applications of protein hydrolysate, plant and seaweed extracts increase yield but differentially modulate fruit quality of greenhouse tomato. HortScience 2017, 52, 1214–1220. [Google Scholar] [CrossRef]
  58. Caruso, G.; De Pascale, S.; Cozzolino, E.; Cuciniello, A.; Cenvinzo, V.; Bonini, P.; Colla, G.; Rouphael, Y. Yield and nutritional quality of Vesuvian piennolo tomato PDO as affected by farming system and biostimulant application. Agronomy 2019, 9, 505. [Google Scholar] [CrossRef]
  59. Hernández-Herrera, R.M.; Sánchez-Hernández, C.V.; Palmeros-Suárez, P.A.; Ocampo-Alvarez, H.; Santacruz-Ruvalcaba, F.; Meza-Canales, I.D.; Becerril-Espinosa, A. Seaweed Extract Improves Growth and Productivity of Tomato Plants under Salinity Stress. Agronomy 2022, 121, 2495. [Google Scholar] [CrossRef]
  60. Distefano, M.; Steingass, C.B.; Leonardi, C.; Giuffrida, F.; Schweiggert, R.; Mauro, R.P. Effects of a plant-derived biostimulant application on quality and functional traits of greenhouse cherry tomato cultivars. Food Res. Int. 2022, 157, 111218. [Google Scholar] [CrossRef]
  61. Giordano, M.; El-Nakhel, C.; Carillo, P.; Colla, G.; Graziani, G.; Di Mola, I.; Mori, M.; Kyriacou, M.C.; Rouphael, Y.; Soteriou, G.A.; et al. Plant-Derived Biostimulants Differentially Modulate Primary and Secondary Metabolites and Improve the Yield Potential of Red and Green Lettuce Cultivars. Agronomy 2022, 12, 1361. [Google Scholar] [CrossRef]
  62. Ramawat, N.; Bhardwaj, V. Biostimulants: Exploring Sources and Applications; Springer: Berlin/Heidelberg, Germany, 2022; ISBN 978-981-16-7079-4. [Google Scholar]
  63. Agius, C.; Von Tucher, S.; Poppenberger, B.; Rozhon, W. Quantification of sugars and organic acids in tomato fruits. MethodsX 2018, 5, 537–550. [Google Scholar] [CrossRef]
  64. Ma, W.F.; Li, Y.B.; Nai, G.J.; Liang, G.P.; Ma, Z.H.; Chen, B.H.; Mao, J. Changes and response mechanism of sugar and organic acids in fruits under water deficit stress. PeerJ 2022, 10, e13691. [Google Scholar] [CrossRef]
  65. Zhang, X.; Wei, X.; Ali, M.M.; Rizwan, H.M.; Li, B.; Li, H.; Jia, K.; Yang, X.; Ma, S.; Li, S.; et al. Changes in the Content of Organic Acids and Expression Analysis of Citric Acid Accumulation-Related Genes during Fruit Development of Yellow (Passiflora edulis f. flavicarpa) and Purple (Passiflora edulis f. edulis) Passion Fruits. Int. J. Mol. Sci. 2021, 22, 5765. [Google Scholar] [CrossRef]
  66. Murtic, S.; Oljaca, R.; Murtic, M.S.; Vranac, A.; Koleska, I. Effects of seaweed extract on the growth, yield and quality of cherry tomato under different growth conditions. Acta Agric. Slov. 2018, 111, 315–325. [Google Scholar] [CrossRef]
  67. Saldeen, K.; Saldeen, T. Importance of tocopherols beyond a -tocopherol: Evidence from animal and human studies. Nutr. Res. 2005, 25, 877–889. [Google Scholar] [CrossRef]
  68. Pereira, C.; Dias, M.I.; Petropoulos, S.A.; Plexida, S.; Chrysargyris, A.; Tzortzakis, N.; Calhelha, R.C.; Ivanov, M.; Stojković, D.; Soković, M.; et al. The effects of biostimulants, biofertilizers and water-stress on nutritional value and chemical composition of two spinach genotypes (Spinacia oleracea L.). Molecules 2019, 24, 4494. [Google Scholar] [CrossRef]
  69. Oh, M.; Trick, H.N.; Rajashekar, C.B. Secondary metabolism and antioxidants are involved in environmental adaptation and stress tolerance in lettuce. J. Plant Physiol. 2009, 166, 180–191. [Google Scholar] [CrossRef] [PubMed]
  70. Mathur, P.; Ding, Z.; Saldeen, T. Tocopherols in the Prevention and Treatment of Atherosclerosis and Related Cardiovascular Disease. Clin. Cardiol. 2015, 38, 570–576. [Google Scholar] [CrossRef] [PubMed]
  71. Petropoulos, S.A.; Fernandes, Â.; Plexida, S.; Chrysargyris, A.; Tzortzakis, N.; Barreira, J.C.M.; Barros, L.; Ferreira, I.C.F.R. Biostimulants application alleviates water stress effects on yield and chemical composition of greenhouse green bean (Phaseolus vulgaris L.). Agronomy 2020, 10, 181. [Google Scholar] [CrossRef]
  72. Zushi, K.; Matsuzoe, N. Metabolic profile of organoleptic and health-promoting qualities in two tomato cultivars subjected to salt stress and their interactions using correlation network analysis. Sci. Hortic. 2015, 184, 8–17. [Google Scholar] [CrossRef]
  73. Costan, A.; Stamatakis, A.; Chrysargyris, A.; Petropoulos, S.A.; Tzortzakis, N. Interactive effects of salinity and silicon application on Solanum lycopersicum growth, physiology and shelf-life of fruit produced hydroponically. J. Sci. Food Agric. 2020, 100, 732–743. [Google Scholar] [CrossRef]
  74. Zhang, L.; Freschi, G.; Rouphael, Y.; De Pascale, S.; Lucini, L. The differential modulation of secondary metabolism induced by a protein hydrolysate and a seaweed extract in tomato plants under salinity. Front. Plant Sci. 2023, 13, 1072782. [Google Scholar] [CrossRef]
  75. Chen, J.; Liu, H. Nutritional Indices for Assessing Fatty Acids: A Mini-Review. Int. J. Mol. Sci. 2020, 21, 5695. [Google Scholar] [CrossRef]
  76. Simopoulos, A.P. An Increase in the Omega-6 / Omega-3 Fatty Acid Ratio Increases the Risk for Obesity. Nutrients 2016, 8, 128. [Google Scholar] [CrossRef]
  77. Kaliannan, K.; Li, X.; Wang, B.; Pan, Q.; Chen, C.; Hao, L.; Xie, S.; Kang, J.X. Multi-omic analysis in transgenic mice implicates omega-6/omega-3 fatty acid imbalance as a risk factor for chronic disease. Commun. Biol. 2019, 2, 276. [Google Scholar] [CrossRef]
  78. Borguini, R.G.; da Silva Torres, E.A.F. Tomatoes and tomato products as dietary sources of antioxidants. Food Rev. Int. 2009, 25, 313–325. [Google Scholar] [CrossRef]
Figure 1. The map of the experimental plot at the experimental farm of the University of Thessaly in Velestino, Greece (22.756 E, 39.395 N).
Horticulturae 09 01184 g001
Figure 2. The amounts of water (m3 ha−1) that plants received through irrigation and rainfall throughout the growing period. Two distinct periods are considered, namely from transplantation until the crop establishment and regulated deficit irrigation initiation (e.g., regular irrigation (RI): 100% of field capacity; regulated deficit irrigation (RDI): 65% of field capacity) and from regulated deficit irrigation until harvest.
Horticulturae 09 01184 g002
Figure 3. Precipitation (mm of rain) and mean air temperature (°C) throughout the growing period of May 2021–August 2021 and the average values of mean air temperature and precipitation over the last 20 years (2000–2020).
Horticulturae 09 01184 g003
Figure 4. The layout of the experiment. Tr1: proteins (20%), free L-amino acids (11%), short chain peptides (24%) of plant origin + carboxylic acids (5%); Tr2: proteins (20%), free L-amino acids (11%), short chain peptides (24%) of plant origin + algae extract (Laminaria digitata + Ascophyllum nodosum); Tr3: humic and fulvic acids balanced solution + algae extract (Laminaria digitata + Ascophyllum nodosum); Tr4: SiO2 (92%; w/w); C: no biostimulants added. RI: regular irrigation (100% of field capacity); RDI: regulated deficit irrigation (65% of field capacity).
Horticulturae 09 01184 g004
Figure 5. Three-dimensional scatterplot of principal components 1, 2, and 3 for processing tomato fruit.
Horticulturae 09 01184 g005
Figure 6. The loading plot of principal components 1 and 2 for processing tomato fruit.
Horticulturae 09 01184 g006
Figure 7. The loading plot of principal components 1 and 3 for processing tomato fruit.
Horticulturae 09 01184 g007
Table 1. Proximate composition and energy value of the tested tomato samples (mean ± SD; n = 3).
Regulated Deficit IrrigationMoisture
(g 100 g−1 fw)
Proteins
(g 100 g−1 fw)
Crude Fat
(g 100 g−1 fw)
Ash
(g 100 g−1 fw)
Carbohydrates
(g 100 g−1 fw)
Energy
(kcal 100 g−1 fw)
Tr192.7 ± 1.8 c1.04 ± 0.03 bc0.082 ± 0.003 b0.47 ± 0.02 d5.7 ± 0.2 b27.9 ± 0.1 bc
Tr292.1 ± 1.6 d1.04 ± 0.02 bc0.075 ± 0.005 cd0.61 ± 0.03 a6.2 ± 0.2 a29.7 ± 0.8 a
Tr392.0 ± 0.7 d1.25 ± 0.03 a0.075 ± 0.005 cd0.59 ± 0.02 a6.1 ± 0.2 a30.1 ± 0.8 a
Tr492.8 ± 1.3 c1.07 ± 0.06 b0.062 ± 0.003 f0.59 ± 0.03 a5.5 ± 0.2 b26.6 ± 0.8 c
Control92.5 ± 0.5 c1.28 ± 0.02 a0.077 ± 0.003 c0.55 ± 0.02 b5.6 ± 0.2 b28.2 ± 0.8 b
Regular IrrigationMoisture
(g 100 g−1 fw)
Proteins
(g 100 g−1 fw)
Crude fat
(g 100 g−1 fw)
Ash
(g 100 g−1 fw)
Carbohydrates
(g 100 g−1 fw)
Energy
(kcal 100 g−1 fw)
Tr194.0 ± 1.3 a1.01 ± 0.01 c0.066 ± 0.001 ef0.50 ± 0.01 c4.4 ± 0.2 de22.2 ± 0.8 e
Tr293.8 ± 1.1 a0.86 ± 0.03 d0.070 ± 0.004 de0.49 ± 0.02 cd4.7 ± 0.2 cd23.0 ± 0.8 e
Tr393.9 ± 1.5 a0.86 ± 0.01 d0.077 ± 0.005 bc0.49 ± 0.01 cd4.6 ± 0.2 d22.7 ± 0.8 e
Tr494.2 ± 2.2 a1.05 ± 0.03 bc0.069 ± 0.002 e0.50 ± 0.02 c4.2 ± 0.2 e21.7 ± 0.8 e
Control93.3 ± 1.4 b1.04 ± 0.05 bc0.090 ± 0.005 a0.55 ± 0.03 b5.1 ± 0.2 c25.2 ± 0.7 d
Means in the same column followed by different Latin letters are significantly different according to Tukey’s HSD test at p = 0.05.
Table 2. Free sugars and organic acids composition of the tomato samples (mean ± SD; n = 3).
Free Sugars (g 100 g−1 fw)Organic Acids (mg 100 g−1 fw)
Regulated Deficit IrrigationFructoseGlucoseSucroseTotalOxalic AcidMalic AcidAscorbic AcidCitric AcidTotal
Tr13.3 ± 0.2 a1.58 ± 0.08 a0.040 ± 0.002 b4.9 ± 0.2 a71 ± 1 c544 ± 14 b14.5 ± 0.2 c754 ± 21 d1383 ± 12 c
Tr22.74 ± 0.06 c1.36 ± 0.05 c0.030 ± 0.001 c4.13 ± 0.02 c48 ± 3 f616 ± 26 a17.0 ± 0.7 a815 ± 29 c1497 ± 59 b
Tr32.4 ± 0.2 d1.02 ± 0.06 d0.030 ± 0.002 c3.4 ± 0.2 d61 ± 2 d473 ± 19 c7.9 ± 0.2 f821 ± 25 c1362 ± 7 c
Tr43.05 ± 0.08 b1.48 ± 0.05 b0.040 ± 0.002 b4.57 ± 0.04 b61 ± 4 de602 ± 29 a16.3 ± 0.2 b724 ± 30 e1403 ± 63 c
Control2.37 ± 0.02 d1.00 ± 0.05 d0.060 ± 0.003 a3.43 ± 0.04 d57 ± 3 e588 ± 39 a13.3 ± 0.2 d941 ± 9 a1599 ± 12 a
Regular IrrigationFructoseGlucoseSucroseTotalOxalic AcidMalic AcidAscorbic AcidCitric AcidTotal
Tr12.2 ± 0.1 e0.91 ± 0.05 e0.030 ± 0.001 d3.16 ± 0.08 ef57 ± 2 de329 ± 16 d3.8 ± 0.1 g634 ± 7 f1024 ± 25 e
Tr22.04 ± 0.09 f0.97 ± 0.07 de0.0100 ± 0.0003 e3.0 ± 0.2 f49 ± 4 f276 ± 9 e0.50 ± 0.01 j577 ± 18 g902 ± 10 g
Tr31.84 ± 0.04 g0.75 ± 0.04 f0.010 ± 0.001 e2.60 ± 0.09 g61 ± 2 de321 ± 22 d2.6 ± 0.1 h701 ± 10 e1085 ± 30 d
Tr41.88 ± 0.05 g0.57 ± 0.02 g0.0100 ± 0.0002 e2.46 ± 0.06 g102 ± 3 a303 ± 6 de1.7 ± 0.1 i565 ± 20 g972 ± 10 f
Control2.33 ± 0.02 de0.95 ± 0.05 de0.010 ± 0.001 e3.30 ± 0.03 de77 ± 6 b541 ± 25 b11.8 ± 0.5 e888 ± 15 b1517 ± 36 b
Means in the same column followed by different Latin letters are significantly different according to Tukey’s HSD test at p = 0.05.
Table 3. Tocopherols and carotenoids composition of the tested tomato samples (mean ± SD; n = 3).
Tocopherols (μg 100 g−1 fw)Carotenoids (μg 100 g−1 fw)
Regulated Deficit Irrigationα-Tocopherolβ-Tocopherolγ-Tocopherolδ-TocopherolTotalLycopeneβ-Carotene
Tr1520 ± 6 b58 ± 1 c143 ± 3 b11.5 ± 0.3 a732 ± 10 b404 ± 4 g346 ± 4 c
Tr2448 ± 4 c73 ± 3 b108 ± 1 c9.8 ± 0.4 b639 ± 9 c728 ± 8 b506 ± 4 a
Tr3555 ± 29 and233 ± 11 and788 ± 39 a761 ± 16 a515 ± 26 a
Tr4406 ± 12 d78 ± 1 a110 ± 1 c6.9 ± 0.5 c601 ± 11 d568 ± 9 c398 ± 11 b
Control408 ± 4 d33 ± 1 h99 ± 1 dnd540 ± 6 e489 ± 5 e391 ± 1 b
Regular
Irrigation
FructoseGlucoseSucroseTotalOxalic AcidMalic AcidAscorbic Acid
Tr1212 ± 3 g52 ± 2 e51 ± 2 hnd314 ± 7 h238 ± 14 j199 ± 4 f
Tr2213 ± 2 g36 ± 2 g63 ± 4 fnd312 ± 4 h358 ± 14 h224 ± 18 e
Tr3215 ± 2 g18 ± 1 i42 ± 2 ind275 ± 5 i272 ± 5 i191 ± 7 f
Tr4290 ± 3 f55 ± 2 d56 ± 2 gnd401 ± 8 g544 ± 6 d337 ± 22 cd
Control319 ± 10 e48 ± 2 f79 ± 2 end446 ± 14 f441 ± 5 f321 ± 7 d
Means in the same column followed by different Latin letters are significantly different according to Tukey’s HSD test at p = 0.05; nd: not detected.
Table 4. Fatty acids composition of the tested tomato samples (mean ± SD; n = 3).
Fatty AcidsCategories
Deficit
Irrigation
C14:0C16:0C18:0C18:1n9C18:2n6C18:3n3C20:0C23:0C24:0SFAMUFAPUFAPUFA/SFAn6/n3
Tr10.62 ± 0.04 e24.9 ± 0.3 gnd24.4 ± 0.8 a40.3 ± 0.5 a6.1 ± 0.4 bnd0.26 ± 0.02nd26.3 ± 0.3 h27 ± 1 a47 ± 1 a1.79 ± 0.04 a6.5 ± 0.2 c
Tr20.75 ± 0.01 c27 ± 1 fnd21.6 ± 0.6 b38.4 ± 0.5 b7.5 ± 0.2 and0.34 ± 0.011.03 ± 0.04 b30 ± 1 g23 ± 1 b47.1 ± 0.3 a1.59 ± 0.04 b5.1 ± 0.1 d
Tr31.00 ± 0.06 b52 ± 1 a9.0 ± 0.4 c5.5 ± 0.4 fg24 ± 2 f3.3 ± 0.1 c1.09 ± 0.07 cd2.1 ± 0.20.65 ± 0.02 f67 ± 1 ab5.9 ± 0.3 f27 ± 2 c0.40 ± 0.02 d7.1 ± 0.5 c
Tr41.18 ± 0.06 a50 ± 1 b9.3 ± 0.1 c5.1 ± 0.1 g23.2 ± 0.9 f2.6 ± 0.1 d1.01 ± 0.03 e3.7 ± 0.10.97 ± 0.07 c68 ± 1 a5.4 ± 0.1 g27 ± 1 c0.39 ± 0.01 d9.00 ± 0.01 b
Control0.73 ± 0.05 c47 ± 1 c11.1 ± 0.6 a5.9 ± 0.1 ef27 ± 1 cd3.2 ± 0.1 c1.22 ± 0.06 b1.20 ± 0.030.63 ± 0.04 f63 ± 1 d6.3 ± 0.1 ef31 ± 1 b0.48 ± 0.01 c8.5 ± 0.1 b
Regular
Irrigation
C14:0C16:0C18:0C18:1n9C18:2n6C18:3n3C20:0C23:0C24:0SFAMUFAPUFAPUFA/SFAn6/n3
Tr10.72 ± 0.01 c45 ± 2 d9.0 ± 0.4 c15.5 ± 0.2 d21 ± 1 g2.2 ± 0.1 ef1.04 ± 0.07 de2.34 ± 0.090.73 ± 0.03 e61 ± 2 e15.7 ± 0.2 d24 ± 1 d0.39 ± 0.02 d9.6 ± 0.6 b
Tr20.70 ± 0.03 cd50 ± 1 b10.0 ± 0.3 b5.0 ± 0.4 g26 ± 1 de2.2 ± 0.2 ef1.13 ± 0.02 c2.89 ± 0.040.80 ± 0.05 d67 ± 2 ab5.2 ± 0.4 g28 ± 1 c0.42 ± 0.02 d11.8 ± 0.3 a
Tr30.65 ± 0.03 de47 ± 1 c11.3 ± 0.7 a6.3 ± 0.1 e25 ± 2 ef2.2 ± 0.1 ef1.24 ± 0.07 b2.9 ± 0.11.06 ± 0.07 b66 ± 2 bc6.6 ± 0.1 e27 ± 2 c0.41 ± 0.03 d12 ± 1 a
Tr40.66 ± 0.05 de50 ± 3 b11.5 ± 0.2 a5.0 ± 0.3 g28 ± 2 c2.4 ± 0.2 e1.65 ± 0.08 and1.33 ± 0.05 a65 ± 3 cd5.0 ± 0.3 g30 ± 2 b0.47 ± 0.04 c11.8 ± 1.2 a
Control0.53 ± 0.01 f40 ± 1 e8.5 ± 0.3 d18.0 ± 0.4 c25.2 ± 0.6 e2.1 ± 0.1 f1.05 ± 0.04 de2.00 ± 0.030.67 ± 0.05 ef54 ± 1 f18.2 ± 0.4 c28 ± 1 c0.51 ± 0.01 c12.1 ± 0.5 a
C14:0—myristic acid; C16:0—palmitic acid; C18:0—stearic acid; C18:1n9c—oleic acid; C18:2n6c—linoleic acid; C18:3n3—linolenic acid; C20:0—arachidic acid; C23:0—tricosylic acid; C24:0—lignoceric acid; SFA—saturated fatty acids; MUFA—monounsaturated fatty acids; PUFA—polyunsaturated fatty acids. Means in the same column followed by different Latin letters are significantly different according to Tukey’s HSD test at p = 0.05; nd: not detected.
Table 5. Total phenolic and flavonoids contents and antioxidant activity of the tomato samples (mean ± SD; n = 3).
Regulated Deficit
Irrigation
Total Phenolic
(mg GAE g−1 Extract)
Total Flavonoids
(mg QE g−1 Extract)
TBARS
(EC50, μg mL−1)
OxHLIA
(IC50, μg mL−1)
Tr118.4 ± 0.7 g3.0 ± 0.1 b556 ± 21 b67 ± 5 de
Tr217.5 ± 0.5 h2.9 ± 0.1 c268 ± 17 g25 ± 2 f
Tr323.9 ± 0.3 a2.6 ± 0.1 f584 ± 17 a15.4 ± 0.6 g
Tr420.5 ± 0.6 c2.4 ± 0.1 g518 ± 7 c138 ± 8 b
Control24 ± 1 a2.7 ± 0.1 e190 ± 7 h67 ± 4 de
Regular
Irrigation
Total Phenolic
(mg GAE g−1 Extract)
Total Flavonoids
(mg QE g−1 Extract)
TBARS
(EC50, μg mL−1)
OxHLIA
(IC50, μg mL−1)
Tr119.6 ± 0.7 d3.17 ± 0.04 a477 ± 17 d83 ± 3 d
Tr217.3 ± 0.4 h2.60 ± 0.03 ef270 ± 6 g55 ± 5 e
Tr318.9 ± 0.2 f3.0 ± 0.2 b332 ± 17 f62 ± 5 e
Tr422.5 ± 0.9 b2.6 ± 0.1 e326 ± 4 f106 ± 7 c
Control19.2 ± 0.7 e2.8 ± 0.1 d396 ± 7 e718 ± 21 a
Trolox--5.4 ± 0.321.8 ± 0.3
Means in the same column followed by different Latin letters are significantly different according to Tukey’s HSD test at p = 0.05; GAE: gallic acid equivalents; QE: quercetin equivalents.
Disclaimer/Publisher’s Note: The statements, opinions and data contained in all publications are solely those of the individual author(s) and contributor(s) and not of MDPI and/or the editor(s). MDPI and/or the editor(s) disclaim responsibility for any injury to people or property resulting from any ideas, methods, instructions or products referred to in the content.

