Article

Quantifying the Effect of Light Intensity Uniformity on the Crop Yield by Pea Microgreens Growth Experiments

Institute of Agronomy, Hungarian University of Agriculture and Life Sciences, 2100 Gödöllő, Hungary
*
Author to whom correspondence should be addressed.
Horticulturae 2023, 9(11), 1187; https://doi.org/10.3390/horticulturae9111187
Submission received: 30 September 2023 / Revised: 18 October 2023 / Accepted: 27 October 2023 / Published: 30 October 2023
(This article belongs to the Special Issue Effects of Light Quantity and Quality on Horticultural Crops)

Abstract

:
Differences in individual plant growth are affected by the spatial variation of light intensity, reducing the homogeneity of microgreen crops. Identifying the tradeoffs between light uniformity and crop quality is challenging due to the confounding effect of nonuniform illuminance with other noise factors. This study presents the results of hydroponic pea (Pisum sativum, L.) growth experiments aimed at quantifying the effect of photon irradiance variations. By adjusting the power of LED luminaires, we established one uniformly illuminated zone and two non-uniformly illuminated zones. Germinated seeds with 6 cm-long radicles were transplanted to cultivation trays with known light intensity in predetermined positions. Plants were cut 12 days after the start of light treatment and measured for fresh weight and shoot height. Our findings revealed no significant difference between the crop yield on trays having the same average PPFD but different light uniformity. However, correlation analysis of individual measurement data showed that local PPFD differences explained 31% of the fresh weight variation, and the rest was attributed to noise in the germination and growth processes. We also discuss the implications of our findings for the design and optimization of vertical farms.

1. Introduction

Growing young edible vegetables, collectively known as microgreens, have gained popularity recently and have become one of the fastest-growing segments of indoor vertical farming [1]. Microgreens are young seedlings of leafy vegetables and herbs that are favored in new culinary trends due to their unusual appearance, bright color, intense flavor, crisp texture, and unique nutrient profile [2]. A huge number of species can be consumed as microgreens [3]. By value, Brassicaceae microgreens dominate the global market, led by broccoli at 15%, followed by arugula at 9% [1]. Edible plants originally cultivated for seeds and not for shoots, like peas, beans, cereals, and sunflowers, are also popular microgreens and are cultivated in large quantities.
Microgreens containing high levels of carotenoids, chlorophylls, and organic acids are associated with several health benefits, including anti-diabetic and anticholinergic activity, and are recommended as a functional food for a daily diet [4]. Microgreens are harvested at an immature growth stage, shortly after the full development of cotyledons and at the emergence of the first true leaves [5]. Depending on the species, the time between seeding and harvest is between 1 and 2 weeks [6]. The short cultivation cycle, high seeding density, low shoot height, and high market value make microgreens an attractive crop for vertical farming.
Indoor vertical farms use LED lighting as their sole source of light, giving growers complete control over the environmental factors affecting plant growth. This allows for year-round production in any location, close to consumers [7]. However, the profitability of microgreen production is hindered by two major factors: the market value of the fresh produce and the cost of operating the vertical farm. Since both factors are heavily influenced by lighting, optimizing lighting conditions for the plants becomes a critical challenge in vertical farming. To maximize space utilization, horizontal cultivation layers are densely packed with plants, and LED lights are mounted near the plant canopy [8]. The short separation distance between luminaires and the canopy can reduce photon irradiance uniformity, leading to spatial variation in plant growth. The plants in the middle of cultivation trays tend to grow taller and accumulate more biomass, while those on the edges are smaller and lighter. Although this center and edge effect is often attributed to uneven light distribution [9], other microenvironmental factors, such as airflow or genetic differences between individual seeds, can sometimes mask the effects of nonuniform light distribution.
The lighting conditions play a significant role in the growth of microgreens and are typically evaluated based on the horizontal photosynthetic photon flux density (PPFD) at the canopy level [10]. The light intensity has been found to impact both the yield and quality of microgreens [11]. At the early stages of plant development, photosynthesis by the cotyledon is a crucial process [12,13], which in turn influences the rate of subsequent seedling development [14,15].
In the present practice, one PPFD value is provided to describe lighting conditions in a vertical farm, though horticultural lighting guidelines recommend measuring PPFD values at several representative points of the working area and reporting both mean and standard deviations [16]. The spatial variations across the illuminated plane are characterized by the photon irradiance uniformity (Uo), defined as the quotient of the minimum reading and the average of data points. Another uniformity metric is diversity, (Ud), defined as the minimum to maximum ratio [10,17].
The measurement of PPFD is limited to the photosynthetically active radiation (PAR), which spans from 400 nm to 700 nm. However, studies have shown that relying solely on this range to evaluate photosynthetic activity has its limitations. Far-red photons interact with shorter-wavelength radiation, resulting in a synergistic effect that contributes to photosynthesis [18]. Consequently, pushing the upper limit of the PAR range to 750 nm has been recommended [19].
The intensity and the spectrum of light both determine the growth rate and the phytochemical content of microgreens [3]. In horticulture, most commercial lighting equipment comprises monochromatic blue, red, and far-red LED chips. The red and blue (R/B) or red and far-red (R/FR) photon irradiance ratios characterize the spectral distribution of incident radiation [20]. Plants grown under extremely low or high R/B ratios exhibit physiological disorders, and a balance between the photon irradiance ratios of various wavebands should be set to ensure proper conditions for plant development [21]. Many studies have investigated the optimal R/B or R/FR ratios for indoor crop production [22,23,24,25,26].
The various environmental factors that affect plant growth, such as lighting parameters, temperature, humidity, and carbon dioxide concentration of air, as well as the composition of the nutrient solution, all interact with one another. To achieve optimal crop yield and quality, it is crucial to control and optimize all these parameters. However, measuring the light response curve of plant growth in a multidimensional parameter space requires significant experimental efforts.
High-speed automated procedures have been developed for 3D characterization of the lighting environment [27,28,29,30] as well as for quick phenotyping and monitoring of plant growth [9,15,30,31]. With the aid of a high-throughput experimental unit, one can efficiently screen a vast array of parameter settings and extract the transfer function linking growth traits to environmental parameters. However, transitioning the experimental light response functions into commercial production poses a challenge due to the presence of numerous unknown noise factors.
Our approach was to carry out the lighting experiments under the conditions of commercial production. We created a gradient in the lighting conditions by controlling the luminaires of the vertical farm. The objectives of the present study were to quantify the effect of spatial photon irradiance variations on the growth traits of pea microgreens and retrieve the transfer function between the fresh weight of individual seedlings and the local PPFD values to be used for the optimization of commercial microgreen production.

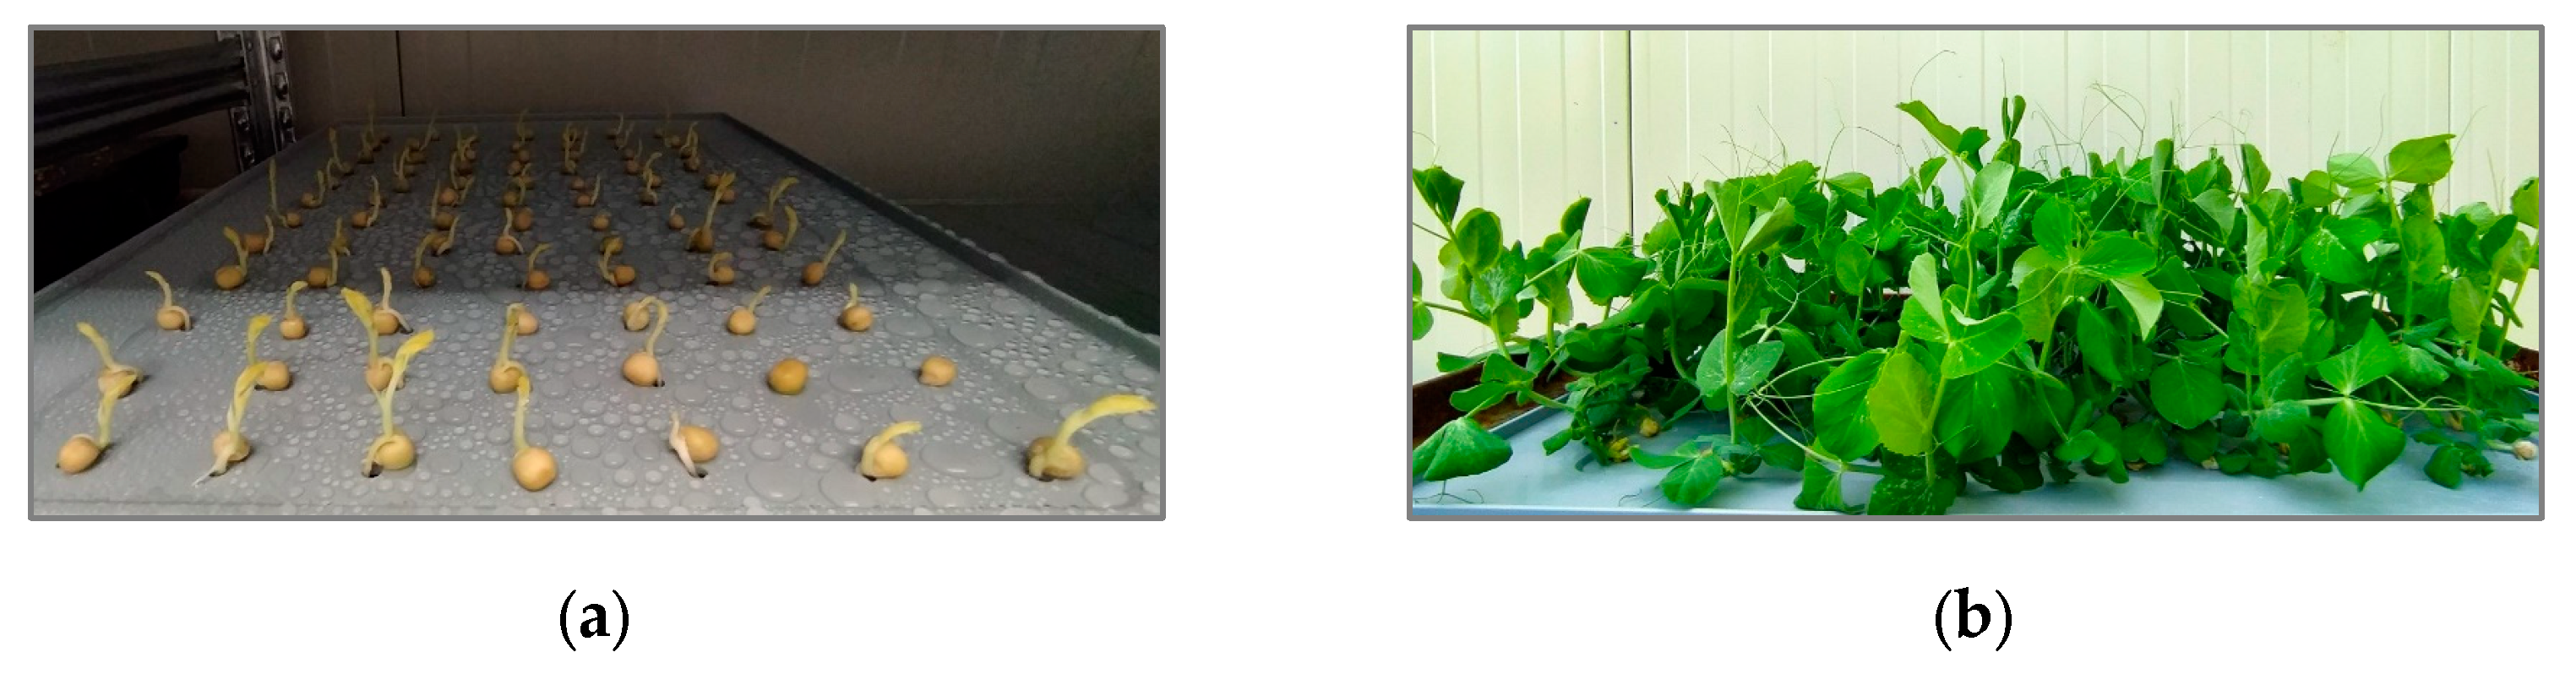
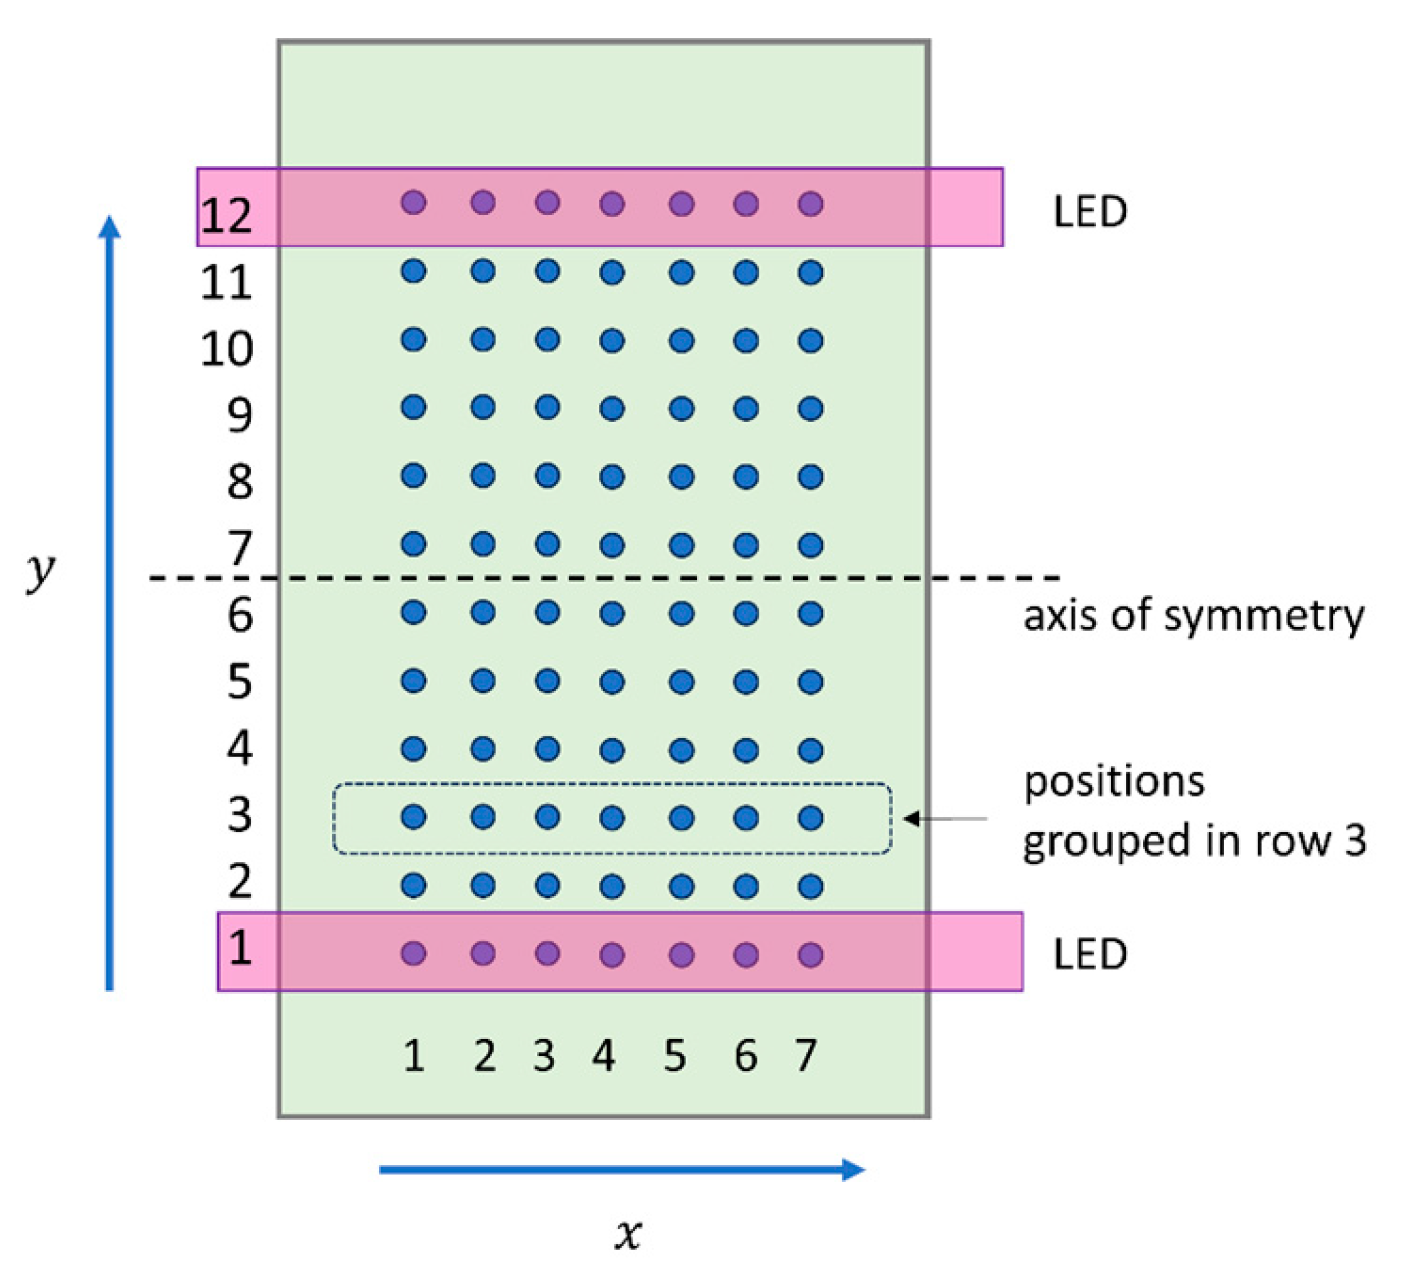
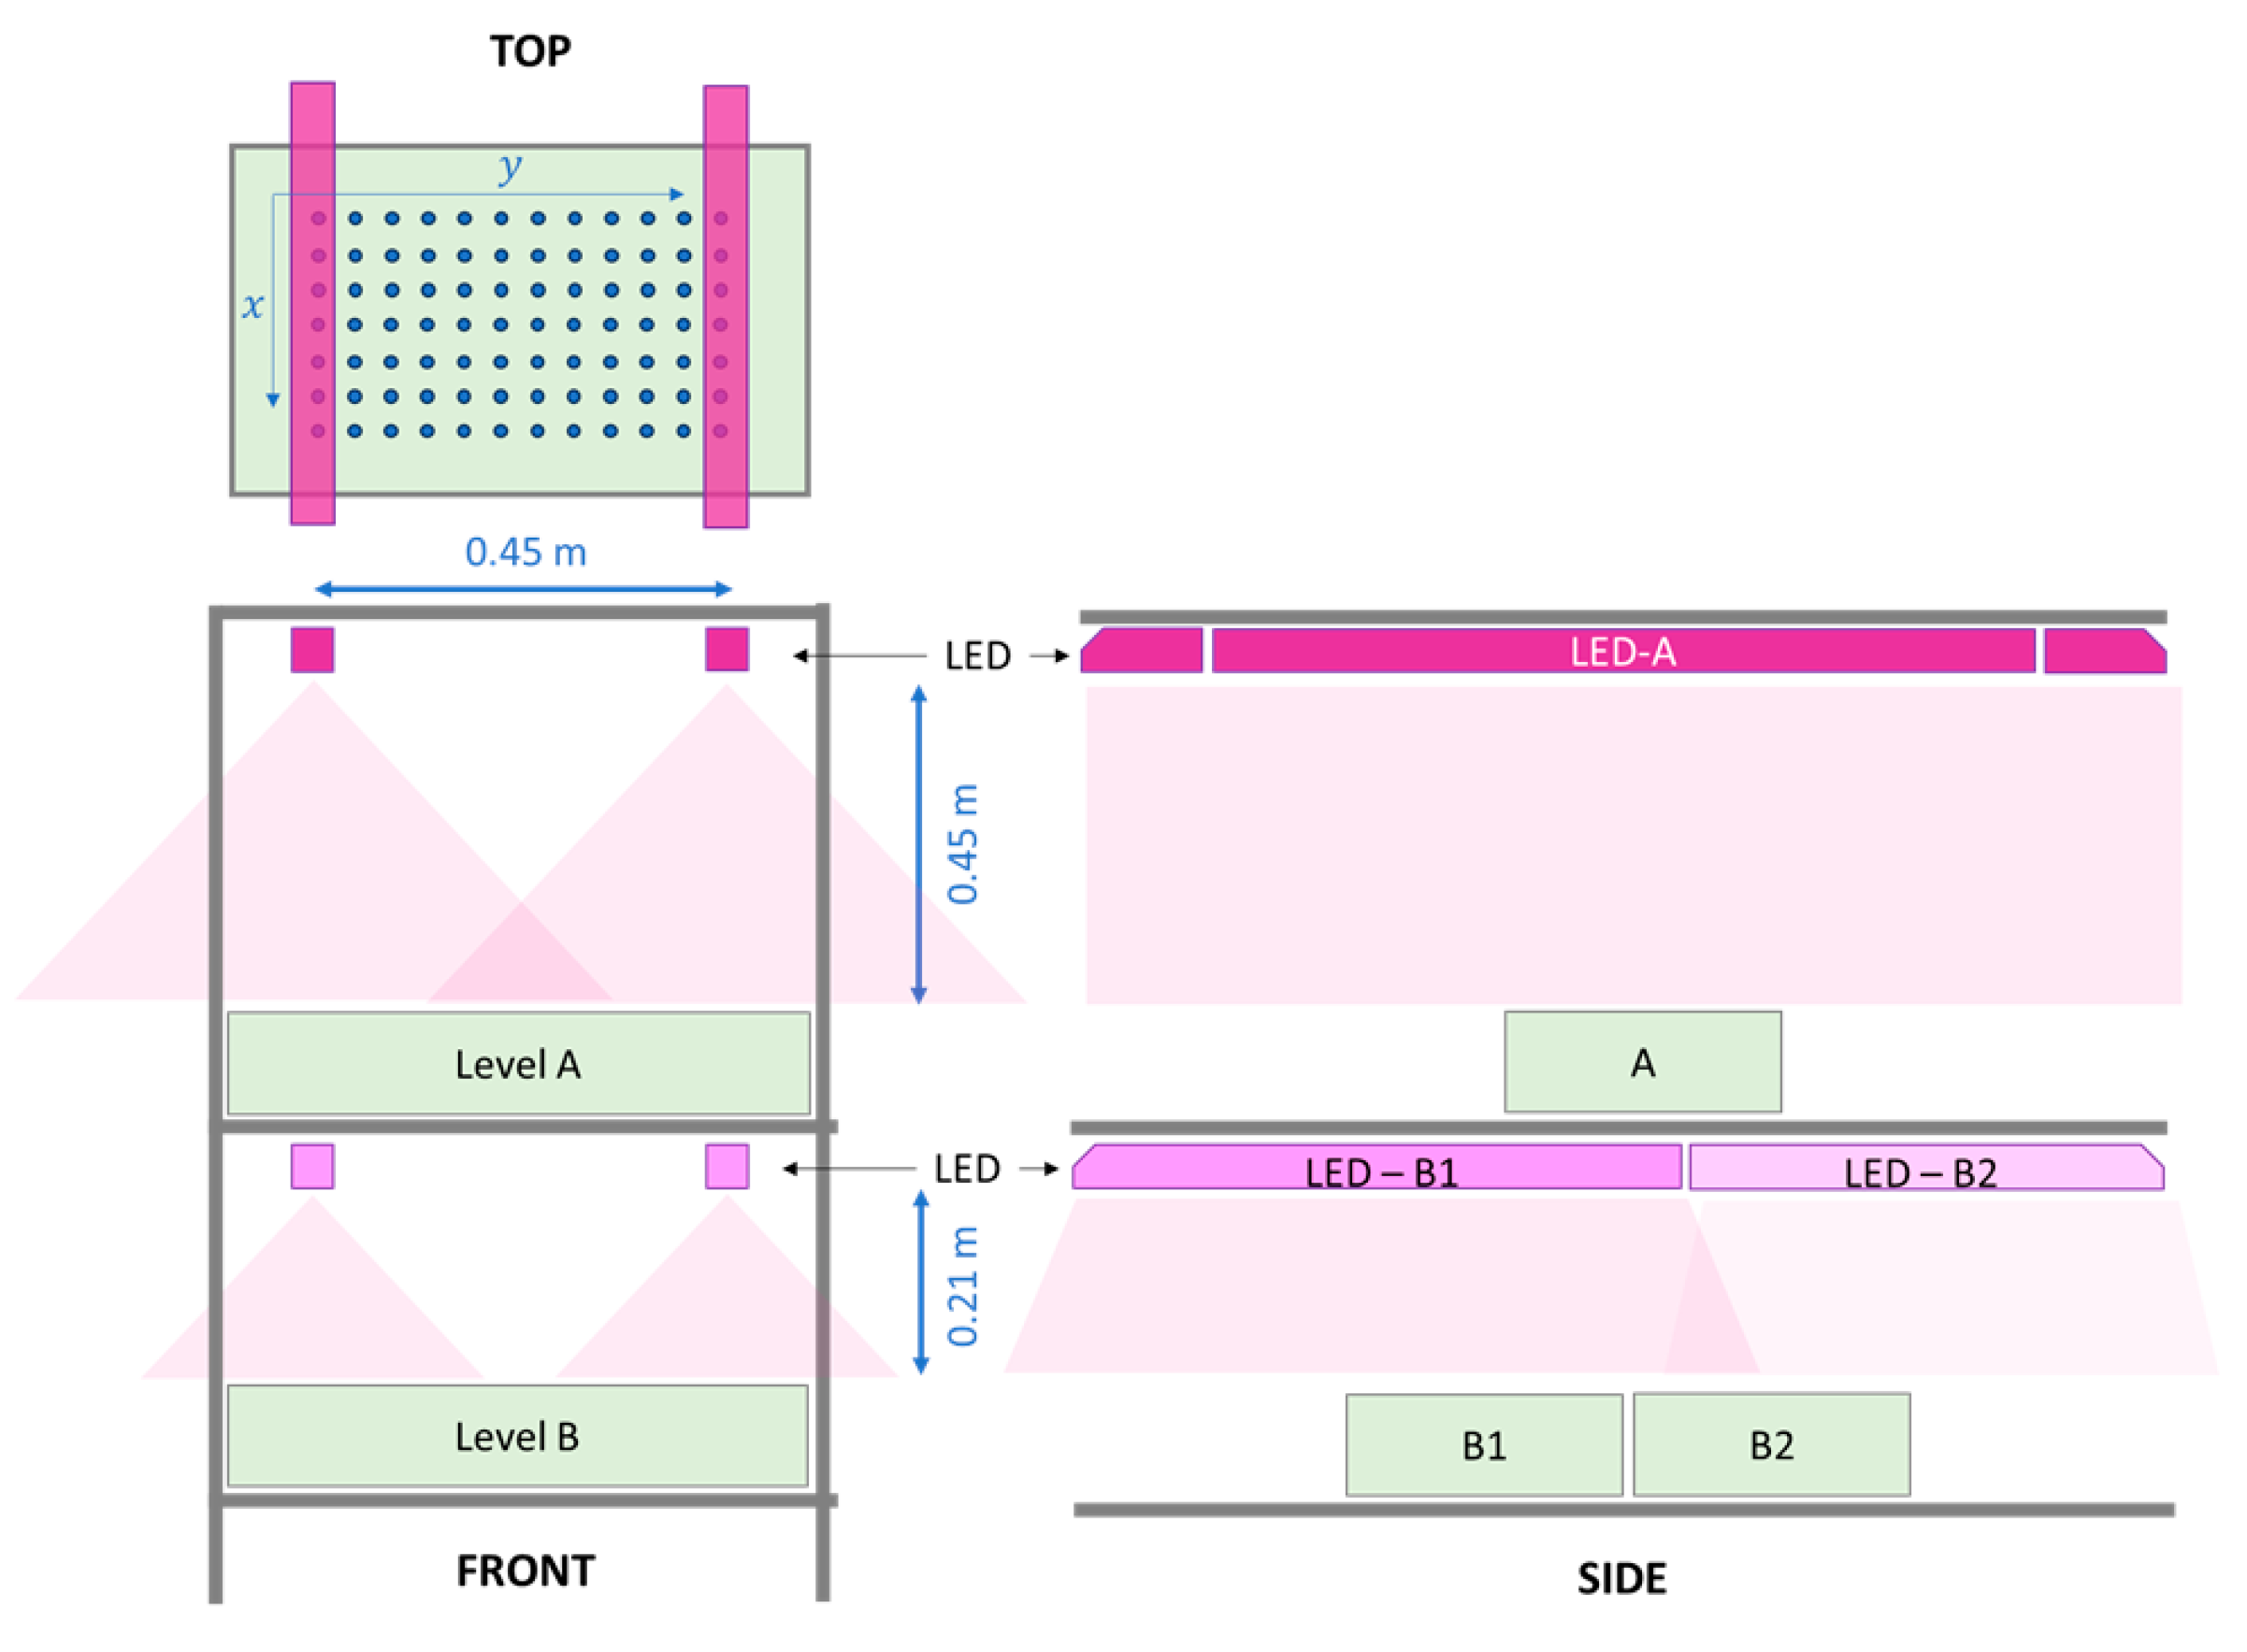
2. Materials and Methods

Plant growth tests were carried out in a climate-controlled container farm of the Hungarian University of Agriculture designed to be a scalable cultivation unit of a larger plant factory. Fans positioned in the middle and at the end of each shelf maintained constant airflow over the canopy to minimize spatial differences in temperature, humidity, and CO2 concentration. Air parameters were checked by an ALMEMO 2590 measuring instrument (Ahlborn Mess- und Regelungstechnik GmbH, Holzkirchen, Germany). Leaf surface temperature was recorded by an infrared thermometer (AHG Wahtsmuth & Krogmann mbH, Hamburg, Germany). The average temperature and relative humidity during the tests were kept within the 20 ± 2 °C and 75 ± 5% range, respectively. In our vertical farm, we did not apply CO2 injection. The CO2 concentration varied between 400 ppm and 600 ppm throughout the experiments. The lowest value was measured during the light period when the photosynthesis consumed carbon dioxide, and the highest concentration was detected at the end of the dark period. The carbon dioxide level increased temporarily up to 1200 ppm in the presence of a human operator, but the concentration difference between different points of the vertical farm was less than 10%. The experiments comprised two steps, starting with germination in the dark, followed by seedling development under three different light treatments. Pea (Pisum sativum L., cv. Kleine Rheinländerin) seeds were obtained from Royal Sluis (Enkhuizen, Holland). Seeds were soaked in distilled water for 24 h and then placed on perforated stainless-steel sheets with round holes of 5 mm diameter. The plantation distance between adjacent seeds was 4 cm. Metal sheets with the seeds were placed into a germination box, ensuring saturated moisture at the 20 °C ambient temperature.
After 7 days, germinated seeds with longer than 6 cm radicles were transplanted to plastic cultivation trays with 5 mm-diameter holes arranged in a 12 × 7 array with a 4 cm grid size. The top view of the plant arrangement, along with the definition of the directions, is shown in Figure 1. The x-axis is parallel to the line of LED luminaires, whereas the y-axis is perpendicular to the LED pairs. The LED luminaires were positioned above the first and twelfth rows. In the analysis, the row numbers on the y-axis and column numbers on the x-axis were used for the identification of seedlings’ positions. The picture of the seedlings transplanted to the cultivation tray is shown in Figure 2a, and the seedlings prior to harvest are shown in Figure 2b.
The radicle was immersed into a nutrient solution mixed from a three-component commercial formula (Dutch Formula Grow, Advanced Hydroponics of Holand, 1-Grow: 2 mL/L, 2-Bloom: 2 mL/L, 3-Micro: 1 mL/L). During the entire experiment, the electrical conductivity and the pH of the nutrient solutions were in the range of 1.50 ± 0.05 mS/cm and 6.9 ± 0.1, respectively, measured by a universal measuring instrument (Combi 5000, STEP Systems GmbH, Nürnberg, Germany).
The schematic diagram of the experimental set-up is shown in Figure 3. Plant growth was carried out simultaneously at three different positions of the vertical farm in three cultivation containers coded as A, B1, and B2. The dimensions of the containers were 60 cm × 40 cm × 7.5 cm. The plants on A, B1, and B2 were exposed to three different lighting conditions determined by the position of the trays relative to the LEDs as well as the power of the luminaires. Two layers of the vertical farm were used in the experiments. In levels A and B, the separation distances between the LED luminaires and the planes of the cultivation trays were 45 cm and 21 cm, respectively. In each level, three pairs of 120 cm long variable-spectrum LED luminaires equipped with secondary optics ensuring an 80° beam angle (Hortiled Multi 4DIM, Hortilux, Den Haag, The Netherlands) were mounted to the edges of the shelves, covering the 3.6 m length of the shelving unit. The photon intensity distribution diagram of the 80° beam angle luminaires is shown in Figure S1.
Our objective was to establish a highly uniform PPFD distribution across tray A and a non-uniform distribution on tray B1, having the same average PPFD as tray A. The light distribution across the plane of B2 was designed to cover a broad intensity range, from the high values on the left corners going down to the extremely low values on the right side. To achieve this goal, the power of the luminaires coded as LED-A, LED-B1, and LED-B2 in Figure 3 was set at 59.5%, 41.7%, and 5% of the nominal value. The on and off times as well as the power of each color channel of the luminaires were set by a DALI (Digitally Addressable Lighting Interface) controller (DLC-02 DALI Digital Lighting Controller, Mean-Well, Taiwan). Only the light intensity was tailored at the three locations of the test; the relative spectral distribution of irradiance, i.e., the power ratio of the color channels, was held constant. The spectral irradiance values were measured with 5 nm resolution at every position of the cultivation trays using a handheld spectroradiometer (Mavospec Base, GOSSEN Foto- und Lichtmesstechnik GmbH, Nürnberg, Germany).
The plant growth was carried out at a constant 20 °C temperature. The photoperiod was 16 h per day in each light treatment. Shoots were cut 12 days after transplantation and measured for length and fresh weight. A picture of seedlings prior to harvest is shown in Figure 2b. The weight of the individual seedlings was measured by a precision balance (Kern EMB 200-3, Kern & Sohn GmbH, Balingen, Germany).
Statistical analysis of measurement data was carried out using normality, Kruskall–Wallis, and Levene’s tests from the statistical module of the SciPy [32] open-source Python package. Significance levels were set at p < 0.05 throughout the data analysis.

3. Results

The objective of the experiment was to compare the growth traits of pea seedlings cultivated under three different light-intensity distributions while keeping the light spectrum constant across all cultivation trays. Table 1 summarizes the main statistical parameters and uniformity measures (Uo, Ud) determined for A, B1, and B2. The columns of Table 1 contain both the lighting-related information (PPFD, photon irradiances in the B, G, R, and FR wavebands, as well as the R/B ratio) and the shoot fresh weight (FW). The D’Agostino-Pearson normality test [33] was carried out for all measured datasets. The null hypothesis was that the sample came from a normal distribution. The p-value of the normality test is also listed for each distribution in Table 1. The p < 0.05 values indicate cases where the normality assumption can be rejected with 95% confidence. By checking the rows of p-values in Table 1, it is obvious that most of the data are from non-normal distributions. The ANOVA method generally used in data analysis requires samples with normal distributions as input; therefore, non-parametric hypothesis tests were used for the comparison of data. The Kruskal–Wallis test is a non-parametric version of ANOVA, testing the medians rather than the means of the samples. In our analysis, we assumed that conclusions drawn on medians were valid for the mean values as well. In Section 3.1, we provide the quantitative measures of the lighting environments for the three cultivation trays. In Section 3.2, the individual shoot weight data are presented and compared with light measurements.

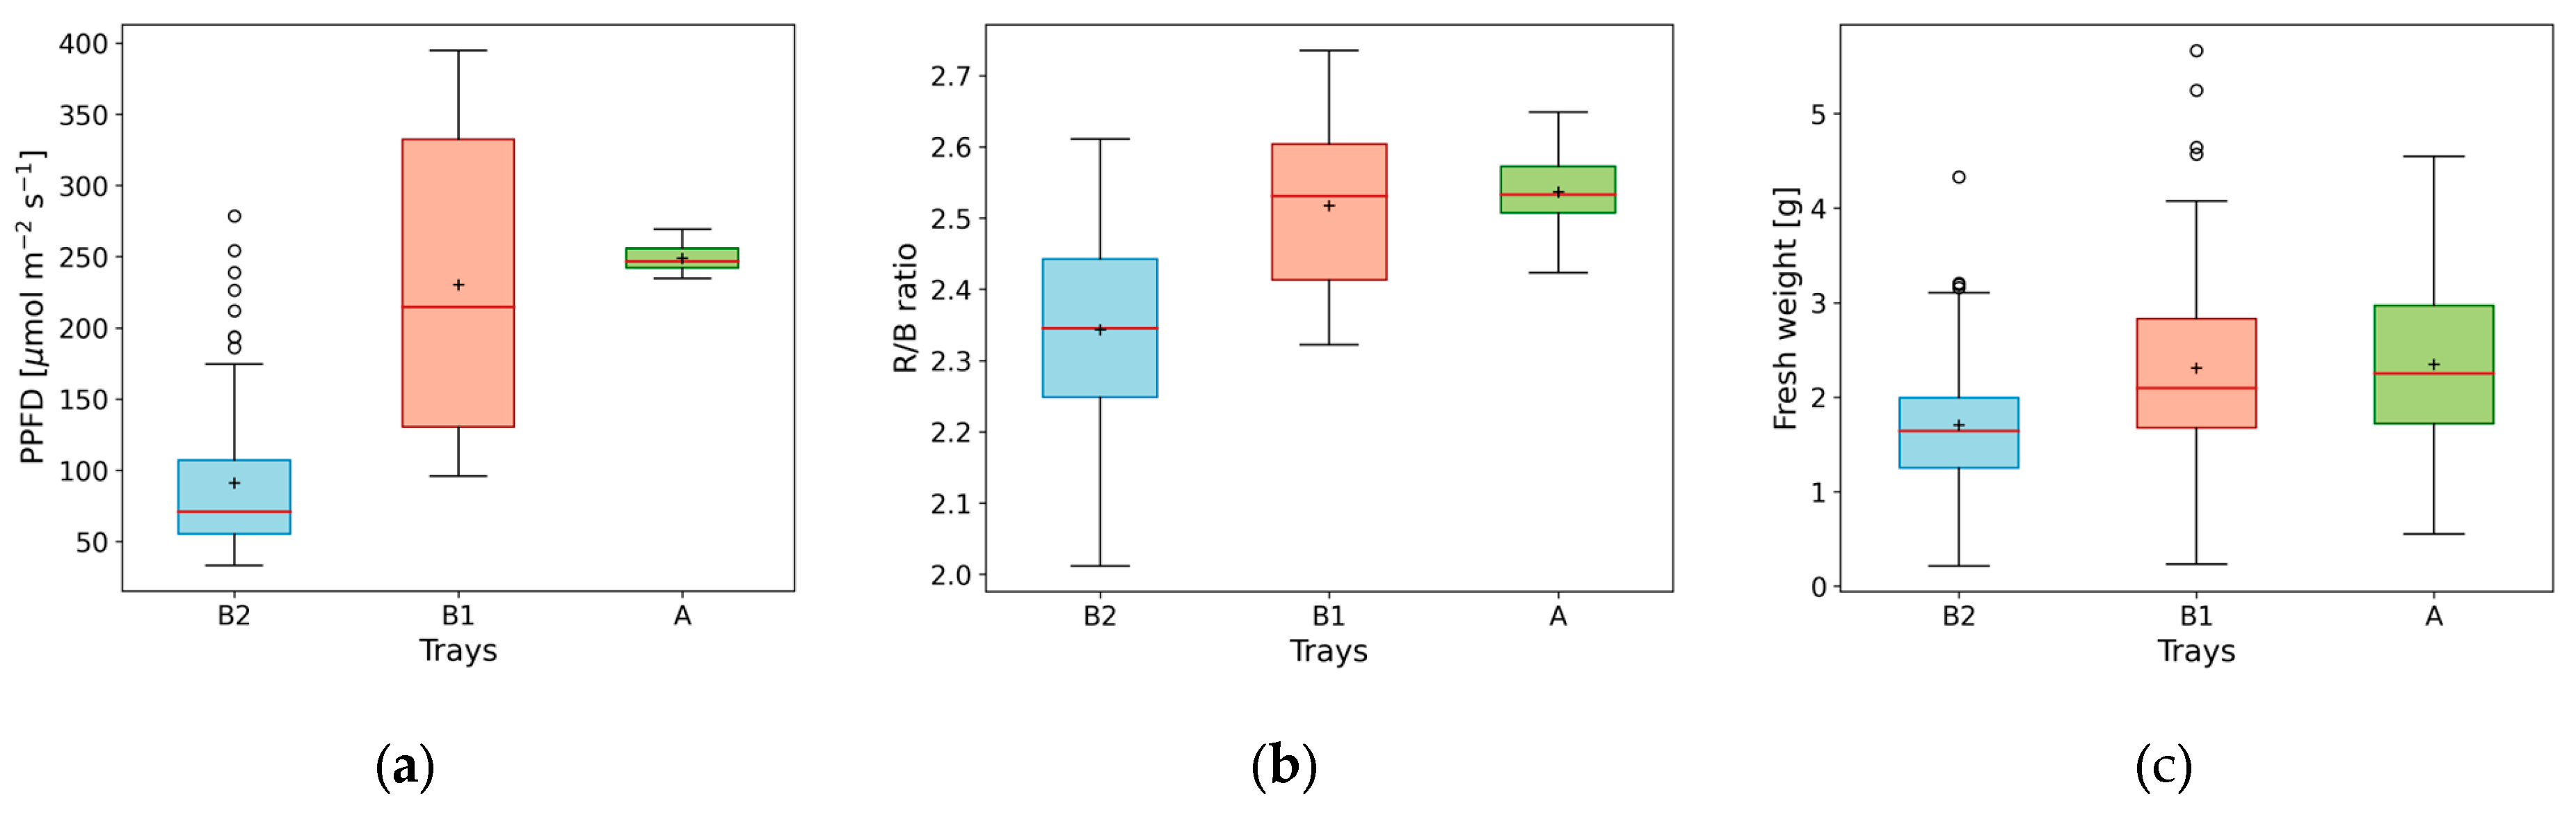
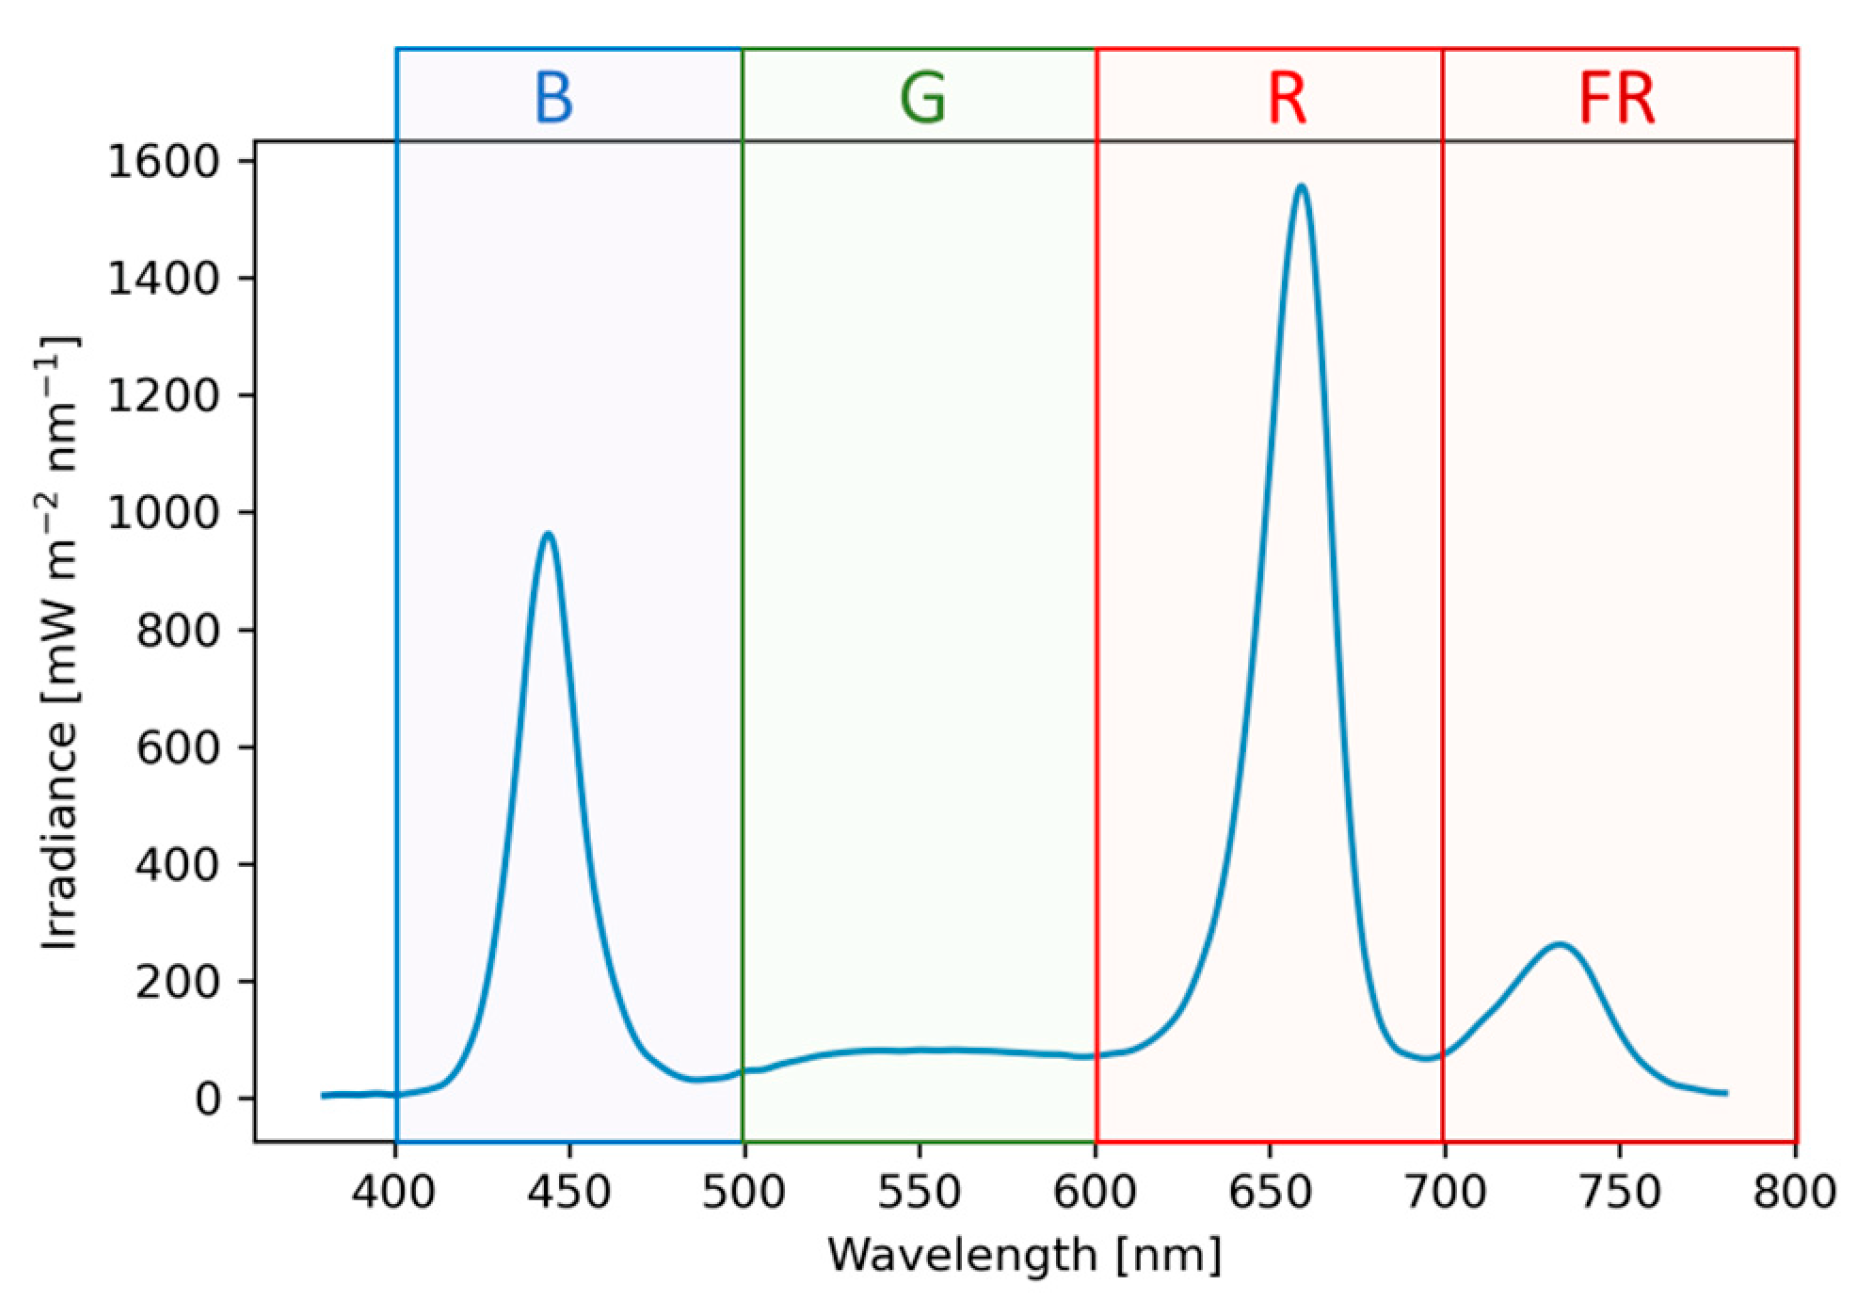
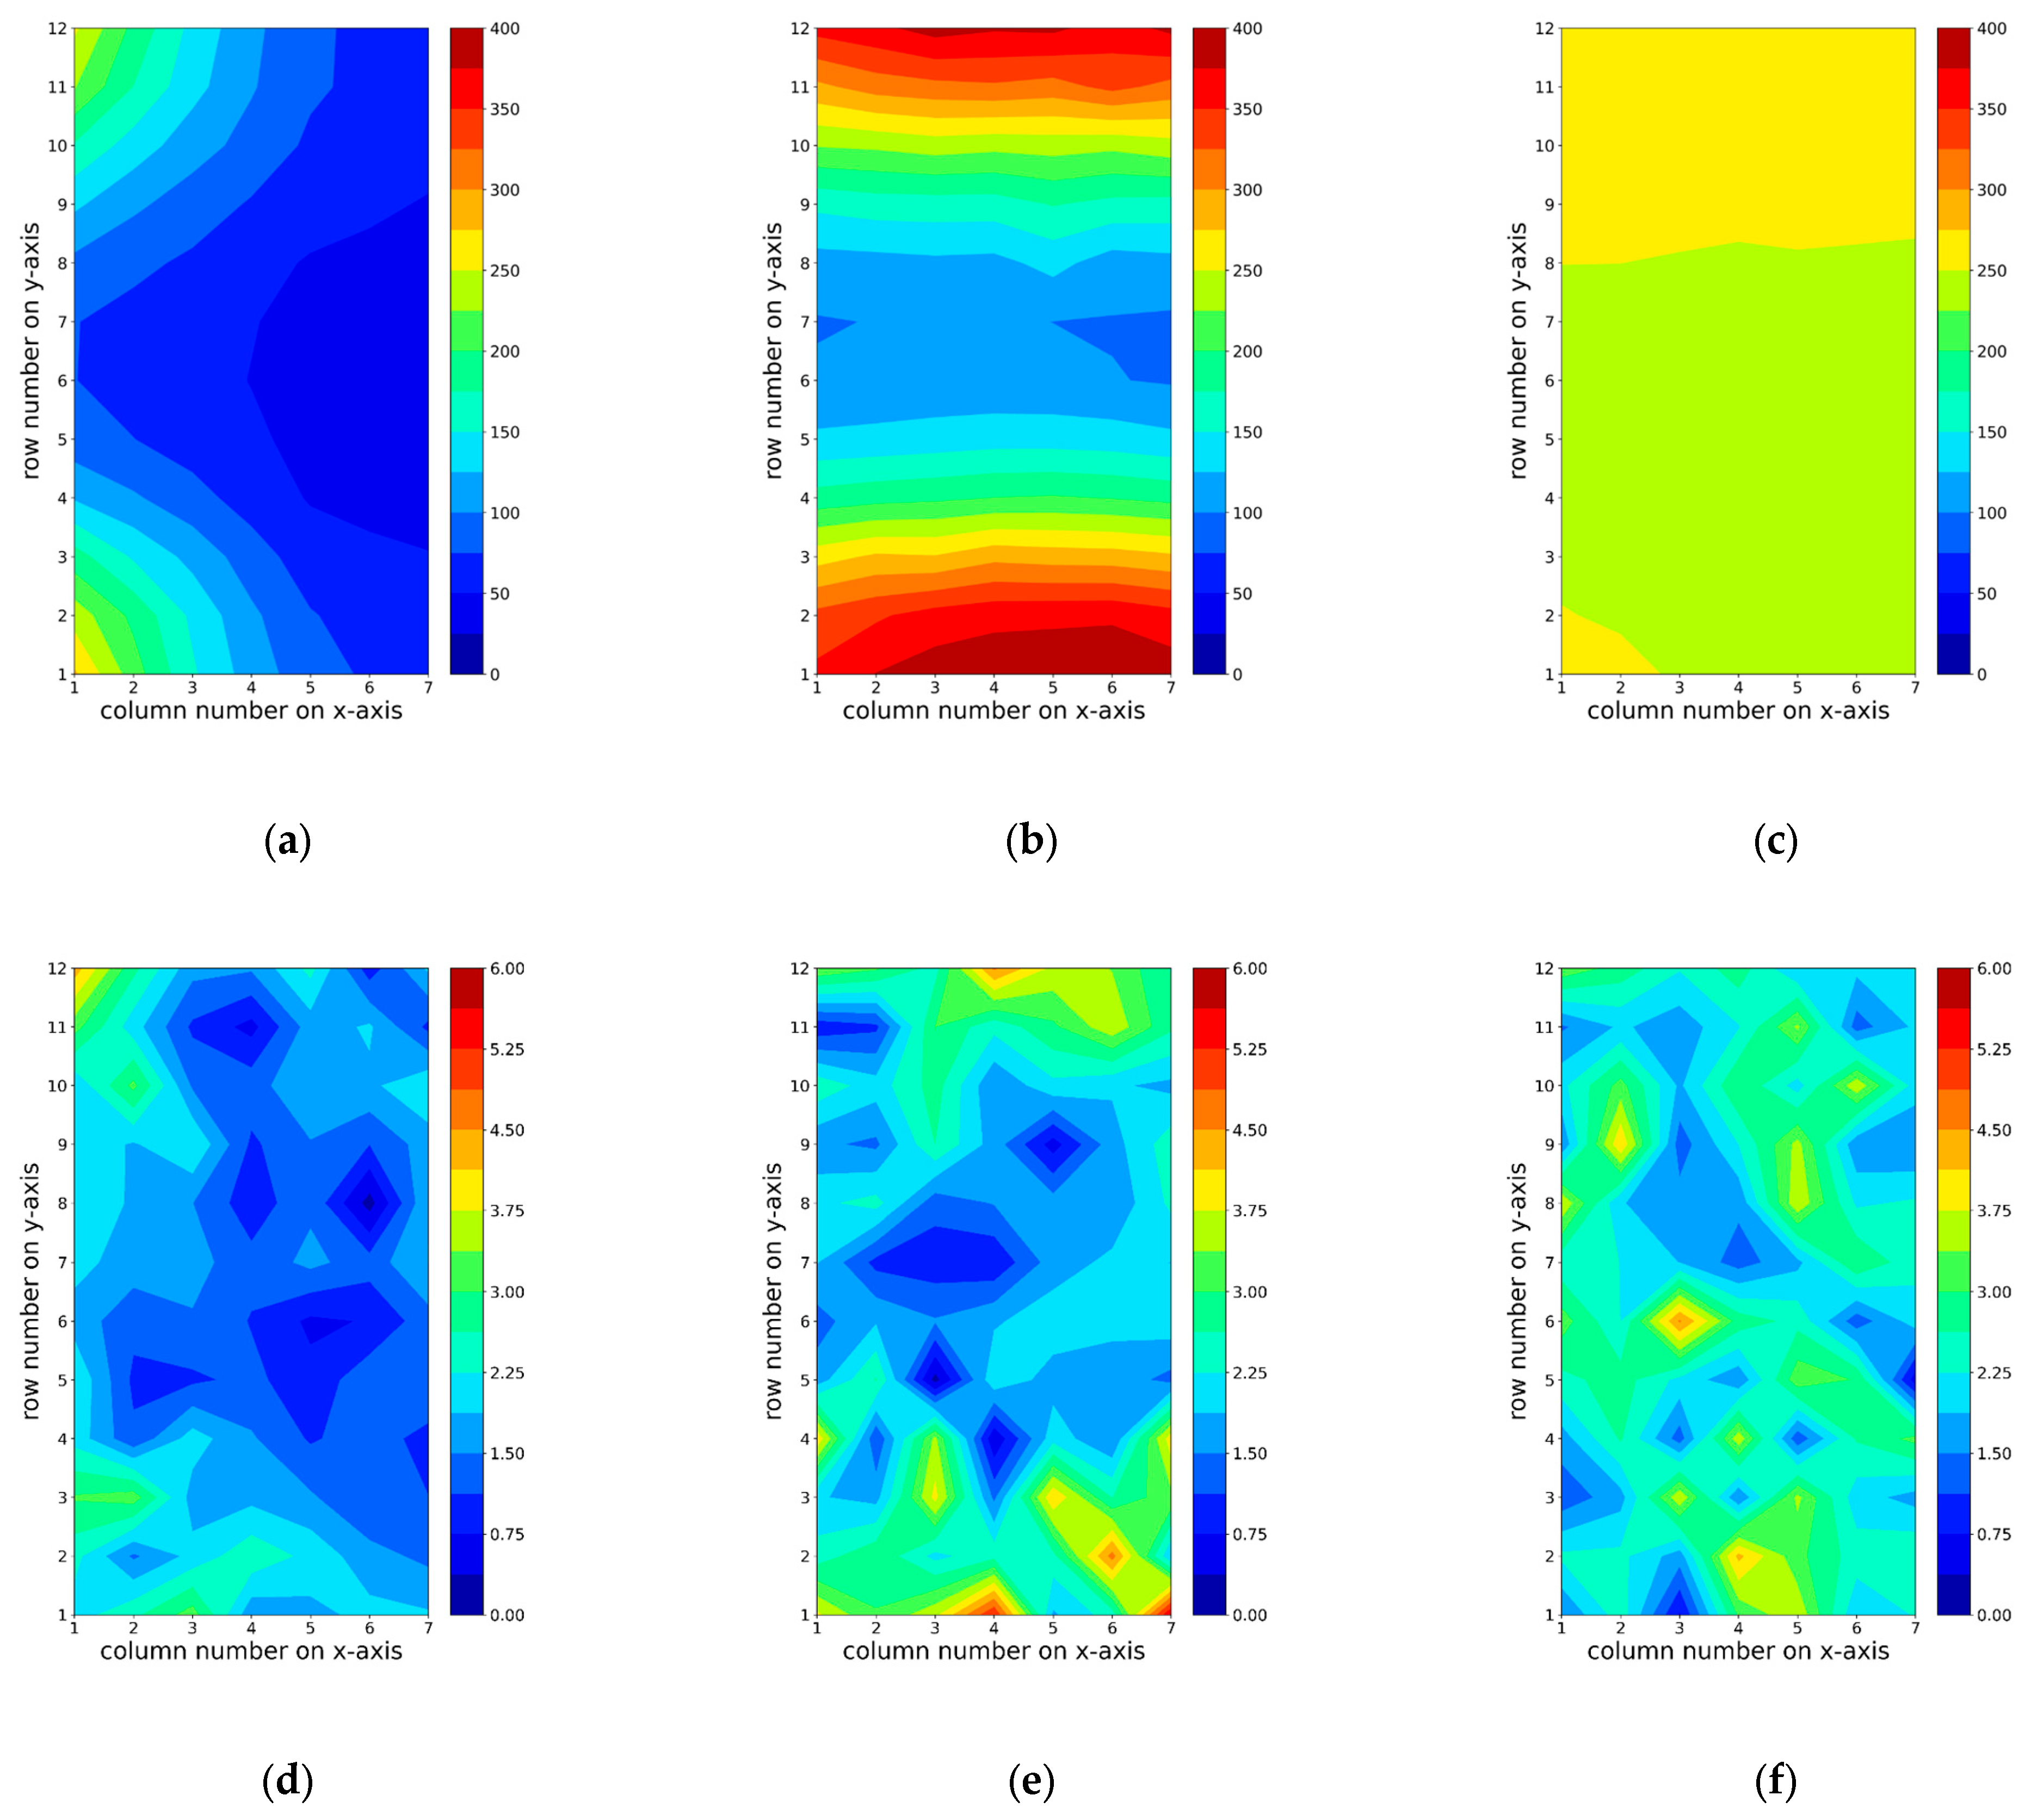
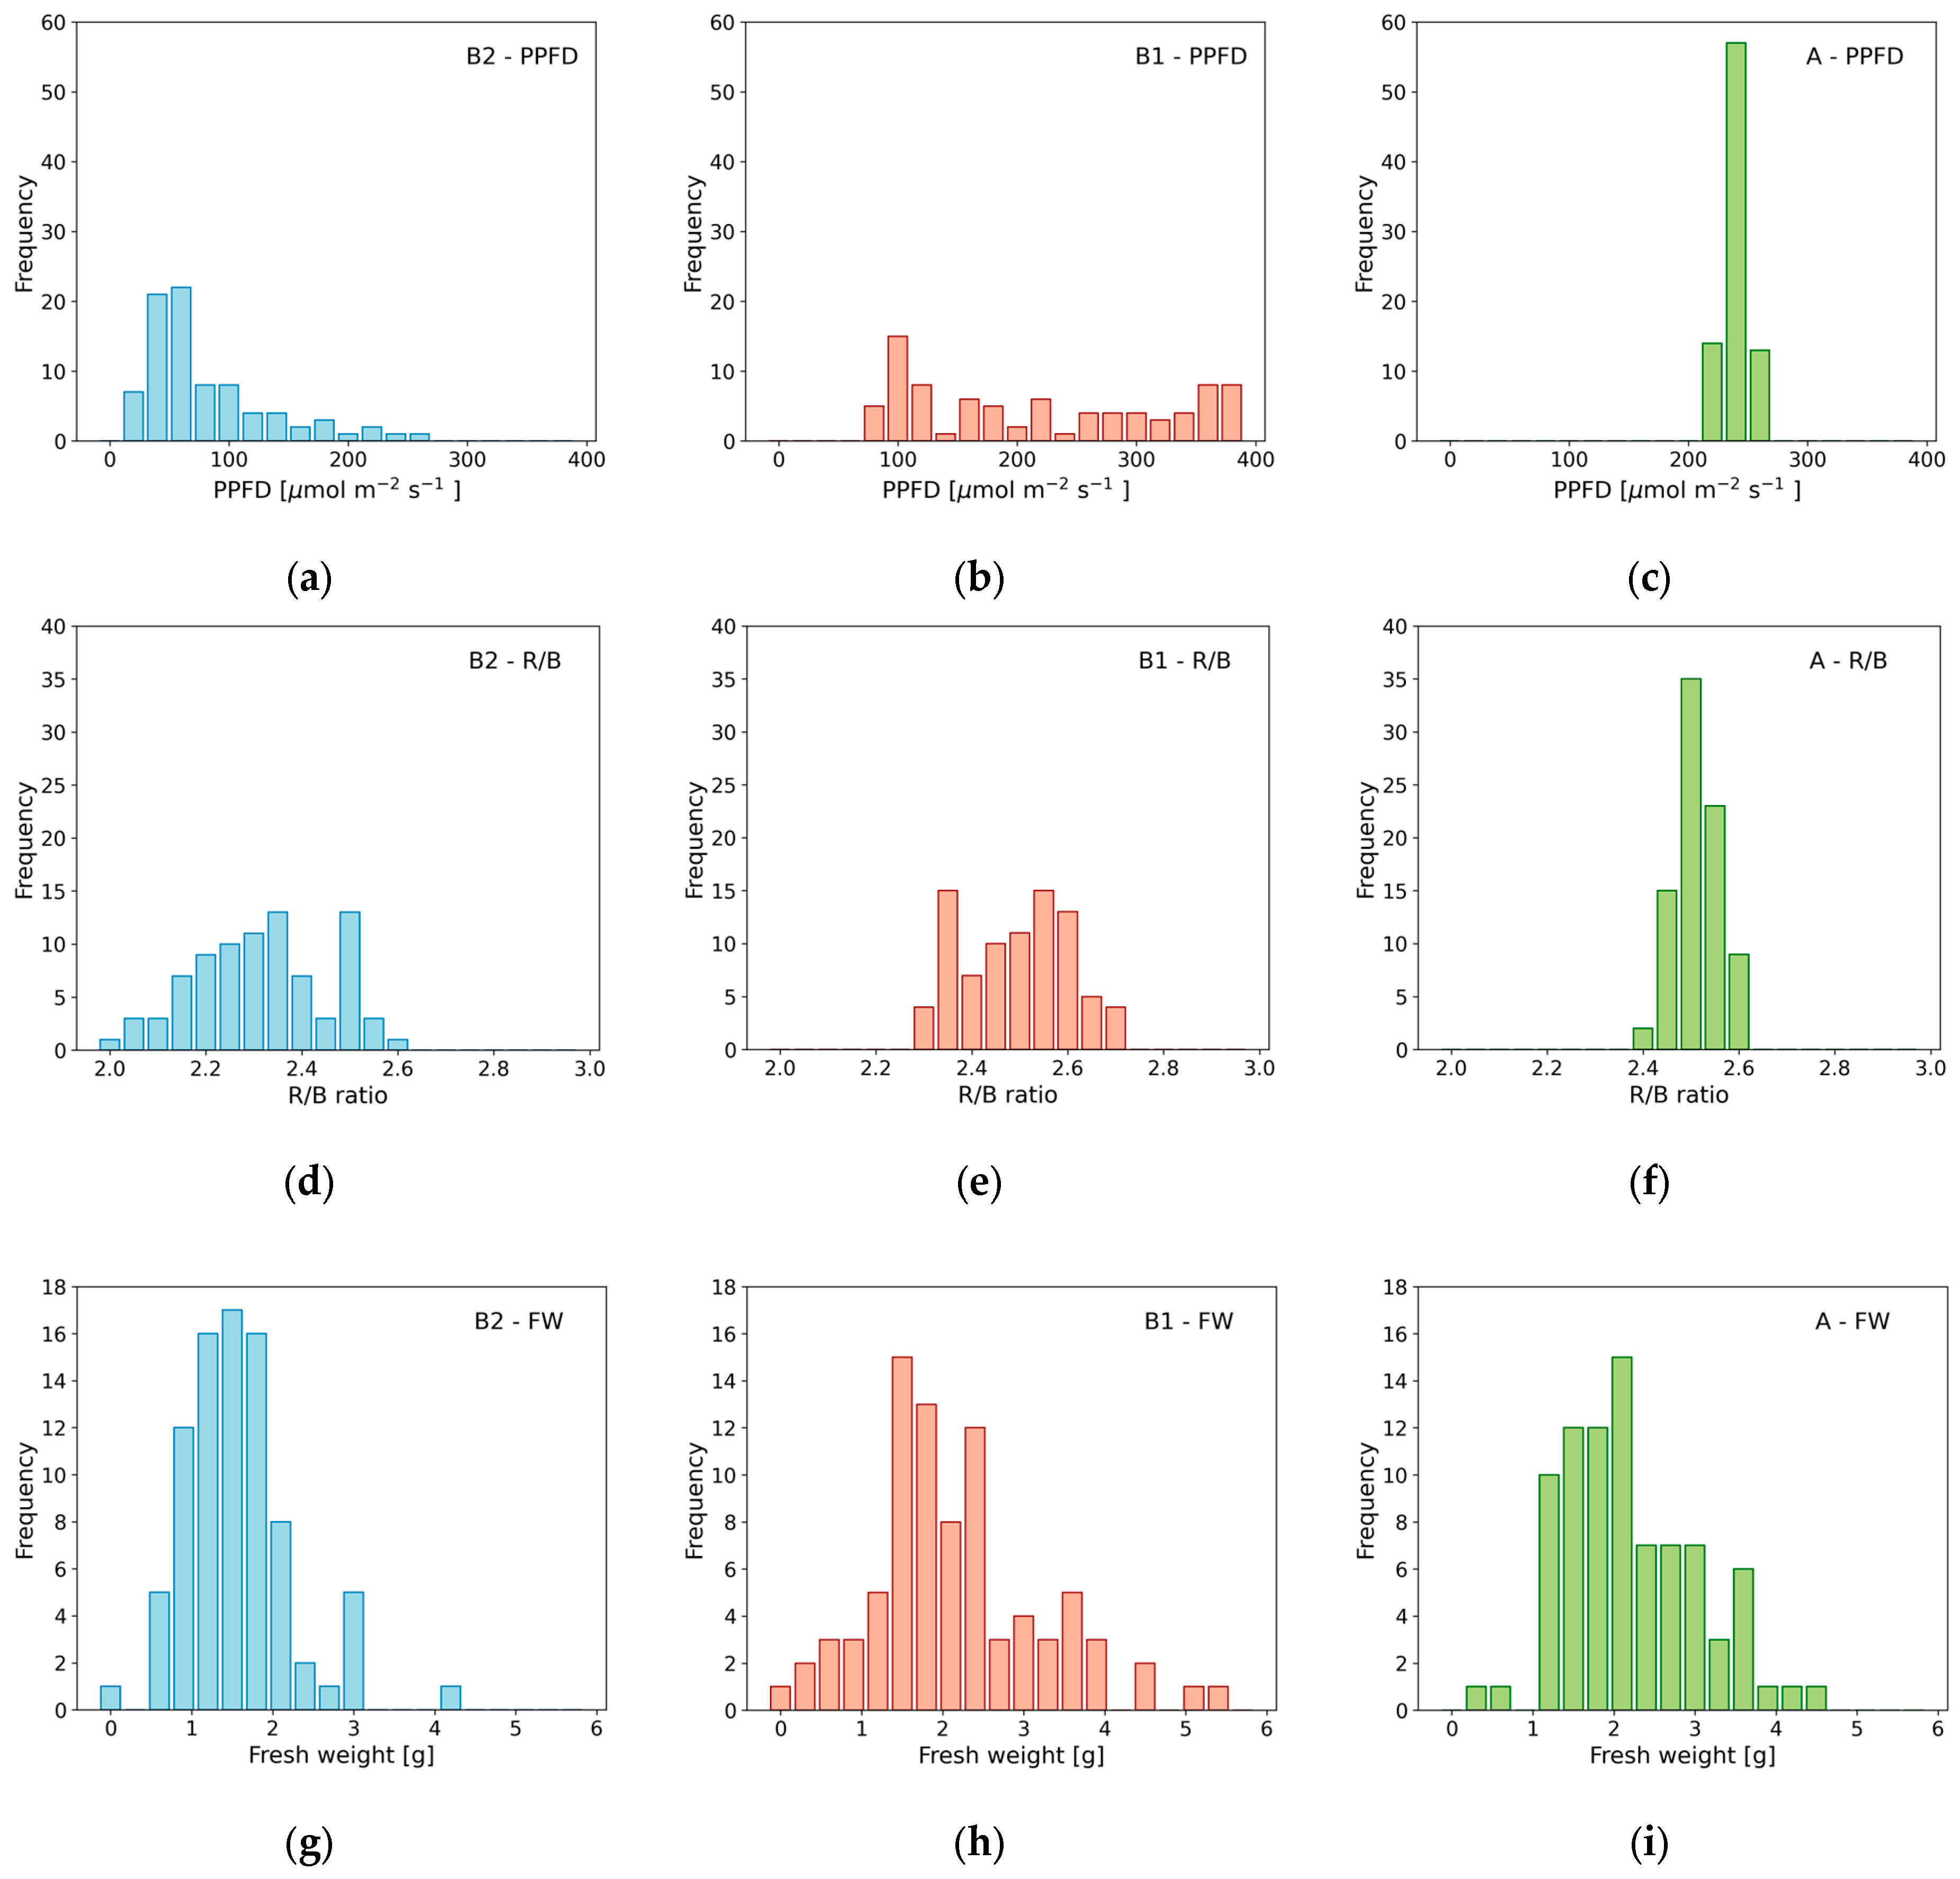
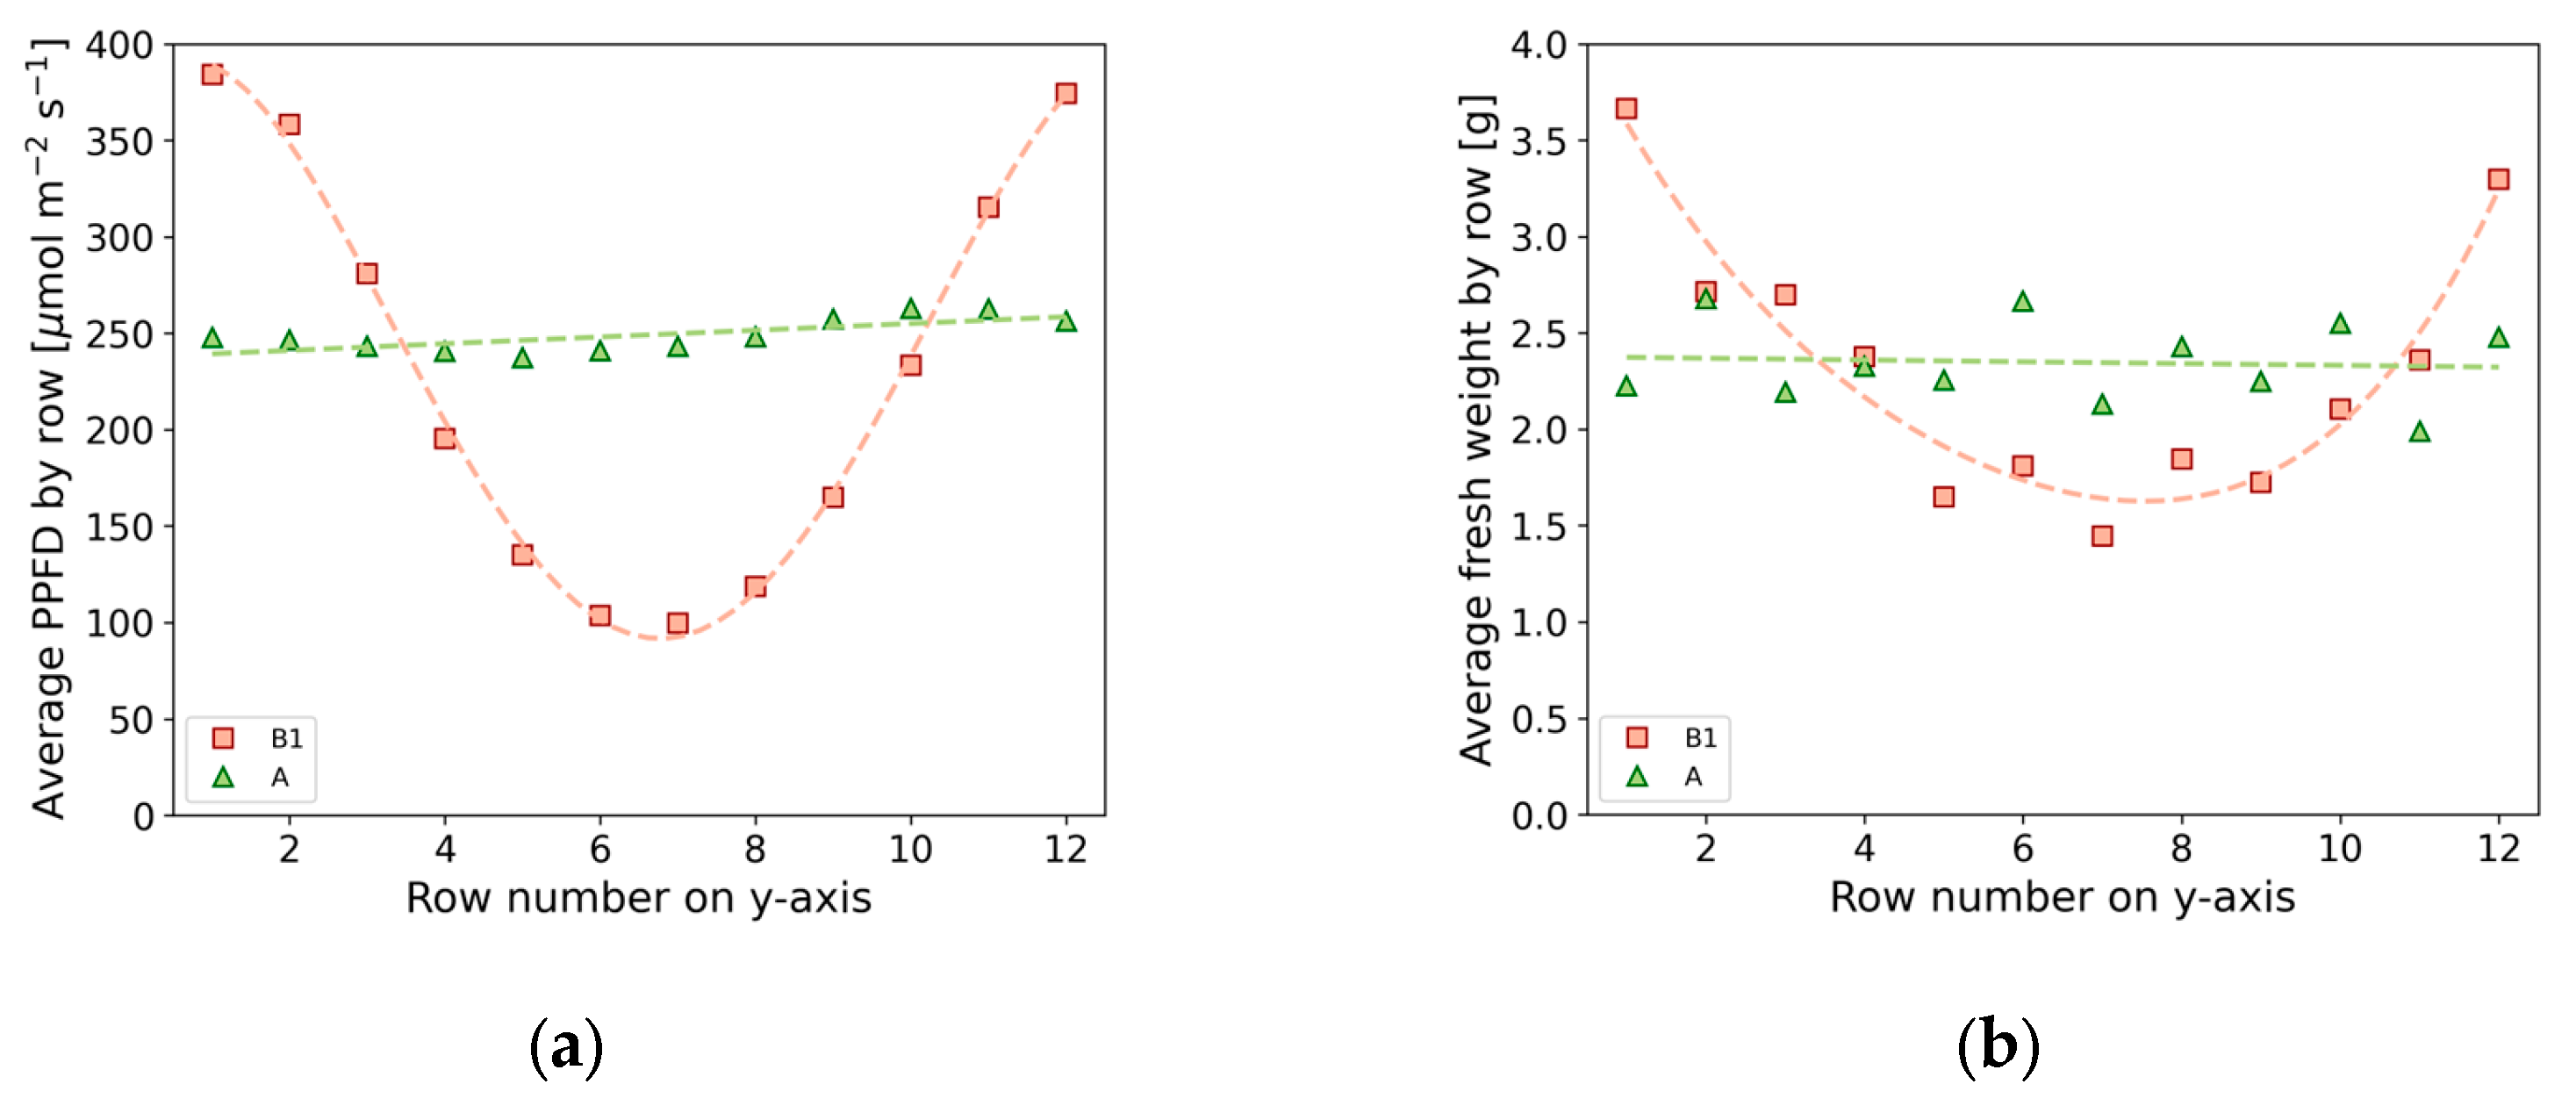
3.1. Characterization of the Lighting Environment

The four color channels of the LED luminaires covered the four adjacent wavebands generally used for the characterization of LED-based horticultural lighting [20]: blue (B): 400–499 nm, green (G): 500–599 nm, red (R): 600–699 nm, and far-red (FR): 700–800 nm. A representative example of the measured irradiance spectra is depicted in Figure 4, exhibiting four peaks corresponding to the four types of LEDs built into the luminaires: blue peak emission at 450 nm, deep red at 660 nm, far-red at 730 nm, and a broad peak extending over the green waveband corresponding to the phosphor emission of the white LEDs. In this particular spectrum, the R/B and R/FR ratios were 2.5 and 3.6, respectively.
The power ratios of the color channels were held constant throughout the experiment; therefore, the quality of light, i.e., the shape of the spectrum, was expected to be the same at any point of the illuminated work plane. The quantitative measure of light, however, varied according to the power of LED luminaires and the position of the light intensity measurement.
The minimum, average, and maximum values measured on trays A, B1, and B2 are listed in Table 1 for the photosynthetic photon flux density (PPFD) as well as the photon irradiances in the B, G, R, and FR wavebands. The R/B photon irradiance ratio quantifying the spectral property of light was calculated for each tray, and the related statistical parameters, including the overall uniformity (Uo), are also listed in Table 1. According to expectations, the difference between the average PPFDs of A and B1 was small, only 7% in absolute value. The range of data points, however, was much broader in the case of B1 compared with A. This difference between the two settings is reflected by the uniformity parameters: Uo = 0.94 in A, indicating a highly uniform PPFD distribution, whereas Uo = 0.42 represents the low uniformity case. The difference between the maximum and minimum B2 PPFD values was even broader than in the case of B1, but the average value was 91 µmol m−2 s−1, 40% lower than the average of B1. Similar trends can be seen in the B, G, R, and FR wavebands, indicating the stability of the irradiance spectrum across the cultivation trays.
The R/B ratio is a frequently used measure of the quality of light in horticulture. There was only a minor difference between the means of A and B1. B2 had a slightly lower mean R/B value, indicating a less than 10% shift in the spectral peak ratios at low irradiance, but this difference is negligible considering the broad light response sensitivity range of plants [34].
The two-dimensional photosynthetic photon irradiance distributions are visualized in Figure 5a–c. The color scale of the contour plots is the same in all the subfigures, ranging from 0 to 400 µmol m−2 s−1. The colored patterns in the contour plots exhibit a reflectional symmetry relative to the axis of symmetry in the middle of the illuminated area. On tray B2 in Figure 5a the highest intensities were measured in the upper and bottom left corners, resulting from the edge effect between the high-power LED B-2 and low-power LED B-3 luminaire pairs, as shown in the side view of Figure 1. The low-intensity region is in the center, extending towards the right-hand side. In Figure 5c, there are only two adjacent colors, indicating highly uniform PPFD distribution across tray A, with a minor increase from low to high row numbers. In Figure 5b, warm colors on the top and bottom edges indicate high PPFD regions, whereas cool colors in the middle represent low PPFD values. The line symmetry of the irradiance in B1 is reflected by the contour lines running parallel to the x-axis along the shelves.
The histograms in Figure 6a–c provide a more quantitative description of the PPFD distributions on trays B2, B1, and A. In Figure 6a, the histogram is skewed towards the left in accordance with the high proportion of low irradiance values on tray B2. The PPFD values on B1 in Figure 6b are evenly distributed between the minimum and maximum values. The histogram of A is characterized by a high, narrow peak in Figure 6c. Neither of the PPFD histograms can be described with a normal distribution, as indicated by the p-values in Table 1.
The boxplot in Figure 7a compares the averages and the spread of the PPFD distributions of B2, B1, and A. The horizontal red lines in the boxes show the medians; the crosses stand for the mean values.
Beyond the graphical representation of the distributions in Figure 7, non-parametric hypothesis tests were used to check the equality of the medians (Kruskal–Wallis test) and variances (Levene’s test) [35]. The p-values of the pairwise comparisons are shown in Table 2. The p < 0.05 values indicate statistically significant differences between the tested parameters. The p-value of the Kruskal–Wallis test was 0.786; consequently, the null hypothesis that the median PPFD values of A and B1 are equal cannot be rejected. The median PPFD of B2 proved to be significantly lower than that of B1 and A. The p-values of Levene’s test were all zero, indicating significantly different PPFD variances on trays B2, B1, and A.
Continuing the analysis with the R/B ratios in Figure 7b, the medians of B1 and A are not statistically different according to p = 0.335 of the Kruskal–Wallis test. The median R/B ratio of B2, however, is significantly different from the group of B1 and A. The variance of B2 is significantly higher than the variance of A. The comparison of B2 and B1 variances resulted in p = 0.050, indicating a borderline case.
All these data indicate that the lighting conditions in the three environments were in line with our objectives. The mean values of A and B1 were statistically not different, but the range of data values was 8.5 times broader in the case of B1 relative to A. The mean value of the B2 was 37% of the A average. The relative spectral distribution of the irradiance was constant in all three cultivation trays.

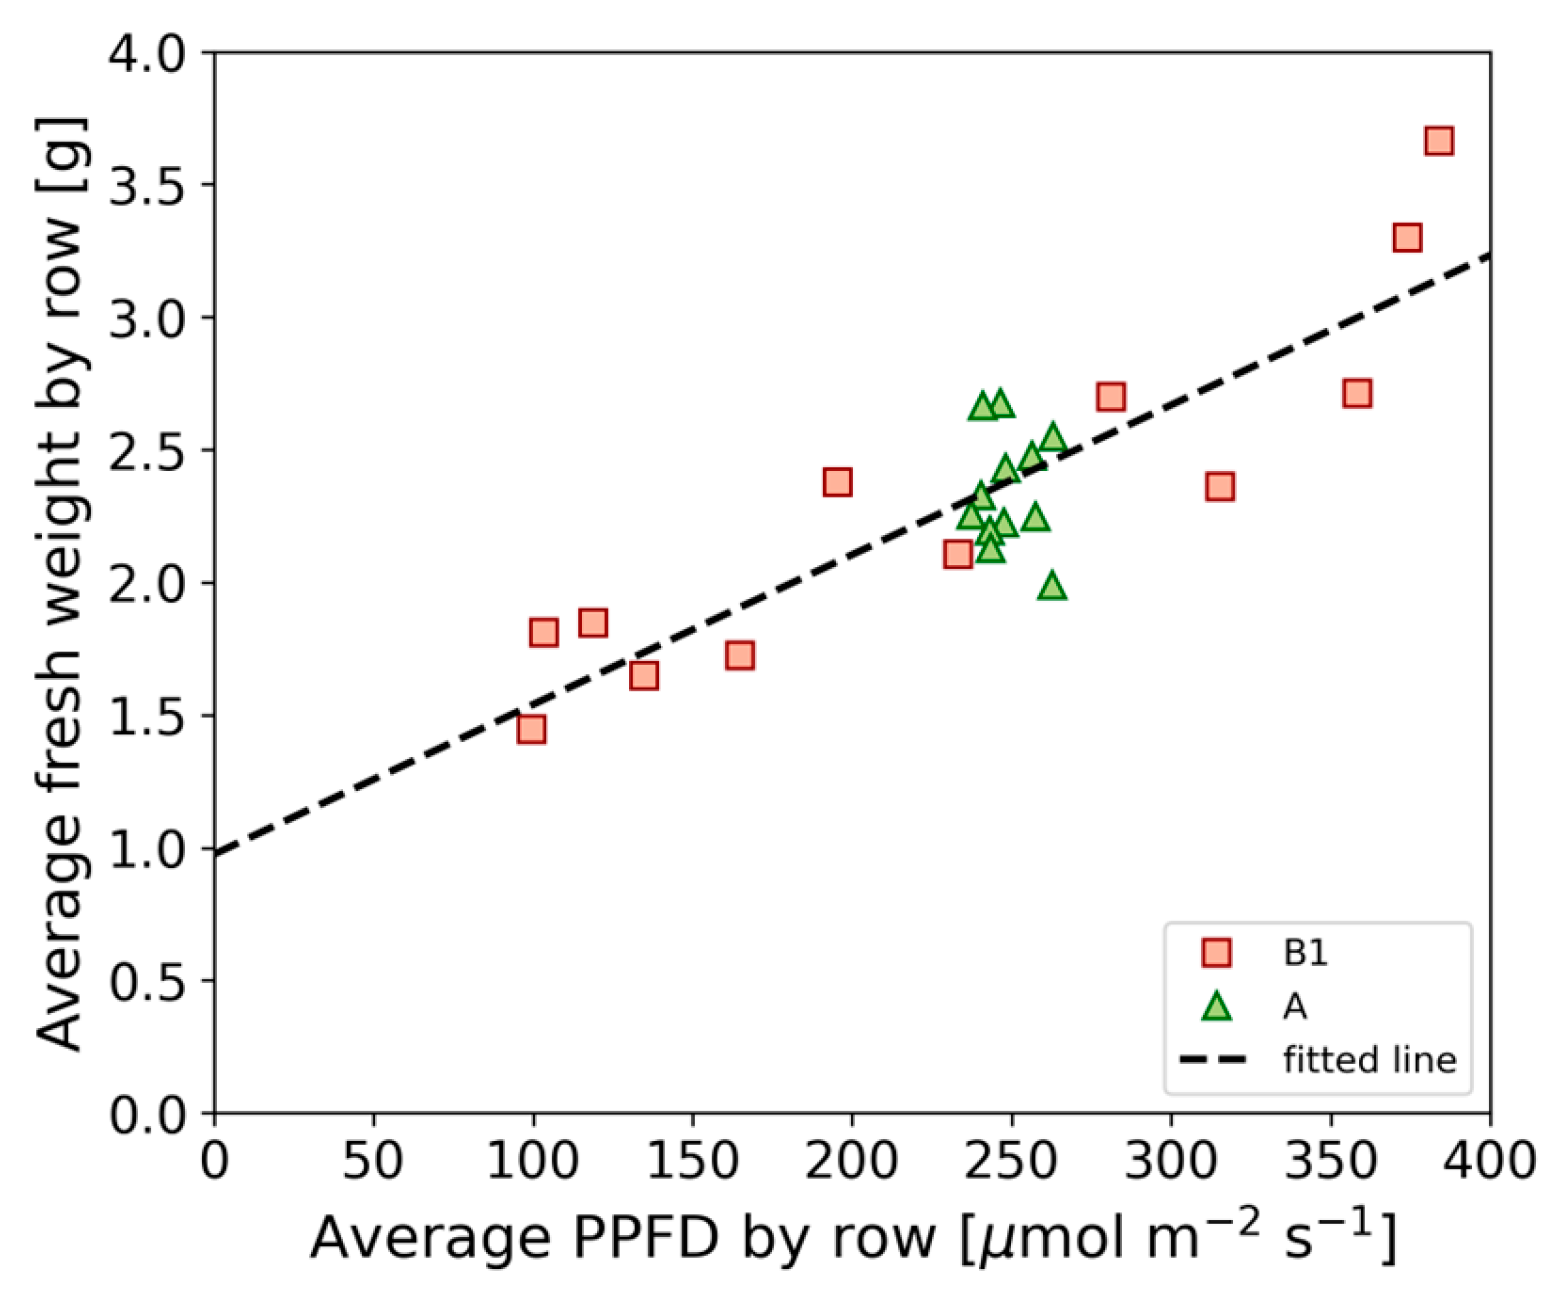
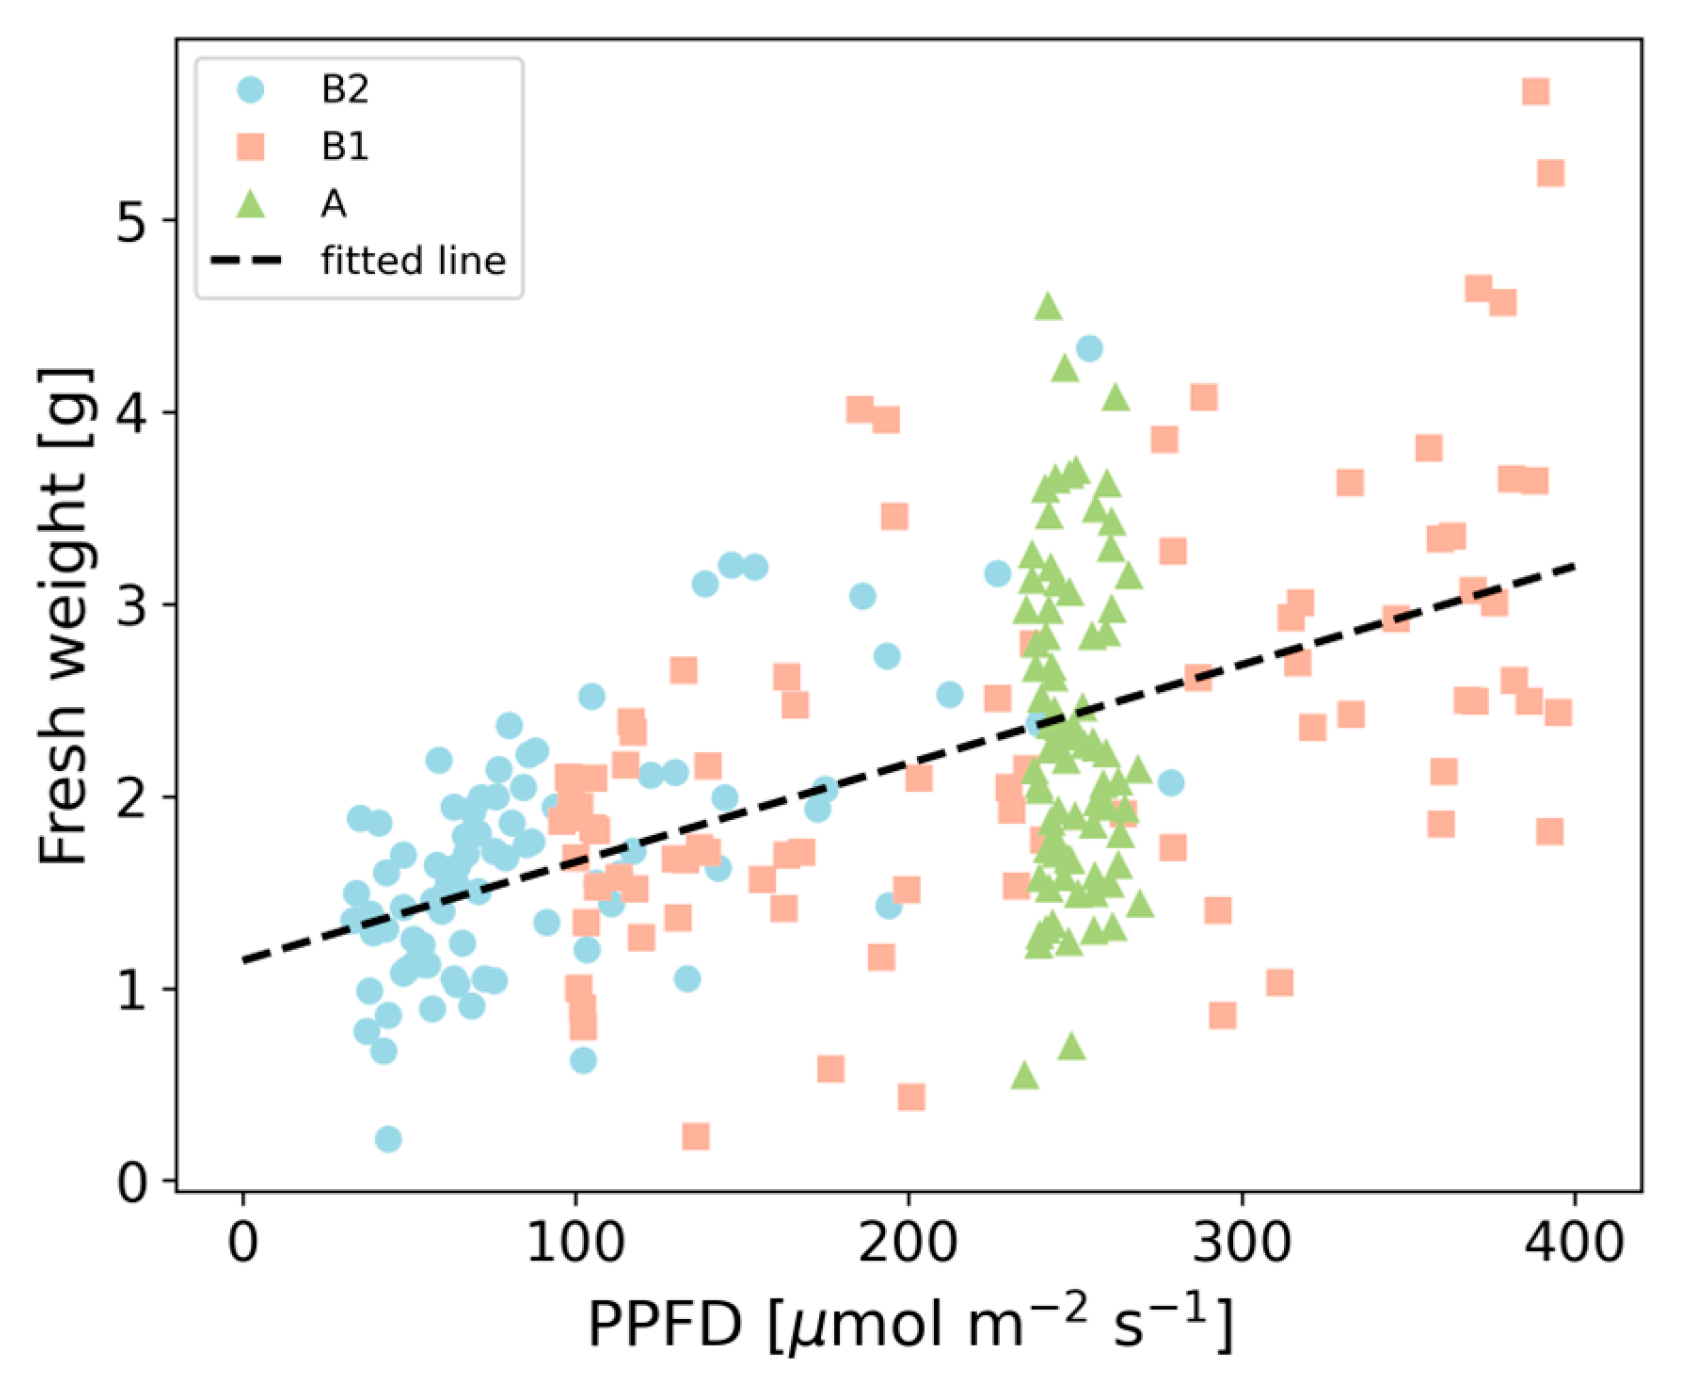
3.2. Fresh Weight Analysis

The statistical parameters determined for the shoot fresh weight measurements are summarized in the rightmost column of Table 1. There was a minor, 1.7% difference between the mean values of A (2.35 g) and B1 (2.31 g), whereas the average fresh weight of B2 was only 1.7 g. Comparing the minima, maxima, and the Uo and Ud values, all distributions exhibit high spread and a low level of uniformity.
Noise dominates the fresh weight contour plots in Figure 5d–f, which vaguely reflect the symmetry of the spatial PPFD distributions in Figure 5a–c. The fresh weight histograms of B1 and A in Figure 6h,i are close to each other both in position and spread in sharp contrast with the broad PPFD distribution in Figure 6b and narrow PPFD distribution in Figure 6c. Comparing the boxplots in Figure 7a,c one can conclude that the range or uniformity of PPFD distributions had little effect on the fresh weight distributions. Inferential statistics confirmed that neither the medians nor the variances of the shoot fresh weights on B1 and A are statistically different. In Table 2, p = 0.786 and p = 0.101 for the Kruskal–Wallis and Levene’s tests, respectively. B2, however, can be regarded as an outlier from the group of A and B1 both in terms of median and variance values.
In Figure 8, the fresh shoot weights of individual plants are plotted against the local PPFD values. The three different markers—triangles, squares, and circles—represent data points measured on trays A, B1, and B2, respectively. Although there is a large variation in the fresh weight, the dotted trendline indicates a linear relationship between the light intensity and biomass accumulated in the individual plants. The correlation is statistically significant, with an F-test value of 111.0 and a significance of p = 0.000. From the value of the coefficient of determination, R2 =0.31, one can conclude that 31% of the variation in the fresh weight can be attributed to the PPFD changes; the rest is due to other factors.
The slope and the intercept of the least squares regression line were 0.0051 (±0.00096) and 1.14 (±0.21). The values in brackets indicate the 95% confidence interval about the estimated parameter means.
Looking up the parameters of trays A and B1 in Table 1 and comparing Figure 7a with Figure 7c, one can conclude that the uniformity of the PPFD distribution had no measurable effect on the mean fresh weight (i.e., crop yield) in our experiment. As long as the PPFD uniformities corresponded to the extremely high and low cases with Uo values of 0.94 (A) and 0.42 (B1), the mean fresh weights of 2.35 g (A), and 2.31 (B1) did not differ significantly. The coefficient of determination, R2 = 0.31, indicated that the fresh weight variance is driven by the different behaviors of individual seeds, and only 31% of the fresh weight variance can be attributed to photon irradiance changes. On the other hand, the growth test was carried out in the linear regime of the light response curve, far below the light saturation point of pea seedlings [36]. Seedlings exposed to higher than the mean PPFD value grew faster, while plants below the PPFD mean developed slower compared with the average; therefore, the effect of photon irradiances on the mean is expected to cancel out. The range of the fresh weight values increased: the minimum was 0.55 in A and 0.23 in B1, whereas the maximum fresh weight values were 4.55 in A and 5.67 in B1.
This assumption is supported by the analysis of measurement data grouped by rows. The linear array of LED luminaire pairs created a symmetrical light intensity distribution with an axis of symmetry running in the center line of the trays, as indicated in Figure 1. On trays A and B1, seedlings in a row were exposed to the same microenvironmental conditions independently of the column number. By averaging measurement data in one row, we can reduce variations due to the differences between individual seeds. The dotted line box in Figure 1 shows an example of creating the group of rows #3.
In Figure 9a, the row averages of PPFD distributions are plotted as a function of the row numbers. The triangles representing A data indicate a minor upward trend from row 1 up to 12 in accordance with Figure 5c. Similarly, squares representing B1 values show high row averages on the lower and upper parts of the trays, and the minimum values can be found at the position of the axis of symmetry (c.f. Figure 5b). Row averages in Figure 9b reveal trends in B1 and A fresh weight data, which were hidden for visual inspection in Figure 5e,f. Triangles representing row averages of A are randomly scattered about the grand mean of 2.35 g in Figure 9b. The trend shown by the dotted green line is not statistically significant. The fresh weight row averages of B1, represented by the red squares, however, can be approximated by a second-order polynomial. The polynomial regression shows a statistically significant trend with R2 = 0.91. Tray B2 was left out of the grouped average calculations since positions on one row were not equivalent from the photon irradiance perspective, as is obvious in Figure 5a.
The correlation between the row averages of shoot fresh weight and PPFD values is shown in Figure 10. Data points A and B1 are scattered about a straight line, indicating a linear relationship between the fresh weight and PPFD. The slope = 0.0056 ± 0.0014 and intercept = 0.97 ± 0.36 fall within the confidence intervals of the linear relationship determined for individual data. The R2 = 0.75 indicates a significantly reduced variance in fresh weight relative to the regression of individual data.

4. Discussion

The objective of this study was to analyze the differences in seedling growth traits cultivated under uniform (A) and non-uniform (B1, B2) lighting conditions. Although there is no standardized threshold for PPFD uniformity in horticultural lighting, in commercial cultivation facilities, the criteria Uo > 0.8 or Ud > 0.7 are applied [17]. From this perspective, the Uo = 0.94, and Ud = 0.87 of environment A can be regarded as highly uniform, whereas the Uo = 0.42 and Ud = 0.24 for B1 is a low uniformity case. The overall uniformity and diversity for B2 were even lower compared with B1.
We observed that the mean PPFD determined the average weight of individual plants, and PPFD uniformity had no statistically significant effect on the crop yield. This finding has important implications for the lighting design of vertical farms. Reducing the separation distance between the LED luminaires and the crop canopy is an opportunity to improve the space utilization and energy efficiency of vertical farms [8]. The close-canopy approach increases the photon capture efficiency or utilization factor of the horticultural lighting, defined as the quotient of useful photon flux incident on the crop and the total photon flux emitted by the lighting equipment [37]. Maintaining high PPFD uniformity at reduced mounting heights of the luminaires is not a trivial task. It requires additional investment in sophisticated lighting equipment to enable high photon capture efficiency at high photon irradiance uniformity. Our results demonstrated that at moderate photon irradiances, far away from the light saturation point, the PPFD uniformity criteria can be relaxed assuming the crop is sold in bulk by mass.
The reduction of the separation distance between the plant canopy and the LED luminaires raises two questions:
  • How does the photon irradiance at the top canopy level change as the seedlings grow close to the luminaire?
  • Has the upper leaves’ temperature increased due to thermal radiation from the luminaires?
It is beyond the scope of this work to provide a detailed analysis of the three-dimensional evolution of environmental conditions during plant growth. Nevertheless, we carried out two additional control tests to determine the scale of changes with the increasing height of the seedlings. First, we measured the PPFD distributions across horizontal planes corresponding to 6 cm and 12 cm plant heights in trays A and B1. Data presented in Figures S3 and S4 indicate that photon irradiance values increase underneath the luminaires and decrease in between the space of the luminaire pairs as the height of seedlings rises, pointing out the limitations of our experiments. In our analysis, we used only the horizontal photon irradiance at the seed level, which reflects the lighting conditions during the early stages of plant growth. As plants grow taller, the light intensity at the top of the canopy will be different from that at the lower levels. Additionally, plants create shade, influencing the growth of neighboring plants. The light interception changes both horizontally and vertically within the canopy. To provide a more accurate description of the lighting environment and predict crop yield, we recommend using three-dimensional canopy models [27,28,29].
To test the heating effect of the luminaires, we measured the surface temperature at the uppermost leaf of a seedling at 17 cm above the tray (B1) surface and at the lowest leaf of the same seedling at 3 cm height. The distance between the upper leaf and the cover glass of the luminaire was 4 cm. The average surface temperature was 20.8 °C at the upper leaf and 20.2 °C at the bottom leaf. The sample size was 16 in both cases. The temperature difference is significant at p = 0.003, but nevertheless, the absolute value of the difference shown in Figure S5 is in the range of leaf surface temperature variations at various positions of the vertical farm (Figure S6).
We plan further experiments to reveal the physiological response of the plant leaves to the local environmental conditions at various horizontal locations and heights of the canopy.
An important assumption of this study was that the quality of light is constant in all cultivation trays. Although the R/B ratio of B2 was statistically different from the groups A and B1, the difference was minor compared with the spectral sensitivity of plant growth traits measured by various research groups for different species [22,24,34]. The statistically significant differences in R/B ratios may be attributed to a slight shift in the emission spectrum of the luminaires at low power or to the increased portion of wall reflections in the low end of the R/B distribution, especially on the extreme dark zone of tray B2, as indicated by the dark blue colors in Figure 5a. Adjusting the power of the red and blue channels of the luminaires above B2 (cf. LED-B3 luminaire pair in Figure 3) might have eliminated the difference in the R/B means between B2 and the groups of B1 and A. We did not make any further attempt to fine-tune the photon irradiance distributions because the 7% difference in the mean R/B ratios of B2 and A was expected to have a negligible effect on plant growth compared with the 64% difference in PPFD averages.
Individual shoot fresh weight data exhibited high variability both in uniformly and non-uniformly illuminated environments. Despite the large variations, a statistically significant relationship was found between the local PPFD values and the shoot fresh weight. The low value of the coefficient of determination of the linear regression (R2 =0.31) in Figure 8 is in line with the observations of other researchers measuring the growth of cotyledons and initial true leaves of individual lettuce seedlings [15]. A large amount of the variability in seedling growth rate is possibly due to the genetic differences of the seeds.
The opportunity to aggregate individual observations into groups has several practical implications. Instead of weighing individual seedlings one by one, it is possible to make measurements in rows, reducing measurement time. The procedure described can be extended to other species and implemented in commercial vertical farms, enabling the light response of any crops to be retrieved under the conditions of commercial production.
This paper highlights the advantages of establishing a light intensity gradient within the crop canopy to obtain accurate light response functions. Additionally, we measured the shoot height and root weight of B2 seedlings, which showed a correlation with the shoot fresh weight data (Figure S2). Given the higher margin of error associated with the shoot height and root weight measurements, analyzing other growth traits is unlikely to yield further insights.

5. Conclusions

Understanding the variance causes is the prerequisite for the optimization of vertical farm settings. Our experiments have effectively quantified the impact of horizontal PPFD variation on microgreen crop yield in a vertical farm. We utilized high-spatial-resolution measurements to uncover the correlation between the shoot fresh weight of pea seedlings and light intensity. Our experiment presents a methodology to separate and quantify light intensity-related variations from other microenvironmental and genetic factors, enabling data-driven decisions in the lighting design process. This methodology can be applied to determine a crop’s light response under production conditions on vertical farms.

Supplementary Materials

The following supporting information can be downloaded at: https://www.mdpi.com/article/10.3390/horticulturae9111187/s1, Figure S1: Photon intensity distribution of the luminaire with 80° beam angle used in the experiments; Figure S2: Individual shoot height (a) and root weight (b) as a function of local PPFD for tray B2; Figure S3: PPFD distribution at the canopy level on tray A; Figure S4: PPFD distribution at the canopy level on tray B1; Figure S5: Leaf surface temperature on the top and bottom of a seedling with a height of 17 cm on tray B1; Figure S6: Variation of leaf surface temperature on various trays of the vertical farm.

Author Contributions

Conceptualization, L.B., Á.T. and Z.K.; methodology, L.B. and Z.K; software, L.B.; validation, L.B., P.P. and Z.K.; investigation, L.B., P.P. and Z.K.; resources, G.P.K. and C.G.; writing—original draft preparation, L.B.; writing—review and editing, L.B., Á.T., Z.K. and G.P.K.; visualization, L.B.; project administration, G.P.K.; funding acquisition, C.G. All authors have read and agreed to the published version of the manuscript.

Funding

This research received no external funding.

Data Availability Statement

Not applicable.

Acknowledgments

The authors acknowledge the support from bedrock.farm Ltd., Budapest, Hungary, by providing access to their commercial vertical farm to carry out preliminary experiments of this study.

Conflicts of Interest

The authors declare no conflict of interest.

References

  1. Research, S. Microgreens Market Analysis, Growth, Forecast to 2030. Available online: https://straitsresearch.com/report/microgreens-market (accessed on 27 August 2023).
  2. Teng, Z.; Luo, Y.; Pearlstein, D.J.; Wheeler, R.M.; Johnson, C.M.; Wang, Q.; Fonseca, J.M. Microgreens for Home, Commercial, and Space Farming: A Comprehensive Update of the Most Recent Developments. Annu. Rev. Food Sci. Technol. 2023, 14, 539–562. [Google Scholar] [CrossRef]
  3. Kyriacou, M.C.; Rouphael, Y.; Di Gioia, F.; Kyratzis, A.; Serio, F.; Renna, M.; De Pascale, S.; Santamaria, P. Micro-Scale Vegetable Production and the Rise of Microgreens. Trends Food Sci. Technol. 2016, 57, 103–115. [Google Scholar] [CrossRef]
  4. Wojdyło, A.; Nowicka, P.; Tkacz, K.; Turkiewicz, I.P. Sprouts vs. Microgreens as Novel Functional Foods: Variation of Nutritional and Phytochemical Profiles and Their In Vitro Bioactive Properties. Molecules 2020, 25, 4648. [Google Scholar] [CrossRef]
  5. Xiao, Z.; Lester, G.E.; Luo, Y.; Wang, Q. Assessment of Vitamin and Carotenoid Concentrations of Emerging Food Products: Edible Microgreens. J. Agric. Food Chem. 2012, 60, 7644–7651. [Google Scholar] [CrossRef]
  6. Xiao, Z. Nutrition, Sensory, Quality and Safety Evaluation of a New Specialty Produce: Microgreens. Doctoral Thesis, Faculty of the Graduate School, the University of Maryland, College Park, MD, USA, 2013. [Google Scholar]
  7. Al-Kodmany, K. The Vertical Farm: A Review of Developments and Implications for the Vertical City. Buildings 2018, 8, 24. [Google Scholar] [CrossRef]
  8. Sheibani, F.; Bourget, M.; Morrow, R.C.; Mitchell, C.A. Close-Canopy Lighting, an Effective Energy-Saving Strategy for Overhead Sole-Source LED Lighting in Indoor Farming. Front. Plant Sci. 2023, 14, 1215919. [Google Scholar] [CrossRef]
  9. Kozai, T.; Lu, N.; Hasegawa, R.; Nunomura, O.; Nozaki, T.; Amagai, Y.; Hayashi, E. Plant Cohort Research and Its Application. In Smart Plant Factory: The Next Generation Indoor Vertical Farms; Kozai, T., Ed.; Springer: Singapore, 2018; pp. 413–431. ISBN 9789811310652. [Google Scholar]
  10. Balázs, L.; Dombi, Z.; Csambalik, L.; Sipos, L. Characterizing the Spatial Uniformity of Light Intensity and Spectrum for Indoor Crop Production. Horticulturae 2022, 8, 644. [Google Scholar] [CrossRef]
  11. Jones-Baumgardt, C.; Llewellyn, D.; Ying, Q.; Zheng, Y. Intensity of Sole-Source Light-Emitting Diodes Affects Growth, Yield, and Quality of Brassicaceae Microgreens. HortScience 2019, 54, 1168–1174. [Google Scholar] [CrossRef]
  12. Zheng, W.; Wang, P.; Zhang, H.-X.; Zhou, D. Photosynthetic Characteristics of the Cotyledon and First True Leaf of Castor (Ricinus communis L.). Aust. J. Crop Sci. 2011, 5, 702–708. [Google Scholar]
  13. Santos, H.P.; Buckeridge, M.S. The Role of the Storage Carbon of Cotyledons in the Establishment of Seedlings of Hymenaea Courbaril Under Different Light Conditions. Ann. Bot. 2004, 94, 819–830. [Google Scholar] [CrossRef]
  14. Walter, A.; Scharr, H.; Gilmer, F.; Zierer, R.; Nagel, K.A.; Ernst, M.; Wiese, A.; Virnich, O.; Christ, M.M.; Uhlig, B.; et al. Dynamics of Seedling Growth Acclimation towards Altered Light Conditions Can Be Quantified via GROWSCREEN: A Setup and Procedure Designed for Rapid Optical Phenotyping of Different Plant Species. New Phytol. 2007, 174, 447–455. [Google Scholar] [CrossRef]
  15. Hayashi, E.; Amagai, Y.; Kozai, T.; Maruo, T.; Tsukagoshi, S.; Nakano, A.; Johkan, M. Variations in the Growth of Cotyledons and Initial True Leaves as Affected by Photosynthetic Photon Flux Density at Individual Seedlings and Nutrients. Agronomy 2022, 12, 194. [Google Scholar] [CrossRef]
  16. Both, A.J.; Benjamin, L.; Franklin, J.; Holroyd, G.; Incoll, L.D.; Lefsrud, M.G.; Pitkin, G. Guidelines for Measuring and Reporting Environmental Parameters for Experiments in Greenhouses. Plant Methods 2015, 11, 43. [Google Scholar] [CrossRef]
  17. Both, A.J.; Ciolkosz, D.E.; Albright, L.D. Evaluation of light uniformity underneath supplemental lighting systems. Acta Hortic. 2002, 580, 183–190. [Google Scholar] [CrossRef]
  18. Zhen, S.; Bugbee, B. Far-Red Photons Have Equivalent Efficiency to Traditional Photosynthetic Photons: Implications for Redefining Photosynthetically Active Radiation. Plant Cell Environ. 2020, 43, 1259–1272. [Google Scholar] [CrossRef]
  19. Zhen, S.; van Iersel, M.; Bugbee, B. Why Far-Red Photons Should Be Included in the Definition of Photosynthetic Photons and the Measurement of Horticultural Fixture Efficacy. Front. Plant Sci. 2021, 12, 693445. [Google Scholar] [CrossRef]
  20. DesignLights Consortium. Available online: https://www.designlights.org/wp-content/uploads/2023/03/DLC_HORT-Technical-Requirements-V3-0_03312023.pdf (accessed on 1 September 2023).
  21. Trouwborst, G.; Hogewoning, S.W.; van Kooten, O.; Harbinson, J.; van Ieperen, W. Plasticity of Photosynthesis after the ‘Red Light Syndrome’ in Cucumber. Environ. Exp. Bot. 2016, 121, 75–82. [Google Scholar] [CrossRef]
  22. Lin, K.-H.; Huang, M.-Y.; Hsu, M.-H. Morphological and Physiological Response in Green and Purple Basil Plants (Ocimum basilicum) under Different Proportions of Red, Green, and Blue LED Lightings. Sci. Hortic. 2021, 275, 109677. [Google Scholar] [CrossRef]
  23. Paradiso, R.; Proietti, S. Light-Quality Manipulation to Control Plant Growth and Photomorphogenesis in Greenhouse Horticulture: The State of the Art and the Opportunities of Modern LED Systems. J. Plant Growth Regul. 2022, 41, 742–780. [Google Scholar] [CrossRef]
  24. Pennisi, G.; Blasioli, S.; Cellini, A.; Maia, L.; Crepaldi, A.; Braschi, I.; Spinelli, F.; Nicola, S.; Fernandez, J.A.; Stanghellini, C.; et al. Unraveling the Role of Red:Blue LED Lights on Resource Use Efficiency and Nutritional Properties of Indoor Grown Sweet Basil. Front. Plant Sci. 2019, 10, 305. [Google Scholar] [CrossRef]
  25. Pennisi, G.; Orsini, F.; Blasioli, S.; Cellini, A.; Crepaldi, A.; Braschi, I.; Spinelli, F.; Nicola, S.; Fernandez, J.A.; Stanghellini, C.; et al. Resource Use Efficiency of Indoor Lettuce (Lactuca sativa L.) Cultivation as Affected by Red:Blue Ratio Provided by LED Lighting. Sci. Rep. 2019, 9, 14127. [Google Scholar] [CrossRef]
  26. Jin, W.; Urbina, J.L.; Heuvelink, E.; Marcelis, L.F.M. Adding Far-Red to Red-Blue Light-Emitting Diode Light Promotes Yield of Lettuce at Different Planting Densities. Front. Plant Sci. 2021, 11, 609977. [Google Scholar] [CrossRef]
  27. Sarlikioti, V.; de Visser, P.H.B.; Marcelis, L.F.M. Exploring the Spatial Distribution of Light Interception and Photosynthesis of Canopies by Means of a Functional–Structural Plant Model. Ann. Bot. 2011, 107, 875–883. [Google Scholar] [CrossRef]
  28. Kim, J.; Kang, W.H.; Son, J.E. Interpretation and Evaluation of Electrical Lighting in Plant Factories with Ray-Tracing Simulation and 3D Plant Modeling. Agronomy 2020, 10, 1545. [Google Scholar] [CrossRef]
  29. Gu, S.; Wen, W.; Xu, T.; Lu, X.; Yu, Z.; Guo, X.; Zhao, C. Use of 3D Modeling to Refine Predictions of Canopy Light Utilization: A Comparative Study on Canopy Photosynthesis Models with Different Dimensions. Front. Plant Sci. 2022, 13, 735981. [Google Scholar] [CrossRef]
  30. Cabrera-Bosquet, L.; Fournier, C.; Brichet, N.; Welcker, C.; Suard, B.; Tardieu, F. High-Throughput Estimation of Incident Light, Light Interception and Radiation-Use Efficiency of Thousands of Plants in a Phenotyping Platform. New Phytol. 2016, 212, 269–281. [Google Scholar] [CrossRef]
  31. Thrash, T.; Lee, H.; Baker, R.L. A Low-Cost High-Throughput Phenotyping System for Automatically Quantifying Foliar Area and Greenness. Appl. Plant Sci. 2022, 10, e11502. [Google Scholar] [CrossRef]
  32. Virtanen, P.; Gommers, R.; Oliphant, T.E.; Haberland, M.; Reddy, T.; Cournapeau, D.; Burovski, E.; Peterson, P.; Weckesser, W.; Bright, J. SciPy 1.0: Fundamental Algorithms for Scientific Computing in Python. Nat. Methods 2020, 17, 261–272. [Google Scholar] [CrossRef]
  33. D’Agostino, R.; Pearson, E.S. Tests for Departure from Normality. Biometrika 1973, 60, 613–622. [Google Scholar] [CrossRef]
  34. Piovene, C.; Orsini, F.; Bosi, S.; Sanoubar, R.; Bregola, V.; Dinelli, G.; Gianquinto, G. Optimal Red:Blue Ratio in Led Lighting for Nutraceutical Indoor Horticulture. Sci. Hortic. 2015, 193, 202–208. [Google Scholar] [CrossRef]
  35. Statistical Functions (Scipy.Stats)—SciPy v1.11.2 Manual. Available online: https://docs.scipy.org/doc/scipy/reference/stats.html (accessed on 14 September 2023).
  36. Ariz, I.; Esteban, R.; García-Plazaola, J.I.; Becerril, J.M.; Aparicio-Tejo, P.M.; Moran, J.F. High Irradiance Induces Photoprotective Mechanisms and a Positive Effect on NH4+ Stress in Pisum sativum L. J. Plant Physiol. 2010, 167, 1038–1045. [Google Scholar] [CrossRef]
  37. Balázs, L.; Dombi, Z.; Csalambik, L.; Sipos, L. Characterization and Optimization of Photon Irradiance Distribution in Vertical Farms. Acta Hortic. 2023, 1369, 149–156. [Google Scholar] [CrossRef]
Figure 1. Schematics of the plant arrangement on a cultivation tray. Seedlings were arranged in 12 rows and 7 columns. The mesh size of the 12 × 7 grid was 4 cm in both the x and y directions. The dotted line shows the axis of symmetry of the irradiance created by the pair of LED luminaires shown as purple rectangles. The dotted box shows positions in row 3 from which the related row average was calculated in data analysis.
Horticulturae 09 01187 g001
Figure 2. Individual plants on the cultivation tray at the (a) transplantation; and (b) harvest.
Horticulturae 09 01187 g002
Figure 3. Top, front, and side view of the experimental vertical farm. The distance between the LED luminaires and the cultivation trays on levels A and B were 45 cm and 21 cm, respectively. The PPFD distribution was tailored by adjusting the power of LED luminaires (LED-B1, LED-B2, LED-A) and the position of trays B1, B2, and A. The color saturation of the stripes representing the LEDs indicates the relative luminaire power: LED-A = 59.5% > LED-B1 = 41.7% >> LED-B2 = 5%.
Horticulturae 09 01187 g003
Figure 4. Representative spectral distribution of irradiance measured on tray B1, position row 1, column 1. In this spectrum, the R/B and R/FR ratios were 2.5 and 3.6, respectively. In the experiment, there was only a minor change in the relative intensity of the peaks in the B, G, R, and FR wavebands; only the absolute irradiance changed across the illuminated plane.
Horticulturae 09 01187 g004
Figure 5. Horizontal PPFD distributions measured on trays (a) B2, mean = 91 µmol m−2 s−1; (b) B1; mean = 232 µmol m−2 s−1 and (c) A, mean = 249 µmol m−2 s−1. The color scale ranges from 0 to 400 µmol m−2 s−1 in (ac). Fresh weight distribution of individual seedlings on trays: (d) B2, (e) B1, and (c) A. The color scale ranges from 0 to 6 g in (df).
Horticulturae 09 01187 g005
Figure 6. Histogram of PPFD distributions: (a) B2; (b) B1; (c) A; R/B ratio: (d) B2; (e) B1; (f) A and: fresh weight (g) B2; (h) B1; (i) A.
Horticulturae 09 01187 g006
Figure 7. Comparison of spatial distributions on trays B2, B1, and A: (a) PPFD; (b) R/B ratio; (c) Shoot fresh weight. Pairwise comparisons in Table 2 indicate that the medians of B2 are significantly lower than those of B1 and A, whereas the differences between B1 and A are not statistically different.
Horticulturae 09 01187 g007
Figure 8. Correlation between individual fresh weight and PPFD data in the pea growth experiment. Markers differentiate data points related to the cultivation trays: (◯) B2; () B1; and () A. The dotted line represents the linear fit to all data points. Estimated parameters: slope = 0.005 ± 0.001, intercept = 1.145 ± 0.21. R2 = 0.31. 31% of the variations can be attributed to the local PPFD changes.
Horticulturae 09 01187 g008
Figure 9. Row average of measurement data as defined in Figure 1. Dotted lines represent polynomial fit to the data points: (a) average PPFD by row number on trays: () B1: R2 = 0.998; () A: R2 = 0.51. (b) Average shoot weight by row number on trays. () B1: R2 = 0.92; and () A: R2 = 0.006.
Horticulturae 09 01187 g009
Figure 10. The correlation between the row average fresh weight and the row average PPFD in the pea growth experiment was measured on cultivation trays B1 () and A (). Individual measurement points were grouped by rows. The dotted line represents the linear fit to all plotted data points. Estimated parameters: slope = 0.0056 ± 0.0014, intercept = 0.97 ± 0.36. R2 = 0.75.
Horticulturae 09 01187 g010
Table 1. Photon irradiance parameters were measured for the trays A, B1, and B2. The unit of PPFD, B, G, R and FR is µmol m−2 s−1. FW: shoot fresh weight in grams. R/B denotes the ratio of red and blue photon irradiances. Uo is the overall uniformity defined as the quotient of the minimum and the average of the distribution. The p-value of the normality test is denoted by p .
TrayParameterPPFDBGRFRR/BFW
AMinimum234.9059.1222.55152.9845.922.420.55
Average248.9163.6823.75161.4749.342.542.35
Maximum269.3769.0625.32175.3051.902.654.55
Uo0.940.930.950.950.930.960.23
Ud0.870.860.890.870.880.910.12
p 0.0090.0020.0760.0130.1380.7150.12
B1Minimum98.6225.9811.0161.6317.282.220.23
Average232.4859.4122.05151.0241.272.512.31
Maximum390.93101.3334.22257.5569.002.785.67
Uo0.420.440.500.410.420.890.10
Ud0.240.250.310.230.260.850.04
p 0.0000.0000.0000.0000.0000.0010.04
B2Minimum33.238.833.7020.706.262.010.22
Average91.1424.489.3857.2917.312.341.70
Maximum278.7271.6125.65181.4654.902.614.33
Uo0.360.360.390.360.360.860.13
Ud0.120.120.140.110.110.770.05
p 0.0000.0000.0000.0000.0000.1750.05
Table 2. The p-values of the pairwise non-parametric hypothesis tests for the medians (Kruskal-Wallis test) and variances (Levene’s test). The boldface numbers indicate p-value < 0.05 corresponding to statistically significant differences between the medians or variances.
Kruskal–Wallis Test (Medians)Levene’s Test (Variances)
ParameterTrayAB1B2AB1B2
PPFDA1.000--1.000--
B10.1071.000-0.0001.000-
B20.0000.0001.0000.0000.0001.000
R/BA1.000--1.000--
B10.3351.000-0.0001.000-
B20.0000.0001.0000.0000.0501.000
FWA1.000--1.000--
B10.7861.000-0.1011.000-
B20.0000.0001.0000.0150.0001.000
Disclaimer/Publisher’s Note: The statements, opinions and data contained in all publications are solely those of the individual author(s) and contributor(s) and not of MDPI and/or the editor(s). MDPI and/or the editor(s) disclaim responsibility for any injury to people or property resulting from any ideas, methods, instructions or products referred to in the content.

