1. Introduction
Manganin alloy usually contains 84.2 at.% Cu, 12.1 at.% Mn, and 3.7 at.% Ni. Nickel was added to fabricate CuMnNi alloy and it exhibited a small temperature coefficient of resistance, low thermal voltage to copper, and high resistance stability [
1]. Schmon obtained the solid phase temperature and liquid phase temperature through differential thermal analysis [
2]. In the solid phase, its resistivity and thermal expansion are determined, thus the density is calculated. The liquid state was studied. As part of the discharge circuit, the sample was subjected to resistive volumetric heating. The evolution of current voltage drops, surface brightness, and thermal expansion were detected and recorded. On the basis of these measurements, the temperature-dependent thermophysical properties such as enthalpy, isobaric heat capacity, resistivity, and density were obtained. Nakayama studied the preparation of Cu-11Mn-4Ni plate by compression shear method at room temperature and evaluated its mechanical and electrical properties [
3]. Gidts studied the preparation and characterization of a piezoresistive pressure sensor based on chrome-doped V
2O
3 thin film (Cr-V
2O
3TF) [
4]. This is the first time that the piezoresistive effect of single crystal Cr-V
2O
3TF has been demonstrated experimentally and applied to pressure sensors. This new piezoresistive mechanism opens up potential for the development of highly sensitive piezoresistive sensors based on phase transitions. Shi deposited a 2 μm thick manganin film on mica flakes by magnetron sputtering. The piezoresistive coefficient was about 1 × 10
−3 GP
−1 [
5]. Kakehi evaluated the electrical and piezoresistive properties of titanium oxide films for use as piezoresistive films for high-temperature pressure sensors [
6].
The above studies of manganin piezoresistive films used Cu84Mn12Ni4 alloys. The piezoresistive coefficient of CuMn binary alloys is positive while it is negative for Ni. There are no works focusing on the influence of varying Mn and Ni concentrations on the structure, piezoresistive coefficient, and repeatability of manganin alloy piezoresistive films. Based on this, magnetron sputtering was used in this work for the deposition of manganin films. Mn and Ni concentrations were varied by sputtering a segmented target.
2. Experiment and Test Methods
The deposition equipment used in this paper was large-scale multifunctional composite PVD coating equipment (MC800, Guangzhou, China), developed by the Advanced Manufacturing Surface Engineering Team of Guangdong University of Technology. In order to adjust the content of Mn and Ni in the manganin, we used the segmented target to achieve composition adjustment. The structure of the Cu/Mn/Ni segmented target and the deposition diagram are shown in
Figure 1.
The experiment matrix adopted the following two types of substrates: Si3N4 ceramic substrates (30 × 30 × 4 mm
3, used for the piezoresistive coefficient test and repeatability test of the film), and the single crystal Si wafer (10 × 50 × 1 mm
3, used to determine the microscopic morphology, surface roughness detection, component determination, and analyte phase structure of the film). In the deposition process, a mask was used to structure the thin film. The mask structure is shown in
Figure 2. The piezoresistive sensitive layer of manganin was deposited first. The substrate bias voltage, deposition temperature, deposition pressure, and target-sputtering power were −100 V, 200 °C, 0.2 Pa, and 2500 W, respectively. The deposition rate was about ~50 nm per minute and the deposition was conducted for 20 min. Thus, the film thickness was ~1 μm. Finally, the mask was changed to deposit the electrode layer of pure copper.
In this paper, the Bruker D8 ADVANCE polycrystalline (powder) X-ray diffractometer, manufactured by Bruker in Karlsruhe, Germany, was used to analyze and determine the composition and phase structure of the thin film sample materials. The new cold field emission scanning electron microscope HITACHI UHR FE-SEM SU8200, manufactured by HITACHI in Tokyo, Japan, was used to analyze the morphological characteristics of the surface cross-section of the film samples. The Oxford Instruments X-MaxN electron spectrometer (Abingdon, UK), attached to the HITACHI UHR FE-SEM SU8200 scanning electron microscope (Tokyo, Japan), was used to qualitatively and quantitatively analyze the composition of the film sample. The Anton Paar Tosca 400 model atomic force microscope, manufactured by the Anton Paar Company in Graz, Austria, was used to analyze the surface microscopic area morphology and surface roughness of the thin film samples. Shimadzu Corporation’s electronic universal testing machine AGS-X 50KN (Kyoto, Japan) and a Rek2514 precision resistance tester with an accuracy of 0.1 μΩ, manufactured by Shenzhen Rek in Shenzhen, China, were used for the piezoresistive tests. The TYQH-4 high-temperature and high-vacuum brazing furnace, made by Zhengzhou Brother Furnace Co., Ltd. in Zhengzhou, China, was used for the annealing and heat treatment of the thin film samples. The annealing parameter is 2 h annealing at 400 °C.
3. Results and Discussion
3.1. The Effect of Different Ni Contents on the Structure and Piezoresistive Properties of Manganin Thin Films
As the content of Ni decreased from 17.54 at.% to 0.18 at.%, the content of Cu increased from 82.45 at.% to 98.44 at.%, and the atomic ratio of Mn was kept below 1 at.%.
Figure 3 shows the X-ray diffraction patterns of manganin thin films with different Ni contents. It can be seen from the figure that as the Ni content increased from 0.18 at.% to 17.54 at.%, the peak position of Ni was not found, indicating that Ni is always solid soluble in Cu within this content range. The increase in Ni content also led to Cu (111) and Cu (200) peaks shifted to high angles. This was because the atomic radius of Ni is smaller than that of Cu, so the solid solution of Ni caused the lattice constant of the Ni-Cu alloy to decrease, and the lattice spacing became smaller, causing the XRD diffraction peak position to shift to a higher angle. The increase in the content of Ni also led to a gradual increase in the half-height width of the Cu (111) diffraction peak, indicating that an increase in the content of Ni dissolved in Cu can make the Cu grains more refined.
Figure 4 shows the SEM surface and cross-sectional morphologies of manganin thin films with different Ni contents. It can be seen from the surface SEM image that as the Ni content increased from 0.18 at.% to 17.54 at.%, the coarse and uneven grain structure on the surface of the film gradually disappeared, forming a fine and smooth grain structure. However, with the gradual refinement of the crystal grains, more and more defects, such as micropores, became visible on the surface of the film. It can be seen from the cross-sectional SEM image that with the gradual increase in Ni content, the microporous defect structure in the cross-section of the film gradually increased, the density gradually decreased, and the grain structure of the film was gradually refined. When the Ni content was 17.54 at.%, a loose and porous fine grain structure was formed. Increasing the content of solid solution Ni in the manganin thin films results in a refinement of the film’s grains, but at the same time can also lead to a decrease in the density of the film, and loose and porous film grains are formed when the content of Ni is in high organization, which will significantly enhance the scattering of electrons during transportation, reducing the piezoresistive coefficient of the film and the repeatability of the test.
Figure 5 shows the three-dimensional AFM surface morphology pictures and surface roughness changes in five different Ni content manganese copper films. As the content of Ni gradually decreased, the surface of the film gradually developed from a needle-like fine-grained structure to an arch-shaped coarse-grained structure, which was consistent with the results of the SEM test. According to the surface roughness measured by AFM, the gradual decrease in Ni content not only forms a coarse grain structure, but also causes the surface roughness Sa of the film to gradually increase from 7.11 nm to 64.4 nm. The increase in the surface roughness of the film also affects the piezoresistive effect of the manganin film.
Figure 6 shows the piezoresistive fitting straight lines of manganin thin films with different Ni contents. The coefficients of determination of fitting correction were all over 90%; that is, the relative error was small, and the linearity was high. It can be seen from
Figure 6 that as the Ni content of the film decreased from 17.54 at.% to 0.18 at.%, the film gradually changed from a negative piezoresistive effect to a positive piezoresistive effect, and the higher the Ni content, the greater the negative piezoresistive coefficient of the film. When the Ni content was 17.54 at.%, the negative piezoresistive coefficient of the film reached the maximum,
. This was because the Ni metal element itself has a large negative piezoresistive effect, while the Cu metal element itself has a small positive piezoresistive effect [
7], so an increase in the content of Ni solid-dissolved in Cu led to the gradual bias of Cu towards the negative piezoresistive coefficient. When the Ni content was reduced to 0.18 at.%, the film had a positive piezoresistive coefficient,
. We took samples with relatively large negative piezoresistive coefficients of 17.54 at.% and 5.49 at.% for repeated cyclic piezoresistive tests. The test results are shown in
Figure 7.
Figure 7a,b show that with the decrease in Ni content, the dispersion of the piezoresistive fitting line of the film in the repeated test process increased, indicating that the repeatability test ability of the film had decreased. It can be seen from
Figure 7c that during the repeatability test, the fluctuation of the piezoresistive coefficient of the sample with a Ni content of 5.49 at.% was greater than that of the coating sample with a Ni content of 17.54 at.%, and the absolute value of the negative piezoresistive coefficient was also smaller than the coating sample with a Ni content of 17.54 at.%. The above results indicate that an increase in Ni content reduces the density and positive piezoresistive coefficient of the manganin film deposited by magnetron sputtering, and that the higher the Ni content, the more the positive piezoresistive effect of the manganin film has a tendency to gradually transform into a negative piezoresistive effect.
3.2. The Effect of Different Mn Contents on the Structure and Piezoresistive Properties of Manganin Thin Films
The segmented target was also used to achieve the deposition of manganin films with different Mn contents. As the content of Mn in the film increased from 1.38 at.% to 16.72 at.%, the content of Cu decreased from 98.44 at.% to 83.04 at.%, and the content of Ni was always kept below 1 at.%.
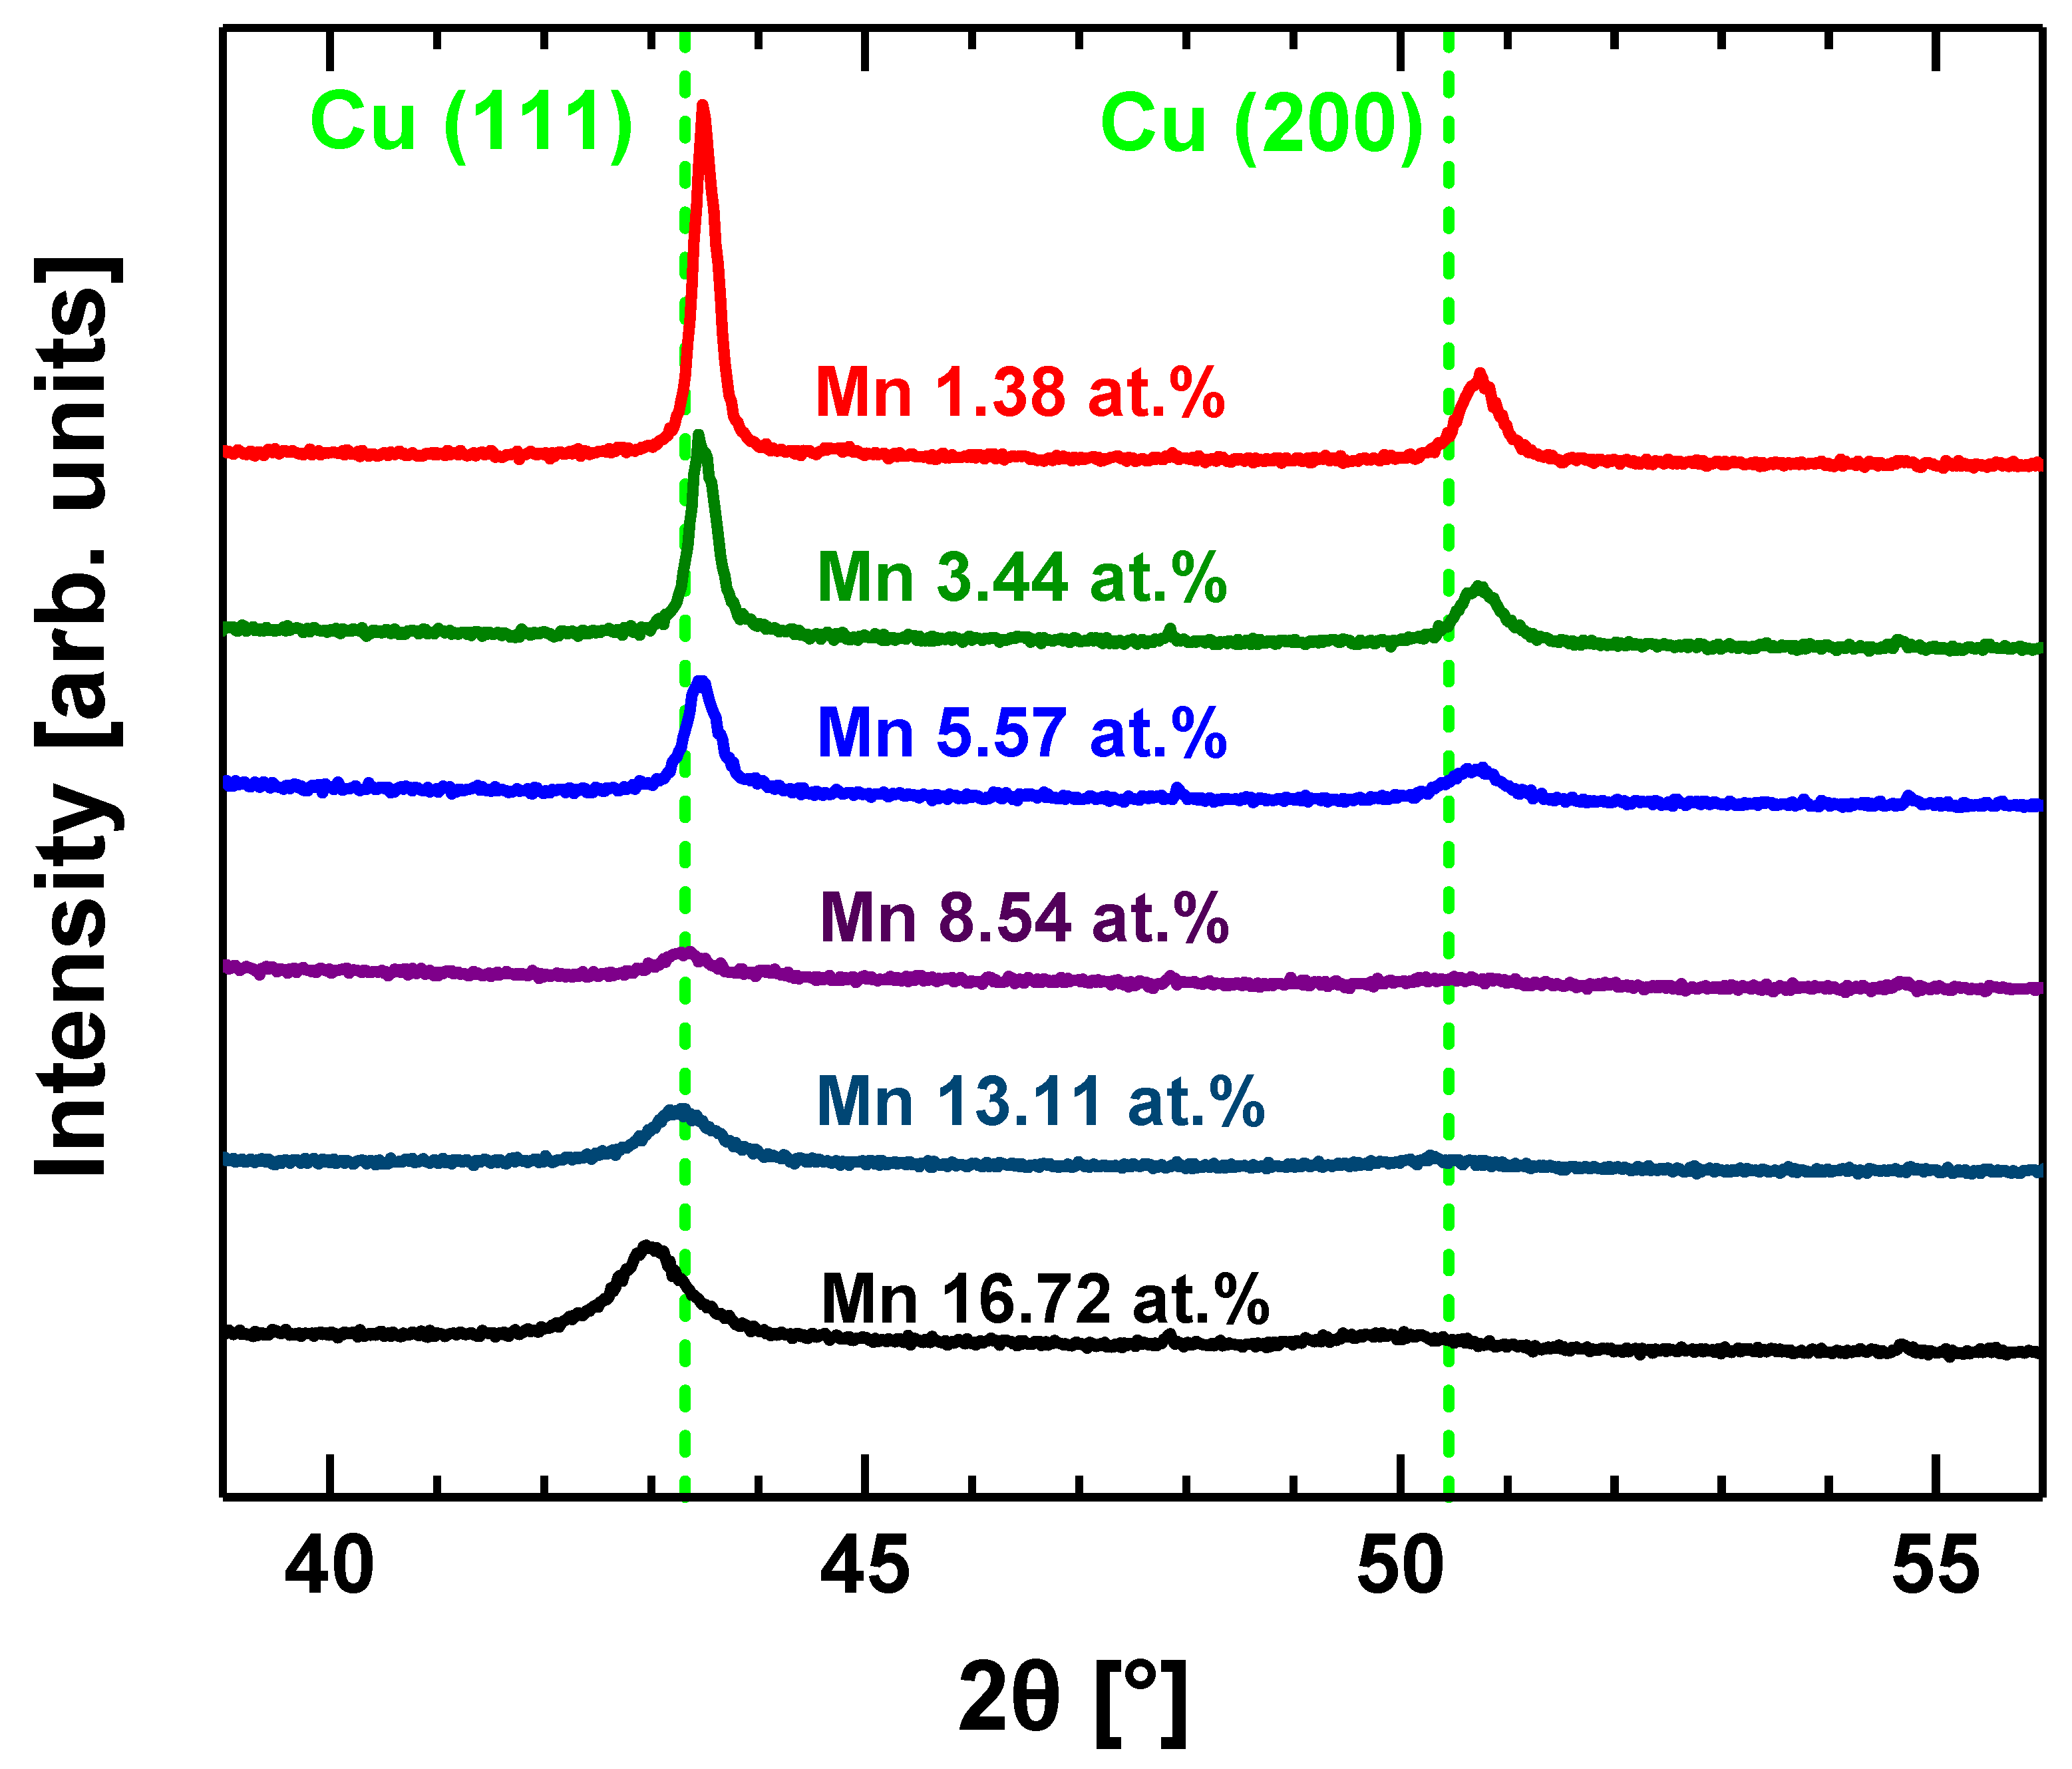
Figure 8 shows the X-ray diffraction pattern of the manganin films with different Mn contents. According to the figure, as the Mn content increased from 1.38 at.% to 16.72 at.%, the peak position of Mn was not found, indicating that it was within this content range. Mn is always solid soluble in Cu; when the Mn content increased to 8.54 at.%, the Cu (200) orientation peak position disappeared, indicating that the increase in Mn content can lead to the preferential growth of the Cu (111) orientation in the grain structure of the manganin films. With the increase in Mn content, the Cu (111) peak position shifted to a low angle. This was because the lattice constant of Mn (891.25) is greater than that of Cu (361.49), so the solid solution of Mn can cause the lattice constant of Cu-Mn alloy to increase, the lattice spacing to become larger, and the peak position to shift to a low angle. With the increase in Mn content, the half-height width of the Cu (111) diffraction peak gradually increased, indicating that the increase in Mn content in solid solution can cause the Cu grains to be gradually refined.
Figure 9 shows the SEM surface and cross-sectional morphology pictures of manganin films with different Mn contents. It can be seen from the surface SEM images that as the Mn content increased from 1.38 at.% to 16.72 at.%, the coarse grain structure on the surface of the film gradually lessened. The fine and uniform grain structure was replaced, the grain refinement was obvious, and no defects, such as micropores, were found on the surface of the film samples. The density of the film was well maintained. According to the cross-sectional SEM image, with the increase in Mn content, the microporous structure at the cross-section of the film lessened. When the Mn content was 5.57 at.%, a larger, dense columnar crystal structure was formed. With the increase in Mn content, the grain size continued to increase and was gradually refined and increased in density. When the Mn content reached the maximum of 16.72 at.%, a thin film structure with fine grains and high density was formed. The above test results were consistent with the XRD analysis results of the film.
Figure 10 is the AFM three-dimensional surface morphology map and surface roughness change map of manganin films with different Mn contents. According to the figure, with the increase in Mn content, the surface of the film gradually developed from a convex round coarse grain structure to a fine needle-like grain structure. When the Mn content was greater than 5.57 at.%, the grain refinement of the film structure was particularly significant, and the surface roughness of the film also gradually decreased, which was consistent with the results of the SEM image.
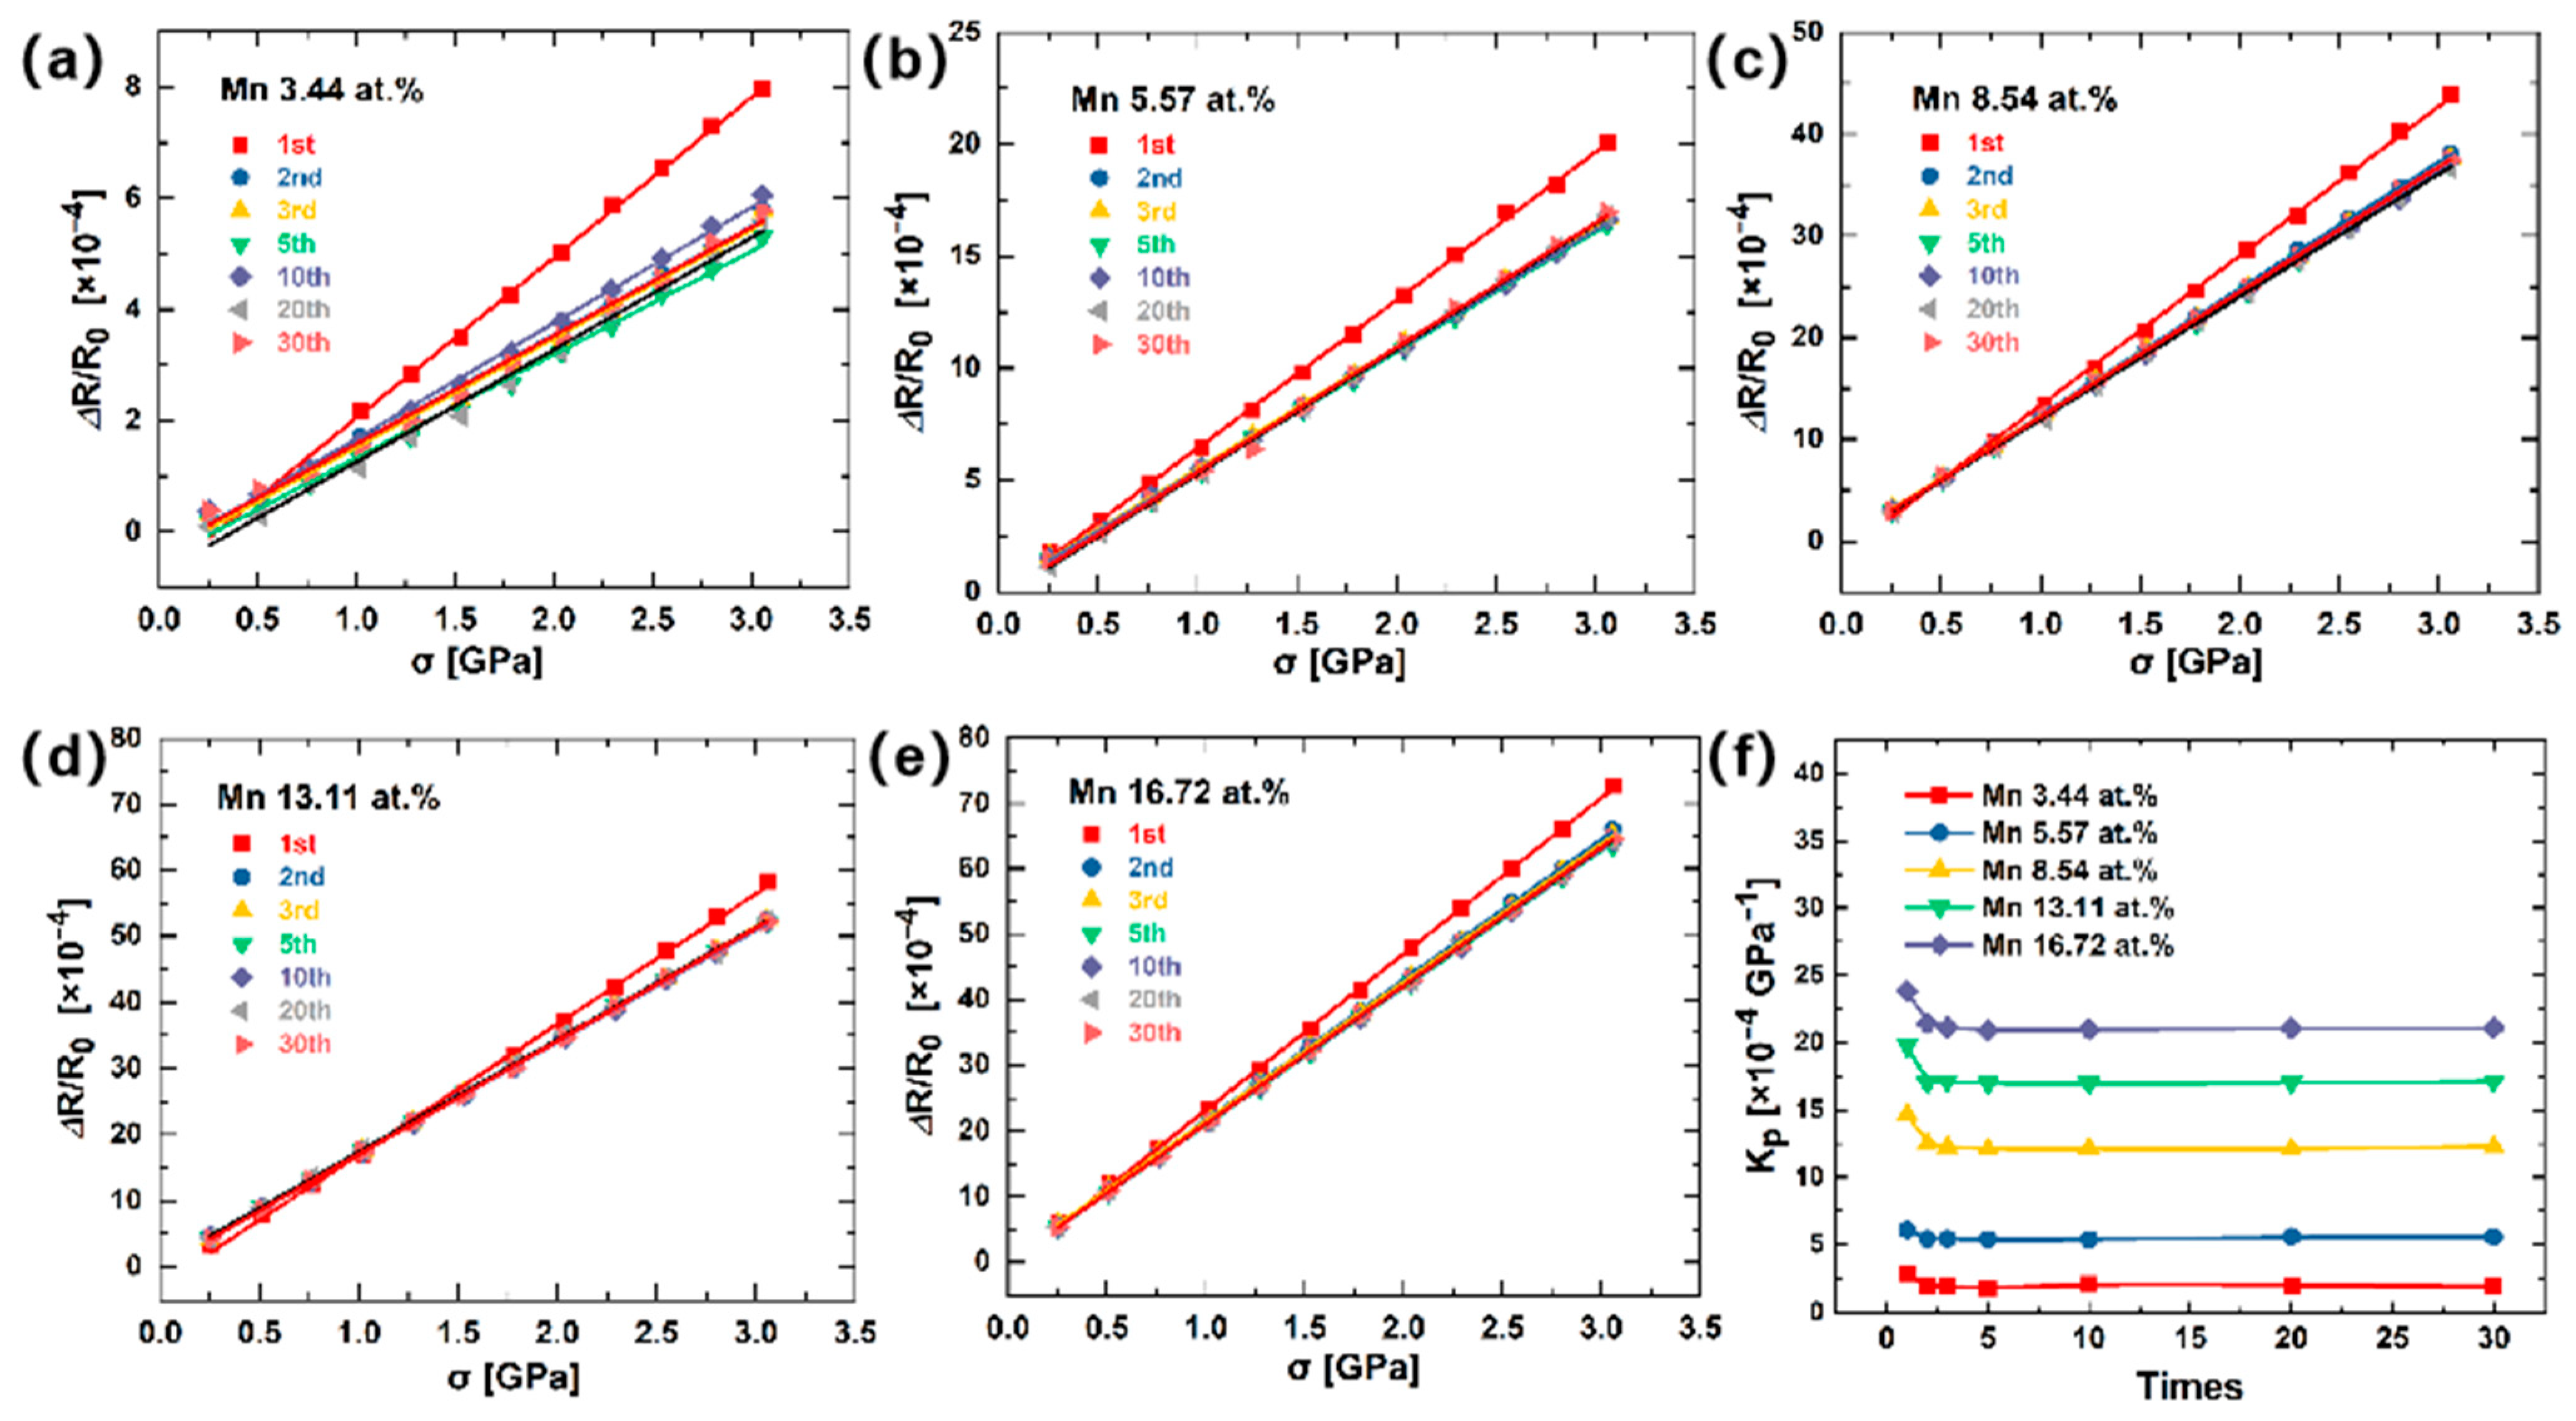
Figure 11 shows the piezoresistive fitting straight lines of manganin films with different Mn contents. The correction determination coefficient of each fitting straight line exceeded 99%, indicating that the fitting error was relatively small, and the linearity was high. According to
Figure 11, as the Mn content in the film increased from 1.38 at.% to 16.72 at.%, the piezoresistive coefficient of the film gradually increased, and the piezoresistive coefficient of the film reached the maximum when the Mn content was 16.72 at.%,
. Therefore, the solid solution of Mn had an enhanced effect on the positive pressure resistance of Cu, and the incorporation of Mn can increase the density of manganin films, refine the grain structure of the film, and increase the electron scattering generated by the film under stress, enhancing the piezoresistive effect.
Figure 12 shows the piezoresistive repeatability test of the manganese copper film with different Mn contents and its influence on the piezoresistive coefficient
Kp. As shown in
Figure 12a–e, as the Mn content gradually increased, the dispersion of the repeatability test gradually decreased, so the film repeatability test ability gradually increased.
Figure 12f shows that with the increase in Mn content, the piezoresistive coefficient of the film gradually increased, and the change in the piezoresistive coefficient of the film did not fluctuate much. At a higher Mn content of 13.11~16.72 at.%, the piezoresistive coefficient of the film basically had no fluctuation under multiple piezoresistive tests, and the repeatability was good. The above results indicate that increasing the content of solid solution component Mn in the manganin films deposited by magnetron sputtering can refine the grains of the film and form a dense film structure, which improves the piezoresistive coefficient of the film and the stability of repeated tests.
3.3. The Effect of Annealing Treatment on the Structure and Piezoresistive Properties of Manganin Films
Annealing treatment can eliminate the thermal stress of the film, and the grain structure of the film grows during the annealing process to fill the defects in the film deposition process and improve the density of the film. Shangchun Shi and Xiaosong Du [
5,
8] found that annealing the manganin film in a vacuum environment at 400 °C can increase the density and piezoresistive coefficient of the film. Therefore, we further optimized the microstructure and piezoresistive properties of the manganin films with a Mn content of 16.72 at.% was annealed.
Figure 13 shows the X-ray diffraction pattern of manganin film samples with a Mn content of 16.72 at.% after annealing at 400 °C for 2 h. In
Figure 13, the Cu (111) and Cu (200) of the film after heat treatment were compared with the unheated film. The (200) peak intensity was weakened, and the half-height width of the diffraction peak reduced, indicating that the grains of the film had grown after heat treatment, and the (111) preferential orientation growth characteristics were weakened. In addition, the XRD diffraction peaks were also shifted to a higher angle compared with the unheated film, indicating that heat treatment can eliminate the residual compressive stress of the film during the deposition process.
Figure 14 shows the SEM surface and cross-sectional morphology of the manganin film samples with a Mn content of 16.72 at.% after annealing at 400 °C for 2 h. When comparing the morphology before and after the heat treatment, the grains of the film after the heat treatment were slightly enlarged and still maintained a fine crystal structure, but the density of the film was improved.
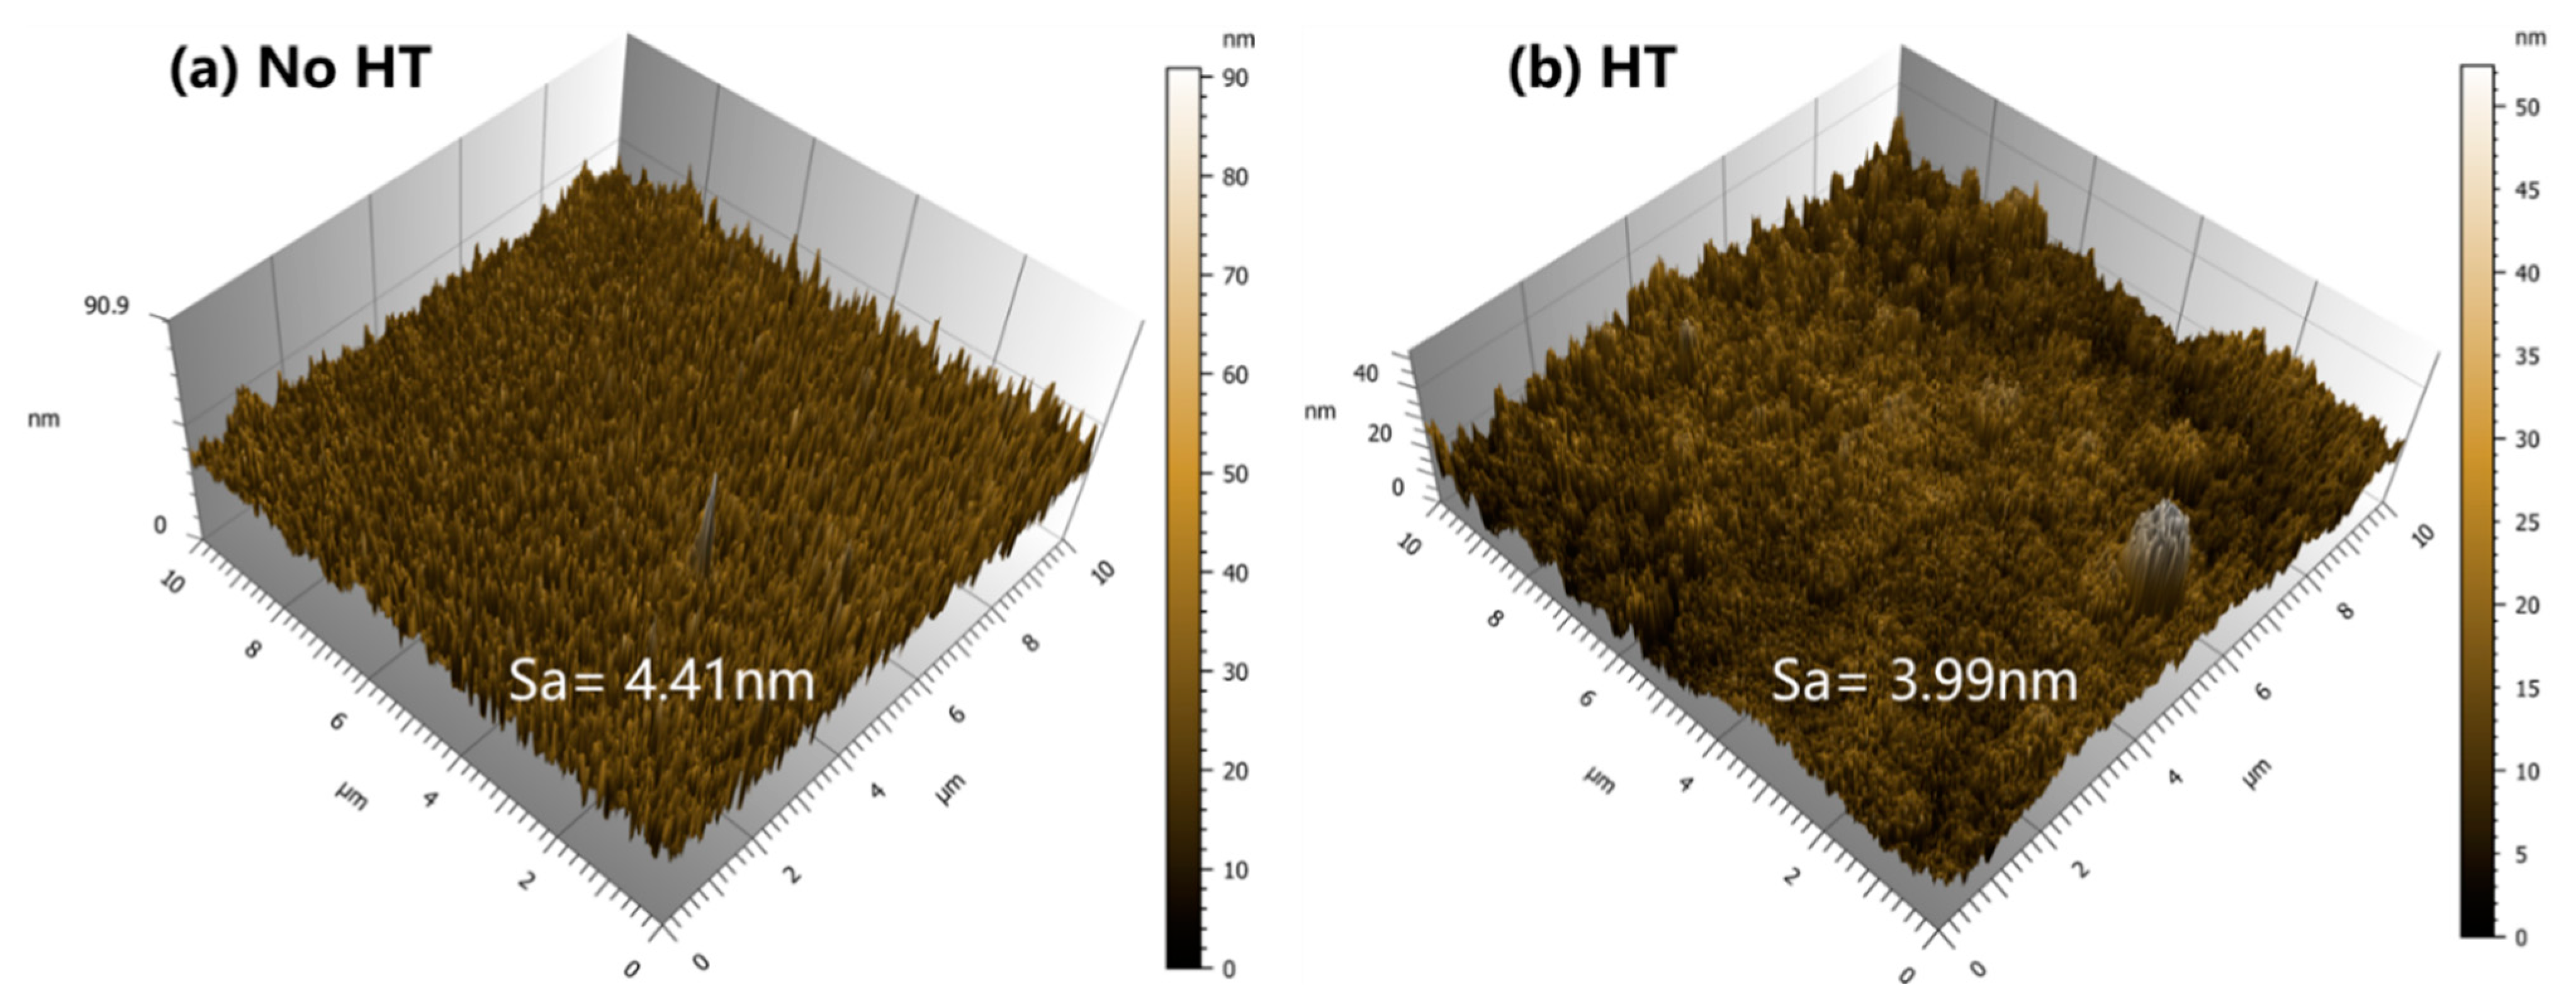
Figure 15 shows the AFM three-dimensional surface morphology and surface roughness of manganin films with a Mn content of 16.72 at.% after annealing at 400 °C for 2 h. According to
Figure 15, the grain structure on the surface of the film after heat treatment was fine. The needle-like crystal grains grew into coarser crystal grains, and the surface of the film became smoother after heat treatment, which was consistent with the observation results of SEM. The surface roughness of the film before and after the heat treatment showed a difference of less than 5 nm; the surface of the film was very smooth and flat.
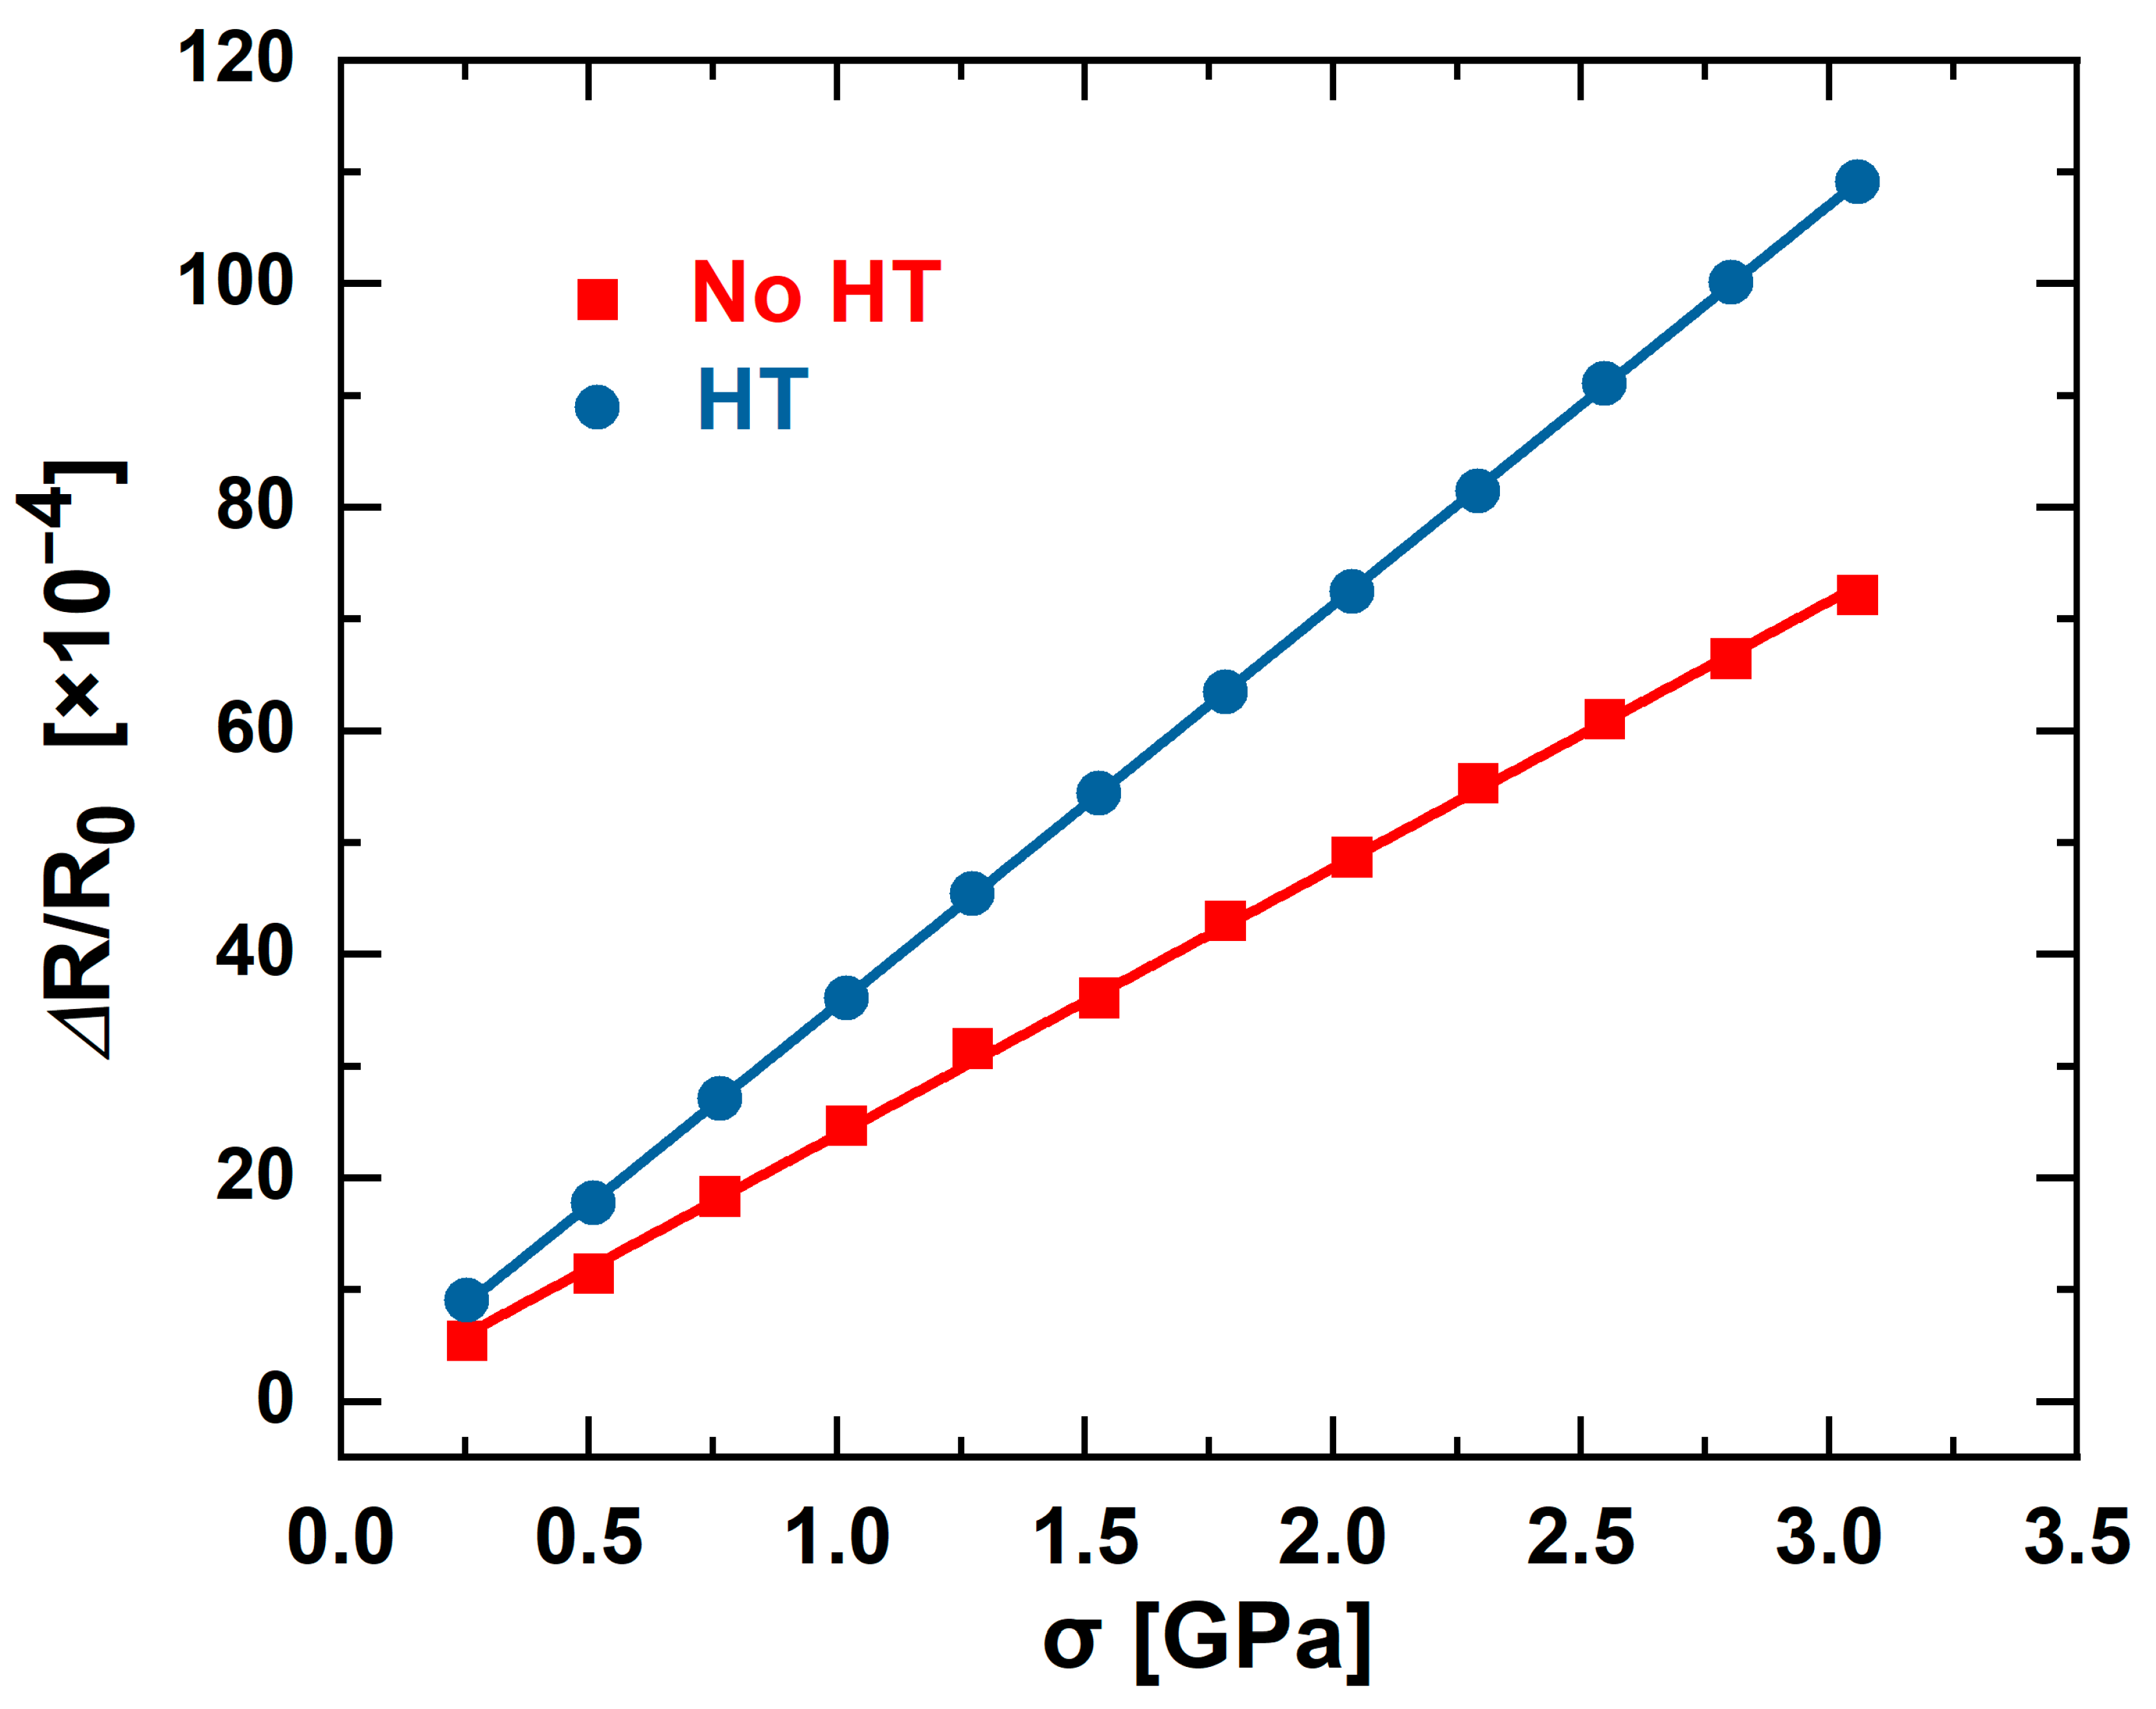
Figure 16 shows the piezoresistive fitting straight line of the manganin films with a Mn content of 16.72 at.% after annealing at 400 °C for 2 h. The correction coefficients of the fitting straight line all exceeded 99%, indicating that the relative error of the fitting straight line was very small and the degree very high. According to
Figure 16, the piezoresistive coefficient of the film was greatly improved after heat treatment, from
to
.
Figure 17 shows the repeatability test of manganin films with a Mn content of 16.72 at.% after annealing at 400 ℃ for 2 h, and its effect on the piezoresistive coefficient
Kp. It can be seen from
Figure 17a,b that the piezoresistive fitting curve of the repeatability test of the film before and after heat treatment was basically similar, and the deviation between the first test and the subsequent repeatability test curve became smaller. According to
Figure 17c, the fluctuation of the piezoresistive coefficient of the film during repeated testing after heat treatment was relatively small, indicating that the heat treatment not only improved the piezoresistive coefficient of the film, but also enhanced its repeatability.
4. Conclusions
This article used the segmented target deposition method to explore the influence of different Mn and Ni component contents, as well as the effect of the heat treatment process, on the structure and piezoresistive performance of manganin films. Increasing the content of solid solution Ni in Cu can refine the Cu crystal grains, but at the same time, it also leads to an increase in structural defects, such as micropores, which reduces the density of the film and increases its surface roughness. The increase in Ni content can also cause the positive piezoresistive coefficient of the manganin films to change to a negative piezoresistive coefficient. When the Ni content was 17.54 at.%, the negative piezoresistive coefficient of the film was , so excessive doping of Ni has a weakening effect on the piezoresistive effect of the manganin film. With the gradual increase in Ni content, the transverse microporous defect structure of the film gradually increases, the density gradually decreases, and the grain structure of the film is gradually refined. The loose and porous fine particle structure can significantly increase the electron scattering during transportation and reduce the piezoresistive coefficient of the film.
Increasing the content of solid solution Mn in Cu can refine the Cu grains, increase the density of the film, reduce the density of structural defects such as micropores in the film structure, and decrease the surface roughness of the film. Because both Mn and Cu elemental metals exhibit a positive piezoresistive effect under stress, the solid solution of Mn has an enhanced effect on the positive piezoresistive effect of Cu. The inclusion of Mn can improve the density of the film, refine the grain structure of the film, increase the electron scattering of the film under the action of stress, and enhance the piezoresistive effect. When the Mn content was 16.72 at.%, the film piezoresistive coefficient reached , and the film had excellent repeat stability. After the manganin film with a Mn content of 16.72 at.% was annealed at 400 °C for 2 h, the film grains grew slightly, the density of the film increased, and the residual stress of the film decreased. Based on structural optimization, the scattering of electrons during transportation can be reduced, so the piezoresistive coefficient of the film after heat treatment can be increased from to , and the film showed better repeatability in multiple piezoresistive tests.
Author Contributions
Conceptualization, Z.W. and Q.W.; methodology, X.H. and Y.C.; software, Y.C.; validation, X.H., Z.W. and Y.L.; formal analysis, X.H.; investigation, L.L.; resources, Z.W. and Y.L.; data curation, Z.W. and L.L.; writing—original draft preparation, X.H.; writing—review and editing, Z.W.; visualization, C.L.; supervision, Y.C. and C.L.; project administration, Z.W.; funding acquisition, Q.W. All authors have read and agreed to the published version of the manuscript.
Funding
This research was funded by the National Key Research and Development Project of China (No. 2017YFE0125400). The authors acknowledge the financial supports of the Guangzhou Science & Technology Project (No. 2023A04J1598) and the Xiamen Science and Technology Major Project (No. 3502Z20231009) as well.
Institutional Review Board Statement
Not applicable.
Informed Consent Statement
Not applicable.
Data Availability Statement
No new data were created or analyzed in this study. Data sharing is not applicable to this article.
Conflicts of Interest
Yisong Lin and Liangliang Lin are employees of Xiamen Golden Egret Special Alloy Co., Ltd., Chao Liu is employee of Xiamen Tungsten Co., Ltd. The paper reflects the views of the scientists and not the company. The remaining authors declare that the research was conducted in the absence of any commercial or financial relationships that could be construed as a potential conflict of interest.
References
- Ishak, N.I.; Ibarahim, Z. Calibration of 1 ohm standard resistor in National Metrology Institute of Malaysia (NMIM). AIP Conf. Proc. 2018, 1940, 020014. [Google Scholar]
- Schmon, A.; Aziz, K.; Luckabauer, M.; Pottlacher, G. Thermophysical Properties of Manganin (Cu86Mn12Ni2) in the Solid and Liquid State. Int. J. Thermophys. 2015, 36, 1618–1626. [Google Scholar] [CrossRef]
- Nakayama, N.; Inoue, H.; Kusunoki, H.; Horita, M.; Kumeda, Y.; Nakamura, K. Effect of Shearing Distance on Mechanical and Electrical Properties for Cu-11Mn-4Ni Thin Plate Formed by Compression Shearing Method at Room Temperature. Mater. Sci. Forum 2018, 941, 1517–1522. [Google Scholar] [CrossRef]
- Han, X.; Huang, M.; Wu, Z.; Gao, Y.; Xia, Y.; Yang, P.; Fan, S.; Lu, X.; Yang, X.; Liang, L.; et al. Advances in high-performance MEMS pressure sensors: Design, fabrication, and packaging. Microsyst. Nanoeng. 2023, 9, 156. [Google Scholar] [CrossRef]
- Shi, S.C.; Zhang, Q.F.; Luo, J.M. A Plating Manganin Piezoresistance Gauge. Chin. J. High Press. Phys. 1992, 6, 68–74. [Google Scholar]
- Kakehi, Y.; Yamada, Y.; Kondo, Y.; Oguri, T.; Satoh, K. Electrical and piezoresistive properties of titanium oxycarbide thin films for high-temperature pressure sensors. Vacuum 2021, 193, 110550. [Google Scholar] [CrossRef]
- Fiorillo, A.; Critello, C.; Pullano, S. Theory, technology and applications of piezoresistive sensors: A review. Sens. Actuators A Phys. 2018, 281, 156–175. [Google Scholar] [CrossRef]
- Du, X.S. The fabrication and applications of PVDF shock pressure sensors. J. Funct. Mater. 2003, 33, 15–18. [Google Scholar]
Figure 1.
Schematic diagram of segmented target (a) and deposition configuration (b).
Figure 1.
Schematic diagram of segmented target (a) and deposition configuration (b).
Figure 2.
(a) Structure design of piezoresistive sensitive element and electrode. (b) Sensitive element mask. (c) Electrode mask.
Figure 2.
(a) Structure design of piezoresistive sensitive element and electrode. (b) Sensitive element mask. (c) Electrode mask.
Figure 3.
The X-ray diffraction patterns of manganin films with different Ni concentrations.
Figure 3.
The X-ray diffraction patterns of manganin films with different Ni concentrations.
Figure 4.
The SEM surface and cross-section morphologies of manganin films with different Ni concentrations.
Figure 4.
The SEM surface and cross-section morphologies of manganin films with different Ni concentrations.
Figure 5.
AFM three-dimensional surface morphology and surface roughness of manganin films with different Ni contents.
Figure 5.
AFM three-dimensional surface morphology and surface roughness of manganin films with different Ni contents.
Figure 6.
The piezoresistive lines of manganin films with different Ni content.
Figure 6.
The piezoresistive lines of manganin films with different Ni content.
Figure 7.
The piezoresistive repeatability test of manganin films with different Ni concentrations: (a) 17.54 at.% Ni, (b) 12.31 at.% Ni, and (c) fluctuation of piezoresistive coefficient Kp.
Figure 7.
The piezoresistive repeatability test of manganin films with different Ni concentrations: (a) 17.54 at.% Ni, (b) 12.31 at.% Ni, and (c) fluctuation of piezoresistive coefficient Kp.
Figure 8.
The X-ray diffraction patterns of manganin films with different Mn contents.
Figure 8.
The X-ray diffraction patterns of manganin films with different Mn contents.
Figure 9.
The SEM surface and cross-section morphologies of manganin films as a function of Mn concentrations.
Figure 9.
The SEM surface and cross-section morphologies of manganin films as a function of Mn concentrations.
Figure 10.
AFM three-dimensional surface morphology and surface roughness of manganin films with different Mn content.
Figure 10.
AFM three-dimensional surface morphology and surface roughness of manganin films with different Mn content.
Figure 11.
The piezoresistive lines of manganin films with different Mn content.
Figure 11.
The piezoresistive lines of manganin films with different Mn content.
Figure 12.
The piezoresistive test results of manganin films with different Mn content: (a) 3.44 at.% Mn, (b) 5.57 at.% Mn, (c) 8.54 at.% Mn, (d) 13.11 at.% Mn, (e) 16.72 at.% Mn, and (f) fluctuation of piezoresistive coefficient Kp.
Figure 12.
The piezoresistive test results of manganin films with different Mn content: (a) 3.44 at.% Mn, (b) 5.57 at.% Mn, (c) 8.54 at.% Mn, (d) 13.11 at.% Mn, (e) 16.72 at.% Mn, and (f) fluctuation of piezoresistive coefficient Kp.
Figure 13.
X-ray diffraction patterns of manganin films with a Mn content of 16.72 at.% before and after heat treatment at 400 °C for 2 h.
Figure 13.
X-ray diffraction patterns of manganin films with a Mn content of 16.72 at.% before and after heat treatment at 400 °C for 2 h.
Figure 14.
SEM surface and cross-sectional morphology pictures of manganin films with a Mn content of 16.72 at.% before and after heat treatment at 400 °C for 2 h.
Figure 14.
SEM surface and cross-sectional morphology pictures of manganin films with a Mn content of 16.72 at.% before and after heat treatment at 400 °C for 2 h.
Figure 15.
AFM three-dimensional surface morphology of manganin films with a Mn content of 16.72 at.% before and after heat treatment at 400 °C for 2 h.
Figure 15.
AFM three-dimensional surface morphology of manganin films with a Mn content of 16.72 at.% before and after heat treatment at 400 °C for 2 h.
Figure 16.
The piezoresistive fitting straight line of the manganin films with a Mn content of 16.72 at.% before and after heat treatment at 400 °C for 2 h.
Figure 16.
The piezoresistive fitting straight line of the manganin films with a Mn content of 16.72 at.% before and after heat treatment at 400 °C for 2 h.
Figure 17.
Repeatability test of manganin films with Mn content of 16.72 at.% before and after heat treatment at 400 °C for 2 h: (a) 0 h, (b) 2 h, and (c) fluctuation of piezoresistive coefficient Kp.
Figure 17.
Repeatability test of manganin films with Mn content of 16.72 at.% before and after heat treatment at 400 °C for 2 h: (a) 0 h, (b) 2 h, and (c) fluctuation of piezoresistive coefficient Kp.
| Disclaimer/Publisher’s Note: The statements, opinions and data contained in all publications are solely those of the individual author(s) and contributor(s) and not of MDPI and/or the editor(s). MDPI and/or the editor(s) disclaim responsibility for any injury to people or property resulting from any ideas, methods, instructions or products referred to in the content. |
© 2024 by the authors. Licensee MDPI, Basel, Switzerland. This article is an open access article distributed under the terms and conditions of the Creative Commons Attribution (CC BY) license (https://creativecommons.org/licenses/by/4.0/).


