Review

Nuclear Magnetic Resonance, a Powerful Tool in Cultural Heritage

Laboratorio di Risonanza Magnetica “Annalaura Segre”, Istituto di Metodologie Chimiche, CNR Area Della Ricerca di Roma 1, Via Salaria km. 29,300, 00015 Monterotondo, Italy
*
Author to whom correspondence should be addressed.
Magnetochemistry 2018, 4(1), 11; https://doi.org/10.3390/magnetochemistry4010011
Submission received: 28 December 2017 / Revised: 10 January 2018 / Accepted: 13 January 2018 / Published: 17 January 2018
(This article belongs to the Special Issue Nuclear Magnetic Resonance Spectroscopy)

Abstract

:
In this paper five case studies illustrating applications of NMR (Nuclear Magnetic Resonance) in the field of cultural heritage, are reported. Different issues were afforded, namely the investigation of advanced cleaning systems, the quantitative mapping of moisture in historic walls, the investigation and evaluation of restoration treatments on porous stones, the stratigraphy of wall paintings, and the detection of CO2 in lapis lazuli. Four of these case studies deal with the use of portable NMR sensors which allow non-destructive and non-invasive investigation in situ. The diversity among cases reported demonstrates that NMR can be extensively applied in the field of cultural heritage.

Graphical Abstract

1. Introduction

Nuclear Magnetic Resonance (NMR) is a powerful tool in research and diagnostics in many different fields. Despite its versatility, NMR is inherently insensitive compared with other analytical techniques. To overcome this problem, new NMR techniques and probeheads are continuously being developed and improved.
High resolution NMR spectroscopy allows the investigation of the structure of liquid [1] and solid [2,3] samples. New probeheads such as microprobes and cryoprobes [4,5] have enabled the NMR analysis of liquid samples down to the µg scale. In the case of cryogenically cooled NMR probeheads the detection coil and the preamplifier are cooled at low temperature in order to achieve a net increase in sensitivity. Microprobes allow the sample to be confined in a small volume. In the early times of solid state NMR about 400–500 mg of sample were required for performing the analysis. Nowadays the use of new microprobes and technologies to enhance the sensitivity of rare nuclei has allowed the amount of sample to be reduced down to a few mg, making NMR a suitable technique for analyzing solid samples available only in a small amount. High Resolution Magic Angle Spinning (HRMAS) [6] allows the analysis of a very low amount of soft matter.
Monitoring and diagnosis of artworks enable the prevention or delay of their degradation. The knowledge of the state of degradation of artworks, the characterization of constitutive materials, and the development of new methods and materials aimed at lengthening the life time of artworks, are important achievements in the correct safeguard of Cultural Heritage. The amount of samples obtained from precious artifacts must be reduced to a minimum, therefore micro-destructive, non-destructive, and possibly non-invasive analytical techniques are advisable. Another problem is that often objects to be analyzed cannot be brought to the laboratory because they are too precious or unmovable. These difficulties have been overcome with the use of portable NMR sensors which allow the study of arbitrarily sized objects in a non-destructive and non-invasive way [7]. The magnetic field generated by these sensors is external to the sensor and allows measurements to be performed inside the object under investigation [8]. Because the magnetic field generated by these sensors is inhomogeneous, the signal (Free Induction Decay-FID) decays too quickly to be observed, hence it must be detected as an echo [9]. Note that the inhomogeneous field is a source of relaxation which makes the transverse relaxation time shorter than that which would be measured in a homogeneous field. Nevertheless, these sensors allow the measurements of important NMR parameters such as the proton population, the self-diffusion coefficient D, relaxation times T1 and T2, and even allow the acquisition of correlation 2D-maps such as (T1, T2) and (T2, D).
In recent years several issues regarding cultural heritage have been afforded by NMR [10,11,12]. Among these are wall paintings and oil paintings [13,14,15,16,17,18,19], paper [20,21], moisture in historical walls [22,23,24], lead soaps [25,26,27,28], pigments [29,30], organic paint binders [31,32], modern art materials [33,34,35], archaeological and fossil wood [36,37,38,39], ancient leather [40,41], amber [42,43], ancient pottery [44,45,46], porous stones [47,48,49,50,51], and advanced cleaning and conservation systems for cultural heritage [52,53,54,55].
In this paper some examples of the use of NMR in affording issues involving cultural heritage, are reported.

2. Results and Discussion

2.1. Cleaning Process of Cultural Heritage Studied by Single-Sided NMR

The cleaning of cultural heritage is carried out to remove layers that may damage artefacts such as salt efflorescences, metal stains, crusts, or layers formed by natural ageing [56,57,58]. The cleaning procedure is a delicate and potentially damaging operation to the artefact [59]. To improve the procedure highly performing cleaning systems are required [52,60,61].
An important improvement to classical cleaning procedures has been the formulation of solutions confined into host systems like physical and chemical gels. The use of thickeners and gels in chemical cleaning treatments helps to reduce solvent permeation into the porous microstructure and to control the effect of the cleaning action on the surface of artefacts. Thickeners and gels can be used with water as the principal cleaning method or in combination with other methods. In the latest case, they may be modified by adding compounds able to target a specific type of stain or surface coating. These materials are purposely designed to remove layers and contaminants that are insoluble in water and/or have penetrated deep into the surface of the artefact. The most common materials used to obtain thickeners include:
  • Natural and synthetic silicates, i.e., clays such as sepiolite and attapulgite.
  • Cellulosic and wooden materials, i.e., cotton fibers, paper pulp, wooden pulp.
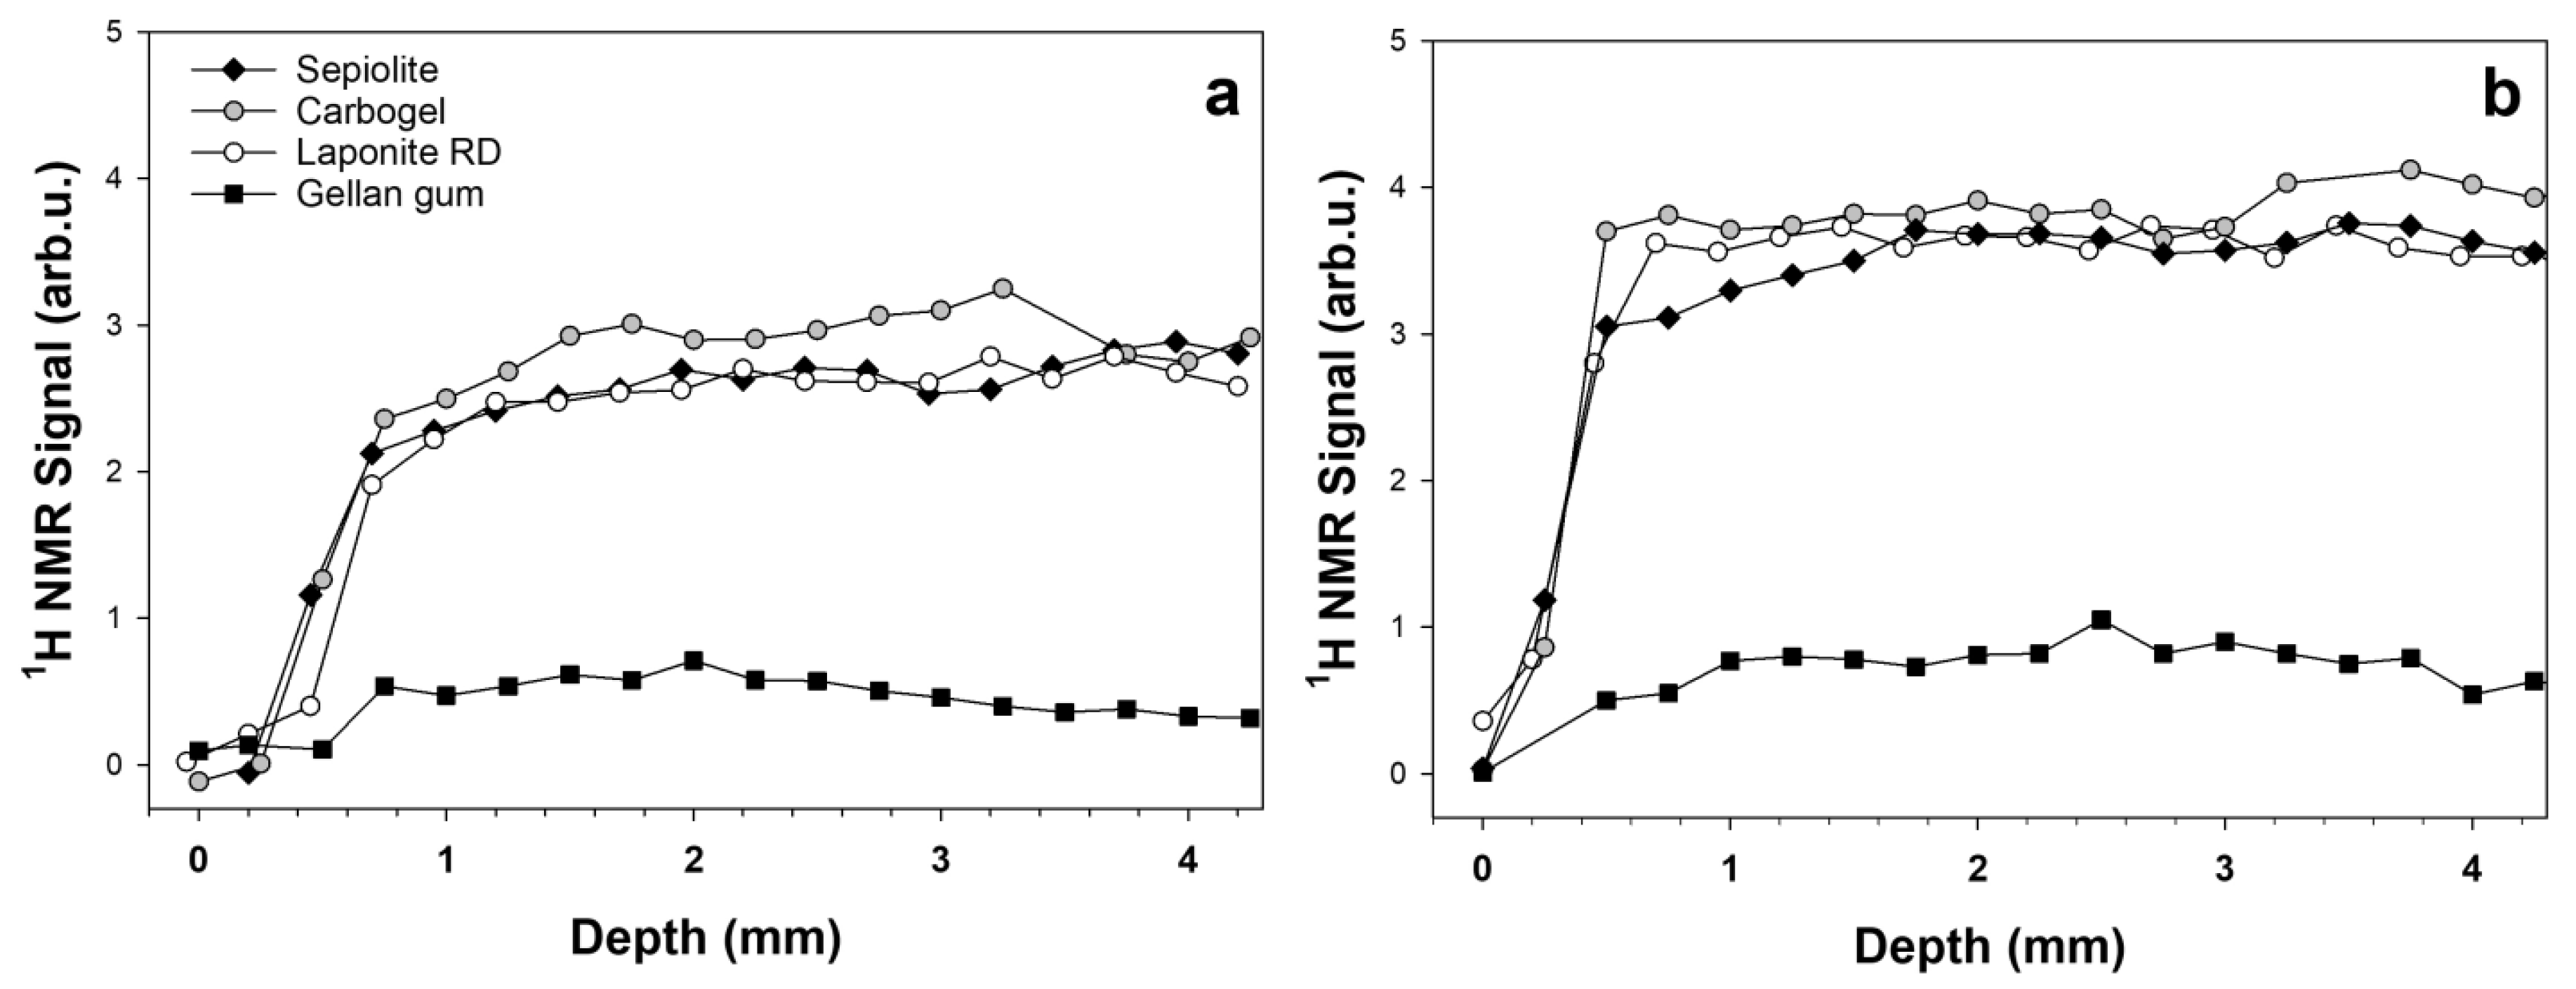
  • Gelling materials, i.e., natural polysaccharide-based gels such as agarose and agaropectine, Gellan gum, Xanthan gum, etc.
Sepiolite is a fine, grey-white naturally occurring clay containing hydrated magnesium trisilicate. It consists of extremely small laths, or needle-shaped particles each with twenty four to twenty seven channels running lengthwise which help to create a system of pores. Pores are responsible for the ability of the material to absorb an amount of solvent suitable to form a thick paste. Some drawbacks must be taken into account. For example the complete removal of particles from an irregular and damaged surface is sometimes difficult, and the impurities present in the clay may cause additional problems. In the case of sepiolite the skin should be protected as it has been shown to act as an irritant.
Basically, synthetic silicates are related to the natural clay mineral [Si8Mg5.34 Li0.66 (Ca, Na)0.66], a tri-octahedral sheet silicate. The free-flowing powder forms a thixotropic gel when mixed with liquid, and stays in place when applied. Furthermore the risk of skin irritation after prolonged contact is low.
Gellan gum is an anionic polysaccharide produced by the bacterium Sphingomonas elodea. At room temperature the gel is rigid due to its macro-reticulate structure [61].
Carbogel is made of a neutralized polyacrylic acid, which allows a gel to be prepared by simply adding water, whose viscosity can be varied at will. For example, an amount of Carbogel between 0.5% and 4% by weight in aqueous solution is sufficient to yield a highly viscous gel. Carbogel has also a high water retention capacity, and water evaporates over a very long time.
Due to the absence of chemical aggressiveness and toxicity, water based cleaning systems are preferred with respect to traditional systems. In recent years, the use of Desulfovibrio vulgaris bacteria confined in hydrogels has become a quoted method to remove sulfates from stone material belonging to cultural heritage. Thanks to their metabolism, sulfate-reducing bacteria D. Vulgaris are able to reduce SO 4 2 ions to H 2 S . Compared with other traditional methods, this procedure results in a more homogeneous removal of the surface deposits and preserves the layers under salt efflorescences and black crusts. In the case of wall paintings this method is used by applying sulfate-reducing bacteria entrapped in hydrogel poultices.
In this study hydrogels combined with sulfate-reducing bacteria formulations were applied on wall painting specimens affected by sulfate efflorescence. After the application of gel formulations, specimens were investigated by single-sided NMR. These measurements allowed detailed information to be obtained on the interaction between water molecules, the gel network, and the porous matrix.
Water transport in Carbogel, Sepiolite, Laponite RD and Gellan gels was investigated by measuring the longitudinal relaxation time (T1), the effective transverse relaxation time (T2eff), and the self-diffusion coefficient (D).
Relaxation times of polymer gels depend on the molecular weight, degree of branching, crosslink density, size of the side groups, and temperature [62]. Relaxation measurements are affected by both rotational and translational molecular motions, whereas diffusion measurements are related only to the translational molecular displacement. T1 and T2 values along with the corresponding populations found in Carbogel, Sepiolite, Laponite RD, and Gellan gels are reported in Table 1.
The very short T1 value measured in sepiolite is likely to be due to the presence of paramagnetic impurities, such as iron, which are present in the natural clay. These impurities should be absent in laponite which is a synthetic clay.
As reported in the literature [63], the transverse relaxation time of a nucleus is sensitive to slow and fast motions, whereas the longitudinal relaxation time is sensitive to fast motions. The observation that T2 was found to be much shorter than T1 indicated that water in gels had a slowed motion due to the presence of the network of the gel. The presence of two transverse relaxation times was ascribed to two proton species, the shortest one, T2A, related to ‘bound’ water, and the longest one, T2B, related to ‘free’ water. Proton nuclei in the ‘bound’ water domain are affected by hydrogen bonding interactions and/or chemical exchange with the gel network.
In order to study the translational motion of water molecules in the gel system, the self-diffusion coefficient was measured. This parameter may give information about molecular dynamics and sample microstructure [64,65].
The self-diffusion coefficients measured in Carbogel, Gellan gum, Sepiolite, and Laponite gels are reported in Table 1. All self-diffusion coefficients were found to be slower than that of bulk water (2.1 × 10⁻⁹ m2/s at room temperature) indicating that the translational motion of water molecules is more hindered in these gels than in bulk water. Specifically, the water self-diffusion coefficient in silicates was found to be slower than that measured in Carbogel and Gellan. This is likely to be due to the restricted diffusion caused by the basic structure of phyllosilicates constituted of interconnected six member rings of SiO44− tetrahedra extending outward in infinite sheets packaged into layer networks which impair free water diffusion.
The mean square displacement r 2 of water molecules with a self-diffusion coefficient D during a diffusion time Δ can be calculated from the relationship:
r 2 = 2 D Δ
In a diffusion time Δ of 10 ms, bulk water molecules should undergo a mean square displacement of about 6.48 μm (diffusion length). During this diffusion time, the translational motion of water molecules in gels was increasingly hindered as the average probability of collision between water molecules and the gel network increased. The mean square displacement slightly decreased to 6.33 μm in Carbogel, and to 6.29 in Gellan gum, whereas a more marked shortening was obtained in Laponite and Sepiolite with a mean square displacement of 6.15 and 5.92 μm, respectively.
1H NMR depth profiles were collected to evaluate the amount of water absorbed by the wall painting specimens and the depth of penetration of water after the application of the cleaning system. The amplitude of the 1H depth profile is proportional to the amount of water absorbed by the specimen as a function of the depth scanned. Therefore, each experimental point represents the amount of water at the corresponding depth of measurement. The trend shown by depth profiles depended on the capability of the cleaning system to release water into the specimen. Figure 1a reports the depth profiles collected after applying Carbogel, Sepiolite, Laponite, and Gellan gum/bacteria cleaning systems for 1 h to wall painting specimens. Carbogel released the largest amount of water. Sepiolite and Laponite RD exhibited a very similar trend. The Gellan gum/bacteria system exhibited the lowest water release capability. The same trend was found after a 4-h application, see Figure 1b.
To summarize, by single-sided 1H NMR we investigated, in a fully non-invasive and non-destructive way, different types of gel formulations to be used as cleaning systems for wall painting. Transverse relaxation times measured in gel formulations indicated the presence of water in two environments. Bound water exhibiting the shortest relaxation time was involved in hydrogen bonding interactions and/or proton exchange with gel macromolecules, whereas the water molecules with the longest relaxation time were free to move through the network, although self-diffusion measurements demonstrated that their translational motion was increasingly hindered as the average probability of collisions with the gel network increased. The release and diffusion of water at the gel-specimen interface were also investigated by 1H NMR depth profiles. The profiles indicated that the Gellan gum/bacteria system is the one showing the lowest amount of water release. All systems exhibited a penetration depth of the released water deeper than 4 mm, see Figure 1.
Water absorption, distribution and penetration in the support depend not only on the physical-chemical and rheological properties of the gel but also on the properties of the support to which the gel is applied. This study is part of a more extensive research effort aimed at obtaining an analytical protocol for establishing in situ the performance of cleaning systems.
1H NMR depth profiles allow some questions to be answered such as the thickness of an unwanted organic layer to be removed from the surface of a wall painting, its distribution in the wall painting, and the presence of residues on the wall painting surface after performing a cleaning treatment.
For example, shellac is a natural organic resin of animal origin that was widely used in the past as a varnish for wall paintings. When shellac ages, it becomes insoluble, changes color, and becomes very hard to remove. Many old paintings became yellowish due to the shellac coating.
Single-sided NMR was applied before and after performing a cleaning procedure to remove a layer of degraded shellac [55]. Figure 2 shows the 1H depth profiles collected before and after the cleaning. Basically, the profiles exhibited two regions. At depths deeper than about 0.6 mm the amplitude of the profile was due to the NMR signal of the moisture in the porous structure. Between 0.2 and 0.6 mm, the profile collected before the cleaning procedure showed a rather intense signal of the hydrogen atoms of shellac, this region was about 300 μm thick. After the cleaning, due to a decrease in the hydrogen level of shellac, the intensity of the profile was found to be definitely weaker than the profile before cleaning, and the thickness of the degraded organic layer reduced to about 100 μm. Actually, the intensity of the profiles between 0.2 and 0.6 mm indicated the efficiency of the cleaning treatment, the more effective the treatment, the lower the level of hydrogens encoded by the profile after the cleaning.
This technique may be applied in situ in a non-destructive and non-invasive way to evaluate the efficiency of cleaning methods aimed at removing degraded organic layers from artworks.

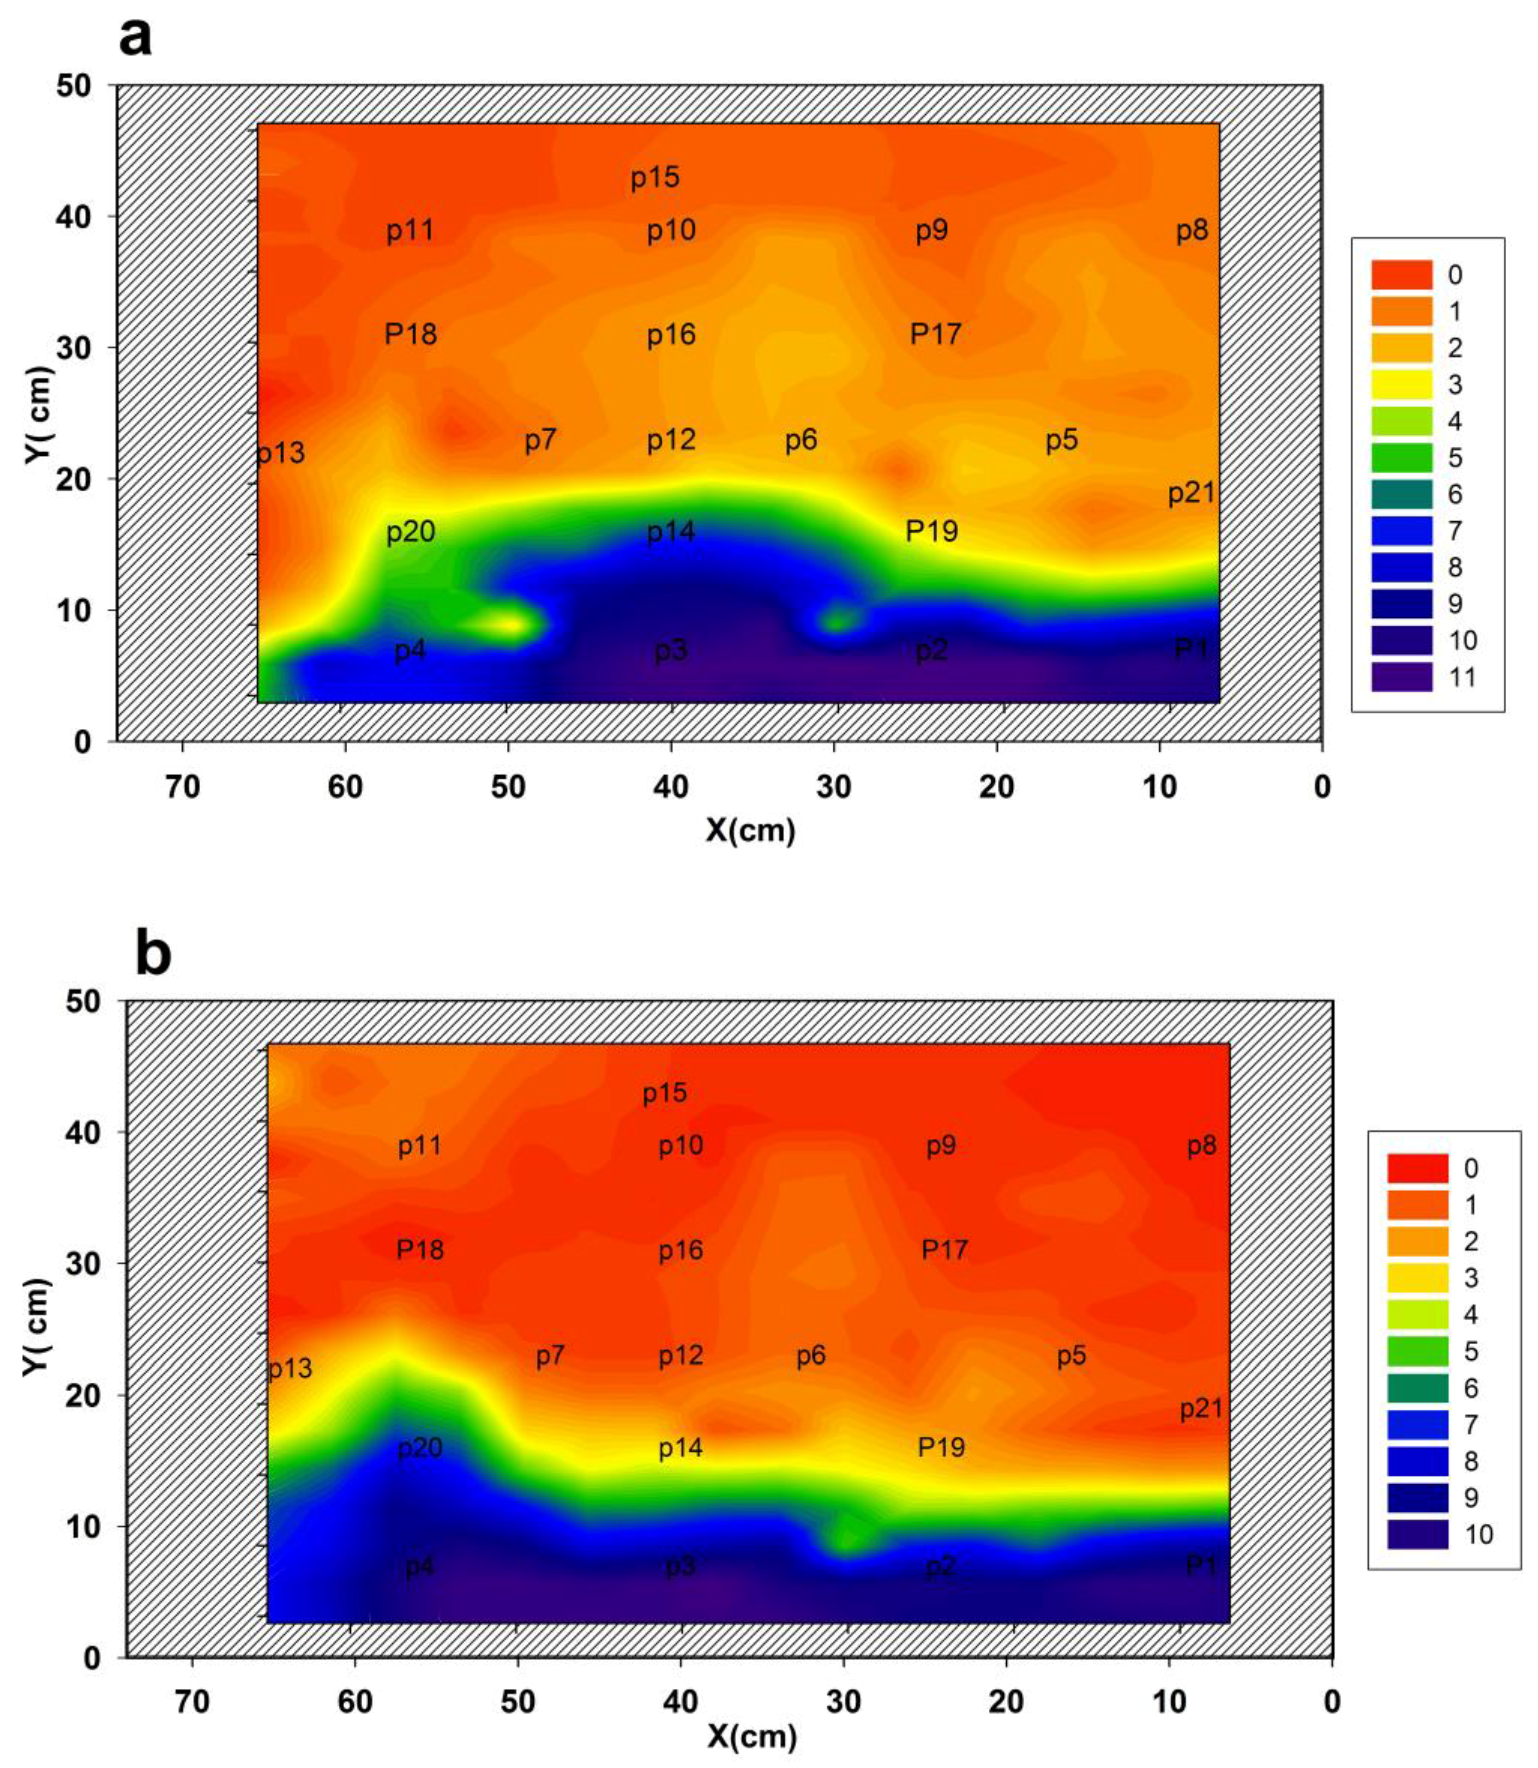
2.2. Detection of Moisture in Historical Walls and Wall Paintings

Water plays a fundamental role in the degradation of porous materials such as historical walls, wall paintings, stones, mortar, concrete etc. [66,67]. In many cases water may affect the material causing fractures, stress, and expansion. Condensation/evaporation cycles facilitate the migration of solubilized salts which may crystallize on the surface of the porous material causing efflorescence, and sometimes crumbling and fretting of the surface. Capillary rise of water and collected rainfall are among the main causes of the presence of dampness. Wetting/drying cycles cause solubilization and recrystallization of salts inside the porous structure inducing the breaking down of the structure itself. Chemical reactions may occur between pollutants deposited on the surface and the porous material. The presence of an anomalous amount of moisture may also cause the formation of crusts on monuments. Specifically, runoff is associated with the presence of white areas due to reprecipitated crystals of calcite formed when water evaporates. Condensation is associated with the presence of grey regions where the porous material has been previously covered by a layer of dust and particles [66]. In general, many degradation processes such as leaching, transport, accumulation, solute precipitation and fractionation, as well as biological colonization are caused by the moisture content of the masonry. Moreover the moisture content is also affected by seasonal variation and environmental conditions.
Despite its importance, the quantitative detection of water distribution in precious artefacts such as historical walls or wall paintings, is difficult to achieve. Methods used to obtain information on the presence of moisture are gravimetric tests, IR thermography (IRT), and electrical conductivity. However these methods show some drawbacks. In fact gravimetric tests require sampling, IRT does not allow a quantitative evaluation of moisture, and electrical conductivity is affected by the presence of salts.
Portable NMR sensors have permitted the mapping of water distribution in historical walls and wall paintings [23,24]. Figure 3 shows a portable NMR sensor detecting moisture in an ancient wall painting affected by capillary rise of water from the ground.
Water distribution was quantitatively determined in two regions A and B of a tuff wall affected by capillary rise of water from the ground. Measurements were carried out choosing a matrix of 21 points in region A and 21 points in region B. Each experimental point covered an area of 2 × 5 cm2 corresponding to the area of the probehead, see Figure 4a,b. Experimental data were processed to obtain a contour plot [68,69]. As previously reported [23], a contour plot is a graphical way of obtaining a 2D representation of a 3D surface, where x and y are the coordinates of a strip of the region of the tuff wall, and z is the integral of the NMR signal. In the contour plots obtained the difference in the moisture level is shown as a gradient of color, red corresponds to the lowest water content, while dark blue corresponds to the highest water content. In both maps the distribution of the moisture gave a clear image of the front of the rising damp. According to a suitable calibration procedure [23], in map A the maximum value of the intensity of the NMR signal corresponded to 11% of the moisture content, whereas in map B it corresponded to 10%. Because in the fully saturated water specimens used for calibration the moisture content was found to be 25%, these results indicated a rather high level of moisture in the regions of the tuff wall affected by the capillary rise.
In region A transverse relaxation time measurements were performed as a function of the height of the wall. After applying an inverse Laplace transformation to the magnetization decays measured with the Carr Purcell Meiboom Gill CPMG sequence, the distributions of transverse relaxation times were obtained, see Figure 5. In this representation, peaks represent the most probable T2 values, whereas peak areas represent the population of each component. The distributions reported in Figure 5 indicate the presence of water confined in pores with various sizes. In fact relaxation times of a fluid confined in a porous structure are strictly related to its geometry, as water confined in small pores relaxes faster than water confined in large pores [70]. Therefore at the lowest height of 7 cm (P3), where the highest amount of water was measured (about 11%), up to four peaks are observed indicating the heterogeneous nature of tuff with water confined in pores having a different size. At a height of 16 cm (P14) water of type 4 confined in the largest pores disappeared and only three types of water were observed. At a height of 23 cm (P12) the amount of water of type 3 decreased, and at 31 cm (P16) it decreased further. Water of type 3 fully disappeared at a height of 39 cm (P10). Basically, by increasing the height of measurement, the decrease of the total amount of water indicated by the moisture distribution map reported in Figure 4a was accompanied by a progressive decrease of the amount of water confined in large pores. Values of transverse relaxation times and the corresponding populations are reported in Table 2.
To summarize, using single-sided NMR a detailed map of the moisture distribution in two regions of the tuff wall affected by the capillary rise of water from the ground, was obtained. A proper calibration of the intensity of the NMR signal allowed a quantitative determination of the moisture level. Measurement of relaxation times evidenced the presence of water confined in pores of various sizes.

2.3. Protective and Consolidating Treatment on Lapideous Material Studied by Single-Sided NMR

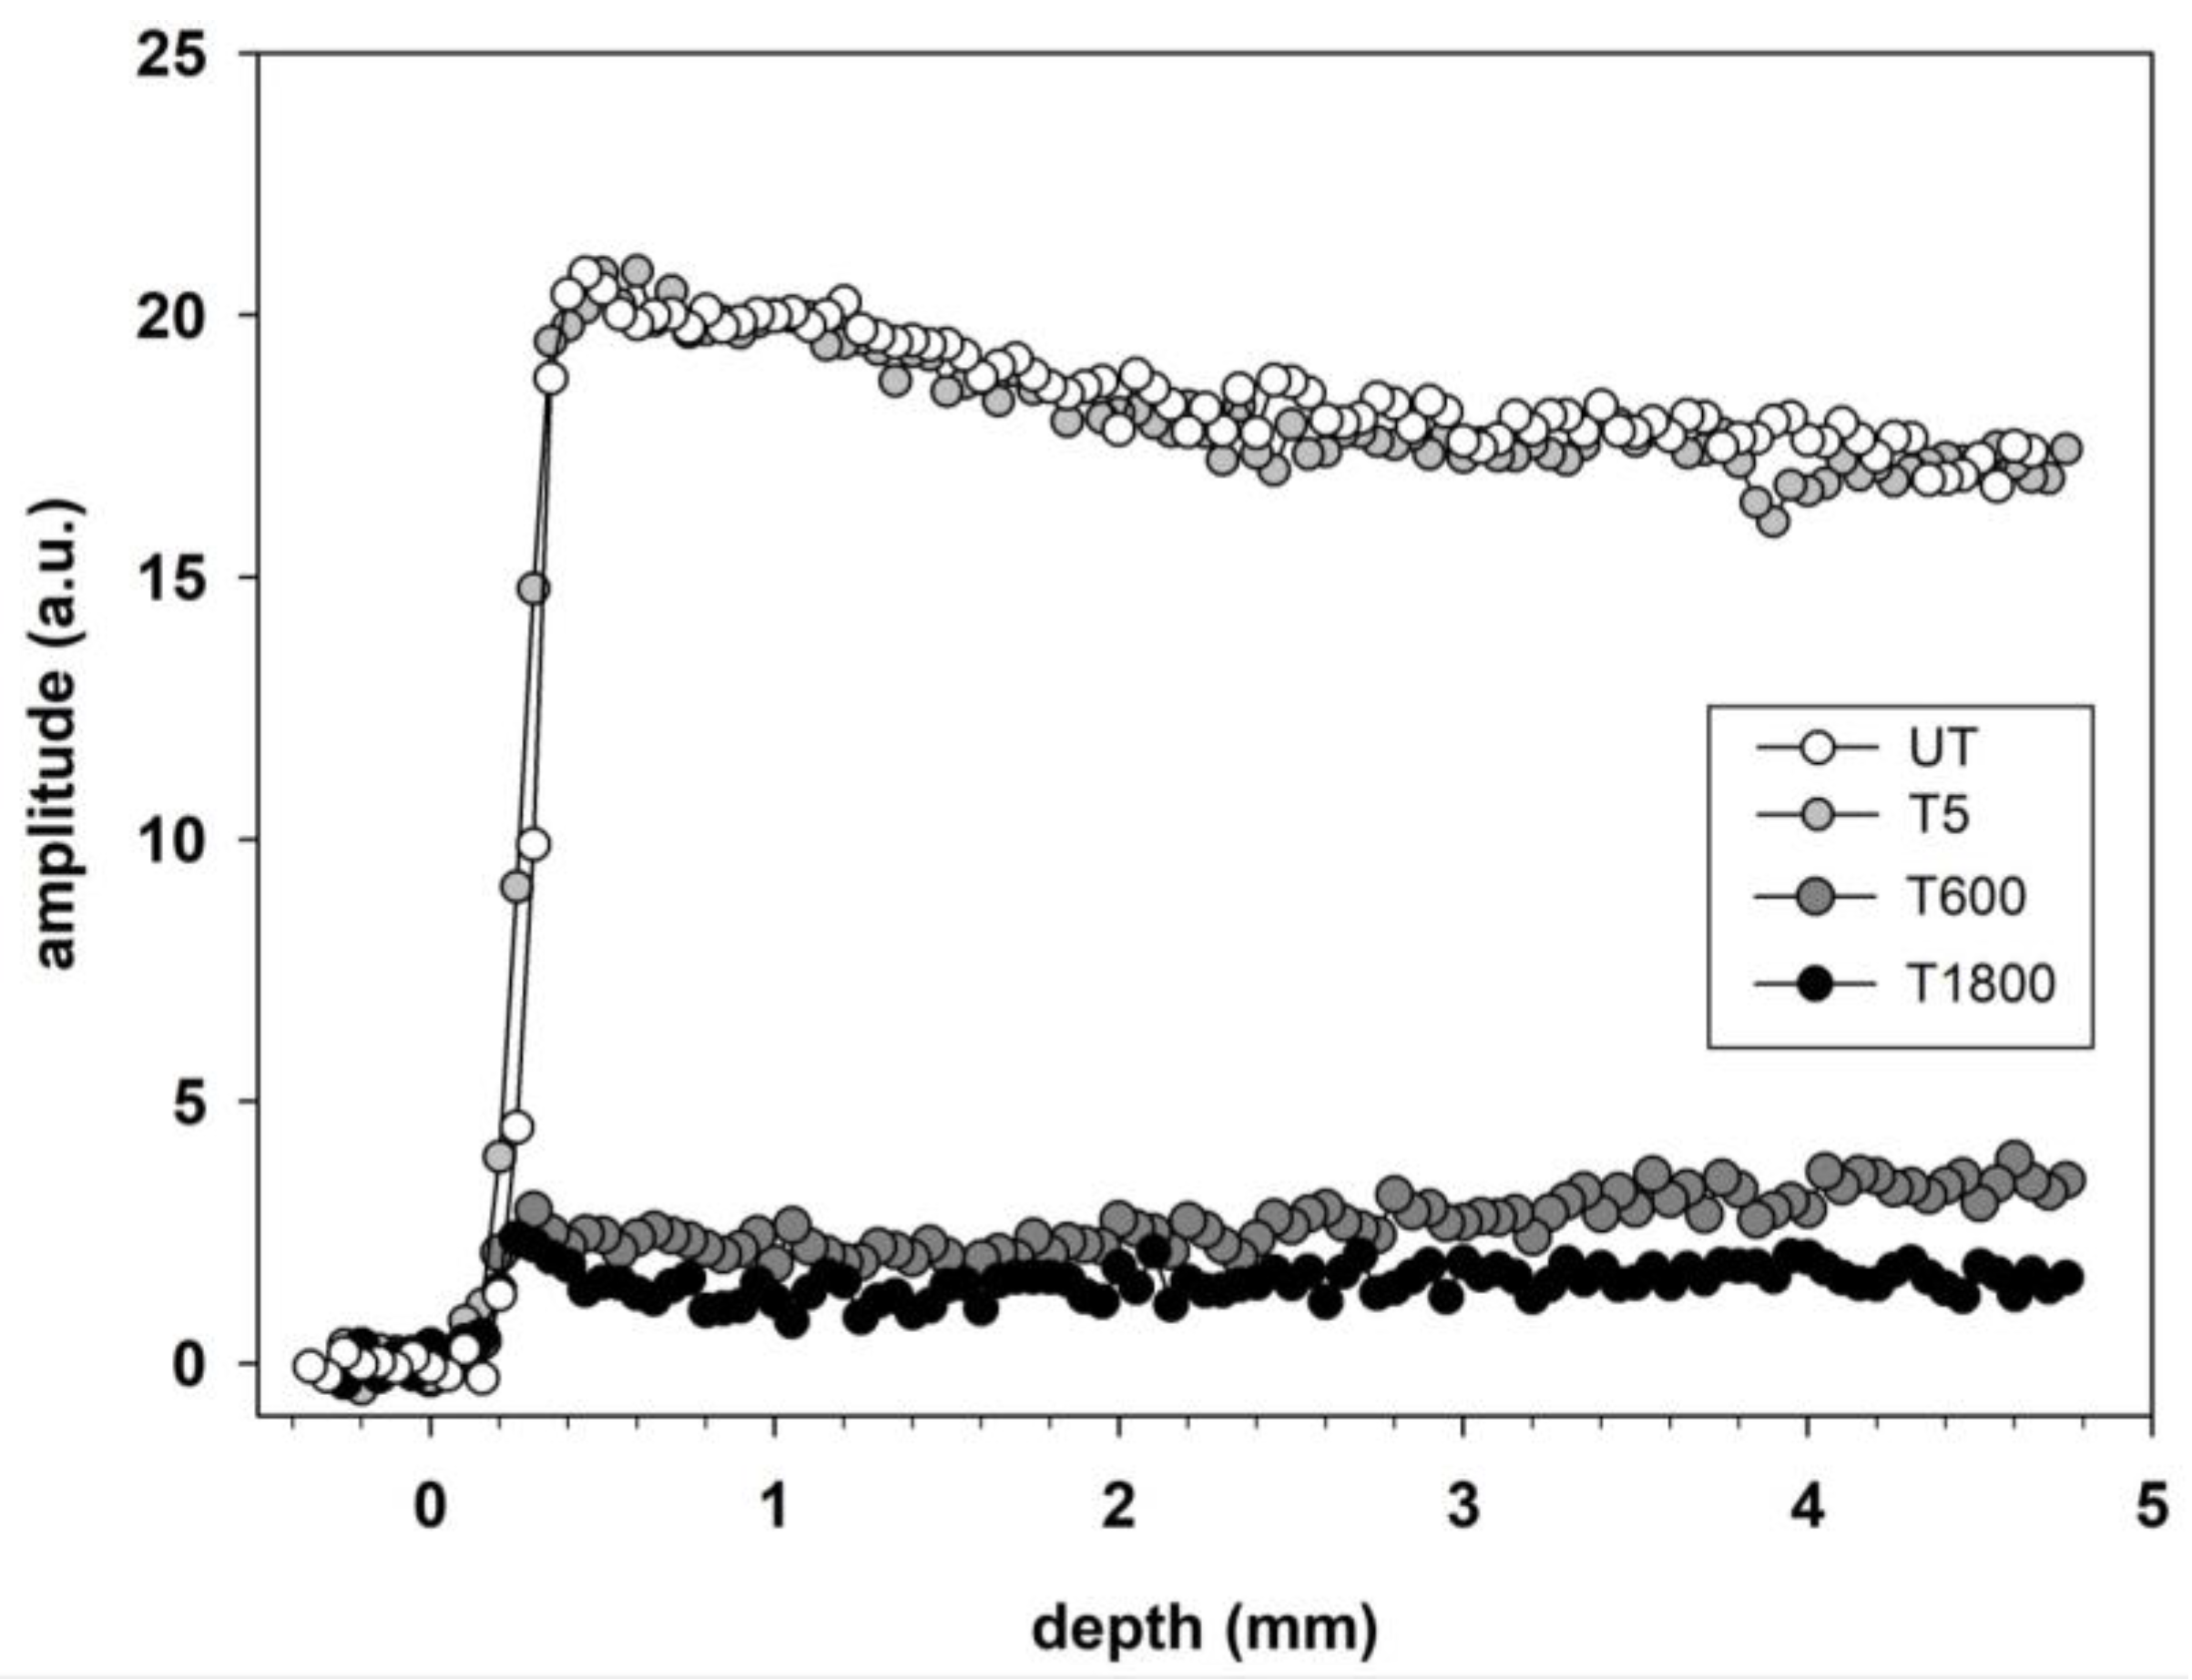
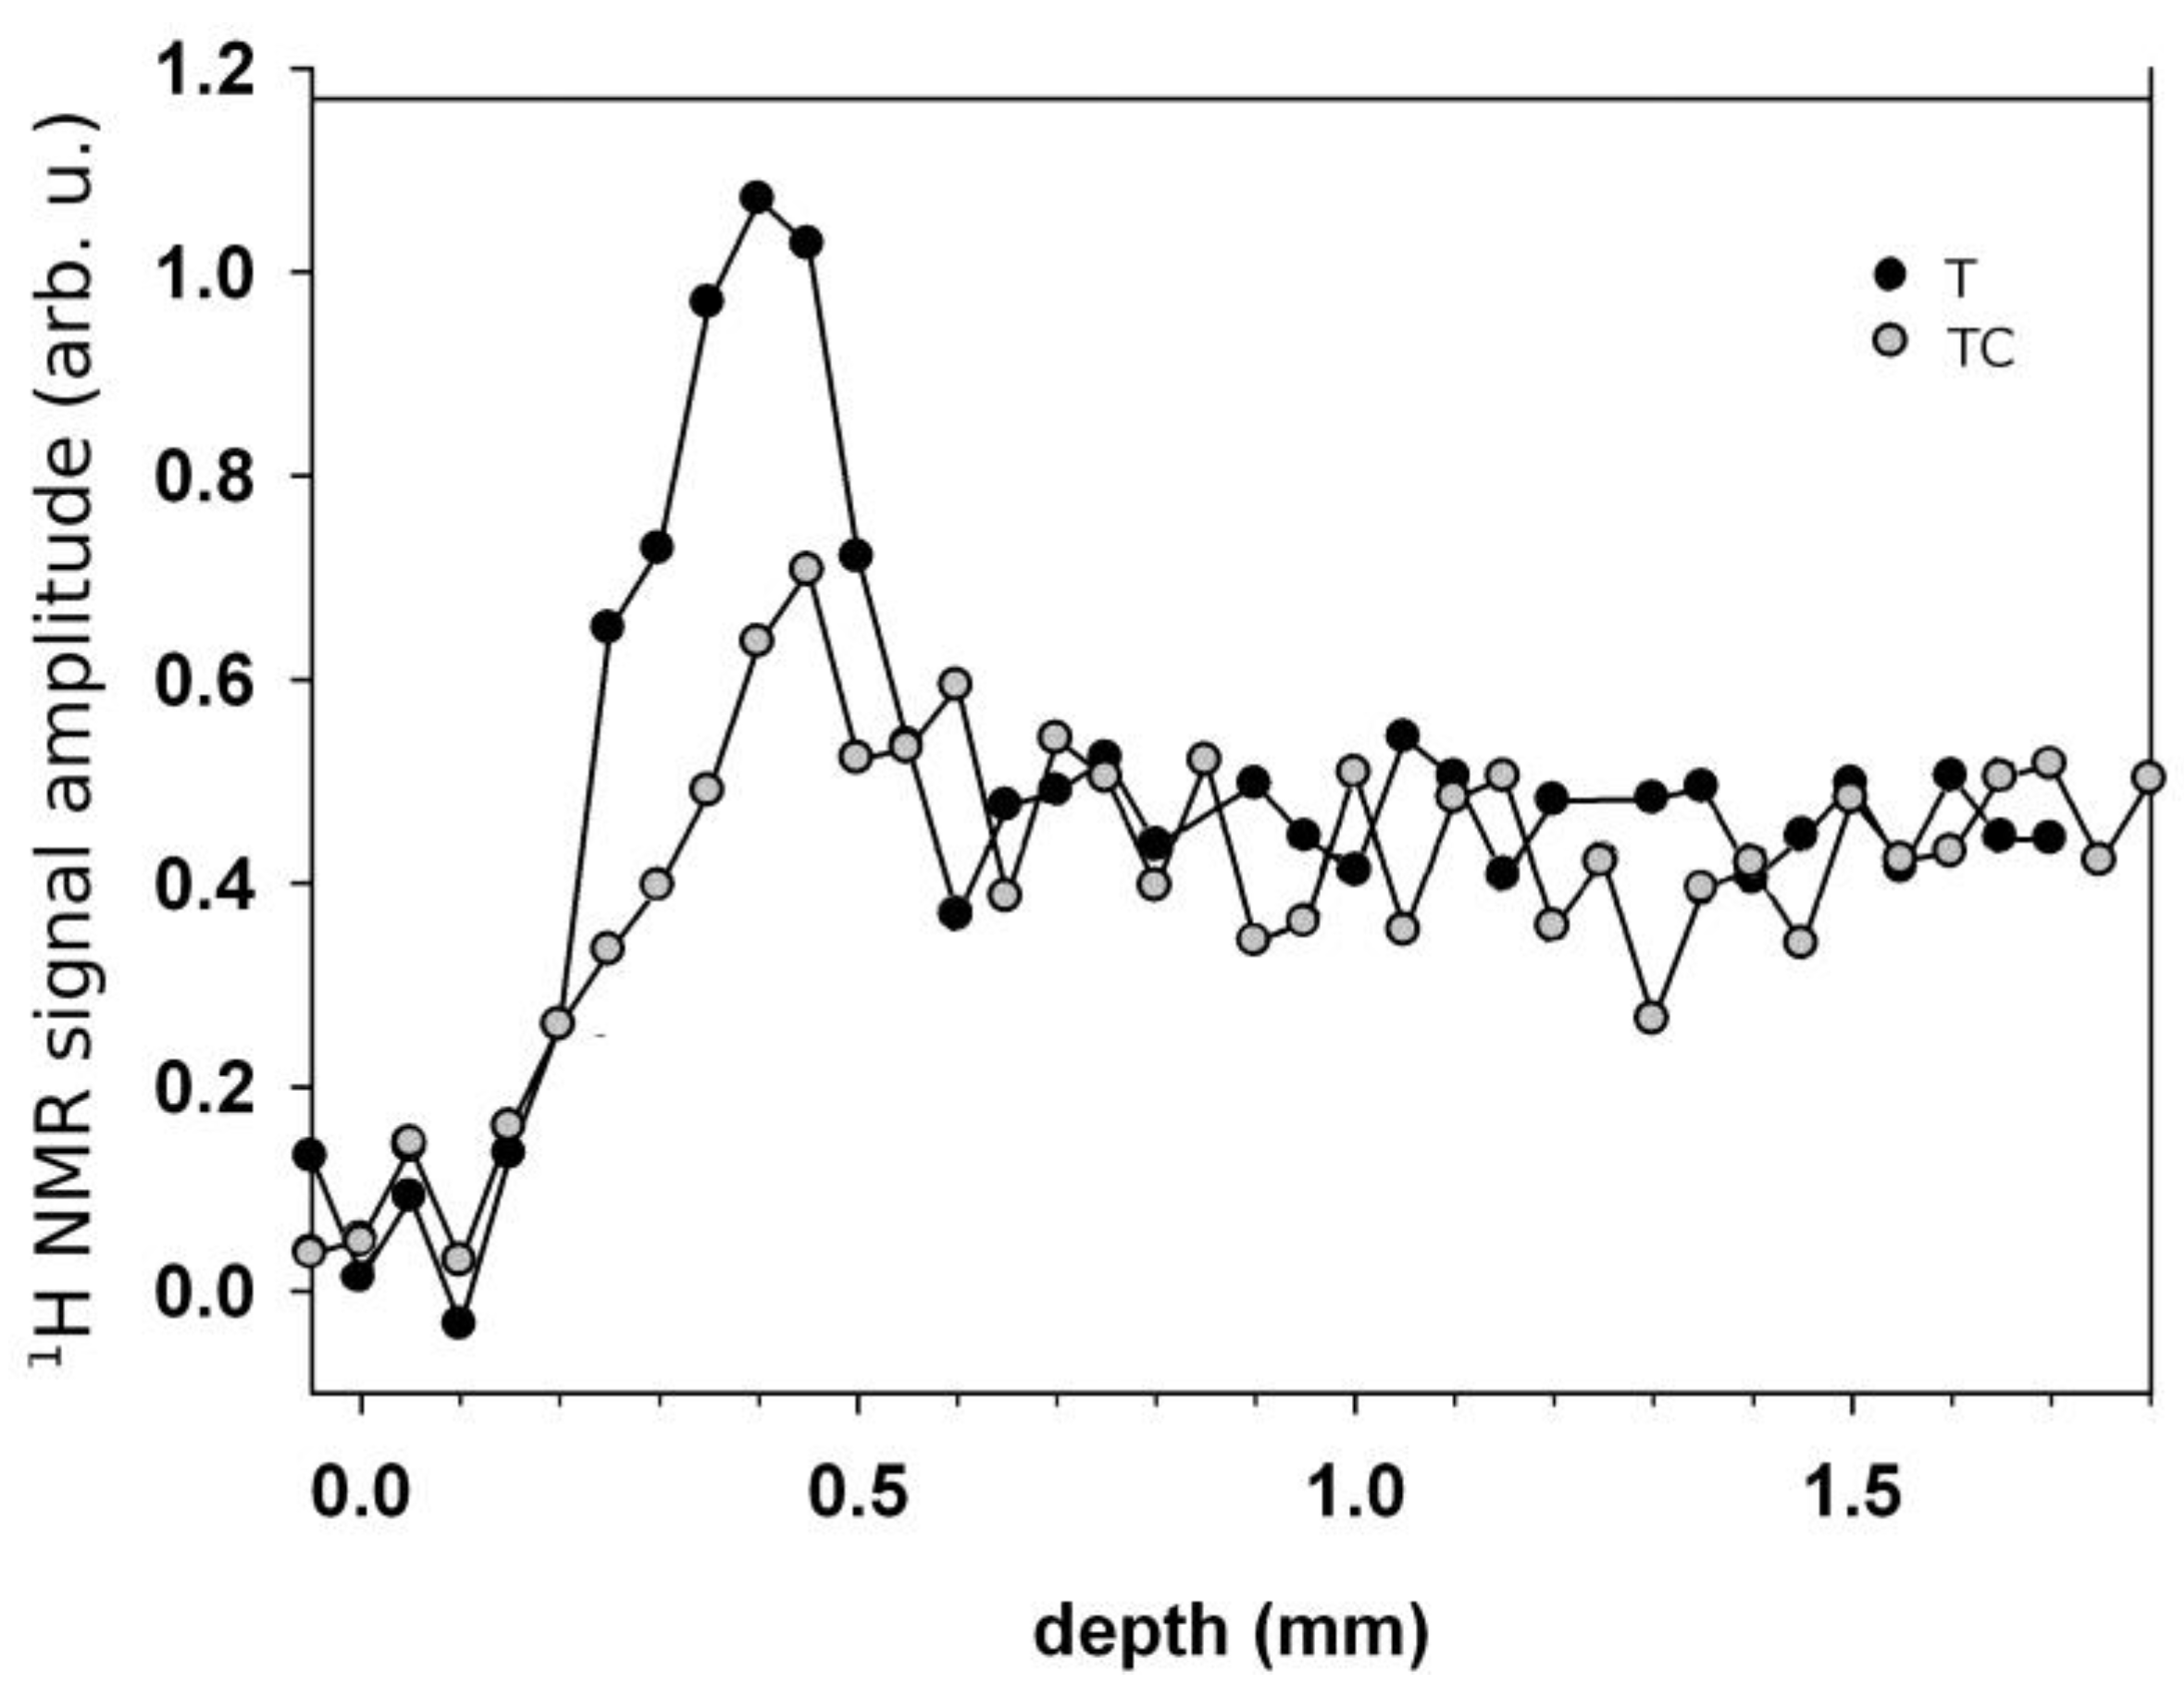
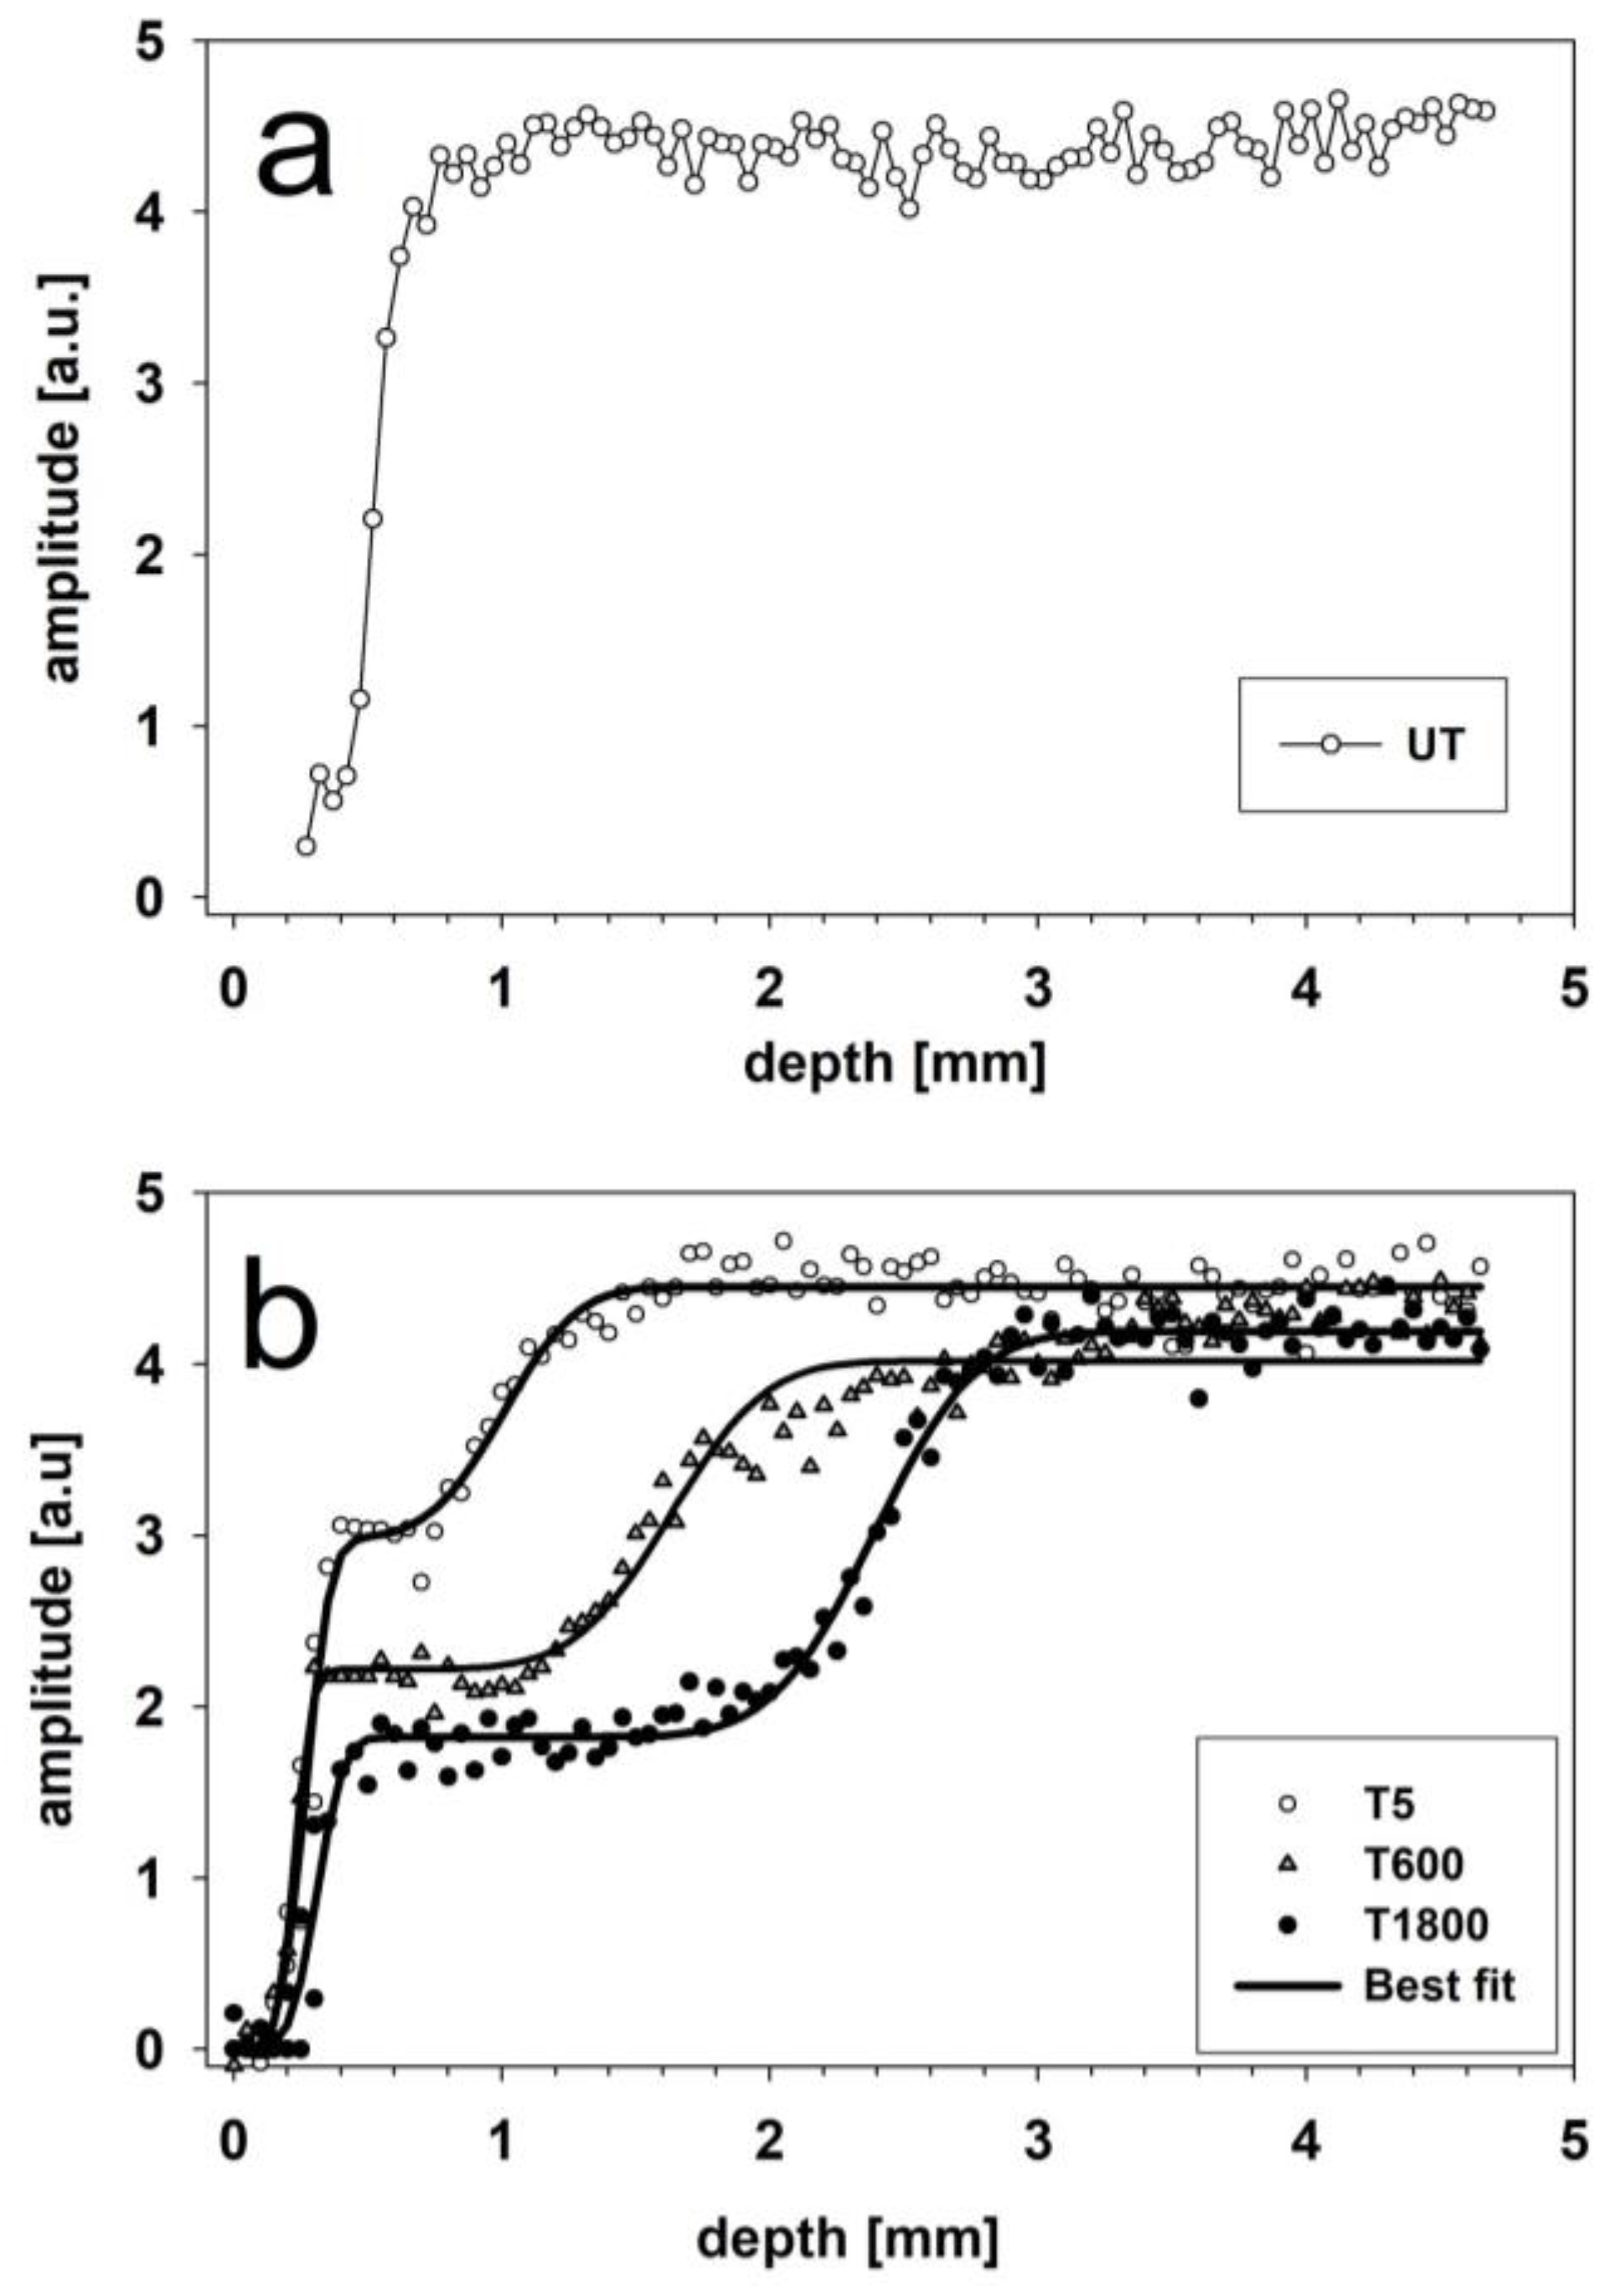
2.3.1. Sandstone Specimens Treated with Hydrophobic Treatments

As previously mentioned, water plays a fundamental role in the degradation of porous stones. A protective treatment is carried out to prevent the penetration of water and decay agents in the porous structure and, therefore, to delay degradation processes [66,67]. A suitable protective treatment should also permit vapor leakage and avoid alteration in the optical properties of the treated stone.
The choice of the treatment and its performances depend on many chemico-physical parameters such as the porosity and permeability of the material. Furthermore, information about the penetration depth of the treatment and the suitable time of application to the selected type of stone is important for choosing and optimizing the treatment.
Another important requirement in stone conservation is that the compound absorbed in the stone should not accumulate in some regions into the stone. In fact, in this case, chemical and physical inhomogeneity may occur between the impregnated layers of the stone and the layers underneath. These layers might differently respond to changes in thermo-hygrometric conditions causing mechanical damage to the porous structure.
Figure 6a reports the depth profile collected on water-saturated untreated sandstone (UT), whereas Figure 6b reports depth profiles collected on water-saturated sandstone specimens treated with dimethylsiloxane (DMS) for 5 (T5), 600 (T600), and 1800 s (T1800). The amplitude of these profiles depends on the level of absorbed water. Hence, by comparing the amplitude of the depth profiles of untreated and treated specimens, information on the hydrophobic action of the treatment is obtained.
Figure 6b shows that in treated specimens the amplitude of profiles was reduced as a function of the time of application of the hydrophobic treatment. Specifically, treatments for 600 and 1800 s halved the amount of absorbed water with respect to the amount absorbed in the untreated sandstone. At a depth deeper than 3 mm, the amplitude of profiles of treated specimens was well comparable with that of the untreated specimen, indicating that the hydrophobic action was no longer effective. The profiles were fit to Equation (4) with k = 2, see the solid lines through the experimental points.
Table 3 reports the parameters obtained from the best-fit. Note that x1 and b1 values, which encoded the fast rising initial part of profiles, were affected by surface effects, and, therefore, were not further considered in the following discussion. It is worth noting that the second inflection point x2 observed in the profiles of all treated specimens depended on the duration of the hydrophobic treatment, see Table 3. However, at depths greater than x2, the amplitude of profiles increased to reach the values measured in the untreated specimen, indicating that x2 was the deepest depth at which the treatment was still capable of exerting a hydrophobic action. Table 3 also reports slopes at inflection points. Any change in slope in the profile indicates a variation of the amount of the absorbed product inside the stone, and, as a consequence, it is possible to evaluate the extent of inhomogeneity in the treated stone from the value of the slope at inflection points. For example, according to data reported in Table 3, the inhomogeneity is more pronounced in the specimen treated for 1800 s (b2 = 2.703) than in that treated for 600 s (b2 = 2.174). As a role, the greatest | b k | the more pronounced the inhomogeneity.
As is well-known, the relaxation times of fluids confined in porous media are strictly related to the geometry of the structure [70]. Whereas differences in longitudinal relaxation times (T1) may be not sufficient to clearly identify water in different compartments, differences in transverse relaxation times (T2) are usually more pronounced. Therefore transverse relaxation times permit the detection of changes of the open porosity which may occur after performing a treatment on a porous stone.
With the aim of investigating differences in the open porosity of sandstone before and after treatments, we measured transverse relaxation times. All CPMG decays exhibited a multi-exponential behavior indicating the presence of water distributed in pores with various sizes. Transverse relaxation times and the corresponding spin populations obtained fitting the decays to Equation (2), are reported in Table 4.
All CPMG decays measured at a depth of 5 mm overlapped, see Figure 7, indicating that, at this depth, the hydrophobic treatment was no longer effective. This result agrees well with the result obtained from depth profiles reported in Figure 6b.
For example, the effect of the hydrophobic treatment may be evidenced by comparing the distribution of transverse relaxation times measured at depths of 1 and 4 mm on the sandstone specimen treated for 1800 s, see Figure 8. In fact, the distribution at a depth of 4 mm showed three T2 peaks centered at about 20, 6.5, and 1.7 ms corresponding to water in large, medium, and small pores, with a relative spin population of 6%, 42%, and 52%, respectively. Instead, the distribution at a depth of 1 mm showed only two peaks centered at about 7 and 1.8 ms with spin population of 15% and 85%, indicating that the largest amount of water was confined in small pores, whereas the peak corresponding to water confined in large pores was lacking. Again this result was in accordance with the result obtained from depth profiles reported in Figure 6b.

2.3.2. An Unsuitable Consolidative Treatment on Calcarenite Studied by Single-Sided NMR

Figure 9 reports depth profiles collected on water-saturated calcarenite specimens untreated and consolidated with a solution of tetraethoxysilane (TEOS) in ethyl alcohol for 5 s (T5), 600 s (T600), and 1800 s (T1800). The amplitude of the profile of the specimen treated for 5 s overlapped with that of the untreated specimen indicating that the treatment for 5 s did not show any consolidative action. On the contrary, profiles of specimens treated for 600 and 1800 s clearly exhibited a very low amplitude with respect to the amplitude measured in the untreated specimen, indicating that water absorption was impaired by the treatment.
The amount of water in untreated calcarenite and in calcarenite treated for 600 s was obtained by numerical integration of the corresponding profiles applying the Newton–Cotes quadrature rule, see Figure 9. The data obtained indicated that the amount of water absorbed by consolidated calcarenite was reduced by about 80% with respect to the amount of water absorbed by untreated calcarenite. Because of the absence of water repellency of the TEOS treatment, the reduction of the amplitude of the profiles may be ascribed either to the pores coating that strongly reduced the pores volume available to water, or to the presence of a film formed on the surface of the specimens which hindered water penetration inside the stone. In the former case the consolidative treatment would have obstructed many pores deeply upsetting the porosity of the treated specimen along the full thickness. In the latter case the presence of a TEOS film would have strongly impaired the correct exchange of moisture between the porous structure and the environment. Both cases should be avoided when performing a consolidative treatment. In fact a suitable consolidative treatment should not markedly affect the water vapor permeability, assuring the correct stone breathing [71].
The effect of the consolidating treatment can be also rationalized by measuring T2 values and the relative populations. As an example Table 5 reports the values measured at different depths in water-saturated untreated calcarenite and calcarenite, treated for 600 s. Figure 10 reports the corresponding transverse relaxation time distributions. Peaks of the distributions indicate the presence of water in pores with a different size in the analyzed sandstone. In untreated calcarenite the major amount of water was confined in large pores, with a percentage between 70% and 90% of the total amount of water, whereas in the treated calcarenite, the amount of water confined in large pores was strongly reduced. This effect is observed at any depth measured, namely 250, 800, 700, and 1000 μm, see Figure 10. To summarize, after the treatment the total amount of absorbed water obtained by integrating the profiles was reduced from 100% to 20%, and water was mostly distributed in small pores. It is evident that the treatment with the TEOS solution not only drastically reduced the amount of water absorbed by the specimen, but also made large pores almost completely unavailable to water along the full thickness of the treated specimen.

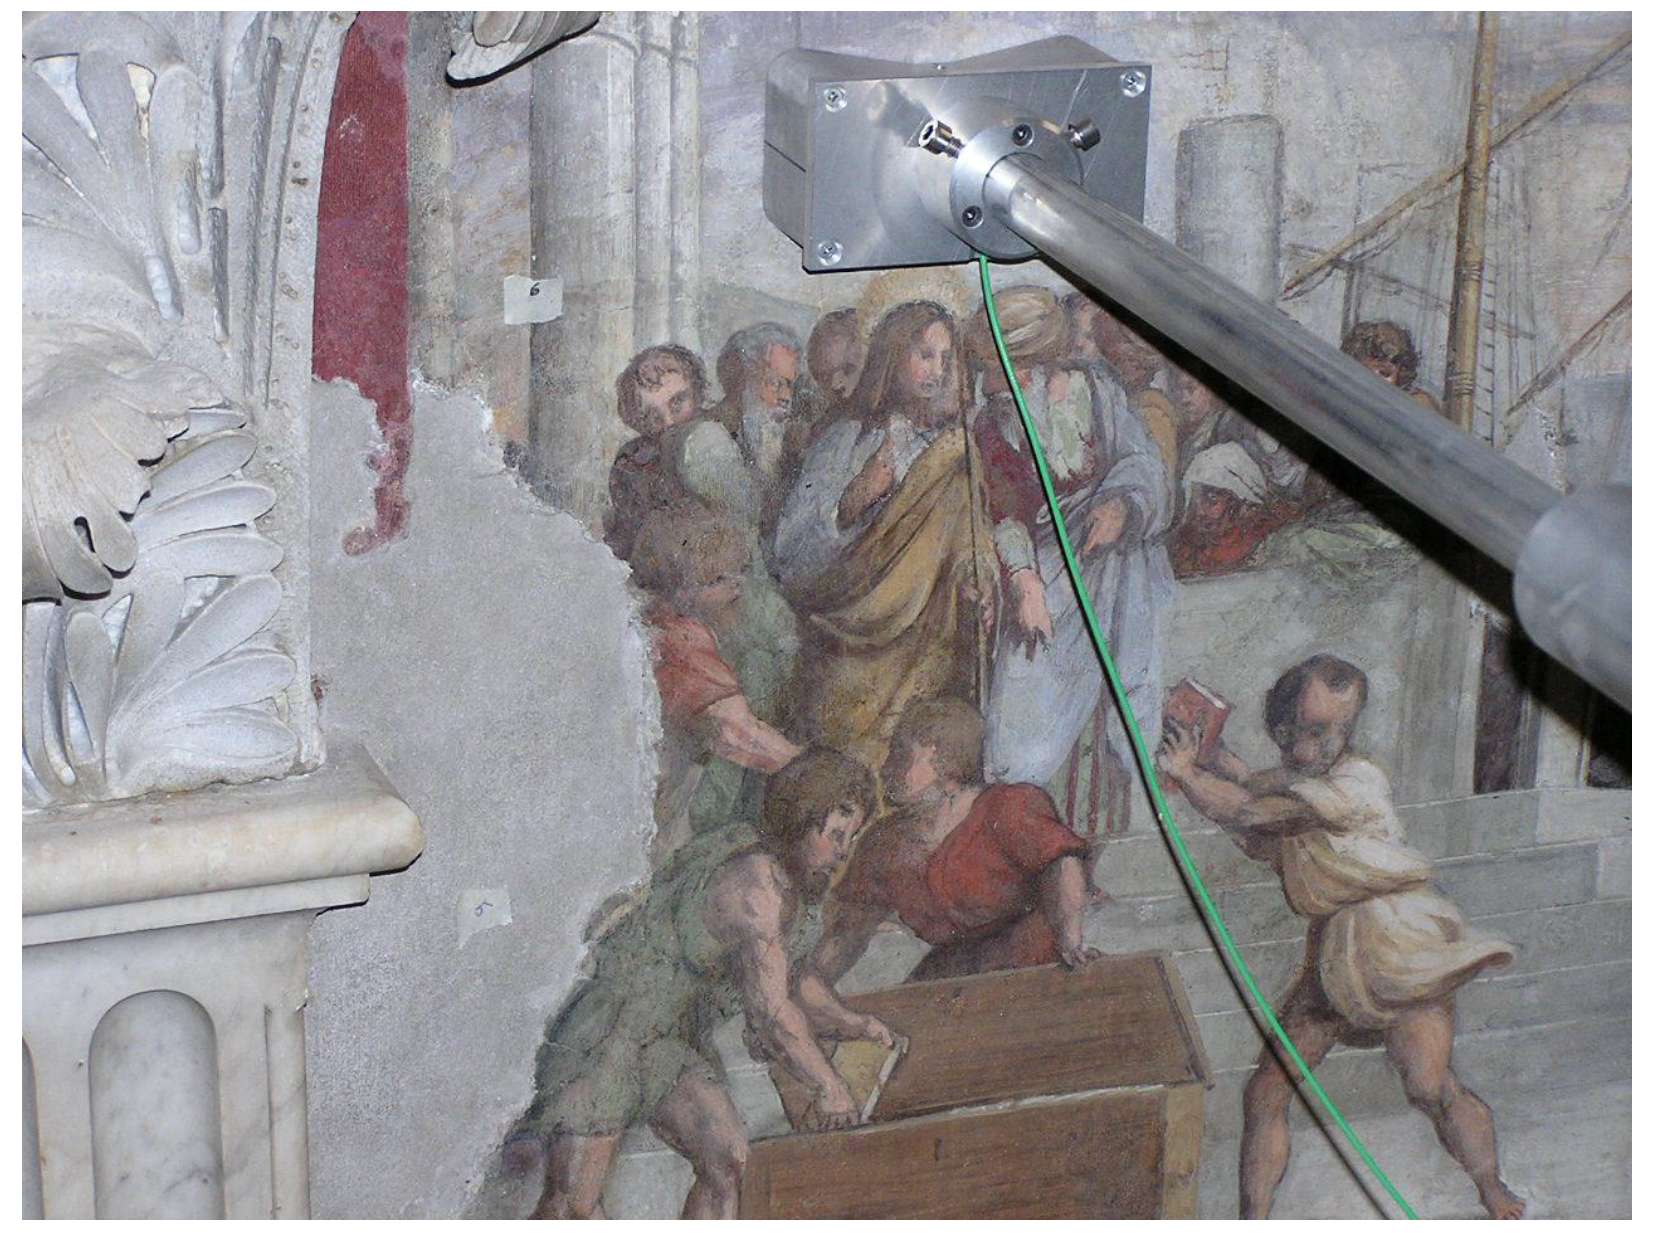
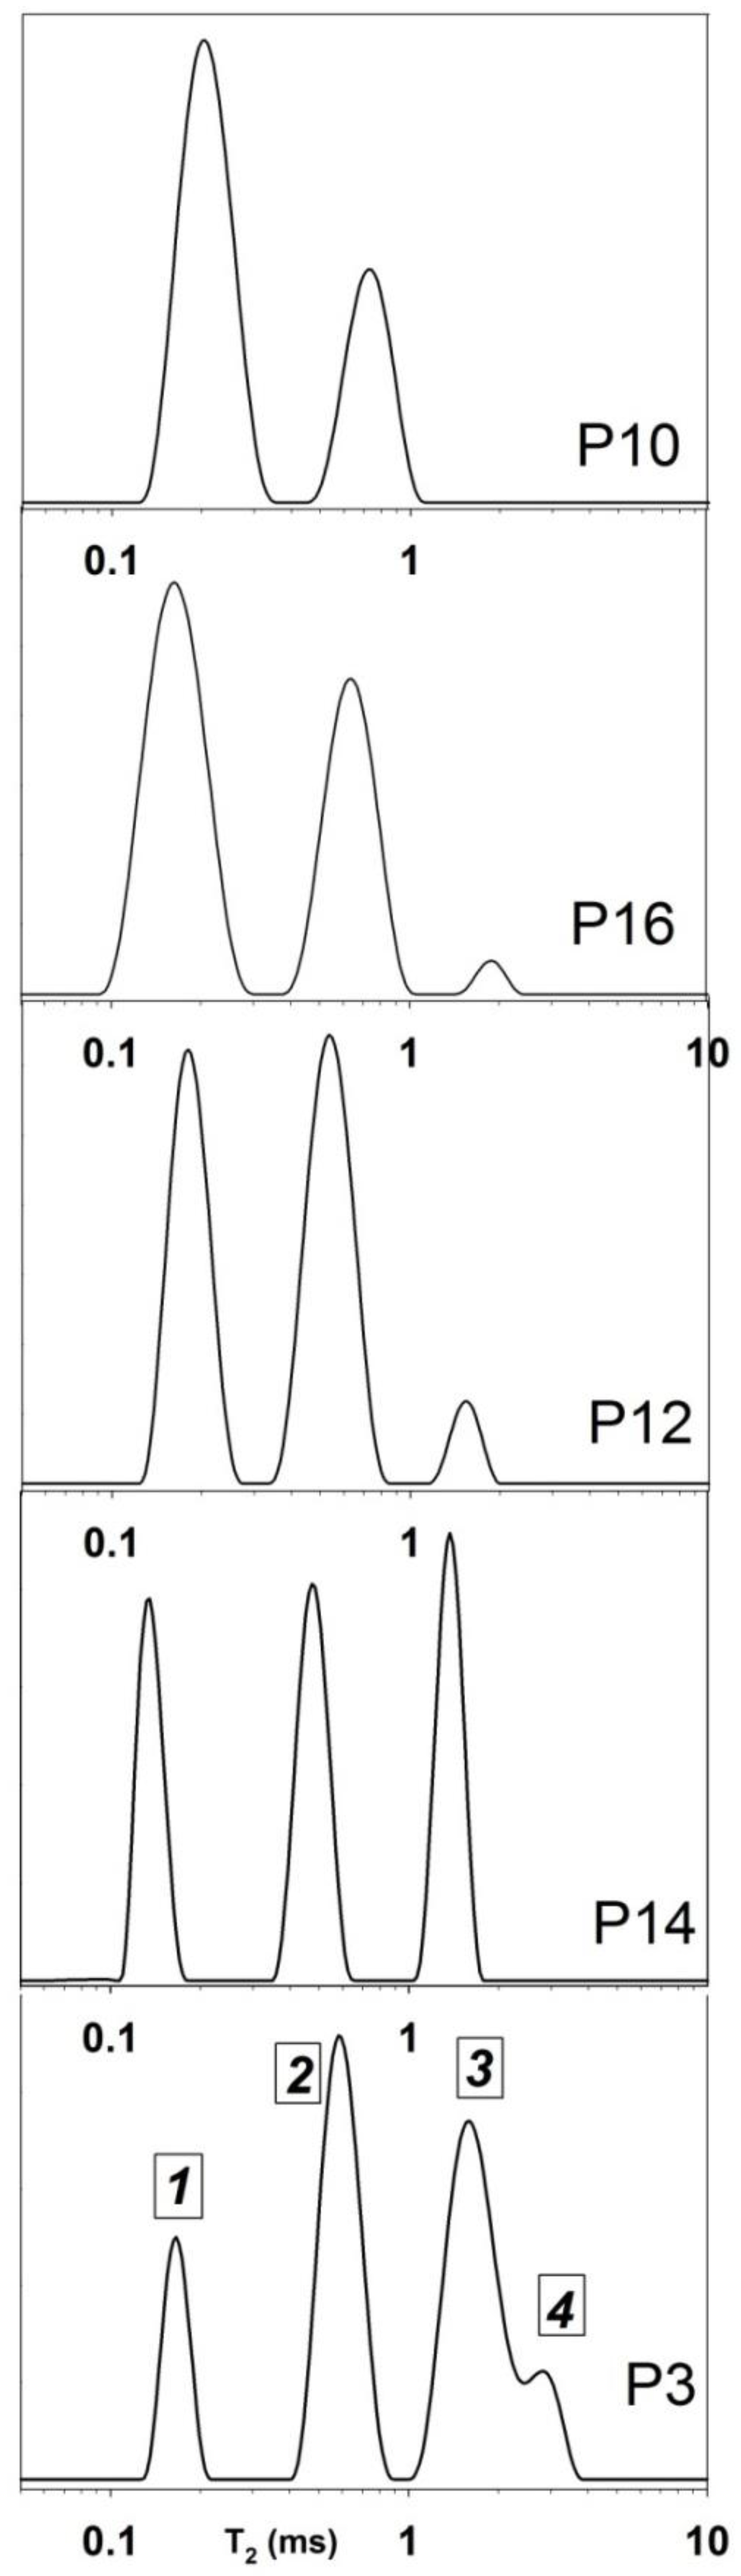
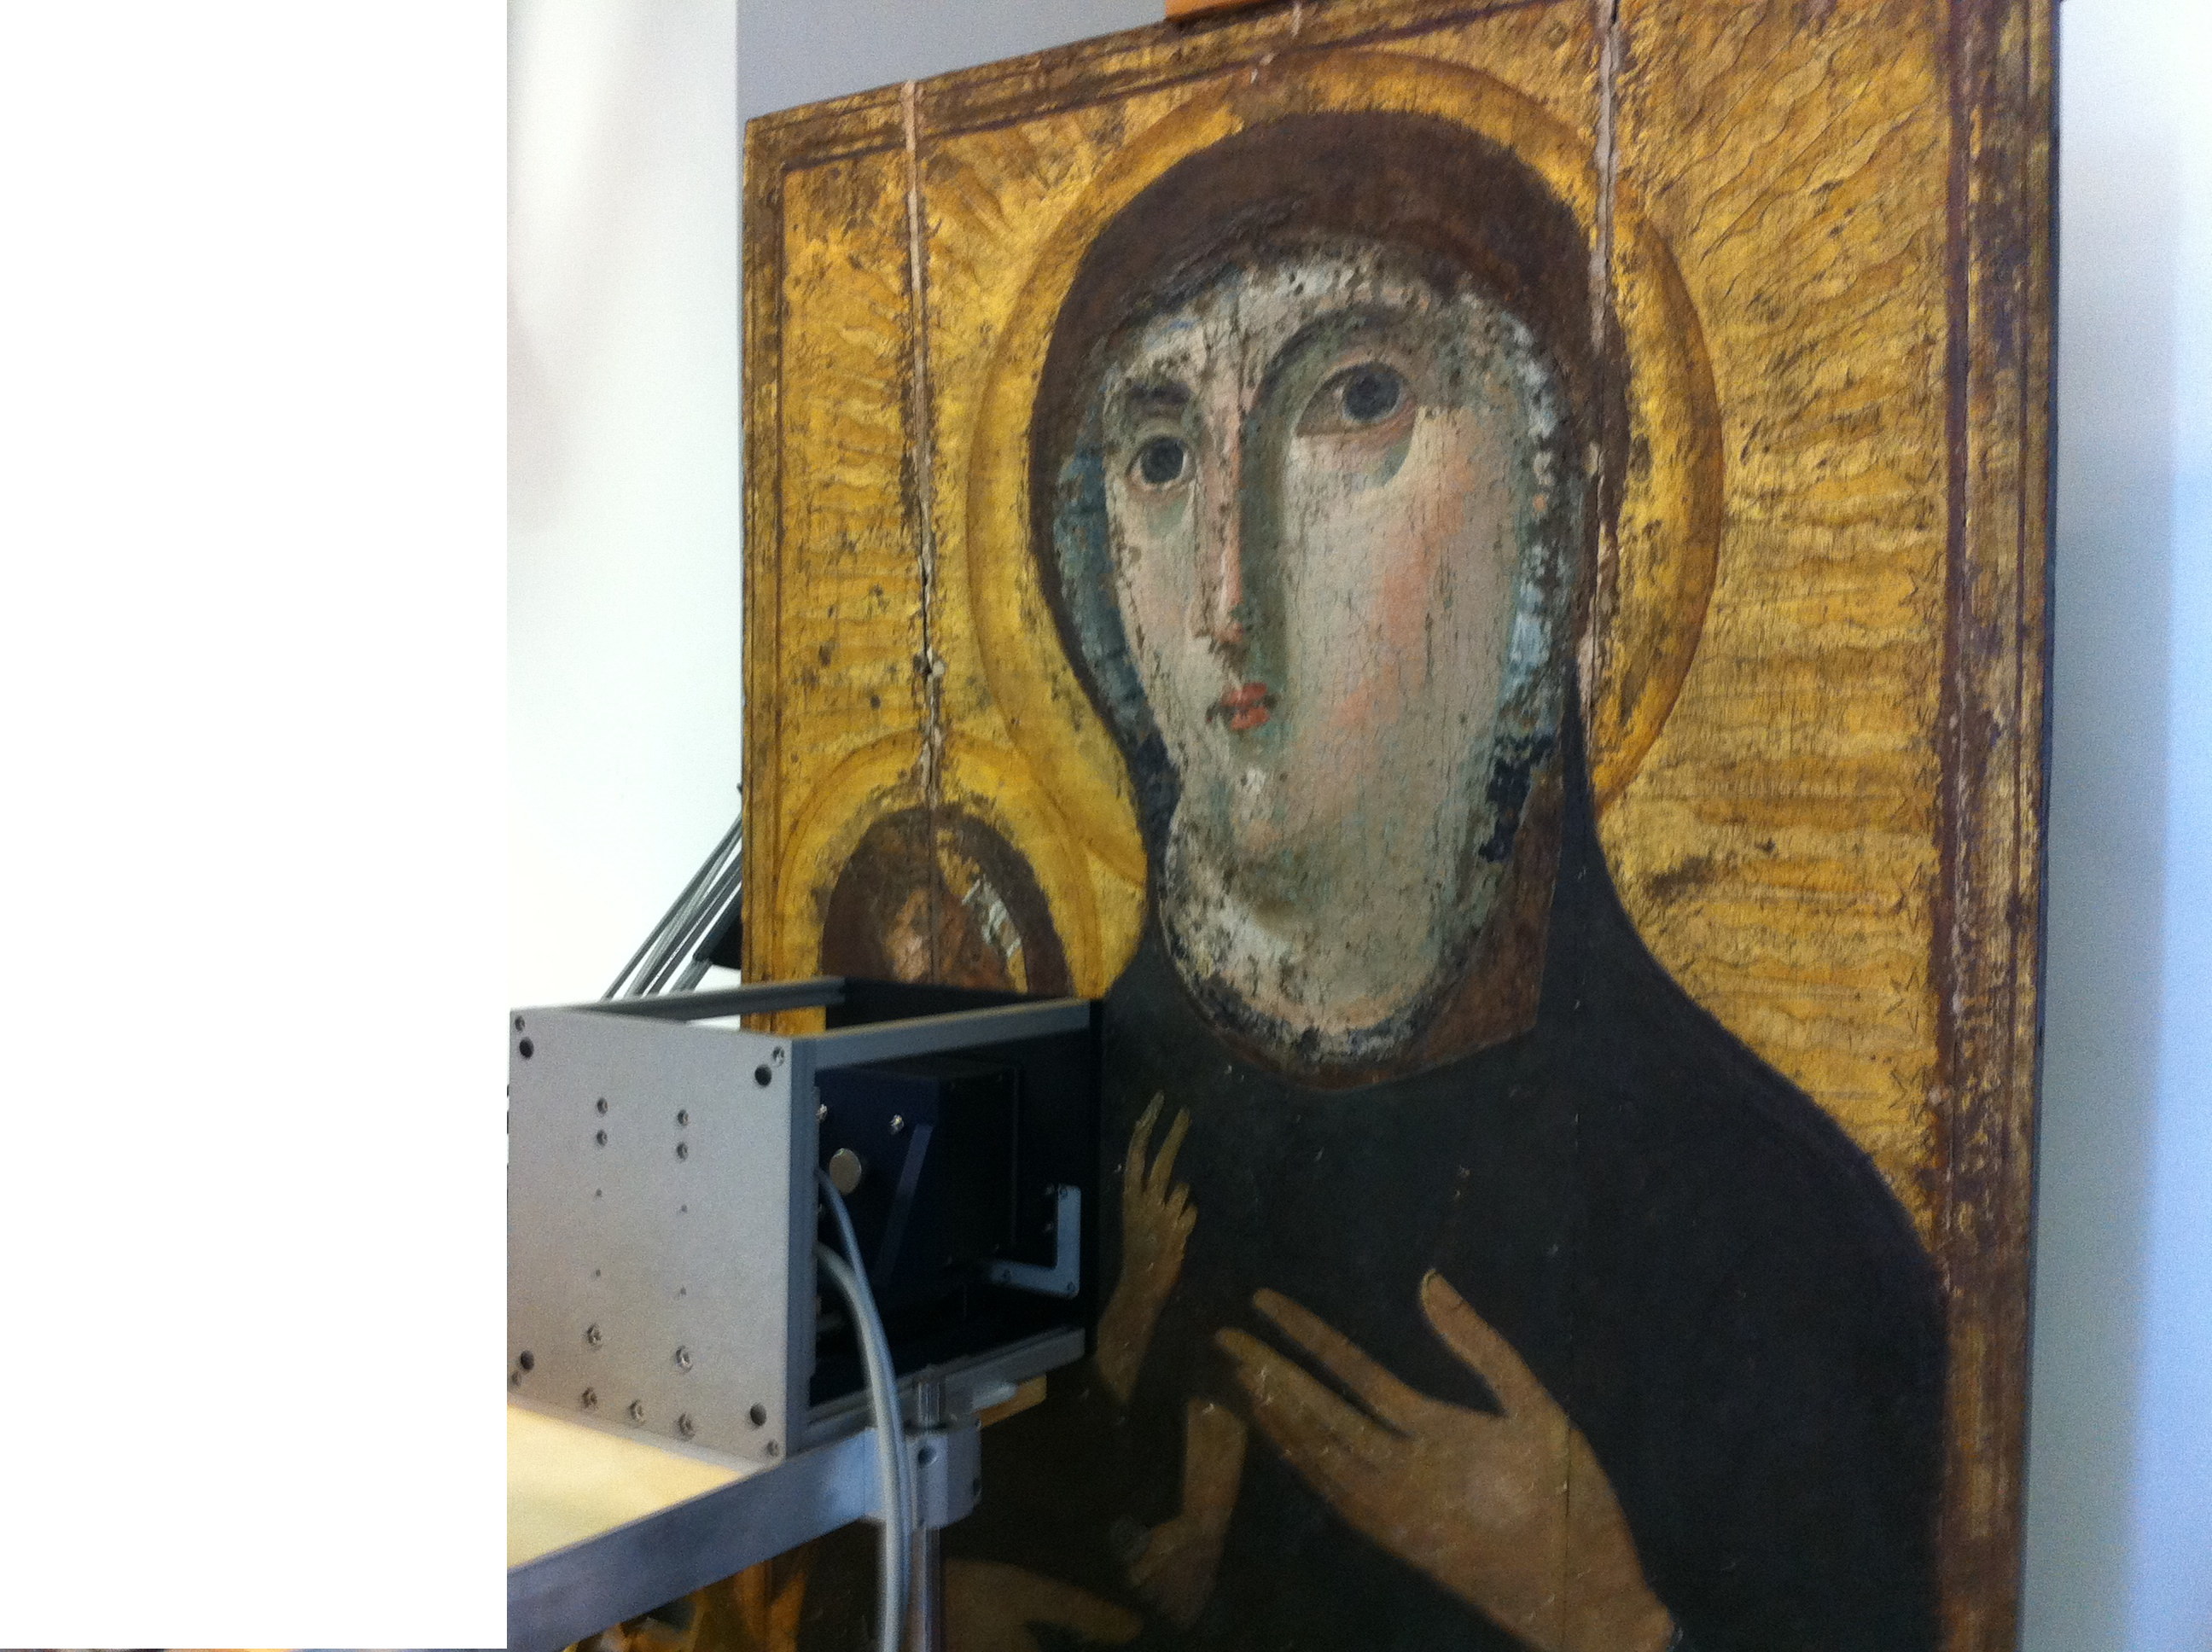
2.4. NMR Stratigraphy of Paintings

NMR stratigraphy is able to reveal non-invasively and in situ the different layers of a painting. The first NMR stratigraphy was published few years ago by Presciutti et al. [16]. The stratigraphy encodes the amplitude of the 1H-NMR signal as a function of the depth scanned. The intensity of the NMR signal enables one layer to be differentiated from another one according to the hydrogen content.
As an example we report the stratigraphies collected on a Byzantine icon [19]. Figure 11a shows a portable NMR sensor while scanning the icon, while in b and c details of two regions measured by NMR are reported.
In Figure 12a the stratigraphy of the Virgin’s face (region P1), is shown. The stratigraphy enabled the detection of three layers, the first one, 0.5 mm thick was ascribed to the pictorial layer, the second one, 0.3 mm thick, was ascribed to the incamottatura (canvas + glue), and the third one was constituted by the wood of the panel.
Figure 12b shows the stratigraphy of the Virgin’s mantle (region P2). Three layers were observed, the first one, 0.4 mm thick, was ascribed to the pictorial layer, the second one, 0.5 mm thick, was ascribed to the primer, and the third one was the wood of the panel.

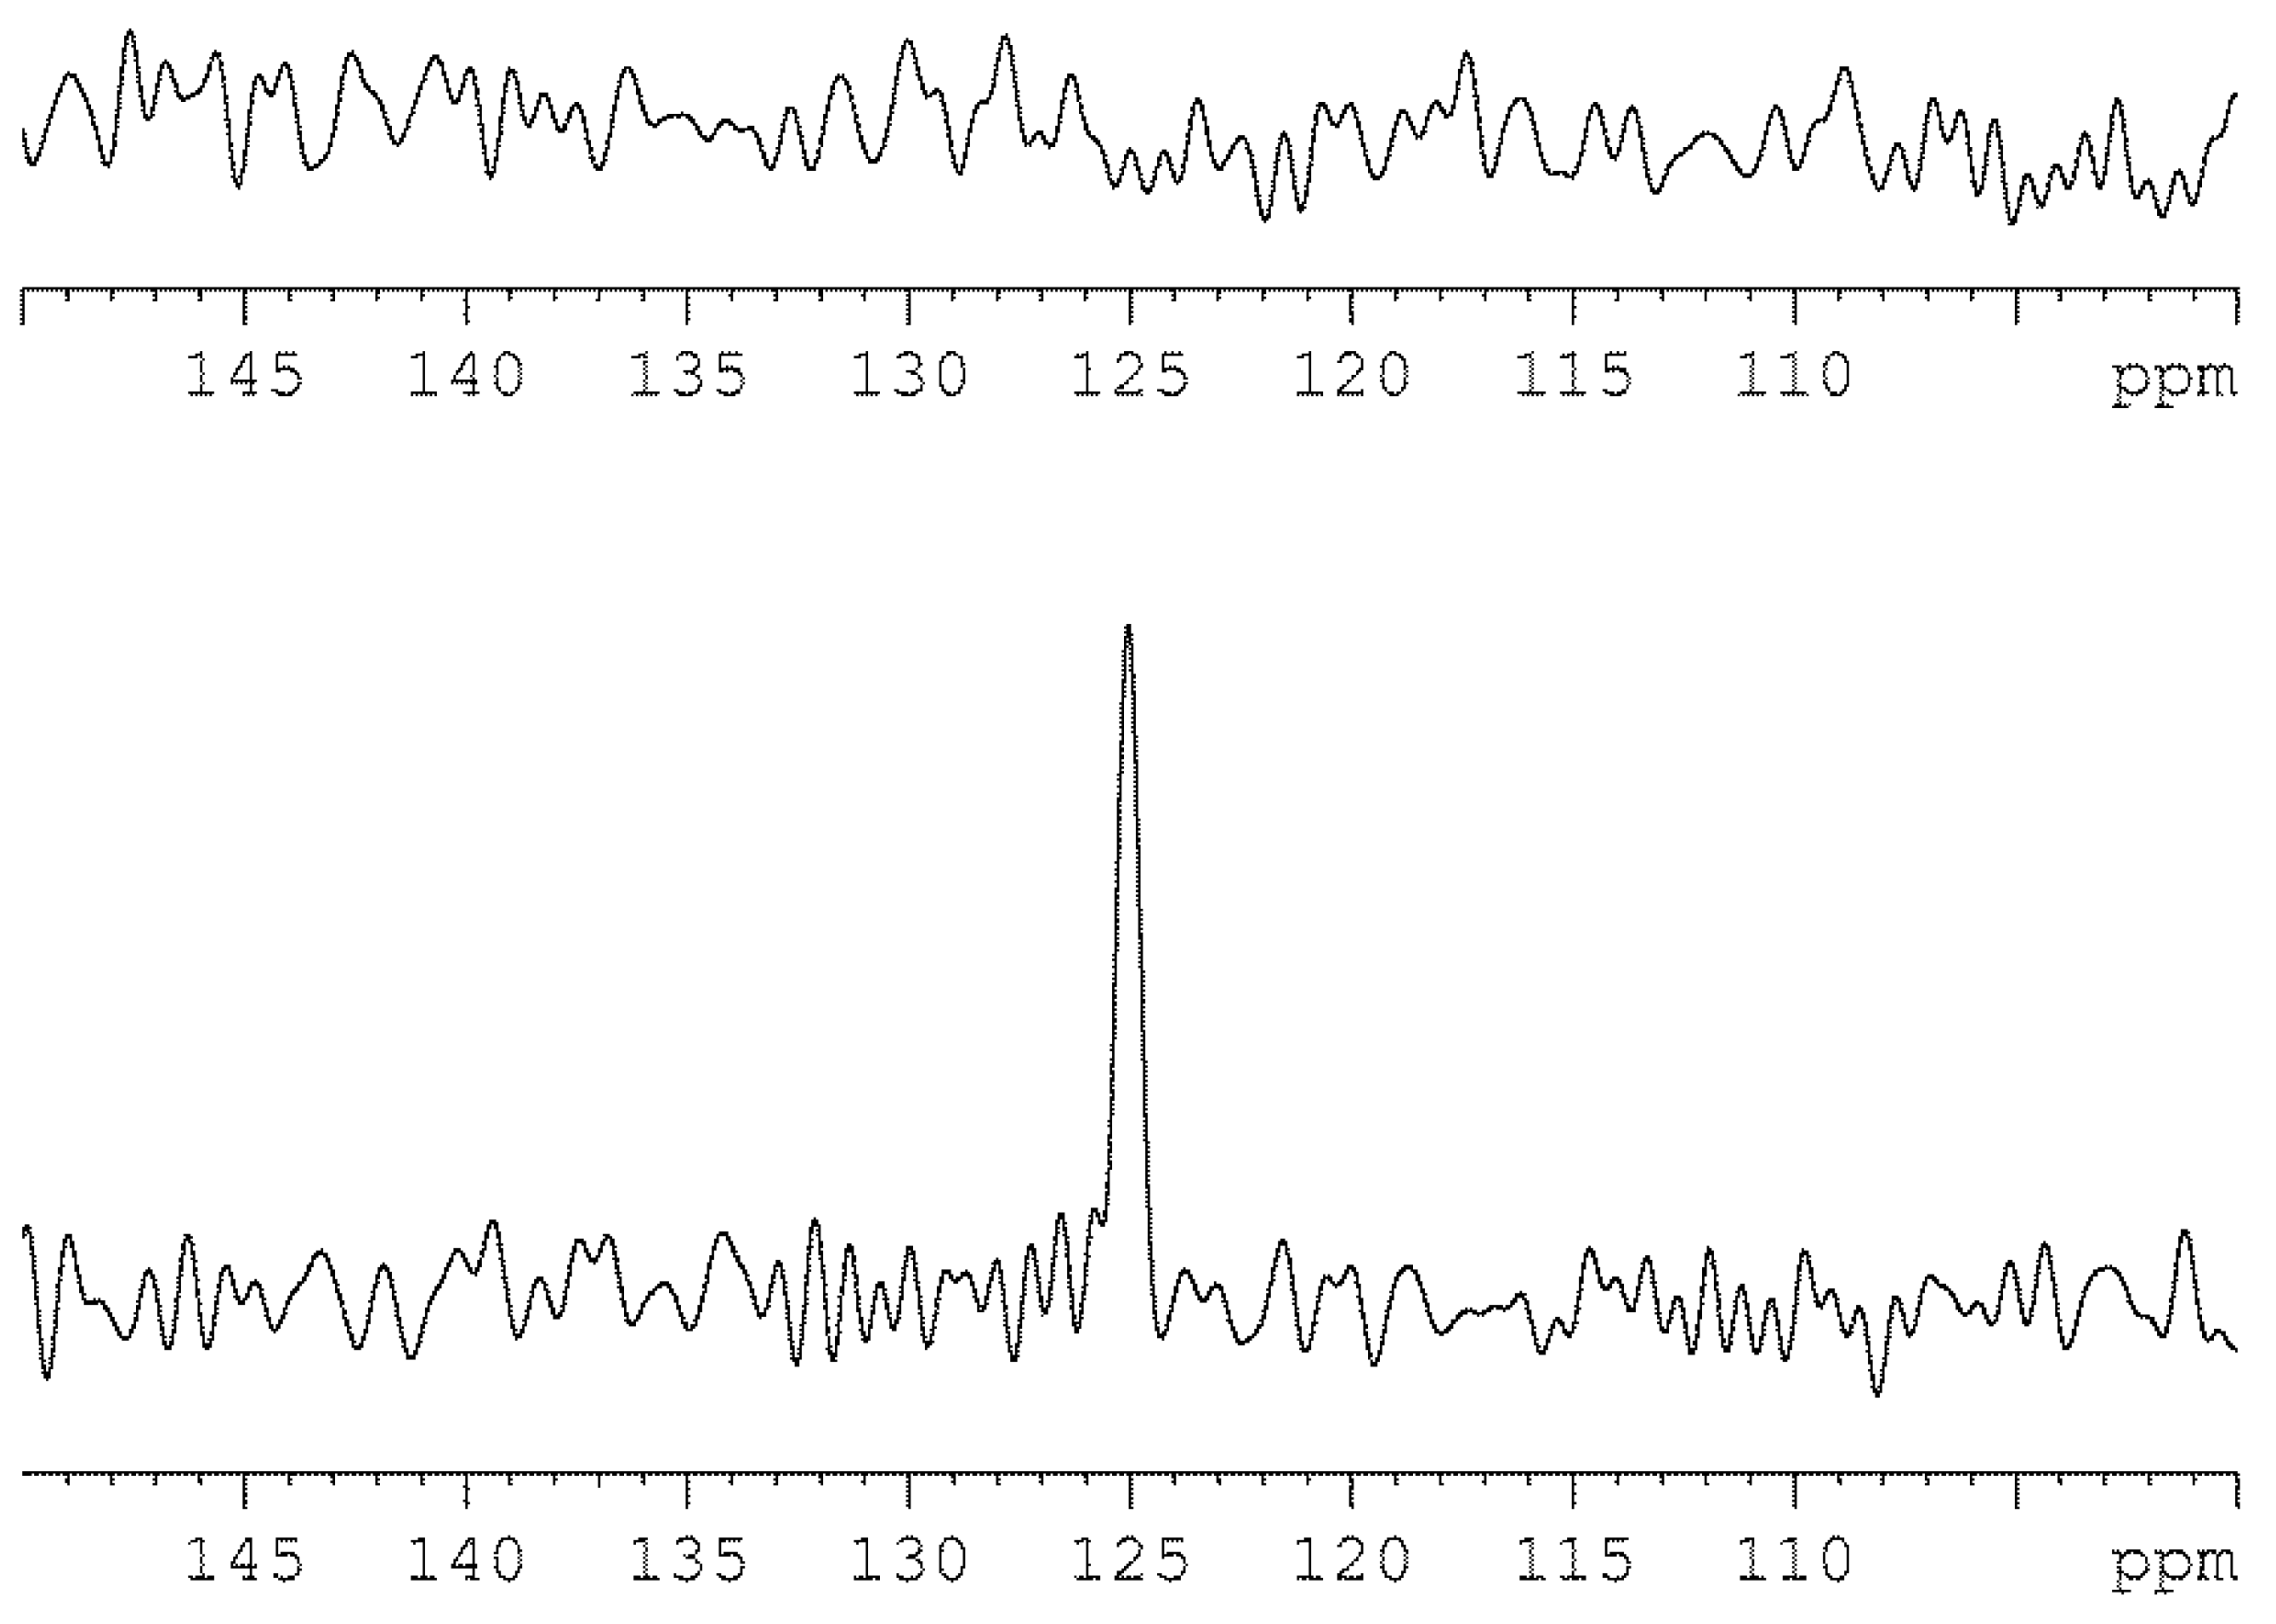
2.5. Detection of CO2 in Lapis Lazuli by 13C MAS NMR

The ultramarine pigment is obtained by purification of lapis lazuli, a semi-precious stone. It has been one of the most valued pigments in Europe since the 13th century. It was typically used to paint the robes and mantel of Christ and the Virgin. Ultramarine pigments are feldspathoids of sodalite structure. Natural and synthetic feldspathoids are able to absorb a variety of molecular species. Miliani et al. [72] applied Fourier Transform Infrared Spectroscopy (FTIR) to investigate the presence of adsorbed species on synthetic and natural ultramarine pigments. Their data indicated the presence of CO2 in natural Afghan ultramarine, and suggested that CO2 molecules, although not free to rotate, were loosely physisorbed to the sodalite cage [73].
The presence of CO2 in the sodalite cage of natural Afghan ultramarine was confirmed by 13C MAS NMR spectroscopy.
It has been shown that 13C NMR may be successfully used to characterize the motion of molecules adsorbed on molecular sieves [74]. In particular, the 13C NMR spectrum has been successfully used to investigate the local structure and dynamics of absorbed CO2 in porous materials such as zeolites with micro- or mesopores [73]. We exploited 13C MAS NMR spectroscopy to ascertain the presence of CO2 in natural abundance included into the structure of a sample of Afghan lapis lazuli. In Figure 13 the 13C MAS NMR spectra of a sample of Afghan lapis lazuli (bottom) and a sample of synthetic ultramarine (top) are compared. In the spectrum of Afghan lapis lazuli a sharp resonance at 125 ppm is observed and assigned to 13CO2 while in the spectrum of synthetic ultramarine, the peak was not present. No other signals related to other carbon based materials (such as CaCO3 or CO) were observed in the 13C MAS NMR spectrum. Because the sample of Afghan lapis lazuli was finely ground the presence of CO2 was not related to microfluid inclusions.

3. Materials and Methods

3.1. Gel Preparation and Application to Wall Painting Specimens

Carbogel, Gellan gum, Sepiolite, and Laponite RD gels were prepared at different concentrations. A 2% Gellan gum gel (Kelkogel, CTS srl, Altavilla Vicentina, (VI), Italy), a 0.5% Carbogel (CTS srl) and a 5% Laponite RD and a 6% Sepiolite clay (Bresciani srl, Milano, Italy), were prepared by dissolving the powder in water.
The gellan gum formulation (1 g gellan gum in 50 mL H2O) was heated in a microwave oven at 750 W for 3 min and cooled to room temperature to obtain a rigid gel about 5 cm thick.
The cleaning formulations were prepared by dissolving 2.5 g lyophilized bacteria in 2 L water; 50 mL of this suspension was added in 100 mL gel. In the case of Gellan gum, the suspension was added during the gel cooling at about 40 °C.
Tests were performed on wall painting specimens (30 × 30 × 2 cm3) prepared ad hoc with 8 mm arriccio (1 lime putty + 3 sand, grain size 0.1–1 mm) and 4 mm fine plaster (1 lime putty + 2 sand, grain size 0.5 mm max.). After a 3-h drying time, pigments were applied using the fresco technique. Gels were applied on the surface of specimens for 1 and 4 h. Analyses by portable NMR were performed on the hydrogel/bacteria systems and on wall painting specimens before and after the treatment.

3.2. Measurements on Hydrogel-Based Cleaning Systems

Non-invasive, non-destructive measurements were performed at 13.62 MHz with a portable NMR instrument from Bruker Biospin (Ettlingen, Germany) interfaced with a purposely built single-sided sensor by RWTH Aachen University, Aachen, Germany [75].
Longitudinal relaxation times T1 were measured with the Saturation Recovery pulse sequence followed by a CPMG train in the detection period to increase the sensitivity [76]. Effective transverse relaxation times T2eff [77,78] were measured with the CPMG pulse sequence, 4096 echoes were measured using an echo time 2τ of 71.2 μs. Due to the dead time of the probe (about 40 μs) and the strong steady magnetic field gradient, the transverse relaxation of non-exchangeable protons of the gel network which usually ranges between 10 and 20 μs, was too short to be detected [79]. In fact, in the presence of a magnetic field gradient, the transverse relaxation time does not depend only on the spin-spin interaction but it is also controlled by molecular diffusion in the magnetic field gradient that in the case of portable NMR is strong (14.28 T/m).
The longitudinal relaxation time was obtained fitting the magnetization decay to the following equation:
M ( t ) = M 0 [ 1 e [ t T 1 ] ]
where M0 is the magnetization at the equilibrium.
Effective transverse relaxation times were obtained fitting the magnetization decay to the following equation:
Y ( τ ) = i = 1 n W i e 2 τ T 2 i
where n is the number of components, and Wi and T2i are the weight and the transverse relaxation time of the ith component, respectively. Before fitting, the sum of weights was normalized to 100%.
1H NMR depth profiles collected on specimens after the application of gels were obtained by applying the CPMG pulse sequence with an echo time of 86 μs and a nominal resolution of 23 μm. Profiles were acquired by repositioning the single-sided sensor in steps of 250 μm to scan the desired spatial range, from the surface of the specimen to a depth of about 5 mm.
Self-diffusion coefficients D were measured at 0.36 T (13.62 MHz) with a steady gradient (SG) of 14.28 T/m using a stimulated echo (SGSTE) pulse sequence followed by a CPMG echo train to improve the signal/noise. The attenuation of the spin echo resulting from the dephasing of nuclear spins was used to measure the molecular displacement according to the following equation:
ln ( A A 0 ) = γ 2 G 2 τ 1 2 ( Δ + 2 3 τ 1 ) D 2 τ 1 T 2 Δ T 1
where A0 is the amplitude of the echo at the shortest time τ 1 , D is the self-diffusion coefficient, Δ is the diffusion time, G is the steady magnetic field gradient, and γ is the 1H gyromagnetic ratio (2.6752 × 10⁸ s−1 rad T−1). For large D values, strong magnetic field gradient, and provided that τ1 << T2, and Δ << T1, diffusion terms dominate over relaxation terms and the self-diffusion coefficient may be obtained by the following equation:
ln ( A A 0 ) = γ 2 G 2 τ 1 2   ( Δ + 2 3 τ 1 ) D
The self-diffusion coefficient D of water molecules is obtained from the slope of the plot of ln ( A i A 0 ) vs. γ 2 G 2 τ i 2   ( Δ + 2 3 τ i ) .
The uncertainty associated with T1, T2eff, and D was obtained by repeating the measurement three times on each sample.

3.3. Moisture Measurements

Measurements were carried out in situ at the proton frequency of 16 MHz by a single-sided NMR instrument from Bruker Biospin. The probehead used detected the hydrogen signal from the moisture at 5 mm of depth inside the wall. The pulse width corresponding to the π/2 pulse was 10.4 μs, and the dead time was 15 μs. Because the inhomogeneous magnetic field generated by single-sided NMR makes the signal decay very quickly, the signal must be recovered stroboscopically as a Hahn echo [9]. The echo time (2τ) was set as short as possible, i.e., 20 μs.

3.4. Protective and Consolidating Treatment on Lapideous Material

3.4.1. Materials

Sandstone had a granularity between 200 and 800 μm. The finer class was made up of quartz, feldspars, and mica flakes and the coarser class by mica schists and rare bioclastic grains. The bounding material was mainly made of a clay matrix. The total porosity was found to be 10%, and the porosity distribution determined by mercury intrusion porosimetry (MIP) was found to be unimodal with a radius between 0.064 and 1 μm [50].
Calcarenite had a medium grain size less than 100 μm. It was an organogenic rock, mostly made up of micro-fossils and bearing a micritic matrix. The insoluble residue was constituted of clay minerals, silicate minerals, phosphates, and a small amount of ferrous components. The total porosity was found to be 35%, and the porosity distribution determined by MIP was found to be unimodal with a radius between 0.256 and 4 μm [50].
Stones were cut to obtain specimens with a size of 5 × 5 × 2 cm3.

3.4.2. Treatments Application

Before treating, all specimens were dried up to constant mass in a ventilated oven at a temperature of 60 ± 2 °C. Then specimens were kept for 24 h at 23 ± 2 °C and 50% ± 5% relative humidity.
Sandstone specimens were treated with a commercially available protective and hydrophobic solution of dimethylsiloxane (DMS) in white spirit, whereas calcarenite specimens were treated with a commercially available consolidating solution of tetraethoxysilane (TEOS) in ethyl alcohol.
Treatments were absorbed by capillarity letting the specimens come in contact with the solutions for 5, 600, and 1800 s, respectively. Before and after treating, specimens were weighed taking care to ensure the complete evaporation of the solvent when the specimen weight reached a constant value. NMR measurements were carried out on water saturated specimens making the specimens absorb water by capillarity.

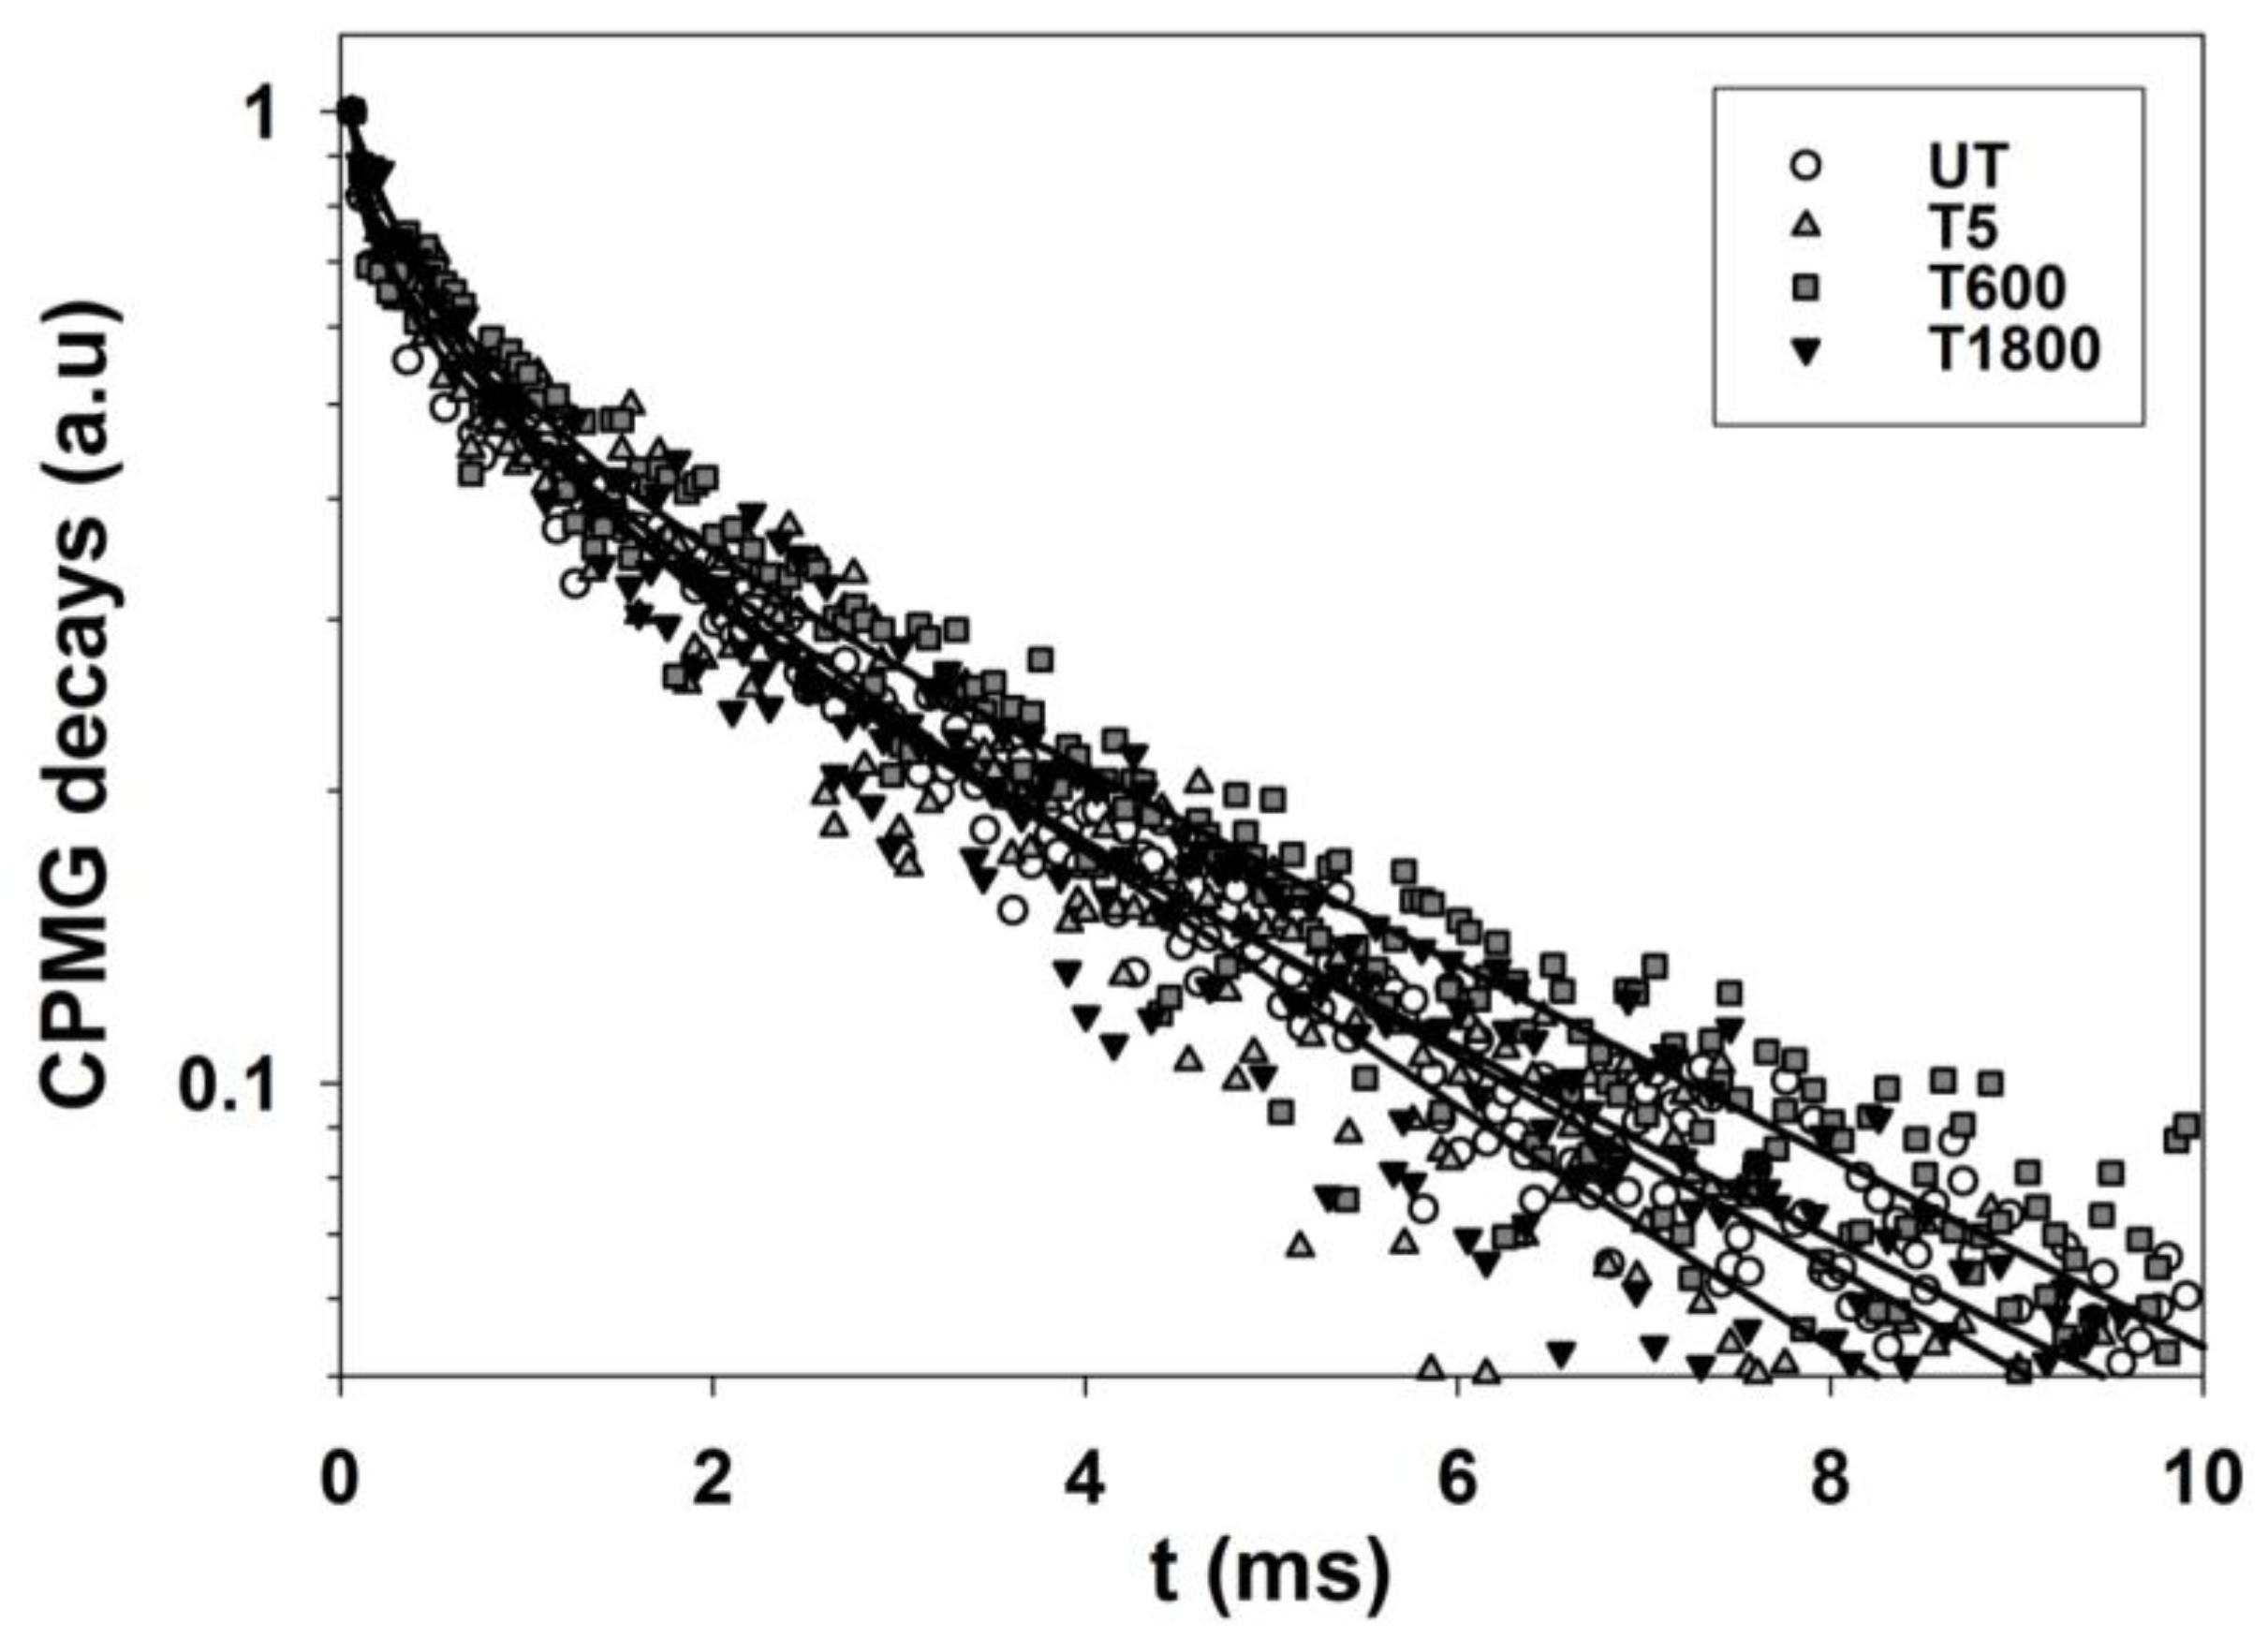
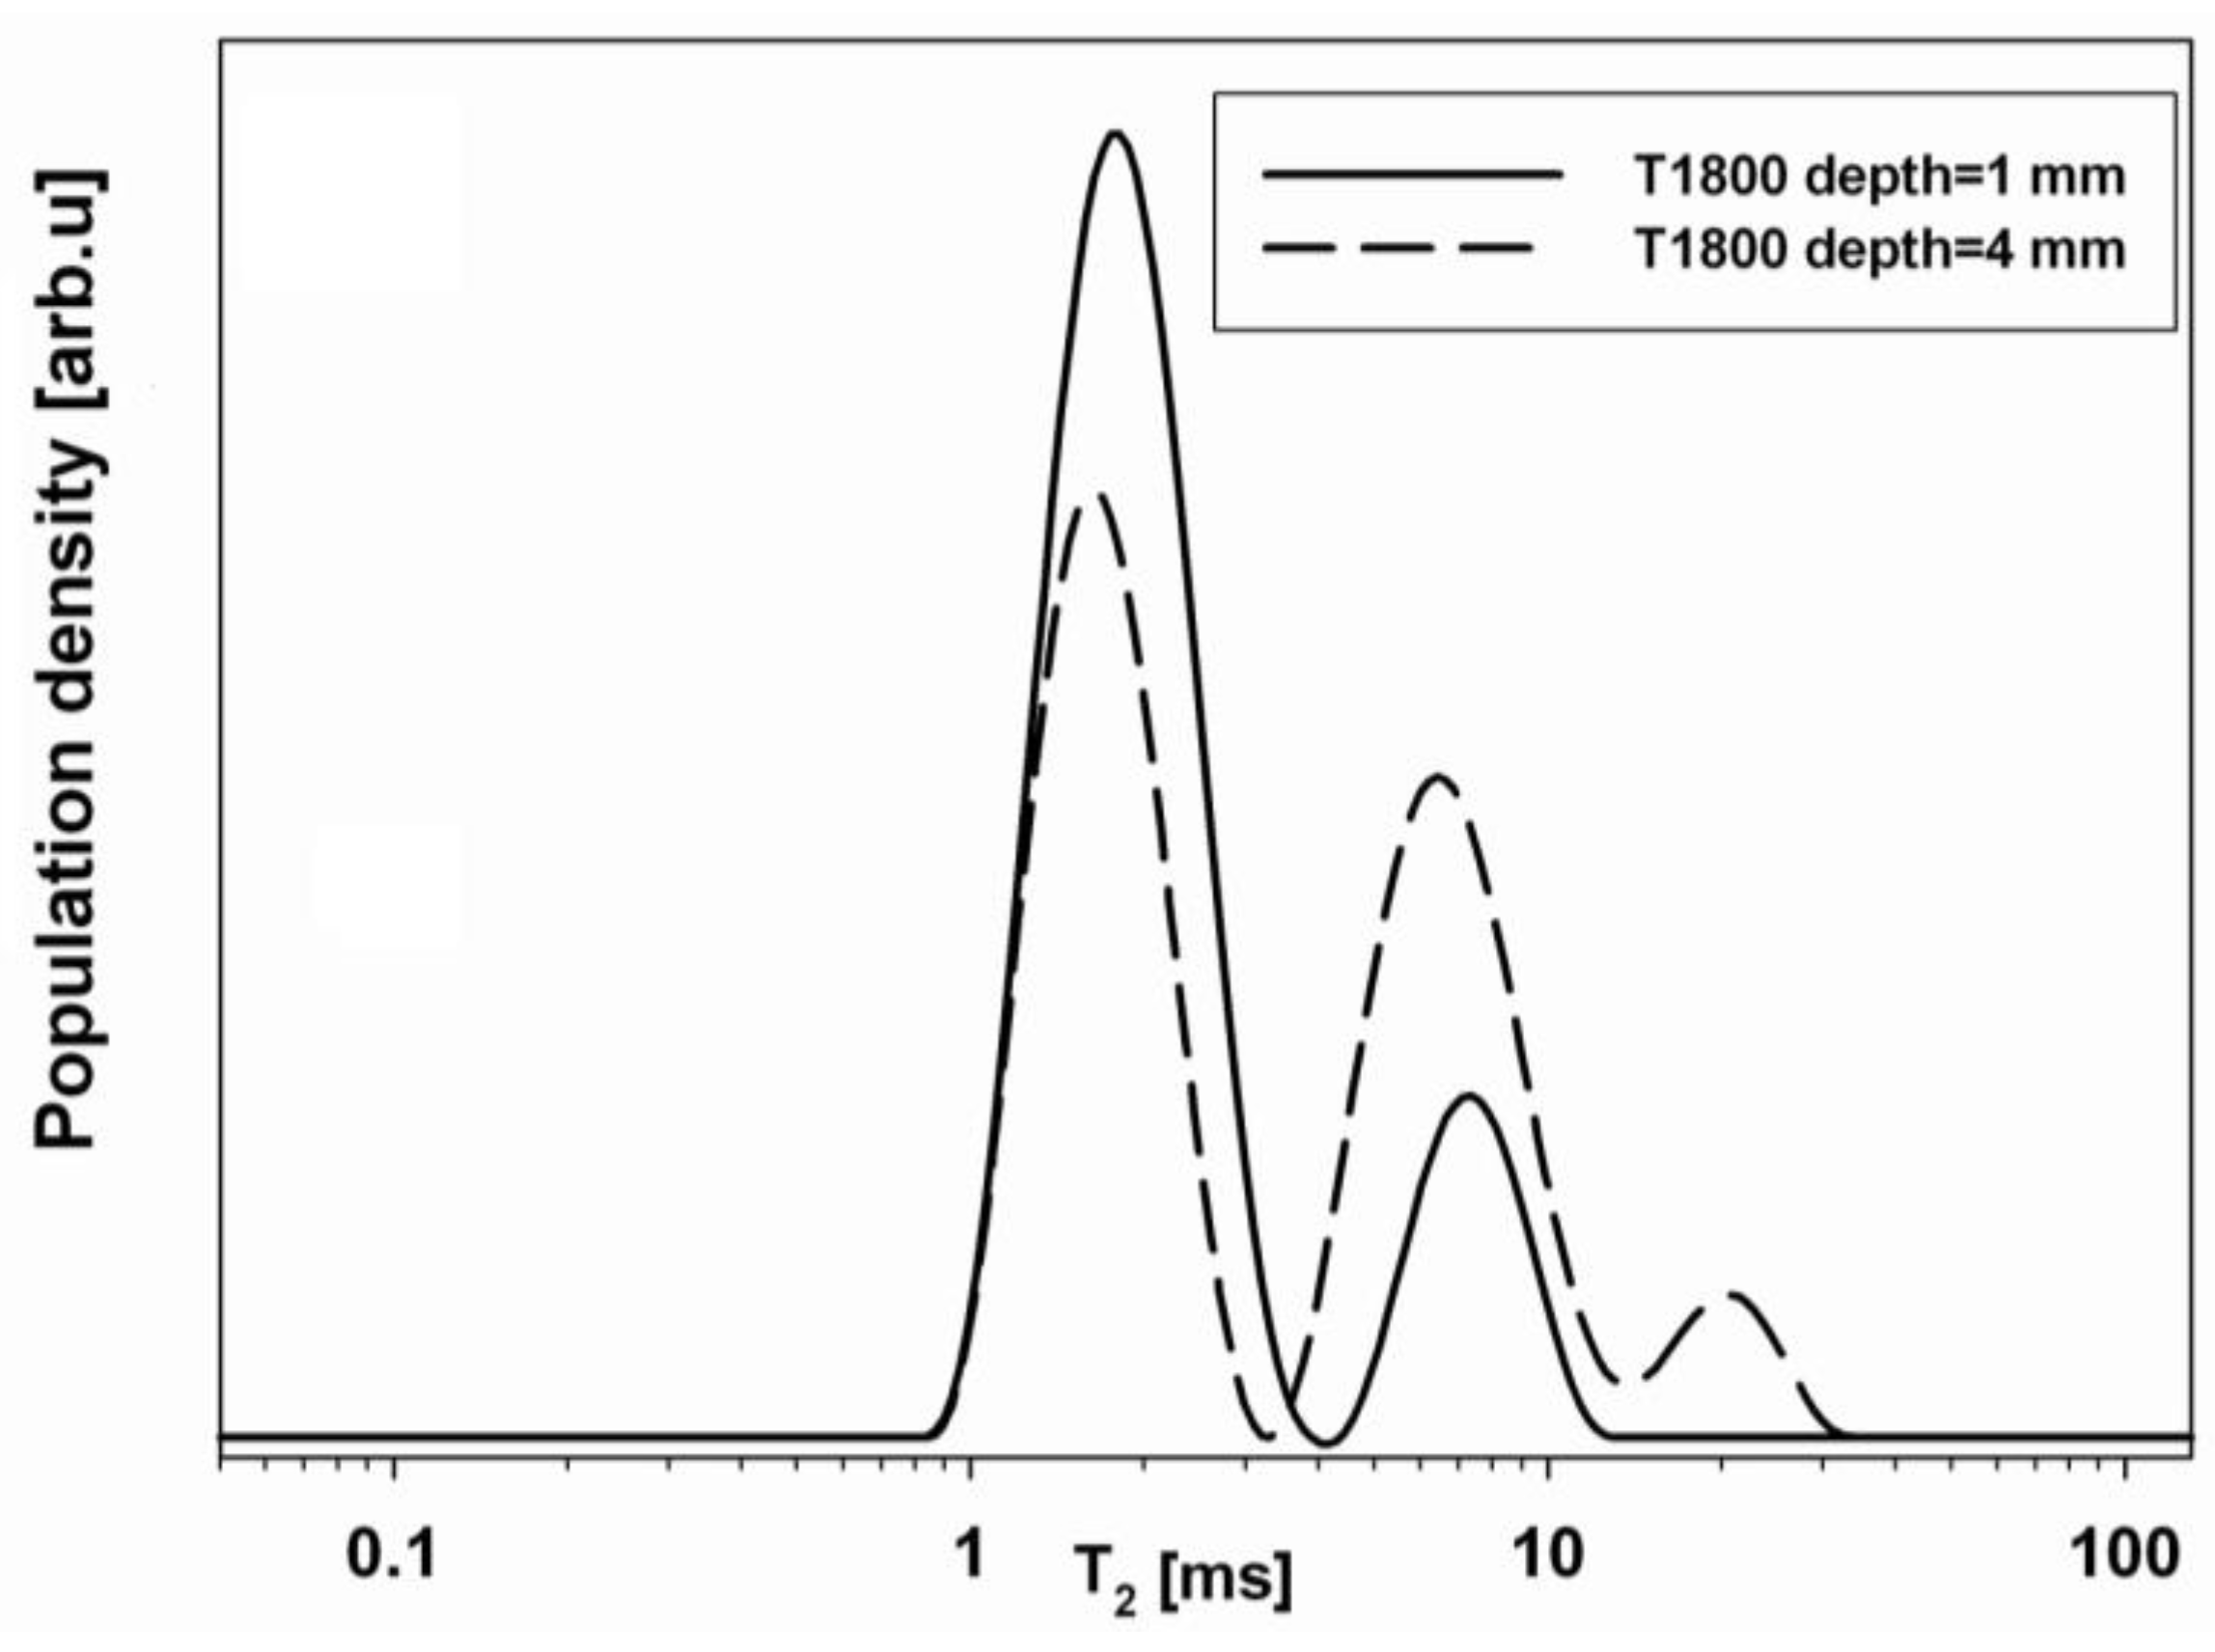
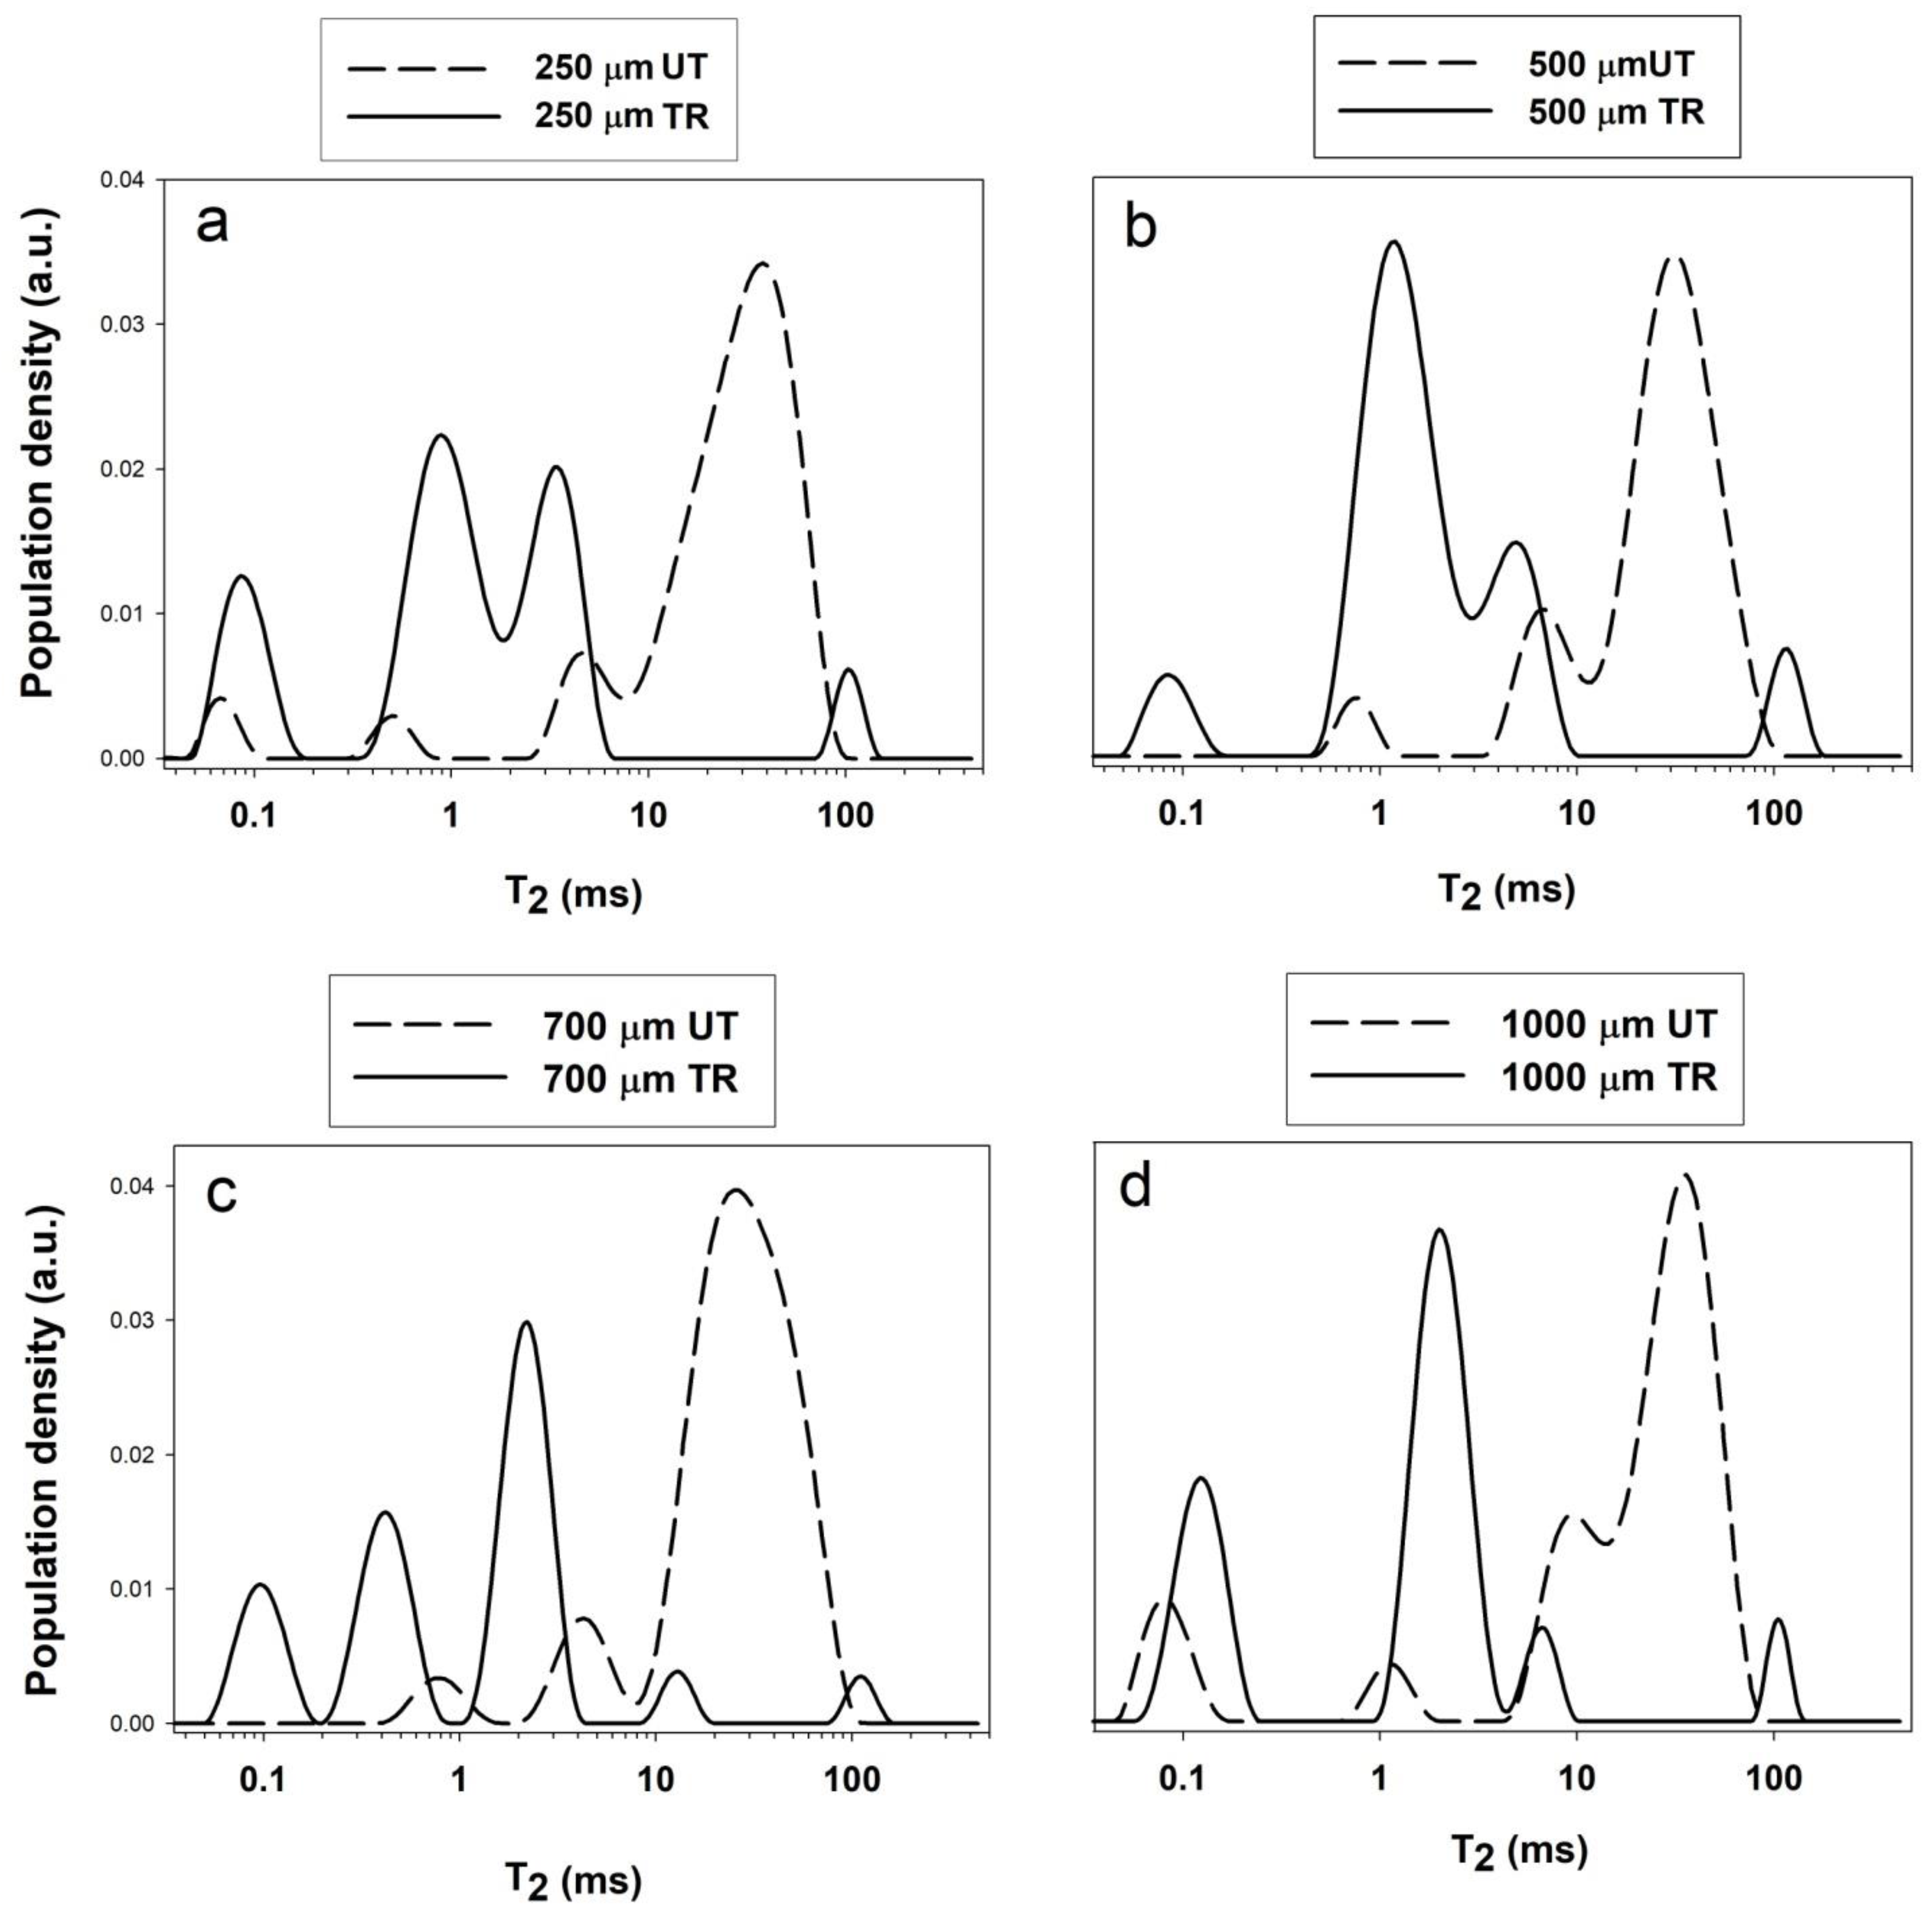
3.5. Depth Profiles and Transverse Relaxation Times Collected on Sandstone and Calcarenite

Depth profiles of specimens were obtained with an echo time of 94 μs and a resolution of 20 μm, the single-sided sensor was repositioned in steps of 60 μm to scan from the surface of the specimen to a depth of 10 mm.
Transverse relaxation times T2 were measured with the CPMG sequence, and 2048 echoes were recorded with an echo time 2τ of 50 μs. T2 values were obtained by fitting the magnetization decays to Equation (2).

Processing of Depth Profiles

Depth profiles were fit to the following equation:
f ( x ) = k = 1 N W k 2 e r f [ x k x Δ k 2 ] + q 0
where N is the number of transitions of the amplitude in the depth profile, xk is the penetration depth of the kth component at the inflection point xk, Δk is the half width of the transition of the amplitude from low to high value of the spin population, wk is the spin population of kth component, and q0 is the lowest spin population.
The slope at inflection point bk was obtained from the first derivate of f(x) calculated at x = xk using the parameters obtained from the best fit of depth profiles:
b k = W k 2 Δ k

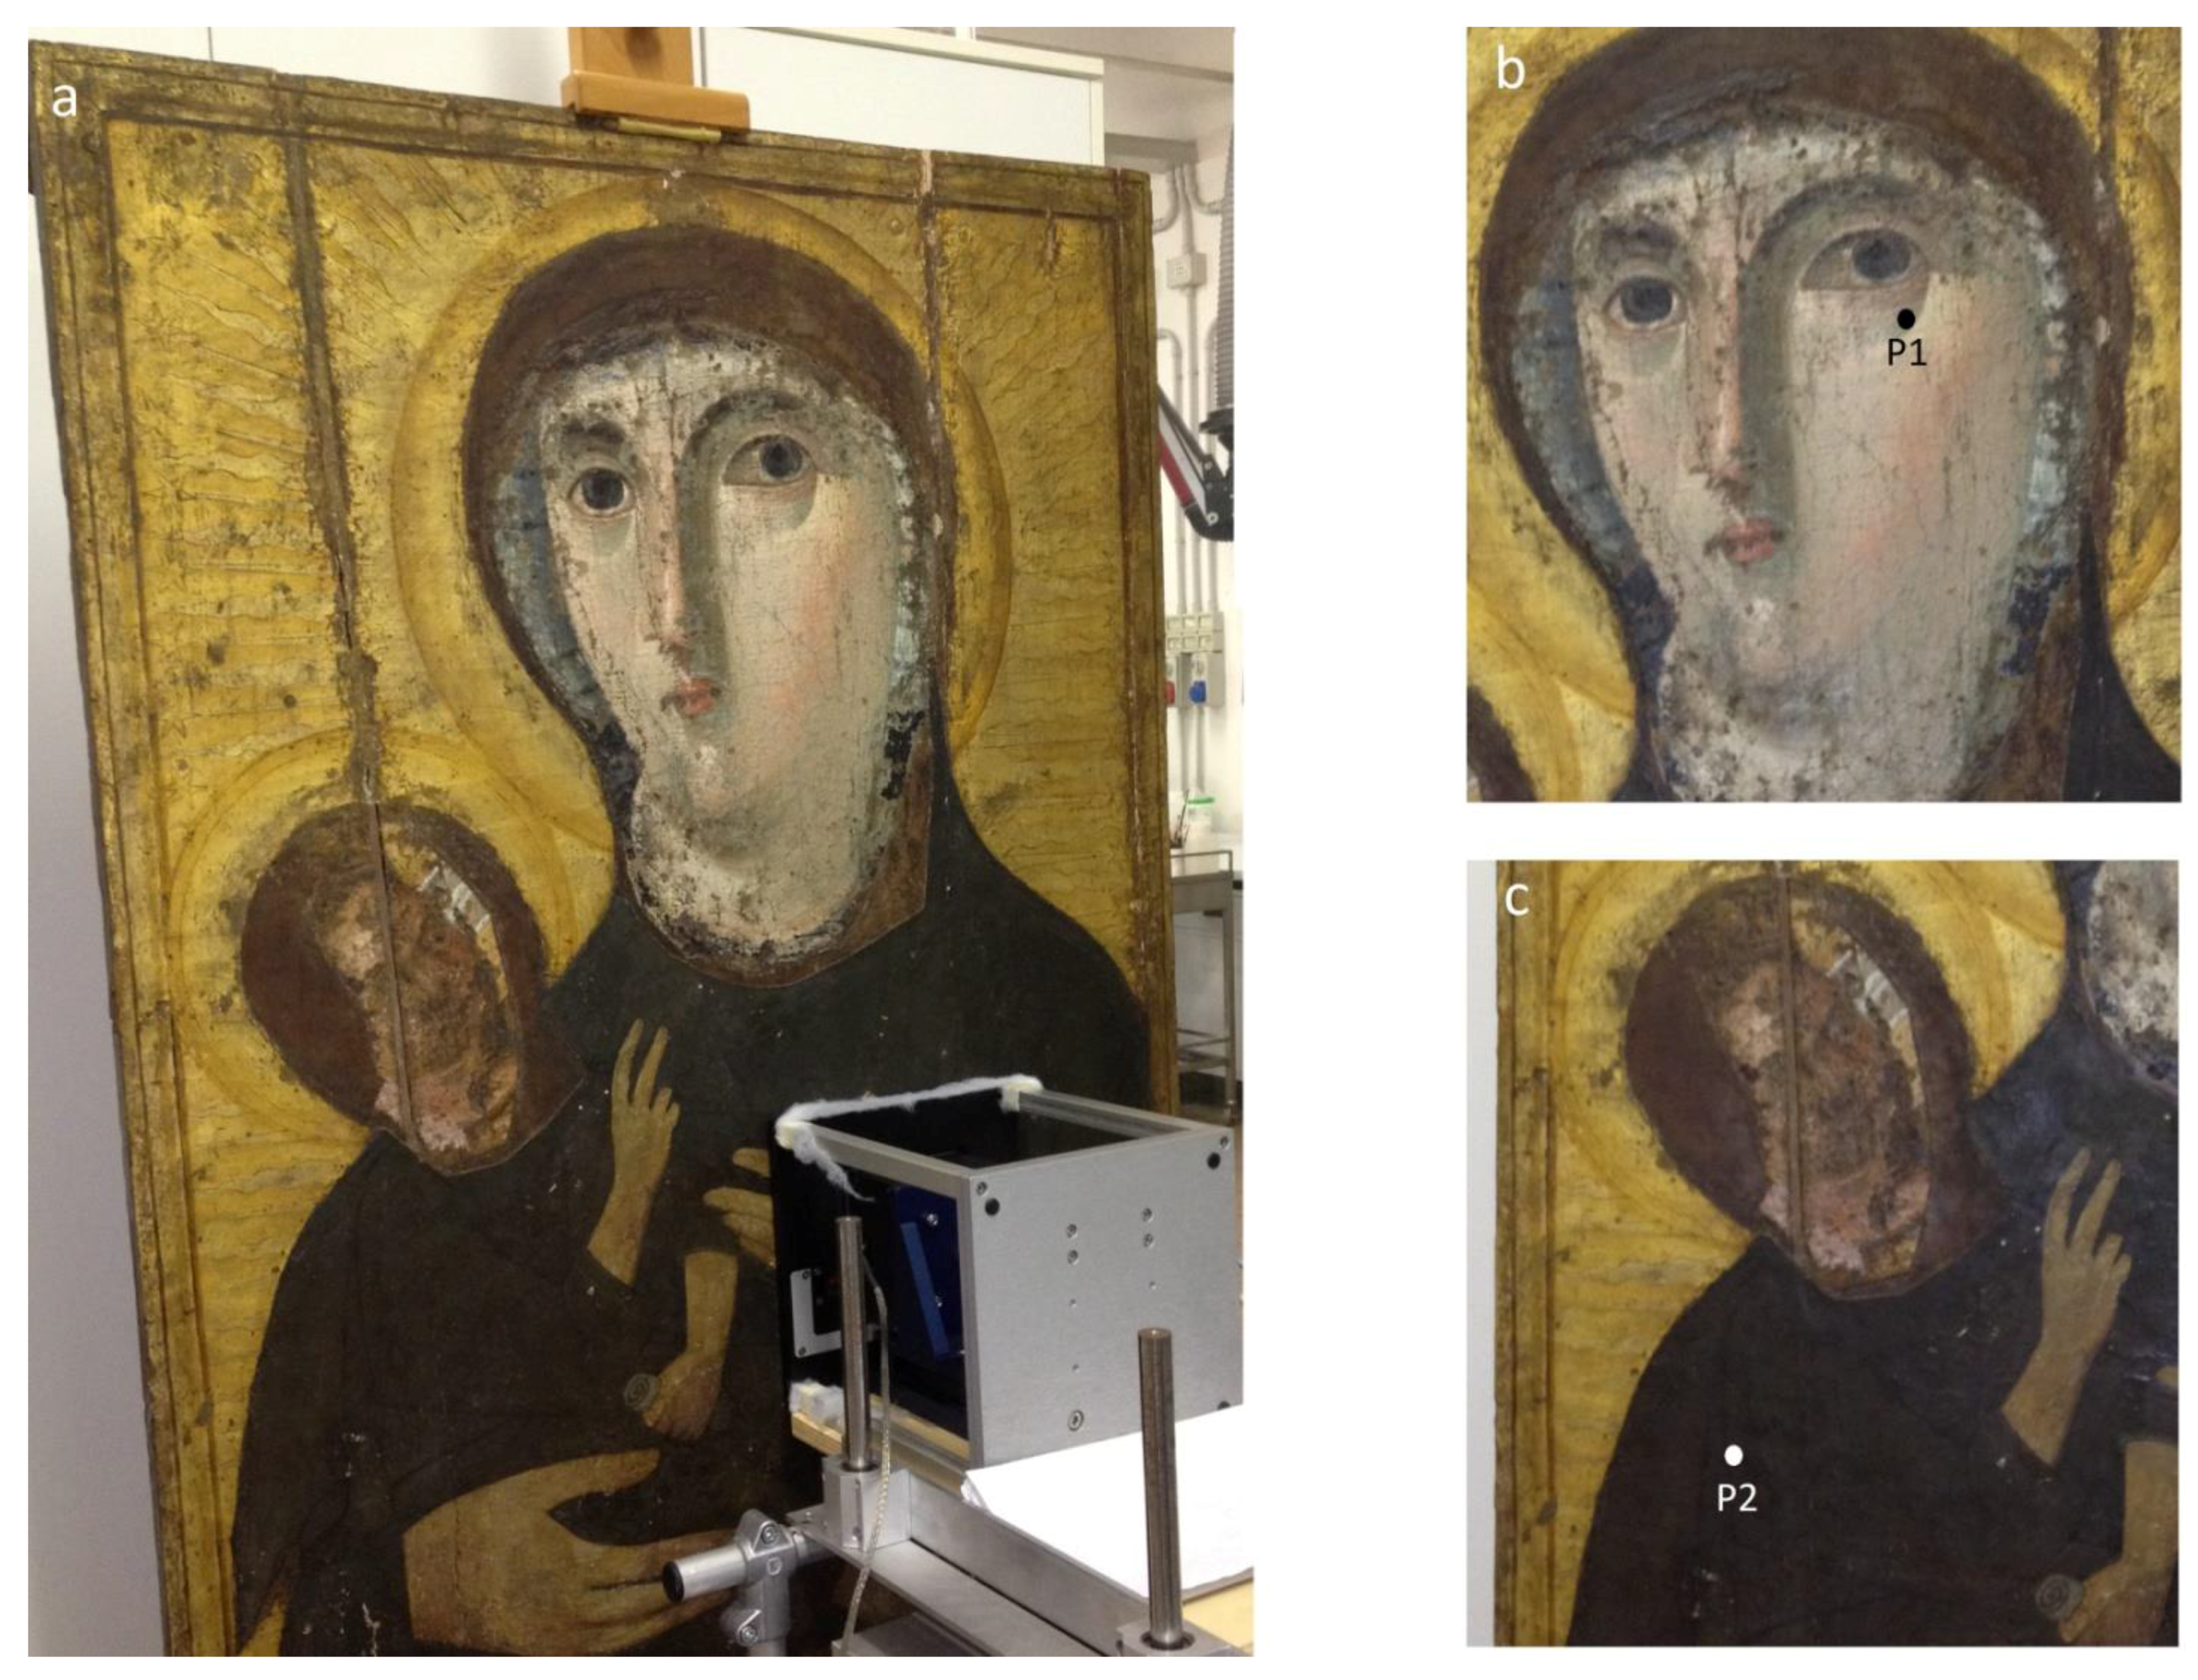
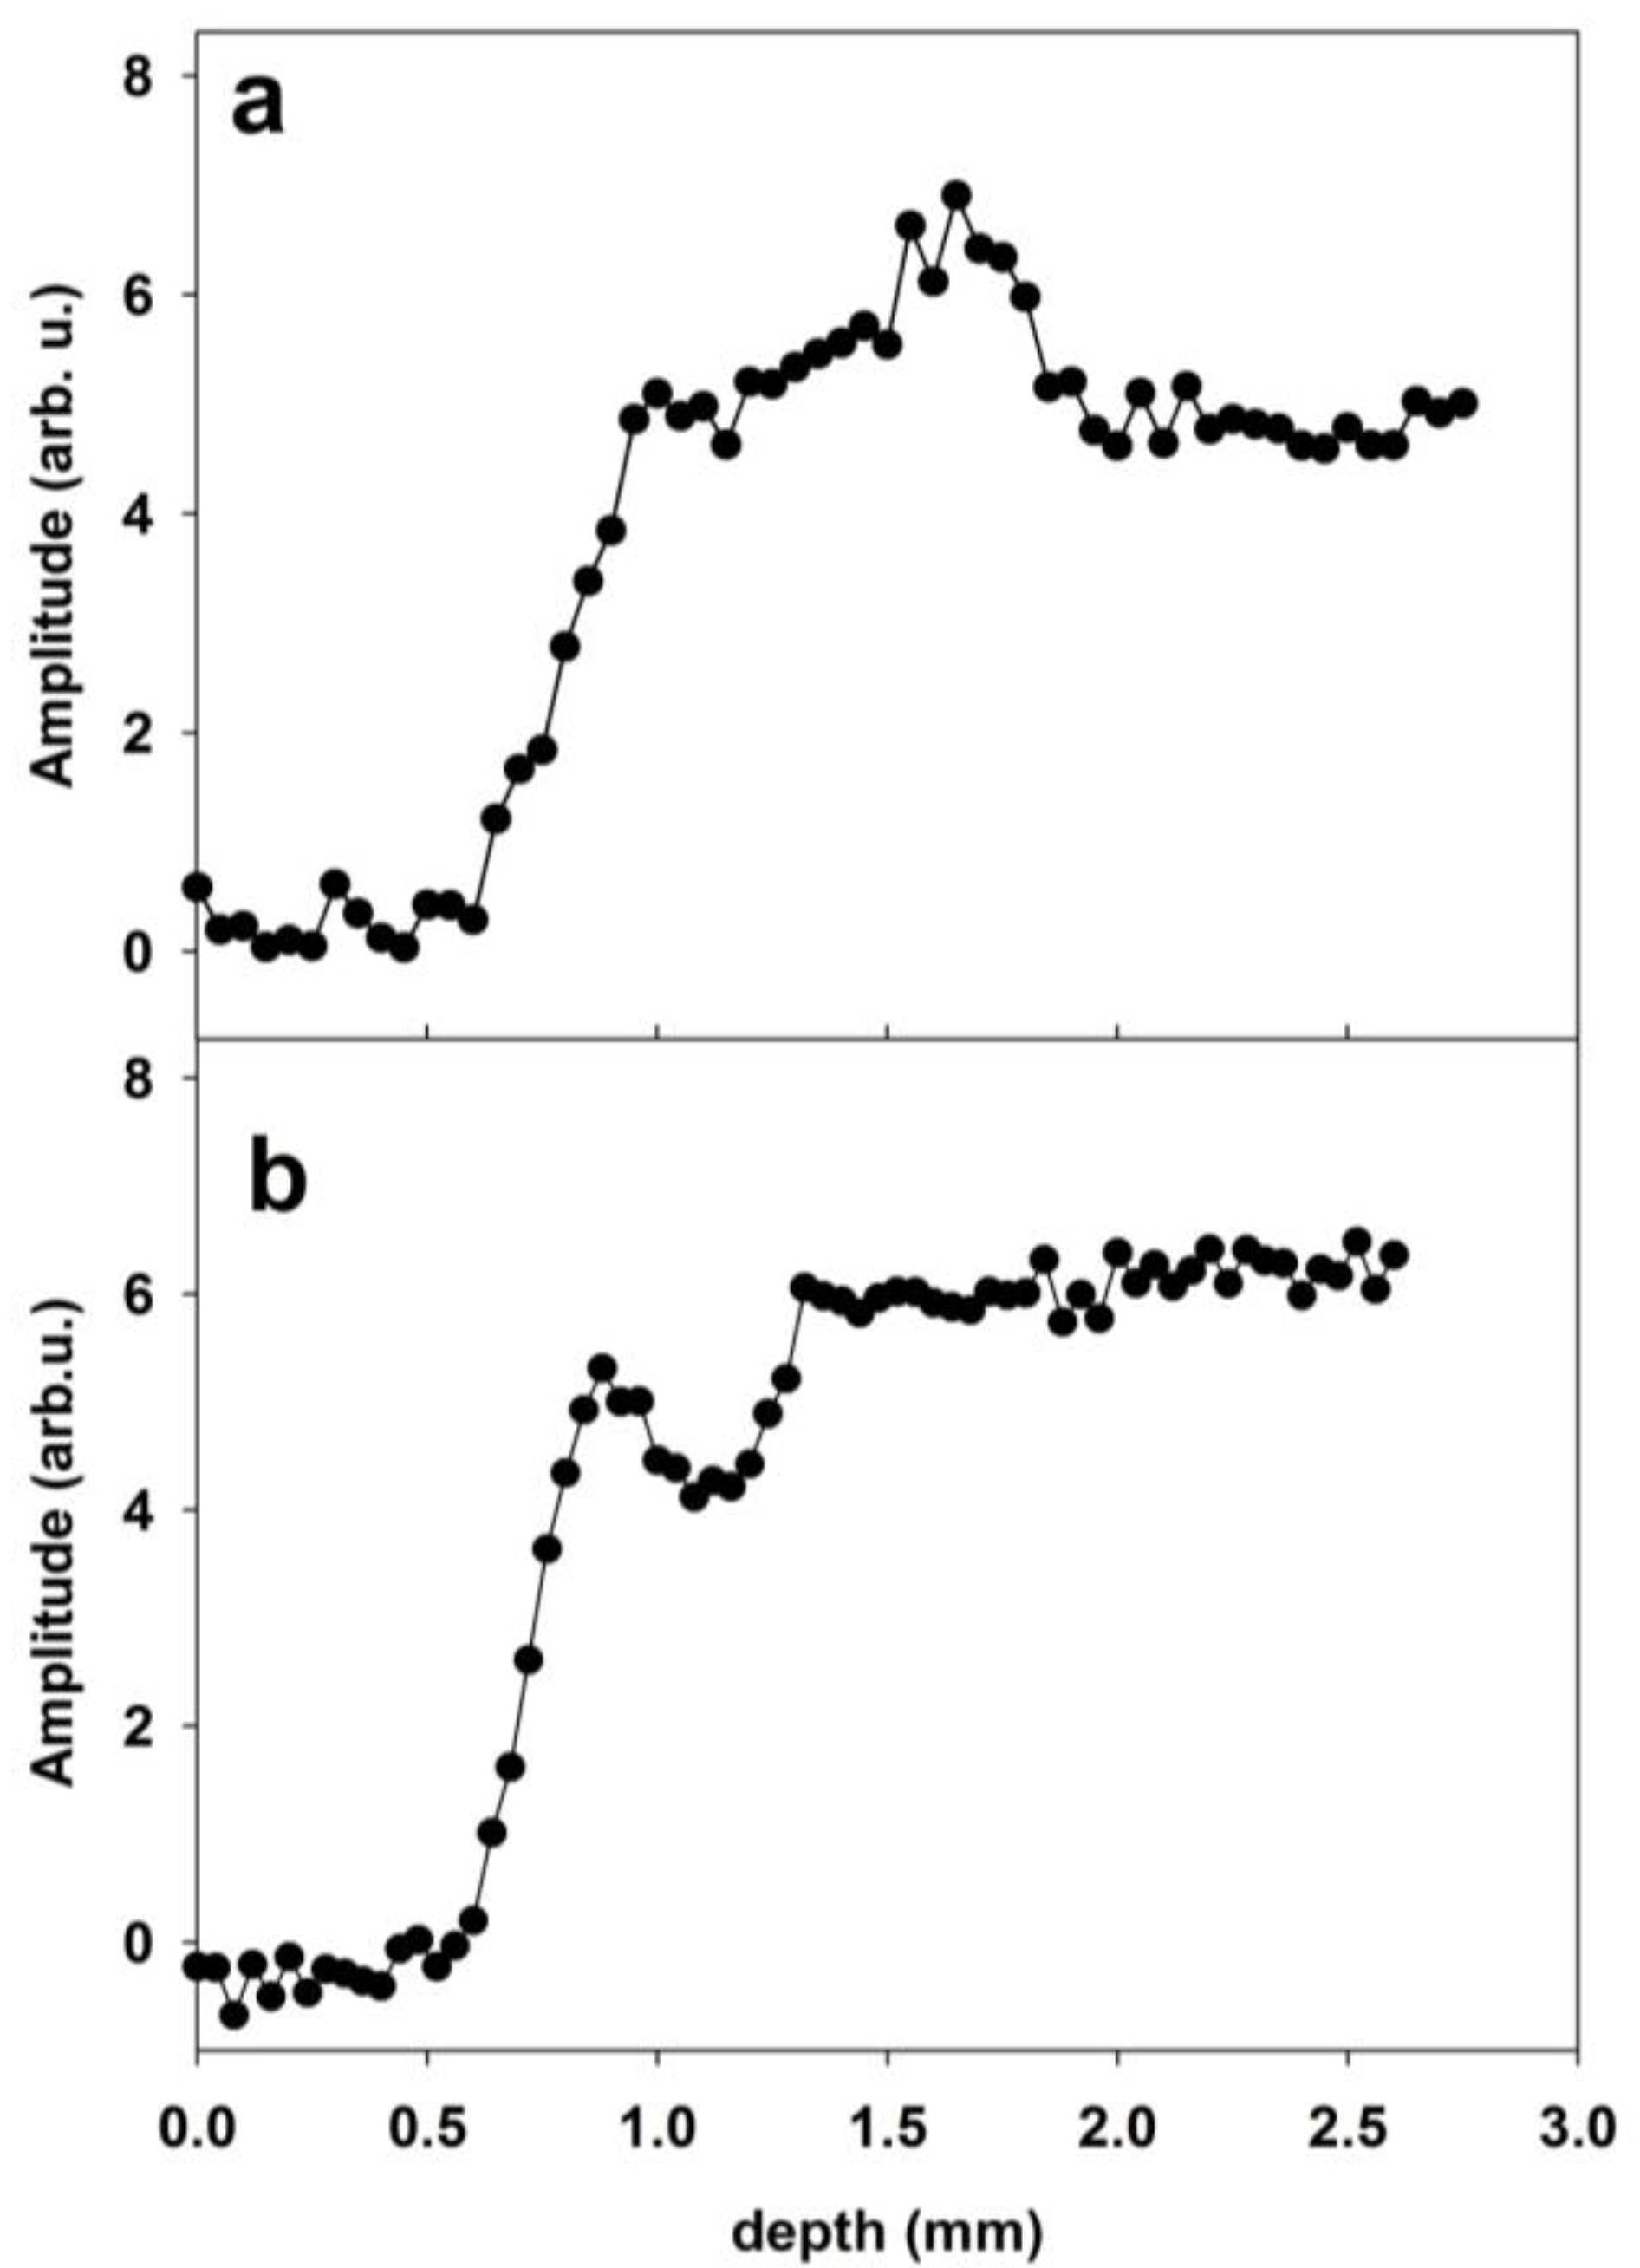
3.6. 1H NMR Stratigraphy of an Ancient Icon

NMR stratigraphies were collected by repositioning the sensor in steps of 50 μm to scan from the outermost surface of the painting to a depth of 0.25 cm with a resolution of 92 μm or to a depth of 0.45 cm with a resolution of 57 μm.

3.7. Measurements on Lapis Lazuli

13C MAS spectra were carried out at 100.61 MHz on a Bruker Avance 400 spectrometer (Bruker, Bremen, Germany). Samples were packed into 4 mm zirconia rotors and sealed with Kel-F caps. The spin-rate was 8 KHz. The 90° pulse width was 3.5 μs, the relaxation delay was 10 s, 4000 scans were collected. 13C chemical shifts were reported in ppm with respect to tetramethylsilane.

4. Conclusions

In this paper case studies regarding the use of NMR techniques for characterizing and monitoring artefacts were reported. These cases, though not exhaustive, indicate that NMR can be extensively applied to cultural heritage.
Because new NMR techniques and methods are continuously being developed and improved to enhance the sensitivity of this technique, in the next years NMR will be probably increasingly employed in the field of cultural heritage. In fact NMR is a key tool for the chemical characterization of soluble and insoluble materials constituting artefacts and may help to shed light on the techniques used by the artists. NMR is also an important tool to understand transformations and structural modifications caused by degradation processes occurring in artefacts. The development of portable NMR sensors suitable for non-destructive and non-invasive analysis in situ has made possible the investigation of precious and unmovable artefacts, and their monitoring over time. The use of portable NMR combined with the use of laboratory NMR techniques that require ever smaller amounts of sample will probably make NMR more and more competitive with other analytical techniques traditionally applied in the field of cultural heritage.

Conflicts of Interest

The authors declare no conflict of interest.

References

  1. Ernst, R.R.; Bodenhausen, G.; Wokaun, A. Principles of Nuclear Magnetic Resonance in One and Two Dimensions; Clarendon Press: Oxford, UK, 1987. [Google Scholar]
  2. Schmidt-Rohr, K.; Spiess, H.W. Multidimensional Solid-State NMR and Polymers; Academic Press: London, UK, 1994. [Google Scholar]
  3. MacKenzie, K.J.D.; Smith, M.E. Multinuclear Solid-State NMR of Inorganic Materials; Pergamon Materials Series 6; Elsevier Science Ltd.: Amsterdam, The Netherlands, 2002. [Google Scholar]
  4. Spraul, M.; Feund, A.S.; Nast, R.E.; Withers, R.S.; Maas, W.E.; Corcoran, O. Advancing NMR sensitivity for LC-NMR-MS using a cryoflow probe: Application to the analysis of acetaminophen in urine. Anal. Chem. 2003, 75, 1546–1551. [Google Scholar] [CrossRef]
  5. Schlotterbeck, G.; Ross, A.; Hochstrasser, R.; Senn, H.; Kühn, T.; Marek, D.; Schett, O. High-resolution capillary tube NMR. A miniaturized 5-μL highsensitivity TXI Probe for mass-limited samples, off-line LC NMR, and HT NMR. Anal. Chem. 2002, 74, 4464–4471. [Google Scholar] [CrossRef] [PubMed]
  6. Alam, T.M.; Jenkins, J.E. HR-MAS NMR Spectroscopy in Material Science. In Advanced Aspect of Spectroscopy; InTech: Rijeka, Croatia, 2012; pp. 279–306. [Google Scholar]
  7. Blümich, B.; Perlo, J.; Casanova, F. Mobile single-sided NMR. Prog. Nucl. Magn. Reson. Spectrosc. 2008, 52, 197–269. [Google Scholar] [CrossRef]
  8. Blümich, B.; Casanova, F.; Perlo, J.; Anferova, S.; Anferov, V.; Kremer, K.; Goga, N.; Kupferschläger, K.; Adams, M. Advances of unilateral mobile NMR in nondestructive materials testing. Magn. Reson. Imaging 2005, 23, 197–201. [Google Scholar] [CrossRef] [PubMed]
  9. Blümich, B.; Anferova, S.; Kremer, K.; Sharma, S.; Herrmann, V.; Segre, A.L. Unilateral NMR for Quality Control: The NMR-MOUSE®. Spectroscopy 2003, 18, 18–32. [Google Scholar]
  10. Capitani, D.; Di Tullio, V.; Proietti, N. Nuclear Magnetic Resonance to characterize and monitor Cultural Heritage. Prog. Nucl. Magn. Reson. Spectrosc. 2012, 64, 29–69. [Google Scholar] [CrossRef] [PubMed]
  11. Blümich, B.; Casanova, F.; Perlo, J.; Presciutti, F.; Anselmi, C.; Doherty, B. Noninvasive testing of art and cultural heritage by mobile NMR. Acc. Chem. Res. 2010, 43, 761–770. [Google Scholar] [CrossRef] [PubMed]
  12. Baias, M. Mobile NMR: An essential tool for protecting our cultural heritage. Magn. Reson. Chem. 2017, 55, 33–37. [Google Scholar] [CrossRef] [PubMed]
  13. Haber, A.; Blümich, B.; Souvorova, D.; Del Federico, E. Ancient Roman walls mapped non-destructively by portable NMR. Anal. Bioanal. Chem. 2011, 401, 1441–1452. [Google Scholar] [CrossRef] [PubMed]
  14. Blümich, B.; Casanova, F.; Harber, A.; Del Federico, E.; Boardman, V.; Stiliano, A.; Wald, G.; Isolani, L. Non-Invasive Depth-Profiling of Walls by Portable Nuclear Magnetic Resonance. Anal. Bioanal. Chem. 2010, 397, 3117–3125. [Google Scholar] [CrossRef] [PubMed]
  15. Fife, G.R.; Stabik, B.; Kelley, A.E.; King, J.N.; Blümich, B.; Hoppenbrouwers, R.; Meldrum, T. Characterization of aging and solvent treatments of painted surfaces using single-sided NMR. Magn. Reson. Chem. 2015, 53, 58–63. [Google Scholar] [CrossRef] [PubMed]
  16. Presciutti, F.; Perlo, J.; Casanova, F.; Glöggler, S.; Miliani, C.; Blümich, B.; Brunetti, B.G.; Sgamellotti, A. Noninvasive nuclear magnetic resonance profiling of painting layers. Appl. Phys. Lett. 2008, 93, 033505-1–033505-3. [Google Scholar] [CrossRef]
  17. Proietti, N.; Di Tullio, V.; Presciutti, F.; Gentile, G.; Brunetti, B.G.; Capitani, D. A Multi-Analytical study of ancient nubian detached mural paintings. Microchem. J. 2016, 125, 719–725. [Google Scholar] [CrossRef]
  18. Di Tullio, V.; Capitani, D.; Atrei, A.; Benetti, F.; Perra, G.; Presciutti, F.; Proietti, N.; Marchettini, N. Advanced NMR methodologies and micro-analytical techniques to investigate the stratigraphy and materials of 14th century Sienese Wooden Paintings. Microchem. J. 2016, 125, 208–218. [Google Scholar] [CrossRef]
  19. Proietti, N.; Capitani, D.; Di Tullio, V. Applications of Nuclear Magnetic Resonance Sensors to Cultural Heritage. Sensor 2014, 14, 6977–6997. [Google Scholar] [CrossRef] [PubMed]
  20. Del Federico, E.; Centeno, S.; Kehlet, C.; Currier, P.; Jerschow, A. Unilateral NMR applied to the conservation of works of art. Anal. Bioanal. Chem. 2010, 396, 213–222. [Google Scholar] [CrossRef] [PubMed]
  21. Lepore, A.; Baccaro, S.; Casieri, C.; Cemmi, A.; De Luca, F. Role of water in the ageing mechanism of paper. Chem. Phys. Lett. 2012, 531, 206–209. [Google Scholar] [CrossRef]
  22. Oligschläger, D.; Waldow, S.; Haber, A.; Zia, W.; Blümich, B. Moisture dynamics in wall paintings monitored by single-sided NMR. Magn. Reson. Chem. 2015, 53, 48–57. [Google Scholar] [CrossRef] [PubMed]
  23. Di Tullio, V.; Proietti, N.; Gobbino, M.; Capitani, D.; Olmi, R.; Priori, S.; Riminesi, C.; Giani, E. Non-destructive mapping of dampness and salts in degraded wall paintings in hypogeous building: The case of St. Clement at mass fresco in St. Clement Basilica, Rome. Anal. Bioanal. Chem. 2010, 396, 1885–1896. [Google Scholar] [CrossRef] [PubMed]
  24. Capitani, D.; Proietti, N.; Gobbino, M.; Soroldoni, L.; Casellato, U.; Valentini, M.; Rosina, E. An integrated study for mapping the moisture distribution in an ancient damaged wall painting. Anal. Bioanal. Chem. 2009, 395, 2245–2253. [Google Scholar] [CrossRef] [PubMed]
  25. Catalano, J.; Yao, Y.; Murphy, A.; Zumbulyadis, N.; Centeno, S.A.; Dybowski, C. Nuclear magnetic resonance spectra and 207Pb chemical-shift tensors of lead carboxylates relevant to soap formation in oil paintings. Appl. Spectrosc. 2014, 68, 280–286. [Google Scholar] [CrossRef] [PubMed]
  26. Catalano, J.; Murphy, A.; Yao, Y.; Alkan, F.; Zumbulyadis, N.; Centeno, S.A.; Dybowski, C. 207Pb and 119Sn Solid-State NMR and Relativistic Density Functional Theory Studies of the Historic Pigment Lead–Tin Yellow Type I and Its Reactivity in Oil Paintings. J. Phys. Chem. A 2014, 18, 7952–7958. [Google Scholar] [CrossRef] [PubMed]
  27. Del Federico, E.; Centeno, S.A.; Kehlet, C.; Ulrich, K.; Yamazaki-Kleps, A.; Jerschow, A. In Situ Unilateral 1H-NMR Studies of the Interaction Between Lead White Pigments and Collagen-Based Binders. Appl. Magn. Reson. 2012, 42, 363–376. [Google Scholar] [CrossRef]
  28. Kobayashi, T.; Perras, F.A.; Murphy, A.; Yao, Y.; Catalano, J.; Centeno, S.A.; Dybowski, C.; Zumbulyadis, N.; Pruski, M. DNP-enhanced ultrawideline 207Pb solid-state NMR spectroscopy: An application to cultural heritage science. Dalton Trans. 2017, 46, 3535–3540. [Google Scholar] [CrossRef] [PubMed]
  29. Del Federico, E.; Schoefberger, W.; Jerschow, A.; Tyne, L.; Schelvis, J.; Kapetanaki, S. Insight into Framework Destruction in Ultramarine Pigments. Inorg. Chem. 2006, 45, 1270–1276. [Google Scholar] [CrossRef] [PubMed]
  30. Holmes, S.T.; Dybowski, C. Carbon-13 chemical-shift tensors in indigo: A two-dimensional NMR-ROCSA and DFT Study. Solid State Nucl. Magn. Reson. 2015, 7, 90–95. [Google Scholar] [CrossRef] [PubMed]
  31. Spyros, A.; Anglos, D. Studies of organic paint binders by NMR spectroscopy. Appl. Phys. A 2006, 83, 705–708. [Google Scholar] [CrossRef]
  32. Sfakianaki, S.; Kouloumpi, E.; Anglos, D.; Spyros, A. Egg yolk identification and aging in mixed paint binding media by NMR spectroscopy. Magn. Reson. Chem. 2015, 53, 22–26. [Google Scholar] [CrossRef] [PubMed]
  33. Stamatakis, G.; Knuutinen, U.; Laitinen, K.; Spyros, A. Analysis and aging of unsaturated polyester resins in contemporary art installations by NMR spectroscopy. Anal. Bioanal. Chem. 2010, 398, 3203–3214. [Google Scholar] [CrossRef] [PubMed]
  34. Proietti, N.; Di Tullio, V.; Capitani, D.; Tomassini, R.; Guiso, M. Nuclear Magnetic Resonance in contemporary art: The case of Moon Surface by Turcato. Appl. Phys. A Mater. Sci. Process. 2013, 113, 1009–1017. [Google Scholar] [CrossRef]
  35. Ulrich, K.; Centeno, S.A.; Arslanoglu, J.; Del Federico, E. Absorption and diffusion measurements of water in acrylic paint films by single-sided NMR. Prog. Organ. Coat. 2011, 71, 283–289. [Google Scholar] [CrossRef]
  36. Bardet, M.; Pournou, A. Fossil wood from the Miocene and Oligocene epoch: Chemistry and morphology. Magn. Reson. Chem. 2015, 53, 9–14. [Google Scholar] [CrossRef] [PubMed]
  37. Bardet, M.; Pournou, A. NMR Studies of Fossilized Wood. Ann. Rep. NMR Spectrosc. 2017, 90, 41–83. [Google Scholar]
  38. Bardet, M.; Gerbaud, G.; Doan, C.; Giffard, M.; Hediger, S.; De Paëpe, G.; Trân, Q.K. Dynamics property recovery of archaeological-wood fibers treated with polyethylene glycol demonstrated by high-resolution solid-sate NMR. Cellulose 2012, 19, 1537–1545. [Google Scholar] [CrossRef]
  39. Bardet, M.; Gerbaud, G.; Giffard, M.; Doan, C.; Hediger, S.; Le Pape, L. 13C high-resolution solid-sate NMR for structural elucidation of archaeological woods. Prog. Nucl. Magn. Reson. Spectrosc. 2009, 55, 199–224. [Google Scholar] [CrossRef]
  40. Bardet, M.; Gerbaud, G.; Le Pape, L.; Hediger, S.; Trân, Q.K.; Boumlil, N. NMR and EPR as Analytical Tools to Investigate Structural Features of Archaeological Leathers. Anal. Chem. 2009, 81, 1505–1511. [Google Scholar] [CrossRef] [PubMed]
  41. Badea, E.; Şendrea, C.; Carşote, C.; Adams, A.; Blümich, B.; Iovu, H. Unilateral NMR and thermal microscopy studies of vegetable tanned leather exposed to dehydrothermal treatment and light irradiation. Microchem. J. 2016, 129, 158–165. [Google Scholar] [CrossRef]
  42. Lambert, J.B.; Santiago-Blay, J.A.; Wu, Y.; Allison, J. Levy Examination of amber and related materials by NMR spectroscopy. Magn. Reson. Chem. 2015, 53, 2–8. [Google Scholar] [CrossRef] [PubMed]
  43. Lambert, J.B.; Tsai, C.Y.H.; Shah, M.C.; Hurtley, A.E.; Santiago-Blay, J.A. Distinguishing Amber And Copal Classes By Proton Magnetic Resonance Spectroscopy. Archaeometry 2012, 54, 332–348. [Google Scholar] [CrossRef]
  44. Casieri, C.; De Luca, F.; Nodari, L.; Russo, U.; Terenzi, C.; Tudisca, V. Effects of time and temperature of firing on Fe-rich ceramics studied by Mossbauer spectroscopy and two-dimensional H-1-nuclear magnetic resonance relaxometry. J. Appl. Phys. 2012, 112. [Google Scholar] [CrossRef]
  45. Casieri, C.; Terenzi, C.; De Luca, F. Two-dimensional longitudinal and transverse relaxation time correlation as a low-resolution nuclear magnetic resonance characterization of ancient ceramics. J. Appl. Phys. 2009, 105, 034901. [Google Scholar] [CrossRef]
  46. Terenzi, C.; Casieri, C.; De Luca, F.; Quaresima, R.; Quarta, G.; Tudisca, V. Firing-Induced Microstructural Properties of Quasi-Diamagnetic Carbonate-Based Porous Ceramics: A 1H NMR Relaxation Correlation Study. Appl. Magn. Reson. 2015, 46, 1159–1178. [Google Scholar] [CrossRef]
  47. Camaiti, M.; Fantazzini, P.; Bortolotti, V. Stone Porosity, wettability changes and other features detected by MRI and NMR relaxometry: A more than 15-year study. Magn. Reson. Chem. 2015, 53, 34–47. [Google Scholar] [CrossRef] [PubMed]
  48. Di Tullio, V.; Cocca, M.; Avolio, R.; Gentile, G.; Proietti, N.; Ragni, P.; Errico, M.E.; Capitani, D.; Avella, M. Unilateral NMR investigation of multifunctional treatments on stones based on colloidal inorganic and organic nanoparticles. Magn. Reson. Chem. 2015, 53, 64–77. [Google Scholar] [CrossRef] [PubMed]
  49. Brai, M.; Casieri, C.; De Luca, F.; Fantazzini, P.; Gombia, M.; Terenzi, C. Validity of NMR pore-size analysis of cultural heritage ancient building materials containing magnetic impurities. Solid State Nucl. Magn. Reson. 2007, 25, 461–465. [Google Scholar] [CrossRef] [PubMed]
  50. Di Tullio, V.; Proietti, N.; Capitani, D.; Nicolini, I.; Mecchi, A.M. NMR depth profiles as a non-invasive analytical tool to probe the penetration depth of hydrophobic treatments and inhomogeneities in treated porous stones. Anal. Bioanal. Chem. 2011, 400, 3151–3164. [Google Scholar] [CrossRef] [PubMed]
  51. Presciutti, F.; Doherty, B.; Anselmi, C.; Brunetti, B.G.; Sgamellotti, A.; Miliani, C. A non-invasive NMR relaxometric characterization of the cyclododecane–solvent system insideporous substrates. Magn. Reson. Chem. 2015, 53, 27–33. [Google Scholar] [CrossRef] [PubMed]
  52. Canevali, C.; Fasoli, M.; Bertasa, M.; Botteon, A.; Colombo, A.; Di Tullio, V.; Capitani, D.; Proietti, N.; Scalarone, D.; Sansonetti, A. A multi-analytical approach for the study of copper stain removal by agar gels. Microchem. J. 2016, 129, 249–258. [Google Scholar] [CrossRef]
  53. Di Tullio, V.; Capitani, D.; Proietti, N. Unilateral NMR to study water diffusion and absorption in stone-hydrogel systems. Microporous Mesoporous Mater. 2017. [Google Scholar] [CrossRef]
  54. Angelova, L.; Ormsby, B.; Richardson, E. Diffusion of water from a range of conservation treatment gels into paint films studied by unilateral NMR. Part I. Acrylic emulsion paint. Microchem. J. 2016, 124, 311–320. [Google Scholar] [CrossRef]
  55. Capitani, D.; Di Tullio, V.; Proietti, N. Advanced Nuclear Magnetic Resonance Methodologies in Cultural Heritage. In Cultural Heritage Protection, Developments and International Perspectives; Frediani, P., Frediani, M., Rosi, L., Eds.; Nova Science Publishers, Inc.: New York, NY, USA, 2013. [Google Scholar]
  56. Troiano, F.; Gulotta, D.; Balloi, A.; Polo, A.; Toniolo, L.; Lombardi, E.; Daffonchio, D.; Sorlin, C.; Cappitelli, F. Successful combination of chemical and biological treatments for the cleaning of stone artworks. Int. Biodeterior. Biodegrad. 2013, 85, 294–304. [Google Scholar] [CrossRef]
  57. Burnstock, A.; White, R. Cleaning gels: Further studies. In Conservation Science in the UK; Tennent, N.H., Ed.; James & James: London, UK, 1993; pp. 36–39. [Google Scholar]
  58. Gioventù, E.; Lorenzi, P.F.; Villa, F.; Sorlini, C.; Rizzi, M.; Cagnini, A.; Griffo, A.; Cappitelli, F. Comparing the bioremoval of black crusts on colored artistic lithotypes of the Cathedral of Florence with chemical and laser treatment. Int. Biodeterior. Biodegrad. 2011, 65, 832–839. [Google Scholar] [CrossRef]
  59. Gauri, K.L.; Bandyopadhyay, J.K. Carbonate Stone: Chemical Behaviour, Durability and Conservation; John Wiley & Sons: New York, NY, UK, 1999. [Google Scholar]
  60. Baglioni, M.; Giorgi, R.; Berti, D.; Baglioni, P. Smart cleaning of cultural heritage: A new challenge for soft nanoscience. Nanoscale 2012, 4, 42–53. [Google Scholar] [CrossRef] [PubMed]
  61. Lu, Y.; Sathasivam, S.; Song, J.; Crick, C.R.; Carmalt, C.J.; Parkin, I.P. Robust self-cleaning surfaces that function when exposed to either air or oil. Science 2015, 347, 1132–1135. [Google Scholar] [CrossRef] [PubMed]
  62. Challagan, P.T. Principles of Nuclear Magnetic Resonance Microscopy; Clarendon Press: Oxford, UK, 1991. [Google Scholar]
  63. Homans, S.W. A Dictionary of Concepts in NMR; Clarendon Press: Oxford, UK; New York, NY, USA, 1992. [Google Scholar]
  64. Kimmich, R. NMR: Tomography, Diffusiometry, Relaxometry; Springer: Berlin, Germany, 1979. [Google Scholar]
  65. Rata, D.G.; Casanova, F.; Perlo, J.; Demco, D.E.; Blümich, B. Self-diffusion measurements by a mobile single-sided NMR sensor with improved magnetic field gradient. J. Magn. Reson. 2006, 180, 229–235. [Google Scholar] [CrossRef] [PubMed]
  66. Amoroso, V.G.G.; Fassina, V. Stone Decay and Conservation; Elsevier: Lausanne, Switzerland, 1983. [Google Scholar]
  67. Camuffo, D. Physical weathering of stones. Sci. Total Environ. 1995, 167, 1–14. [Google Scholar] [CrossRef]
  68. Di Zenzo, S. A Note on the Gradient of a Multi-Image. Comput. Vis. Graph. Image Process. 1986, 33, 116–125. [Google Scholar] [CrossRef]
  69. Couran, R.; Herbert, R.; Ian, S. What is Mathematics? An Elementary Approach to Ideas and Methods; Oxford University Press: New York, NY, USA, 1996; p. 344. [Google Scholar]
  70. Watson, A.T.; Chang, C.T. Characterizing porous media with NMR methods. Prog. Nucl. Magn. Reson. Spectrosc. 1997, 31, 343–386. [Google Scholar] [CrossRef]
  71. Ferreira Pinto, A.P.; Delgado Rodrigues, J. Stone consolidation: The role of treatment procedures. J. Cult. Heritage 2008, 9, 38–53. [Google Scholar] [CrossRef]
  72. Miliani, C.; Daveri, A.; Brunetti, B.G.; Sgamellotti, A. CO2 entrapment in natural ultramarine blue. Chem. Phys. Lett. 2008, 466, 148–151. [Google Scholar] [CrossRef]
  73. Omi, H.; Ueda, T.; Miyakubo, K.; Eguchi, T. Dynamics of CO2 molecules confined in the micropores of solids as studied by 13C NMR. Appl. Surf. Sci. 2005, 252, 660–667. [Google Scholar] [CrossRef]
  74. SefciK, M.D.; Schaefer, J.; Stejskal, E.O. Molecular Sieves II; Katzer, J.R., Ed.; ACS Symposium Series; American Chemical Society: Washington, DC, USA, 1977; Volume 40. [Google Scholar]
  75. Perlo, J.; Casanova, F.; Blümich, B. Profiles with microscopic resolution by single-sided NMR. J. Magn. Reson. 2005, 176, 64–70. [Google Scholar] [CrossRef] [PubMed]
  76. Perlo, J.; Casanova, F.; Blümich, B. Single-Sided NMR; Springer-Verlag: Berlin, Germany, 2011. [Google Scholar]
  77. Goelman, G.; Prammer, M.G. The CPMG pulse sequence in strong magnetic field gradients with applications to oil-well logging. J. Magn. Reson. 1995, 113, 11–18. [Google Scholar] [CrossRef]
  78. Hurlimann, M.D.; Griffin, D.D. Spin dynamics of Carr-Purcell-Meiboom-Gill-like sequences in grossly inhomogeneous B(0) and B(1) fields and application to NMR well logging. J. Magn. Reson. 2000, 143, 120–125. [Google Scholar] [CrossRef] [PubMed]
  79. Belton, P.S. NMR and the mobility of water in polysaccharide gels. Int. J. Biol. Macromol. 1997, 21, 81–88. [Google Scholar] [CrossRef]
Figure 1. 1H NMR depth profiles of water released into wall painting specimens after (a) 1-h and (b) 4-h application of Carbogel, Sepiolite, Laponite, and Gellan gum/bacteria cleaning systems.
Magnetochemistry 04 00011 g001
Figure 2. 1H NMR depth profiles in the presence of a degraded organic layer of shellac (T), and after applying a cleaning procedure to remove shellac (TC). Adapted from [55]. Copyright Nova Science Publishers, Inc., 2013.
Magnetochemistry 04 00011 g002
Figure 3. Single-sided NMR measuring moisture in a wall painting dating back to the XV century located in Nostra Signora del Sacro Cuore Church, Rome, Italy.
Magnetochemistry 04 00011 g003
Figure 4. In (a,b) the moisture distribution maps of regions A and B of the tuff wall affected by capillary rise of water, are reported. The moisture level is shown as a gradient of color, red corresponds to the lowest water content, while dark blue corresponds to the highest water content.
Magnetochemistry 04 00011 g004
Figure 5. Transverse relaxation time distributions measured at different heights in region A of the tuff wall.
Magnetochemistry 04 00011 g005
Figure 6. (a) 1H NMR depth profile collected on a water-saturated untreated sandstone specimen (UT); (b) Profiles collected on water-saturated sandstone specimens treated with dimethylsiloxane (DMS) for 5 s (T5), 600 s (T600), and 1800 s (T1800). Adapted from [50].
Magnetochemistry 04 00011 g006
Figure 7. Carr Purcell Meiboom Gill CPMG magnetization decays measured at a depth of 5 mm on water-saturated sandstone specimens. Adapted from [50]. Copyright Spriger Nature, 2011.
Magnetochemistry 04 00011 g007
Figure 8. T2 relaxation time distributions in sandstone treated with DMS for 1800 s (T1800) at a depth of 1 mm (solid line), and 4 mm (dashed line). Adapted from [50]. Copyright Spriger Nature, 2011.
Magnetochemistry 04 00011 g008
Figure 9. 1H NMR depth profile collected on water-saturated untreated calcarenite (UT), and calcarenite treated with tetraethoxysilane (TEOS) for 5 s (T5), 600 s (T600), and 1800 s (T1800).
Magnetochemistry 04 00011 g009
Figure 10. T2 relaxation time distributions in untreated calcarenite (dashed lines) and calcarenite treated with TEOS for 600 s (solid lines) at 250 μm (a); 500 μm (b); 700 μm (c); and 1000 μm (d) of depth.
Magnetochemistry 04 00011 g010
Figure 11. (a) Single-sided NMR collecting a stratigraphy of the Madonna Hodigitria icon. (b,c) Details of two regions of the icon measured by NMR. Adapted from [19].
Magnetochemistry 04 00011 g011
Figure 12. 1H NMR stratigraphy of (a) region P1 (Virgin’s face), and (b) region P2 (Virgin’s mantle). Adapted from [19].
Magnetochemistry 04 00011 g012
Figure 13. 13C MAS NMR spectra of a sample of Afghan lapis lazuli (bottom), and a sample of synthetic ultramarine (top).
Magnetochemistry 04 00011 g013
Table 1. T1 and T2 relaxation times and relative populations, and the self-diffusion coefficient measured in Carbogel 0.5%, Laponite RD 5%, Sepiolite 6%, and Gellan 2%.
SampleT1 (s)WA (%)T2A (ms)WB (%)T2B (ms)D × 10–9 m2/s
Carbogel 0.5%1.7 ± 0.1106.4 ± 0.89052.2 ± 0.42.05 ± 0.05
Laponite RD 5%1.2 ± 0.194.7 ± 0.49141.9 ± 0.11.89 ± 0.02
Sepiolite 6%0.03 ± 0.01293.4 ± 0.47111.2 ± 0.11.75 ± 0.03
Gellan 2%0.7 ± 0.155.6 ± 0.59539.2 ± 0.11.97 ± 0.02
Table 2. T2 relaxation times and relative populations obtained at different heights in region A of the tuff wall. The error on the parameters is less than 10% of the nominal value.
(x,y) (cm)Wa (%)T2a (ms)Wb (%)T2b (ms)Wc (%)T2c (ms)Wd (%)T2d (ms)
P3 (40,7)140.17380.60401.6382.85
P14 (40,16)290.15360.40341.57---
P12 (40,23)430.18520.5451.58---
P16 (40,31)580.17400.6521.7---
P10 (40,39)690.20210.80-------
Table 3. Parameters obtained fitting depth profiles to Equation (4) and slope at inflection points obtained from Equation (5).
Specimenx1 (mm)Δ1 (mm)w1 (arb.u.)x2 (mm)Δ2 (mm)w2 (arb.u.)R2b1b2
T50.27 ± 0.010.073 ± 0.0082.97 ± 0.091.00 ± 0.030.22 ± 0.041.48 ± 0.090.9914.292.325
T6000.23 ± 0.010.05 ± 0.012.22 ± 0.061.63 ± 0.030.28 ± 0.041.80 ± 0.060.9614.292.174
T18000.31 ± 0.010.08 ± 0.011.82 ± 0.032.39 ± 0.020.30 ± 0.022.37 ± 0.040.998.332.703
Table 4. T2 relaxation times and relative populations measured in sandstone specimens. The error on the parameters is less than 10% of the nominal value.
SpecimenWa (%)T2a (ms)Wb (%)T2b (ms)Wc (%)T2c (ms)
UT400.18400.9204.4
T5420.17421.1164.7
T600380.20440.71164.3
T1800310.20440.93254.1
Table 5. T2 relaxation times and relative populations measured in untreated calcarenite and calcarenite treated with TEOS for 600 s. Measurements were carried out at different depths in the specimens, namely 250, 500, 700, and 1000 μm. The error on the parameters is less than 10% of the nominal value.
Depth (μm)SampleWaT2a (ms)WbT2b (ms)WcT2c (ms)WdT2d (ms)WeT2e (ms)
250UT3%0.0702%0.52--14%12.17281%40.1
T60014%0.09946%0.9435%3.32--5%106.0
500UT--4%0.8117%6.91--89%33.00
T6006%0.09064%1.2524%5.15--6%122.6
700UT--4%0.8510%4.91--86%22.3
T60016%0.10027%0.4348%2.275%13.14%115.2
1000UT9%0.0834%1.18--21%9.866%38.0
T60028%0.12660%2.067%6.84--5%108.0

