Abstract
We studied the electron spin resonance (ESR) line width for localized moments within the framework of the Kondo lattice model. Only for a sufficiently small Kondo temperature can an ESR signal be observed for a Kondo impurity. On the other hand, for a Kondo lattice representing a heavy fermion compound, short-range ferromagnetic correlations (FM) between the localized moments are crucial to observe a signal. The spin relaxation rate (line width) and the static magnetic susceptibility are inversely proportional to each other. The FM enhance the susceptibility and hence reduce the line width. For most of the heavy fermion systems displaying an ESR signal, the FM order arises in the -plane from the strong lattice anisotropy. CeB is a heavy fermion compound with cubic symmetry having a ground-quartet. Four transitions are expected for individual Ce ions with a ground-multiplet, but only one has been observed. Antiferro-quadrupolar order (AFQ) arises below 4 K due to the orbital content of the -quartet. We addressed the effects of the interplay of AFQ and FM on the ESR line width and the phase diagram. It is usually difficult to distinguish among ESR resonances due to localized moments and conducting heavy electron spins, especially for anisotropic Ce and Yb compounds. However, for CeB, an itinerant picture within the AFQ phase is necessary to explain the electron spin resonances. The longitudinal magnetic susceptibility has a quasi-elastic central peak of line width 1/T and inelastic peaks for the absorption/emission of excitations. The latter are measured via inelastic neutron scattering (INS) and provide insights into the magnetic order. We briefly summarize some of the INS results for CeB in the context of the picture that emerged from the ESR experiments.
PACS:
72.15.Qm; 76.30.−v; 75.20.Hr; 71.27.+a
1. Introduction
The Kondo effect is the compensation into a singlet state of an impurity with spin-1/2 by the spin density of the conduction electrons. Consequently, the impurity spin S is no longer a good quantum number and the magnetic susceptibility and the spin-relaxation time are finite. According to the Shiba relation [1,2] for , and are proportional to each other () and inversely proportional to the characteristic energy, , known as the Kondo temperature. Hence, for a Kondo impurity, an electron spin resonance (ESR) signal is not observed unless is smaller than 100 mK for X-band microwave frequencies [3].
The above suggests that, in heavy fermion compounds, the ESR line width is too broad to be observed. However, recently, an ESR signal was found in single crystals of YbRhSi [4,5,6], YbIrSi [7], YbRh [8], YbCoZn [9], CeRuPO [10], and CeB [11,12] proving this common belief incorrect. The resonances are attributed to the Yb and Ce ions despite their rather large . Common to all these compounds is a strong magnetic anisotropy (except for CeB) with the easy-axis in the plane, as well as ferromagnetic correlations among the rare earth spins [8]. Due to the skin depth and spin diffusion in a metallic environment, the observed resonances have a Dysonian line shape [13,14,15].
The resonance of local magnetic moments in a metal [16,17,18] and the ESR of conduction electrons are very difficult to distinguish since both have the same Dysonian line shape [13,14,15]. The data were analyzed within the known framework of ESR of magnetic impurities in metals [16,17,18], i.e., single ions with localized spins resonating independently. The g-factor and the line width are anisotropic as expected for a tetragonal crystalline electric field. An estimate indicates that, in YbRhSi, more than 60% of the Yb ions contribute to the ESR signal [7,19]. In the case of a band of conducting heavy electrons, on the other hand, the g-shift is dominated by one of the f orbitals via hybridization and is going to have the crystalline field anisotropies of the rare-earth sites. Hence, based solely on ESR it is then difficult to decide if the resonances arise from the carriers in a heavy-electron band or localized moments [20].
Within the framework of the Anderson lattice, the line width of the ESR signal for a heavy fermion compound was investigated by Abrahams and Wölfle [21]. They concluded that the heavy mass in conjunction with ferromagnetic fluctuations can lead to observable narrow resonances. The heavy mass is equivalent to arguing with a small Kondo temperature for the lattice, but this alone is not enough to produce an observable ESR signal. The line width of the signal is further reduced by the ferromagnetic correlations. There is good agreement of this theory with experimental data in the Fermi liquid regime for YbRhSi [22]. Further extensions of the theory to the non-Fermi liquid regime of this material lead to a close relation of the T dependence of the specific heat and spin susceptibility with the observed T dependence of the g-shift and the line width [23,24].
Considering the framework of the Kondo lattice rather than the Anderson lattice, Schlottmann [20] studied the dynamical susceptibility for localized spins and arrived at similar results to those in Ref. [21]. Based on the proportionality of the line width with the inverse magnetic susceptibility, this investigation clearly shows the relevance of the ferromagnetic correlations. The Kondo effect replaces the Curie-law with a Curie–Weiss law with an antiferromagnetic Weiss temperature slightly larger than the Kondo temperature giving rise to a wide ESR line, which is too broad to be observed. On the other hand, ferromagnetic long-range order changes the sign of the Curie–Weiss temperature and hence enhances the susceptibility in the paramagnetic phase, yielding an observable resonance.
There are several other proposals to explain the ESR in heavy fermion systems. On the one hand, Zvyagin et al. [25] showed that strong local anisotropic electron–electron interactions in the system together with a hybridization between localized and itinerant electrons can give rise to a g-shift of the ESR signal and cause a change in the line width. On the other hand, Huber [26], with main emphasis on the anisotropy of the g-shift, studied the low-field ESR in YbRhSi and YbIrSi taking into account the effects of anisotropy and the Yb-Yb interactions. Finally, Kochelaev et al. [27] investigated the relaxation of a collective spin mode considering the anisotropic Kondo model with anisotropic Ruderman-Kittel-Kasuya-Yosida (RKKY) interaction, assuming that the Kondo coupling and the g-factor have the same anisotropy ratio.
The remainder of the paper is organized as follows. In Section 2, we introduce the Kondo lattice model and the transverse dynamical susceptibility. The dynamical susceptibility is explicitly calculated in terms of a relaxation function using second order perturbation theory in the exchange coupling. Single site terms and inter-site contributions are treated separately. In Section 3, we discuss the consequences for impurities and for the lattice considering a paramagnetic host, an antiferromagnetic lattice and ferromagnetic correlations. In Section 4, we summarize our results for the cubic system CeB. In this compound, the Ce ions have a -quartet ground state, allowing for a richer spectrum of resonances. In Section 5, we study the longitudinal dynamical susceptibility, which yields the spin-flip relaxation time and is of relevance for neutron scattering. Finally, conclusions follow in Section 6.
2. The Kondo Lattice Model and the Transversal Dynamical Susceptibility
We consider the Kondo lattice which consists of conduction electrons and a spin at every lattice site interacting with each other via spin exchange J. The Hamiltonian then consists of the kinetic energy of the conduction states, the Zeeman splitting of the spins in a magnetic field and the exchange coupling, i.e., , with
where j labels the lattice sites and denotes the position of the site j. The spin-1/2 operators for the localized spin at site j are denoted and represents 1/2 times the Pauli matrices for the conduction states. For the Zeeman splitting of the conduction electrons, we have , where . It is convenient to work with the Hartree–Fock factorization of , i.e., we replace
which corresponds to the “Knight-shift” of the magnetic resonance.
The ESR line is given by the transverse dynamical susceptibility. According to Equation (1), the Zeeman field is along the z-direction and, hence, the microwave field rotates in the plane, i.e.,
where N is the number of rare earth sites, are the spin-flip operators at site j, is the external frequency, and the factor 1/2 is introduced to normalize the susceptibility (note that the and correlation functions are equal). The spin operators satisfy the standard commutation relations, and , while spin operators of different sites commute with each other.
Applying equation of motion on the first argument of the susceptibility, we obtain
where is the spin polarization per site and
The equation of motion on the second argument yields
which can be evaluated for the noninteracting system and rewritten as
Here, represents the Fermi distribution function and we have neglected the Zeeman field of the conduction electrons, except in .
The dynamics of the magnetic moments is usually described by Bloch’s equations [28], which can be cast into the form [29,30]
where is the effective Zeeman splitting and is the static transverse magnetic susceptibility. For the noninteracting system, we have . is called the relaxation function. Assuming that is an imaginary constant at low frequencies, we can identify with and Equation (8) reduces to a Lorentzian resonance shape [29]. Comparing Equations (4) and (7) with Equation (8), we obtain the relaxation function to second order in the exchange J [29], i.e.,
We are mainly interested in the imaginary part of . The first term in Equation (7) is real and does not contribute. For the remaining terms, the angular integrals of momenta are carried out and the factors in the denominator are converted into -functions, so that for a parabolic band we obtain
It is convenient to treat single site and multiple site terms separately. Using that , we obtain for the single site contribution
which agrees with the result of Ref. [29], and for the multi-site terms
where l is the spin mean-free path due to the spin-lattice relaxation. Our spin S is actually a pseudo-spin arising from the crystalline field splittings of the rare earth total angular momentum. As such, it has a large orbital component due to the strong spin-orbit interaction. This way, when the conduction electrons travel, their “spin” relaxes into the lattice (spin-lattice relaxation).
The resonance takes place at the field and the spin relaxation rate is now given by
where .
3. Special Cases
In this section, we discuss the consequences of the single site and multiple site contributions for different magnetic orders of the host.
3.1. Korringa Relaxation
For the isolated impurity case, we consider only the single site terms. The single site relaxation function can be regularized into an analytic function [29]
where is the digamma function and D is the band cut-off. This is the exact expression to second order in J of the relaxation function.
We now expand the relaxation kernel for small using , i.e., . The dynamical susceptibility has then a Lorentzian shape with a relaxation rate [29]
where
Re and Im denote real and imaginary part, respectively, and represents the retardation effects arising from the frequency dependence of . The calculation of to second order in the exchange only requires the free ion and [29].
In the zero-field limit, we obtain the well-established Korringa relaxation rate
which is proportional to T. Here, the factor T arises from the inverse of , while, alternatively and equivalently, in textbook calculations, the T originates from the integration over the Fermi functions for the conduction electrons.
For , on the other hand, the relaxation rate is
which shows an almost linear increase of the line width with the external field. Consequently, at low temperatures, the residual line width in Q-band ESR should be larger than the corresponding one for X-band, as found in many experiments.
3.2. The Kondo Impurity
Above, we considered second order perturbation theory in J. Terms of higher order in J introduce the Kondo effect. Both, the static susceptibility and the relaxation function , are affected by the logarithmic corrections due to the Kondo effect.
For the case , the Kondo terms appear as logarithmic corrections as a consequence of the renormalization of the interaction vertex. The dressed vertex enhances on a logarithmic scale [31,32]. Similarly, acquires logarithmic terms that reduce the susceptibility. Both effects are the precursor of the compensation of the localized spin at low temperatures and fields by the spin-density of the conduction electrons. At high T, the relaxation rate resembles a Korringa behavior, i.e., linear in T, with an enhanced exchange coupling and logarithmic corrections. The relaxation rate is approximately given by
where is the digamma function. The application of these results to Yb and Yb impurities in Au can be found in Ref. [3]. The data for Yb are shown in Figure 1 for a slightly different fit with K. The Kondo logarithms are necessary for a reasonable agreement.
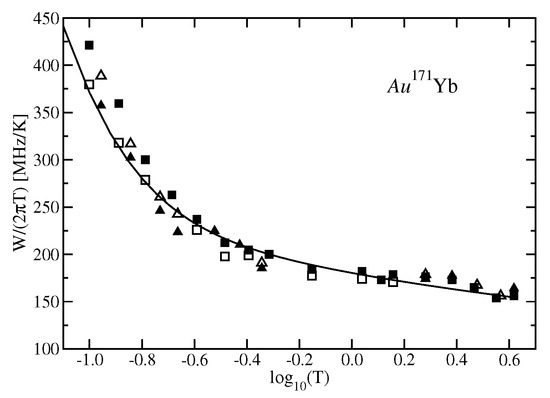
Figure 1.
Relaxation rate over T of Yb for 9 GHz (X-band) as a function of T. Open symbols denote the transitions and closed symbols the transitions. Triangles correspond to a sample with 280 ppm and squares to a sample with 670 ppm. The solid curve is Equation (19) for K. Adapted with permission from Ref. [3], American Physical Society, 2018.
For , on the other hand, a singlet spin state forms as a consequence of the Abrikosov resonance. The susceptibility is finite (in contrast to the Curie law) and the maximum value of is given by the unitarity bound for the Kondo scattering, i.e., , giving rise to Fermi liquid properties. Note that, as a consequence of the unitarity bound, the relaxation function in this limit is independent of J [1,2]. The imaginary part of decreases as a function of and T as and . The ground state is a spin singlet, so that the susceptibility is a constant (the singlet is coupled to the excited spin triplet via Van Vleck-like terms) of the order of . The relaxation rate, , is then proportional to rather then linear in the temperature (Korringa). Hence, only if is less than 100 mK would it be possible to observe an X-band ESR resonance [3].
In summary, for an ESR resonance to be seen for a Kondo impurity, has to be very small. Otherwise, the width of the resonance is going to be too broad to be observed. This difficulty can be overcome if the measurement is carried out in rather high magnetic fields with a correspondingly larger frequency of the microwave field. The above considerations lead to the commonly accepted statement that ESR of a Kondo ion cannot be observed.
3.3. Paramagnetic Kondo lattice
For the Kondo lattice, in addition to the single site terms, we now consider the multi-site terms in Equation (12). To second order in J we have for the inter-site terms, i.e., for , and . The imaginary part of the relaxation function is then
and the relaxation rate is given by
where C is the Curie constant and is the Curie–Weiss temperature. The proportionality constant of with is slightly larger than one.
The two terms of behave differently as a function of . For large , the single site term decreases by 50% of its zero-field value, while the inter-site term increases from zero. It now depends on the value of the spin mean-free path l on how many sites are involved and hence which term dominates. In any case, is finite (and positive) and consequently at low T. For the same reason, as in the case of the Kondo impurity, the width of the resonance line is too large to be observed, unless the heavy fermion band is extremely narrow with an effective mass as large as times the free electron mass. For , on the other hand, we recover a Korringa-like behavior with a renormalized Korringa constant ().
3.4. Kondo Lattice with Antiferromagnetic Order
For simplicity, we assume that the antiferromagnetic order consists of a Néel state with two sublattices, so that nearest neighbor spins have opposite ordered magnetic moments. The single site results are the same ones as for the paramagnetic phase, while, for the inter-site terms to second order in J, we obtain , where is either even or odd, giving rise to a sign oscillation. At low T, the term is zero if we neglect collective modes. If we include spin waves, this expression gives rise to a positive contribution. Without considering collective modes, we have, similar to the paramagnetic case,
and in an antiferromagnet is reduced as compared to the paramagnet.
In heavy fermion systems, the spins of the rare earth ions are usually antiferromagnetically correlated, even if the compound displays no transition to a long-range ordered phase. The short-range correlations together with the Kondo screening gives rise to a Curie–Weiss susceptibility with antiferromagnetic Weiss-temperature , . Here, is determined by the Néel temperature, , the frustration in the system (enhancing ) and . The relaxation rate is
so that the width of the resonance follows approximately a Korringa law, with a residual line width proportional to . Since is still considerable, the same conclusions as for the paramagnetic phase hold, and a resonance line can only be observed if is very small.
3.5. Kondo Lattice with Ferromagnetic Order
If, on the other hand, the spins of the rare earth ions are correlated ferromagnetically, the single site results are the same ones as for the paramagnetic phase, while for the inter-site terms, we have and is again zero if we neglect collective modes. However, if collective modes such as magnons are considered, then these terms yield a positive contribution. The static susceptibility in this case is for , where C is the Curie constant and is the Curie temperature of the ferromagnet. For becomes very large (diverges) and, according to Equation (23), the ESR line width turns very narrow, and hence becomes observable (see Figure 2). In general, close to the critical point, we would have to approximate by , where is known as the reduced temperature and the critical exponent, which is larger than 1. Consequently, the line narrows even faster as . Here, we have neglected in the relaxation through magnons (collective excitations), so that this result has to be taken with caution.
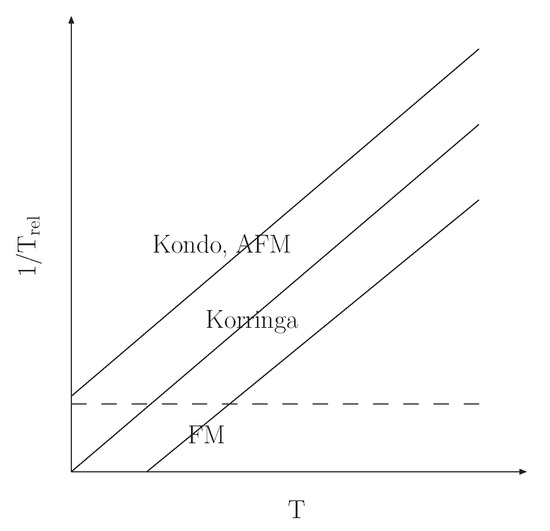
Figure 2.
Sketch of the relaxation rate as a function of T for AFM or Kondo correlations, FM fluctuations and no interactions (Korringa). Close to a magnetic transition (either AFM or FM), there are additional relaxation mechanisms due to collective excitations (spin-waves or magnons) which have not been taken into account here. The horizontal dashed line schematically indicates the resonance energy. Only below that line is a signal observable.
For weaker ferromagnetic correlations the system will not have long-range order at any T. The correlations are then short-ranged and the susceptibility is proportional to . In this case, again, the relaxation rate is strongly reduced at low T. The relaxation through magnons would only play a secondary role in this case, because for low energy excitations the wavelength would be larger than the range of the correlations. On the other hand, shorter wavelength magnons cannot be excited because their energy is larger than that of the thermal bath. Hence, there is the possibility that the electron spin resonance can be observed.
The ferromagnetic correlations for YbRhSi are predominantly in the -plane. The width of the resonance then depends on the orientation of the magnetic field, i.e., in the plane or along the c-axis. Hence, if the field lies in the -plane, domains with short-range order tend to align and the static in-plane susceptibility, , will be strongly enhanced. If, on the other hand, the field is oriented along the c-direction, the tilting of the spin out of the plane gives rise to a smaller susceptibility. The line width of the resonance is then expected to be less for the field in the -plane, which agrees with the experimental observations [6,19]. Since the g-factor in the -plane has a much smaller value than that along the c-axis, there is in addition to the above-mentioned line width enhancement, a broadening of the resonance due to the magnetic field (see Equation (18)).
3.6. Summary
Short-range correlations among the localized moments in a Kondo lattice play a fundamental role. Antiferromagnetic interactions between the spins lead to a resonance with a broad line width of the order of the Weiss temperature of the susceptibility. Consequently ESR cannot be observed. If, on the other hand, the spins are correlated ferromagnetically, the line width gets strongly suppressed and the possibility of an ESR signal is real. In other words, the ferromagnetic short-range correlations prevent the spin-flips from being passed on from site to site. This situation can to some extent be interpreted as a narrowing of the signal due to bottleneck [6].
4. Antiferroquadrupolar Ordered CeB
In contrast to the other compounds discussed above, which have tetragonal symmetry and strong anisotropy, CeB is a cubic crystal. The crystalline field of an eightfold coordination splits the into a ground state quartet and an excited doublet. The crystalline field excitation energy is 540 K, so that for all practical purposes we can ignore the [33,34]. The quartet has simultaneously spin and quadrupolar content, which gives rise to a rich phase diagram consisting of four phases, as shown in Figure 3. The high temperature phase is the paramagnetic Kondo-like state (phase I) above K. The Kondo temperature is approximately 3 K. Phase II corresponds to antiferro-quadrupolar order with in the temperature range between K and (assuming zero magnetic field). Below , the phase diagram displays two antiferromagnetic phases, phase III with and as a function of field at T phase III’ with . In this paper, we mainly refer to phase II.
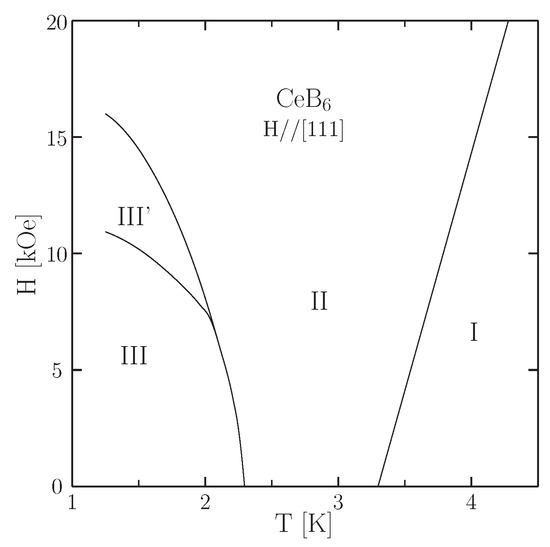
Figure 3.
The low temperature H vs. T phase diagram for CeB displays four phases. Phase I is the paramagnetic Kondo phase. Before the Kondo effect can compensate the internal degrees of freedom, there is a second order transition to the antiferro-quadrupolar phase (II) with the at the R point of the Brillouin zone. At lower T in the phases III and III’ antiferromagnetism kicks in. Phase diagram taken from Ref. [35].
4.1. g-Factor for ESR in Phase II of CeB
There are numerous examples of ESR studies of systems with ground quartets, for instance Dy impurities in the insulator [36] CaF and the metal [37] Au, as well as Er ions in the low-carrier heavy fermion compound YbBiPt [38]. The total angular momentum of Dy and Er ions is , which requires two crystalline field parameters, namely and , in cubic symmetry to describe the splittings. The wave functions and the energy levels depend on the ratio [39] and are then not universal. In contrast, the Ce ions need only one parameter, namely , since . The wave functions of the ground quartet, written in terms of the eigenstates, are [39]
Here, the spin degrees of freedom, , are denoted with ↑ and ↓ and + and − refers to the quadrupolar (orbital) states. It is customary in ESR experiments to rotate the magnetic field in the plane. We parameterize the magnetic field as , so that -axis for , if the field is along the -axis, and the magnetic field points into the direction for . The theoretical positions of the resonances strongly depend on the angle . There are then six possible microwave transitions within the quartet, however, two are doubly degenerate, so there are actually only four lines [40].
Experimentally, however, only one ESR signal was observed at 60 GHz for 1.8 K K for parallel to the [110] direction [11,12], rather than the four expected lines. The resonance [41] has a Dysonian-like lineshape, characteristic of a metallic environment, and a g-factor of 1.59. CeB displays antiferro-quadrupolar (AFQ) order [42] in the field and temperature range where the resonance was observed. The quadrupolar degrees of freedom drive the long-range order with , breaking the translational invariance of the lattice and forming two interpenetrating sublattices. The problem is conveniently studied using the Anderson lattice model which leads to hybridized localized and conduction states [40]. Within the reduced Brillouin zone, there are now twice as many bands, i.e., four, and we need to place four electrons into these bands. The f-electron energies for the two sublattices due to the AFQ order are and and the corresponding g-factors and (they depend also on the direction of the applied field). Within the mean-field slave-boson formulation, this leads to a -matrix Hamiltonian for each -value, with the single site energies in the diagonal and the hybridization terms on the off-diagonal entries. The diagonalization of the Hamiltonian yields the band dispersions [40]. The lower hybridized band is intersected by the Fermi level close to the band-gap giving rise to heavy fermions. This leads to a single resonance with effective g-factor . This result depends on two angles, namely, the angle of the magnetic field with the crystal axis and an angle defining the AFQ long-range order [40].
The operators for the magnetization depend only on and , but not on . The quantization axis for the -matrices defines orientation of the orbital order. To determine the direction of the order, we rotate the -matrices in the x-z plane [40], i.e.,
We can now choose, without loss of generality, the direction of the quadrupolar order along . The effective g-factor was found to be [43]
Here, “corr” is a small negative correction term of the order of 1–2% due to the Zeeman splitting of the conduction electrons and the dispersions of the bands (see Ref. [40]), and is the “Knight-shift” correction arising from the Hartree–Fock term of the exchange interaction (see Equation (2)). The magnitude of the Knight-shift correction can be estimated from the Kondo temperature and is expected to be of the order of 0.15–0.20 of .
The angular dependence of the resonance at 60 GHz has recently be measured in Ref. [44]. Their data with error bars for 1.8 K (open circles) and 2.65 K (dark circles) are shown in Figure 4. The solid curve is our fit to the data for 2.65 K using Equation (26) with and . The constant shift is slightly larger than expected from our simple considerations. This fit is quite different from the one attempted in Ref. [44] and would change their conclusions. All data are taken in the AFQ phase II. For 2.65 K the system is in phase II for all fields, while for 1.8 K the resonance positions vary between 2.4 T and 2.7 T, i.e., not far away from boundary with phase III’. In this region, antiferromagnetic spin fluctuations are expected, and the present theory is no longer applicable without caution. Note that a pure AFQ in the absence of field is a “hidden” order phase and cannot be observed by inelastic neutron scattering.
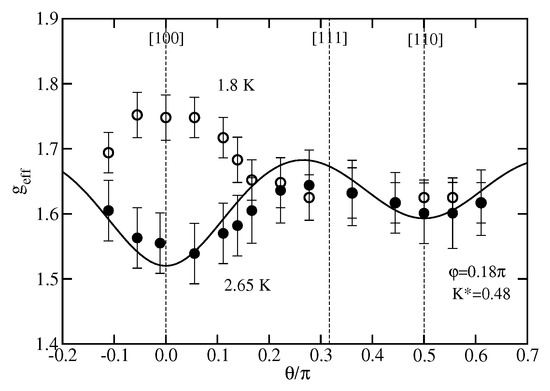
Figure 4.
as a function of for the rotation of the magnetic field in the plane for two temperatures ( K and 2.65 K) from Ref. [44]. The solid curve is the fit to theory [40,43] for with and . Stronger antiferromagnetic fluctuations are expected at 1.8 K.
The fact that only one resonance is observed and the single-ion picture yields two lines, one for each sublattice, shows that the signal in CeB can only be interpreted within the itinerant electron picture. This is in contrast to the compounds discussed in Section 3, which allow an analysis as a single-site or a collective resonance. CeB clearly shows that ESR in heavy fermion systems is a collective phenomenon.
4.2. Ferromagnetic Correlations in Phase II of CeB
In Section 3, we argued that the line width of the resonance is of the order of and too broad to be observed, unless there are ferromagnetic correlations among the moments. The compounds mentioned in Section 3 are tetragonal and this anisotropy favors ferromagnetic correlations with the moments oriented in the -plane. The isotropy of the cubic CeB lattice is not favorable for ferromagnetic correlations. Ferromagnetic fluctuations have to suppress the Curie–Weiss temperature arising from the heavy fermion band (or the Kondo effect). Below, we discuss the mechanism leading to ferromagnetic spin correlations in CeB and hence to an observable ESR signal within the AFQ ordered phase.
We now study the states of two f-electrons on neighboring sites. The wave functions consist of the product of three factors, namely, a coordinate wave function, a factor involving only orbital (quadrupolar) degrees of freedom and a function of the spin indices [40,43]
According to Pauli’s principle, fermion wave functions, such as , are antisymmetric under the interchange of the electrons, i.e., the indices 1 and 2, implying that either one or all three of the three factors in Equation (27) are antisymmetric and the remaining symmetric. Since there is no charge density wave, the coordinate wave function at each site must be the same, i.e., . Hence, is necessarily a symmetric function. Hence, either or must be antisymmetric and consequently the other function symmetric. We now suppose that the effective interaction between the two sites is a quadrupolar exchange, i.e., . Here, a is the quadrupolar exchange, which necessarily has to be positive to be able to generate AFQ order. Consequently, represents an orbital singlet with odd parity. Hence, the wave function of the spins has to have even parity and must be triplet. It follows that the spins are then ferromagnetically correlated.
On the lattice, the quadrupolar singlet state cannot be satisfied for all bonds (pairs of neighboring sites) simultaneously. This generates a resonant valence bond lattice for the quadrupolar degrees of freedom. The spins are aligned by a magnetic field. This enhances the antiferro-orbital correlations, stabilizing this way the orbital order. Consequently, the of the phase boundary between phase I ( para-quadrupolar disordered Kondo) and phase II (AFQ) increases with magnetic field, as shown in Figure 3. It is interesting to notice that the rate of increase of with field decreases at higher fields [45,46], but does not saturate up to 35 T. This reduced increment of with field is due to the orbital resonant valence bond lattice, which cannot satisfy all bonds simultaneously.
The magnetization shows a sizeable increase in phase II, with a marked increase in slope at the boundary . Hence, the magnetic susceptibility increases quite dramatically, as a consequence of a reduction of the Weiss temperature. In phase I, the Weiss temperature is of the order of , and in phase II it appears to have changed sign, i.e. the correlations are clearly ferromagnetic [41] (see also Figure 1 of Ref. [47] and Figure 5 of Ref. [48]). The inverse proportionality of the static transversal susceptibility and the relaxation rate (see Equation (23)) then has the consequence that an increase of reduces the ESR line width and the resonance becomes observable. A similar conclusion, although with different arguments, has been presented in Refs. [41,44].
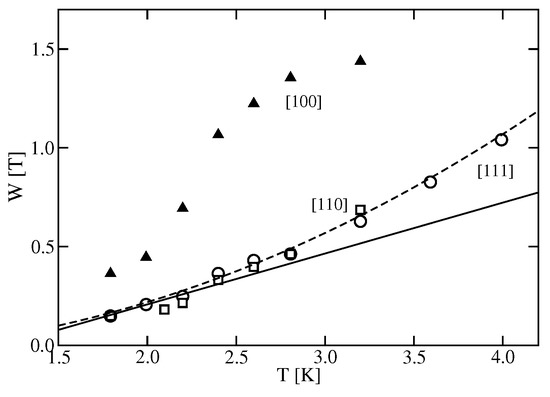
Figure 5.
Line width W of CeB as a function of temperature for the three principal axis from Ref. [44]: The dark triangles correspond to [100], the open squares to [110] and the open circles to [111]. The straight line represents a Korringa relaxation for intermediate T and the [110] and [111] directions. The dashed line is a parabolic fit.
In systems with Ce and Nd ions with ground-state the quadrupolar degrees of freedom play an important role [49]. In first place they manifest themselves through interactions between the sites. However, there is no consensus about the origin of the interactions. Using nearest-neighbor intersite exchange and quadrupolar interactions, Kubo and Kuramoto [50] were successful in describing the excitation spectrum of NdB. Uimin and Brenig [51], on the other hand, proposed a different approach emphasizing crystalline fields. For CeB, quadrupolar interactions between sites [52], the RKKY interaction arising from the Coqblin–Schrieffer model [53,54], and a detailed group theoretical study [55] have been presented.
4.3. Line Width of ESR in Phase II of CeB
The T-dependence of the line width of the Dysonian resonance for the three principal crystallographic directions (data from Ref. [44]) is shown in Figure 5. The solid straight line corresponds to a Korringa relaxation for a small interval at intermediate T. The figure clearly shows that does not have a Korringa-like T-dependence, but a more complicated one. In Section 3, we argue that is inversely proportional to the susceptibility. It is that provides the dominant T-dependence for . We can conclude that the susceptibility is smaller in the [100]-direction than in the other two main directions. The anomalous -dependence is due to magnetic fluctuations in phase II for sufficiently large fields, e.g., the difference between the straight line (Korringa) and the dashed curve. At the highest temperature, the slight increase of the relaxation rate could also be the beginning of the onset of the Orbach spin–lattice relaxation mechanism [56] into the excited crystalline field doublet.
The g-shift (Knight-shift) for larger fields is proportional to the susceptibility of the conduction states. Hence, the Knight-shift subtraction along the [100]-direction is expected to be smaller for this orientation and consequently is larger at lower T, as shown in Figure 4.
4.4. Second Resonance at High Fields in Phase II of CeB
Above, we only consider resonances between the initial and final states belonging to the AFQ condensate in phase II, i.e., both states belong to the ordered phase. At high resonance frequencies, however, the final state of the transition may be outside the energy range of the ordered phase and corresponds to the Kondo phase I. As argued in Section 3, the number of final states is larger in the paramagnetic phase I, since all states of the are in principle available and a second (and perhaps third) transition may arise. Assuming a mean-field BCS-type for the condensate, the energy of the AFQ order parameter is approximately . At the relevant fields, we have K and 10 K ≈ 200 GHz. This implies that for frequencies less than 200 GHz the initial and the final states of the transition have to belong to the AFQ ordered phase and only one transition will be observed. On the other hand, for frequencies larger than 200 GHz, the initial (ground) state is in the condensate, while the final (excited) state has to be a free ion () state.
A second resonance was detected by Demishev et al. [57] in ESR of CeB for the field in the [110] crystallographic direction for frequencies exceeding 200 GHz. The g-factor of the secondary resonance is considerably smaller than that of the primary line. The intensity of the secondary line is also less than that of the primary resonance. The two resonance energies are shown in Figure 6 as a function of magnetic field (figure adapted from Ref. [58]). The splitting is approximately linear in field indicating that it is a Zeeman splitting. In Ref. [57] (Figure 4), the g-values are plotted as a function of frequency showing a small field-dependence. A calculation of these resonances is rather complicated since the AFQ-ordered state, the -states and the coherence of the Anderson lattice need to be invoked.
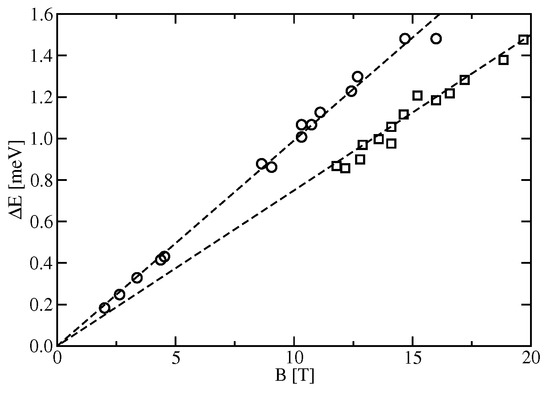
Figure 6.
Magnetic field dependence of the two resonances. One is observed for all fields (open circles) and the other one (open squares) is only seen at high magnetic fields above 12 T [57]. The dashed straight lines correspond to a pure Zeeman splitting with and , respectively. Data reproduced with permission from Ref. [58], American Physical Society, 2018.
4.5. Inelastic Neutron Scattering in CeB
The ESR results for CeB are complementary and closely related to those of inelastic neutron scattering (INS). While standard ESR measures the transversal dynamical magnetic susceptibility for , INS realizes the longitudinal dynamical magnetic susceptibility (see next section) as a function of wave vector and frequency . In the paramagnetic Kondo phase, the dynamical susceptibility has a quasi-elastic peak (centered at ) of width given by the maximum of T and . In phase II at zero-field the neutrons do not couple to the ordered quadrupolar moments. This phase is frequently called a “hidden” order phase with . A finite magnetic field breaks the symmetry and induces magnetic moments which can be detected by neutrons. Phase III has antiferromagnetic long-range order with and in phase III’ the Q-vector changes to . The phase diagram is shown in Figure 3.
There are four types of excitations observed by INS.
- (1)
- A resonant magnetic exciton mode [59], similar to the ones found in unconventional superconductors [60], including heavy fermion superconductors (CeCuSi, CeCoIn, and CeRuAl) [61,62], was observed at , but in phase III. The mode is non-dispersive, sharply peaked and associated with the opening of a spin-gap at low energies. The spin-gap is the consequence of the magnetic order, since for the resonance peak shifts to and becomes the quasi-elastic peak of the paramagnetic state. A theoretical interpretation of the resonant exciton mode was provided by Akbari and Thalmeier [63].
- (2)
- At the -point (zone center), a strong FM soft mode was observed [64], These ferromagnetic fluctuations are large in phase III but also present (although weak) in phase II. However, no dispersive magnon excitations were found in the AFQ phase. The intensity of the magnetic excitations collapses into a broad central peak at zero energy (quasi-elastic peak) just above . The INS line width is smallest at the -point. The ferromagnetic fluctuations are expected to be enhanced in a magnetic field and are the reason for an accessible ESR signal in CeB.
- (3)
- Spin-wave modes emanate from the AFM wave-vectors and below . They display a spin-gap of about 0.3 to 0.4 meV and, at the zone boundary (M point), the modes reach up to 0.7 meV. Hence, the spin-gap and the band width are comparable.All the above excitations merge to form a continuous dispersive magnon band in a narrow energy range. The band is more dispersive in the AFQ phase.
- (4)
- In unconventional superconductors, a strong magnetic field splits the resonant magnetic exciton mode into two components. This is not the case for CeB, where a second field-induced magnon mode emerges whose energy increases with magnetic field [58]. At the FM zone center (-point) only a single mode is found with a non-monotonic field dependence in phase III. Inside the hidden order phase, it agrees well with the ESR resonance energy (Figure 6). INS measurements in the field range of the second (high-field) ESR resonance have not been carried out. It is interesting to point out that this secondary ISN response occurs also at the R-point, which is not accessible by ESR.
INS and ESR results are complementary and there is still much work to be done to understand the magnetic correlations in CeB.
4.6. Summary
The AFM correlations in heavy fermion compounds lead to a broad ESR line, which generally cannot be observed. Exceptions are compounds with very strong magnetic anisotropy, where ferromagnetic correlations reduce the line width, as discussed in Section 3. CeB represents an exception to the exceptions, since a resonance was observed and it is a cubic Kondo lattice (no significant magnetic anisotropy) in the AFQ phase. This situation needs a separate explanation.
Each Ce ion has a fourfold degenerate ground state, displaying spin and orbital degrees of freedom. We concluded from the antisymmetry of the wave functions of the electrons that there is a strong interplay between AFQ and ferromagnetic order of the spins at the -point. This state is favored by a magnetic field and consequently the of the boundary between the Kondo and the AFQ phases increases with B, which agrees with the experiment. Furthermore, the susceptibility is increased by the ferromagnetic correlations as observed experimentally, where displays a kink [41,48], and hence it reduces the ESR line width, which this way is accessible to observation.
Previous ESR experiments on heavy fermion systems with Kramers doublets, e.g., YbRhSi [4,6,7,8], have originally all been interpreted as if localized moments are resonating, i.e. as for ESR on individual impurities. The local dynamical susceptibility is the proper response function in that case, rather than the global dynamical susceptibility [21,22]. However, it is difficult to distinguish between the two approaches [20], since more than 60% of the Yb ions participate in the resonance [19]. The fact that only one resonance was observed in CeB, in conjunction with the analysis in Ref. [22], is evidence that the ESR signal is a collective phenomenon involving all the sites of the lattice.
The ground quartet of a single Ce site leads to expect four resonances. Three of these resonances are quenched by the AFQ order at each site and the coherence of the wave functions reduces the signal to one resonance. The experimentally observed g-value [11,12,41] is about 1.6 and depends on the angle of the magnetic field with the crystallographic axis. The theoretical effective g-factor depends then on two angles, and , and the Knight shift. Here, is the angle of the quadrupolar order relative to the crystallographic axis. There is good agreement between theory and experiment at K for a proper choice of parameters (in contrast to statements in Ref. [44]). Both the multiplet and AFQ order are crucial ingredients for the observability of an ESR signal in a cubic environment.
5. Longitudinal Dynamical Susceptibility
In a configuration in which the oscillating magnetic field of the microwaves is parallel to the Zeeman field (assumed along the z-axis) the resonance is given by the longitudinal dynamical susceptibility, . This correlation function, but also as a function of a wave vector , contains the response to inelastic neutron scattering (INS). We consider the same Hamiltonian as in Section 2, namely Equation (1), together with the “Knight”-shifted magnetic field, Equation (2). To higher order in the Kondo exchange J, the model generates a Heisenberg exchange between the different sites (RKKY-interaction). In Section 3 this spin-exchange was incorporated into the expectation values of spin operators and the static susceptibility. The same procedure will be followed here. The longitudinal response for INS consists then of a quasi-elastic central peak of width and inelastic peaks arising from the transition (emission and absorption of ) into spin-excited states. To study the latter it is convenient to artificially include a Heisenberg Hamiltonian with the appropriate symmetries. Here, we limit ourselves to study the quasi-elastic peak.
We apply the equation of motion to the first argument of the susceptibility [29,30],
The above equation defines the spin-current . Applying the equation of motion on the second argument of the correlation function yields
which is now evaluated for the noninteracting system.
The Bloch equation can be written in the form [29,30]
where is the static longitudinal magnetic susceptibility and is the longitudinal relaxation function. To second order in the exchange is given by [29,30]
Evaluating the imaginary part of for the noninteracting system we obtain
Here, we neglected the Zeeman field of the conduction electrons. The first term is the single site contribution, while the second one arises from the intersite interactions.
We first analyze the single site terms, which correspond to the single impurity case. For , the function reduces to
For , this expression becomes the constant and with we obtain the Korringa relaxation rate . This is the same expression as for , since for the dynamical susceptibility is isotropic. In the limit , on the other hand, tends to zero exponentially as , because the spin-flips are suppressed by the magnetic field. The suppression of spin-flips also reduces the static susceptibility exponentially, , so that the spin-flip relaxation rate in the high field limit is , i.e. [29].
The width of the quasi-elastic central peak is and its weight is roughly . In addition to the central peak, the longitudinal dynamical response has a shoulder at low T as a function of close to . At low T, the thermal bath is unable to provide sufficient energy to flip the spin, unless the external frequency is larger than . The Kondo effect is introduced to higher order in J and it impacts both, the relaxation kernel and the static susceptibility [65]. Eventually, as , the impurity spin is compensated leading to a finite susceptibility and relaxation rate [31,32], in analogy to the transverse response. The Kondo effect in a small magnetic field smears the abovementioned properties and the characteristic energy of the central peak is the larger of T and . The intersite terms play a substantial role only in the presence of collective excitations, so that expectation values of spin-flips at different sites are nonzero. As for the transversal response function, most of the physics is dominated by the static response. Ferromagnetic intersite correlations therefore again narrow the central peak, while AF correlations tend to broaden the quasi-elastic peak.
6. Conclusions
An ESR signal for a magnetic impurity in a metal is not observable unless is very small. This suggests that the line width in heavy-fermion compounds is too broad for measurement with conventional ESR techniques. This general belief had to be corrected, when a resonance was found in several heavy-fermion Ce and Yb compounds. Common to these compounds are ferromagnetic short-range correlations among the rare earth moments due to a strong magnetic anisotropy usually in the plane. The observed signals have the Dysonian line shape as expected from spin diffusion in a metallic environment. The static transversal susceptibility and the ESR relaxation rate are inversely proportional to each other. For noninteracting impurities, is a Curie law and hence , known as the Korringa relaxation rate, which alternatively can also be obtained from the Fermi–Dirac distribution function of the conduction states.
The Kondo exchange interaction of the resonating spin with the conduction electrons gives rise to the Kondo spin compensation and the susceptibility becomes finite. Consequently, the ESR line width is proportional to and is too large for the resonance to be observed, unless is much less than the microwave frequency as for Yb impurities in Au [3]. In a compound, there are also short-range interactions among the localized moments, which play a crucial role. For heavy fermion compounds, involving Ce and Yb ions, is inversely proportional to the band width (). For antiferromagnetically correlated spins the width of the line is of the order of the Weiss temperature of the static transversal susceptibility, which is usually too large for conventional ESR to be measured. For ferromagnetically correlated moments, on the other hand, the width of the resonance is strongly reduced and it is possible to measure an ESR line. This situation can be considered a bottleneck [6] since the FM short-range correlations inhibit the spin-flip from being passed on to other sites. Similar conclusions for Kondo impurities and the Kondo lattice (i.e., involving localized moments) have been derived by Abrahams and Wölfle for the Anderson impurity and Anderson lattice [21,22].
Due to spin diffusion and the skin depth, the characteristic ESR line shape in a metal is Dysonian. This is the case for both, resonating localized moments [16] and conduction states [13,14,15]. For heavy fermion compounds, the shape of the line can then not distinguish between localized moments and conduction states in a narrow band (heavy mass). The crystalline electric field scheme determines the g-tensor for the localized spins, i.e., the g-values and their anisotropy. On the other hand, the hybridization of the f-electrons with the conduction states gives rise to the heavy fermion states. In the neighborhood of the Fermi level, they are dominated by the f-character and, consequently, the g-tensor is again predominantly given by the crystalline field scheme of the f-states. Hence, from the g-tensor we once again cannot distinguish between resonating localized and conducting states.
CeB is a cubic Kondo lattice with no significant magnetic anisotropy in the AFQ phase. The observation of a signal in CeB is then an exception to the exceptions. The ground state of each Ce ion is a quartet containing orbital and spin degrees of freedom. Naively, this should give rise to four resonance lines, however only one was observed in the usual range of microwaves. The AFQ long-range order and the coherence of the electron states due to the hybridization are necessary to quench the remaining transitions. The agreement of the angular dependence of the spectrum in the AFQ phase with theory is remarkable. At low T there are differences because of the proximity of phase III, which induces AF correlations not included in the theory. The Pauli principle requires antisymmetric electron wave functions. It follows that the spins are ferromagnetically coupled to each other in order to have AFQ correlations. A magnetic field favors this state and the of the phase boundary between the Kondo and AFQ phases increases with field, in agreement with experiment. In addition, the ferromagnetic correlations enhance the magnetic susceptibility [41,48] and hence reduce the ESR line width, which then becomes accessible to observation.
Demishev et al. [57] detected a second ESR resonance line in ESR for frequencies larger than 200 GHz. The g-factor of the secondary resonance and its intensity are considerably less than that of the primary line. The second resonance can be explained as a transition from the AFQ-ordered resonance into a final state belonging to phase I (Kondo phase).
The INS results for CeB have provided insights into the low T ordered phases and their spin correlations. More work is still needed to relate the INS experiments to the ESR results.
Conflicts of Interest
The author declares no conflict of interest.
References
- Yamada, K. Perturbation Expansion for the Anderson Hamiltonian. II. Prog. Theor. Phys. 1975, 53, 970–986. [Google Scholar] [CrossRef]
- Shiba, H. The Korringa Relation for the Impurity Nuclear Spin-Lattice Relaxation in Dilute Kondo Alloys. Prog. Theor. Phys. 1975, 54, 967–981. [Google Scholar] [CrossRef]
- Von Spalden, Y.; Tsang, E.; Baberschke, K.; Schlottmann, P. ESR study of the Kondo effect in Au171Yb and Au174Yb. Phys. Rev. B 1983, 28, 24, 1984, 29, 487. [Google Scholar] [CrossRef]
- Sichelschmidt, J.; Ivan’shin, V.A.; Ferstl, J.; Geibel, C.; Steglich, F. Low Temperature Electron Spin Resonance of the Kondo Ion in a Heavy Fermion Metal: YbRh2Si2. Phys. Rev. Lett. 2003, 91, 156401. [Google Scholar] [CrossRef] [PubMed]
- Ivan’shin, V.A.; Aminov, L.K.; Kurkin, I.N.; Sichelschmidt, J.; Stockert, O.; Ferstl, J.; Geibel, C. Electron paramagnetic resonance of Yb3+ ions in a concentrated YbRh2Si2 compound with heavy fermions. Zh. Eksp. Teor. Fiz. Pis’ma Red. JETP Lett. 2003, 77, 526–529. [Google Scholar] [CrossRef]
- Duque, J.G.S.; Bittar, E.M.; Adriano, C.; Giles, C.; Holanda, L.M.; Lora-Serrano, R.; Pagliuso, P.G.; Rettori, C.; Pérez, C.A.; Wu, R.W.; et al. Magnetic field dependence and bottlenecklike behavior of the ESR spectra in YbRh2Si2. Phys. Rev. B 2009, 79, 035122. [Google Scholar] [CrossRef]
- Sichelschmidt, J.; Wykhoff, J.; von Nidda, H.-A.K.; Fazlishanov, I.I.; Hossain, Z.; Krellner, C.; Geibel, C.; Steglich, F. Electron spin resonance of YbIr2Si2 below the Kondo temperature. J. Phys. Condens. Matter 2007, 19, 016211. [Google Scholar] [CrossRef]
- Krellner, C.; Förster, T.; Jeevan, H.; Geibel, C.; Sichelschmidt, J. Relevance of Ferromagnetic Correlations for the Electron Spin Resonance in Kondo Lattice Systems. Phys. Rev. Lett. 2008, 100, 066401. [Google Scholar] [CrossRef] [PubMed]
- Ivan’shin, V.A.; Sukhanov, A.A.; Sokolov, D.A.; Aronson, M.C.; Jia, S.; Bud’ko, S.L.; Canfield, P.C. Electron spin resonance of dense Yb-based heavy-fermion compounds: New experimental data. J. Alloys Compd. 2009, 480, 126–127. [Google Scholar] [CrossRef]
- Bruning, E.M.; Krellner, C.; Baenitz, M.; Jesche, A.; Steglich, F.; Geibel, C. CeFePO: A heavy fermion metal with ferromagnetic correlations. Phys. Rev. Lett. 2008, 101, 117206. [Google Scholar] [CrossRef] [PubMed]
- Demishev, S.V.; Semeno, A.V.; Paderno, Y.B.; Shitsevalova, N.Y.; Sluchanko, N.E. Experimental evidence for magnetic resonance in the antiferro–Quadrupole phase. Phys. Status Solidi B 2005, 242, R27–R29. [Google Scholar] [CrossRef]
- Demishev, S.V.; Semeno, A.V.; Bogach, A.V.; Paderno, Y.B.; Shitsevalova, N.Y.; Sluchanko, N.E. Magnetic resonance in cerium hexaboride caused by quadrupolar ordering. J. Magn. Magn. Mater. 2006, 300, e534–e537. [Google Scholar] [CrossRef]
- Feher, G.; Kip, A.F. Electron spin resonance absorption in metals. I. Experimental. Phys. Rev. 1955, 98, 337. [Google Scholar] [CrossRef]
- Dyson, F. Electron spin resonance absorption in metals. II. Theory of electron diffusion and the skin effect. Phys. Rev. 1955, 98, 349. [Google Scholar] [CrossRef]
- Pake, G.E.; Purcell, E.M. Line shapes in nuclear paramagnetism. Phys. Rev. 1948, 74, 1184. [Google Scholar] [CrossRef]
- Rettori, C.; Davidov, D.; Orbach, R.; Chock, E.P.; Ricks, B. Electron-Spin Resonance of Rare Earths in Aluminum. Phys. Rev. B 1973, 7, 1. [Google Scholar] [CrossRef]
- Rettori, C.; Davidov, D.; Kim, H.M. Crystalline-field effects in the EPR of Er in various cubic metals. Phys. Rev. B 1973, 8, 5335. [Google Scholar] [CrossRef]
- Rettori, C.; Kim, H.M.; Chock, E.P.; Davidov, D. Dynamic behavior of paramagnetic ions and conduction electrons in intermetallic compounds: GdxLu1-xAl2. Phys. Rev. B 1974, 10, 1826. [Google Scholar] [CrossRef]
- Sichelschmidt, J.; Ivan’shin, V.A.; Ferstl, J.; Geibel, C.; Steglich, F.J. Suppression of the Kondo state in YbRh2Si2 by large magnetic fields. Magn. Magn. Mater. 2004, 42, 272–276. [Google Scholar]
- Schlottmann, P. Electron spin resonance in heavy-fermion systems. Phys. Rev. B 2009, 79, 045104. [Google Scholar] [CrossRef]
- Abrahams, E.; Wölfle, P. Electron spin resonance in Kondo systems. Phys. Rev. B 2008, 78, 104423. [Google Scholar] [CrossRef]
- Wölfle, P.; Abrahams, E. Phenomenology of ESR in heavy-fermion systems: Fermi-liquid and non-Fermi-liquid regimes. Phys. Rev. B 2009, 80, 235112. [Google Scholar] [CrossRef]
- Abrahams, E.; Wölfle, P. Critical quasiparticle theory applied to heavy fermion metals near an antiferromagnetic quantum phase transition. Proc. Natl. Aacd. Sci. USA 2012, 109, 3238. [Google Scholar] [CrossRef] [PubMed]
- Wölfle, P.; Abrahams, E. Quasiparticles beyond the Fermi liquid and heavy fermion criticality. Phys. Rev. B 2011, 84, 041101. [Google Scholar] [CrossRef]
- Zvyagin, A.A.; Kataev, V.; Büchner, B. Theory of the electron spin resonance in heavy fermion systems with non-Fermi-liquid behavior. Phys. Rev. B 2009, 80, 024412. [Google Scholar] [CrossRef]
- Huber, D.L. The effects of anisotropy and Yb–Yb interactions on the low-field electron spin resonance in YbRh2Si2 and YbIr2Si2. J. Phys. Condens. Matter 2009, 21, 322203. [Google Scholar] [CrossRef] [PubMed]
- Kochelaev, B.I.; Belov, S.I.; Skvortsova, A.M.; Kutuzov, A.S.; Sichelschmidt, J.; Wykhoff, J.; Geibel, C.; Steglich, F. Why could electron spin resonance be observed in a heavy fermion Kondo lattice? Eur. Phys. J. B 2009, 72, 485–489. [Google Scholar] [CrossRef]
- Bloch, F. Nuclear Induction. Phys. Rev. 1946, 70, 460. [Google Scholar] [CrossRef]
- Götze, W.; Wölfle, P. Dynamical impurity spin susceptibility in metals. J. Low Temp. Phys. 1971, 5, 575–589. [Google Scholar] [CrossRef]
- Götze, W.; Wölfle, P. Homogeneous dynamical susceptibilities of dilute magnetic alloys. J. Low Temp. Phys. 1972, 6, 455–471. [Google Scholar] [CrossRef]
- Götze, W.; Schlottmann, P. The zero field Kondo susceptibility at intermediate temperatures. Solid State Commun. 1973, 13, 17–20. [Google Scholar] [CrossRef]
- Götze, W.; Schlottmann, P. On the longitudinal static and dynamic susceptibility of spin-1/2 Kondo systems. J. Low Temp. Phys. 1974, 16, 87. [Google Scholar] [CrossRef]
- Fujita, T.; Suzuki, M.; Komatsubara, T.; Kunii, S.; Kasuya, T.; Ohtsuka, T. Anomalous specific heat of CeB6. Solid State Commun. 1980, 35, 569–572. [Google Scholar] [CrossRef]
- Zirngiebl, E.; Hillebrands, B.; Blumenröder, S.; Güntherodt, G.; Loewenhaupt, M.; Carpenter, J.M.; Winzer, K.; Fisk, Z. Crystal-field excitations in CeB6 studied by Raman and neutron spectroscopy. Phys. Rev. B 1984, 30, 4052. [Google Scholar] [CrossRef]
- Kunimori, K.; Kotani, M.; Funaki, H.; Tanida, H.; Sera, M.; Matsumura, T.; Iga, F. Theory of Electron Spin Resonance in Ferromagnetically Correlated Heavy Fermion Compounds. J. Phys. Soc. Jpn. 2011, 80, SA056. [Google Scholar] [CrossRef]
- Bierig, R.W.; Weber, M. Paramagnetic Resonance of Dysprosium in Cubic and Axial Fields in CaF2. Phys. Rev. 1963, 132, 164. [Google Scholar] [CrossRef]
- Davidov, D.; Orbach, R.; Rettori, C.; Tao, L.J.; Chock, E.P. Anisotropic Behavior of Dilute Au:Dy Alloys: Observation of the Γ8 (Quartet) Resonance. Phys. Rev. Lett. 1972, 28, 490. [Google Scholar] [CrossRef]
- Martins, G.B.; Rao, D.; Barberis, G.E.; Rettori, C.; Duro, R.J.; Sarrao, J.; Fisk, Z.; Oseroff, S.; Thompson, J.D. Electron spin resonance of Er3+ in YBiPt. Phys. Rev. B 1995, 52, 15062. [Google Scholar] [CrossRef]
- Lea, K.R.; Leask, M.J.M.; Wolf, W.P. The raising of angular momentum degeneracy of f-electron terms by cubic crystal fields. J. Phys. Chem. Solids 1962, 23, 1381–1405. [Google Scholar] [CrossRef]
- Schlottmann, P. Electron spin resonance in antiferro-quadrupolar-ordered CeB6. Phys. Rev. B 2012, 86, 075135. [Google Scholar] [CrossRef]
- Demishev, S.V.; Semeno, A.V.; Bogach, A.V.; Samarin, N.A.; Ishchenko, T.V.; Filipov, V.B.; Shitsevalova, N.Y.; Sluchanko, N.E. Magnetic spin resonance in CeB6. Phys. Rev. B 2009, 80, 245106. [Google Scholar] [CrossRef]
- Effantin, J.; Rossat-Mignod, J.; Burlet, P.; Bartholin, H.; Kunii, S.; Kasuya, T.J. Magnetic phase diagram of CeB6. Magn. Magn. Mater. 1985, 145, 47–48. [Google Scholar] [CrossRef]
- Schlottmann, P. Electron spin resonance in CeB6. J. Appl. Phys. 2013, 113, 17E109. [Google Scholar] [CrossRef]
- Semeno, A.V.; Gilmanov, M.I.; Bogach, A.V.; Krasnorussky, V.N.; Samarin, A.N.; Samarin, N.A.; Sluchanko, N.E.; Shitsevalova, N.Y.; Filipov, V.B.; Glushkov, V.V.; et al. Magnetic resonance anisotropy in CeB6: An entangled state of the art. Sci. Rep. 2016, 6, 39196. [Google Scholar] [CrossRef] [PubMed]
- Hall, D.; Fisk, Z.; Goodrich, R.G. Magnetic-field dependence of the paramagnetic to the high-temperature magnetically ordered phase transition in CeB6. Phys. Rev. B 2000, 62, 84. [Google Scholar] [CrossRef]
- Goodrich, R.G.; Young, D.P.; Hall, D.; Balicas, L.; Fisk, Z.; Harrison, N.; Betts, J.; Migliori, A.; Woodward, F.M.; Lynn, J.W. Extension of the temperature-magnetic field phase diagram of CeB6. Phys. Rev. B 2004, 69, 054415. [Google Scholar] [CrossRef]
- Terzioglu, C.; Browne, D.A.; Goodrich, R.G.; Hassan, A.; Fisk, Z. EPR and magnetic susceptibility measurements on CeB6. Phys. Rev. B 2001, 63, 235110. [Google Scholar] [CrossRef]
- Terzioglu, C.; Ozturk, O.; Kilic, A.; Goodrich, R.G.; Fisk, Z. Magnetic and electronic measurements in CeB6. J. Magn. Magn. Mater. 2006, 298, 33–37. [Google Scholar] [CrossRef]
- Stankiewicz, J.; Evangelisti, M.; Fisk, Z.; Schlottmann, P.; Gor’kov, L. Kondo Physics in a Rare Earth Ion with Well Localized 4f Electrons. Phys. Rev. Lett. 2012, 108, 257201. [Google Scholar] [CrossRef] [PubMed]
- Kubo, K.; Kuramoto, Y. Magnetic and quadrupolar interactions in NdB6. J. Phys. Condens. Matter 2003, 15, S2251. [Google Scholar] [CrossRef]
- Uimin, G.; Brenig, W. Crystal field, magnetic anisotropy, and excitations in rare-earth hexaborides. Phys. Rev. B 2000, 61, 60. [Google Scholar] [CrossRef]
- Uimin, G.; Kuramoto, Y.; Fukushima, N. Mode coupling effects on the quadrupolar ordering in CeB6. Solid State Commun. 1996, 97, 595–598. [Google Scholar] [CrossRef]
- Ohkawa, F.J. Orbital Antiferromagnetism in CeB6. J. Phys. Soc. Jpn. 1985, 54, 3909–3914. [Google Scholar] [CrossRef]
- Schlottmann, P. RKKY interaction between Ce ions in CexLa1-xB6. Phys. Rev. B 2000, 62, 10067. [Google Scholar] [CrossRef]
- Shiina, R.; Shiba, H.; Thalmeier, P.J. Magnetic-Field Effects on Quadrupolar Ordering in a Γ8-Quartet System CeB6. Phys. Soc. Jpn. 1997, 66, 1741. [Google Scholar] [CrossRef]
- Orbach, R. Spin-lattice relaxation in rare-earth salts. Proc. Royal Soc. A 1961, 264, 458. [Google Scholar] [CrossRef]
- Demishev, S.V.; Semeno, A.V.; Ohta, H.; Okubo, S.; Paderno, Y.B.; Shitsevalova, N.Y.; Sluchanko, N.E. High-frequency study of the orbital ordering resonance in the strongly correlated heavy fermion metal CeB6. Appl. Magn. Reson. 2008, 35, 319–326. [Google Scholar] [CrossRef]
- Portnichenko, F.Y.; Demishev, S.M.; Semeno, A.V.; Ohta, H.; Cameron, A.S.; Surmach, M.A.; Jang, H.; Friemel, G.; Dukhnenko, A.V.; Shitsevalova, N.Y.; et al. Magnetic field dependence of the neutron spin resonance in CeB6. Phys. Rev. B 2016, 94, 035114. [Google Scholar] [CrossRef]
- Friemel, G.; Li, Y.; Dukhnenko, A.V.; Shitsevalova, N.Y.; Sluchanko, N.E.; Ivanov, A.; Filipov, V.B.; Keimer, B.; Isonov, D.S. Resonant magnetic exciton mode in the heavy-fermion antiferromagnet CeB6. Nat. Commun. 2012, 3, 830. [Google Scholar] [CrossRef] [PubMed]
- Inosov, D.S.; Park, J.T.; Bourges, P.; Sun, D.L.; Sidis, Y.; Schneidewind, A.; Hradil, K.; Haug, D.; Lin, C.T.; Keimer, B.; et al. Normal-state spin dynamics and temperature-dependent spin-resonance energy in optimally doped BaFe1.85Co0.15As2. Nat. Phys. 2010, 6, 178–181. [Google Scholar] [CrossRef]
- Stock, C.; Broholm, C.; Hudis, J.; Kang, H.J.; Petrovic, C. Spin Resonance in the d-Wave Superconductor CeCoIn5. Phys. Rev. Lett. 2008, 100, 087001. [Google Scholar] [CrossRef] [PubMed]
- Stockert, O.; Arndt, J.; Faulhaber, E.; Geibel, C.; Jeevan, H.S.; Kirchner, S.; Loewenhaupt, M.; Schmalzl, K.; Schmidt, W.; Si, Q.; et al. Magnetically driven superconductivity in CeCu2Si2. Nat. Phys. 2011, 7, 119–124. [Google Scholar] [CrossRef]
- Akbari, A.; Thalmeier, P. Spin Exciton Formation inside the Hidden Order Phase of CeB6. Phys. Rev. Lett. 2012, 108, 146403. [Google Scholar] [CrossRef] [PubMed]
- Jang, H.; Friemel, G.; Ollivier, J.; Dukhnenko, A.V.; Shitsevalova, N.Y.; Filipov, V.B.; Keimer, B.; Inosov, D.S. Intense low-energy ferromagnetic fluctuations in the antiferromagnetic heavy-fermion metal CeB6. Nat. Mater. 2014, 13, 682–687. [Google Scholar] [CrossRef] [PubMed]
- Götze, W.; Schlottmann, P. Retardation Effects in the Longitudinal Spin Relaxation in Metals. II. J. Low Temp. Phys. 1973, 112, 149. [Google Scholar] [CrossRef]
© 2018 by the author. Licensee MDPI, Basel, Switzerland. This article is an open access article distributed under the terms and conditions of the Creative Commons Attribution (CC BY) license (http://creativecommons.org/licenses/by/4.0/).