
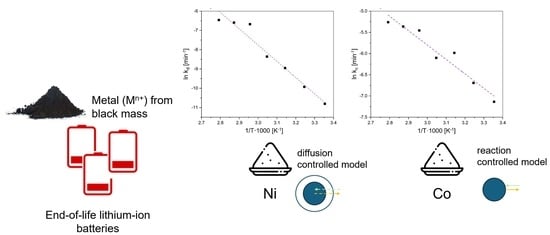
Recovery of Cobalt, Nickel, and Lithium from Spent Lithium-Ion Batteries with Gluconic Acid Leaching Process: Kinetics Study

Chair of Nonferrous Metallurgy, Montanuniversität Leoben, 8700 Leoben, Austria
*
Author to whom correspondence should be addressed.
Batteries 2024, 10(4), 120; https://doi.org/10.3390/batteries10040120
Submission received: 26 February 2024
/
Revised: 20 March 2024
/
Accepted: 27 March 2024
/
Published: 2 April 2024
Abstract
:The demand for lithium-ion batteries (LIBs) is driven by environmental concerns and market growth, particularly in the transportation sector. The EU’s push for net-zero emissions and the European Green Deal accentuates the role of battery technologies in sustainable energy supply. Organic acids, like gluconic acid, are explored for the eco-friendly leaching of valuable metals from spent batteries. This study investigates leaching kinetics using gluconic acid (hydrolyzed glucono-1.5-lacton), analyzing factors such as temperature, acid concentration, particle size, and reaction time. Results reveal the temperature’s influence on leaching efficiency for cobalt, nickel, and lithium. The mechanism for Co follows a surface chemical reaction model with an activation energy of 28.2 kJ·mol−1. Nickel, on the contrary, shows a diffusion-controlled regime and an activation energy of 70.1 kJ·mol−1. The reaction of leaching Ni and Co using gluconic acid was determined to be first-order. The process within this environmentally friendly alternative leaching agent shows great potential for sustainable metal recovery.
1. Introduction
The production capacity of lithium-ion batteries (LIBs) has been rapidly increasing in the last years, driven by the growing market demand. One key driver for this growth is the need to address greenhouse gas emissions from the transportation sector. The European Union (EU 27) has witnessed a substantial increase in CO2-equivalent gases due to transportation, and the sector contributes significantly to EU emissions [1,2,3,4].
National strategies to achieve net-zero emissions [5,6,7] have propelled electric vehicle sales, with the EU member states planning to ban non-CO2-neutral vehicles from 2035 onwards. The European Green Deal initiative [8] aims to supply sustainable energy to the entire economy. Battery technologies are highlighted in this context, with the EU promoting collaboration with industry to establish a globally competitive and sustainable battery value chain. The EU’s focus includes recycling efforts, with directives stating that a significant portion of lithium-ion batteries must be recycled modularly, and elements like Co, Ni, Cu, and Li must be recovered [5,6,7,8,9,10,11,12,13].
Organic acids, due to their environmentally friendly properties, are being explored as potential leaching agents for metals from spent lithium-ion batteries. Organic acids offer distinct environmental advantages due to their minimal toxicity, renewable sourcing, and biodegradability. These compounds exert a reduced environmental footprint owing to their rapid degradation and natural origins. Their role in fostering sustainability is evident in their extraction from natural reservoirs, such as plants, through fermentation, thereby diminishing reliance on non-renewable resources. Notably, organic acids exhibit lower toxicity profiles compared with their synthetic counterparts, thus ensuring heightened safety for both ecological systems and human health. Their versatility across diverse sectors amplifies their eco-friendly attributes, positioning them as a more sustainable choice for a wide array of applications [14,15].
Gluconic acid, a three-protonic carboxylic acid, is of particular interest [16]. It can be enzymatically produced from glucose [17,18] and has been shown to support metal leaching. Various studies have demonstrated that organic acids like gluconic acid combined with reducing agents like glucose [18] or hydrogen peroxide [16] can achieve high leaching efficiencies for valuable metals. The oxidative degradation of glucose to gluconic acid and subsequently to glycolic, glyceric, and formic acid was detailed by Sidiq et al. [14] in their study on hydrometallurgical recycling processes [16,17,18,19,20,21,22,23,24,25,26].
Numerous researchers have dedicated their efforts to the exploration of leaching kinetics in order to elucidate reaction rates and mechanisms when employing inorganic acids [27] or common organic acids like citric acid [28] for the leaching of spent lithium-ion batteries black mass materials. The shrinking core model, a paradigm that is well adapted for depicting scenarios where solid particles undergo dissolution or reaction owing to consumption, is the most used way for analyzing leaching processes [27,28,29,30].
The kinetics models applicable to leaching comprise the residue layer diffusion control model and the surface chemical reaction control model. In the present study, the leaching process of cobalt, nickel, and lithium from spent lithium-ion batteries was scrutinized using gluconic acid as the leaching agent. The investigation involved varying the gluconic acid concentration, reaction temperature, and reaction time as factors. The focal point of this research was the comprehensive analysis of the leaching kinetics, aiming to ascertain the most suitable kinetic model for the leaching process, determine the activation energy’s magnitude, and establish the reaction order pertinent to the leaching of these valuable metals from the black mass of spent lithium-ion batteries [28,31].
2. Materials and Methods
2.1. Input Materials
The kinetic investigations in this study employed black mass (BM) derived from spent device lithium-ion batteries. Following mechanical comminution, the material underwent a preliminary pyrolysis treatment at 550 °C for a duration of 5 h in a batch oven in an inert atmosphere. To ensure a high level of safety in handling spent lithium-ion batteries, thermal treatment is conducted within a nitrogen atmosphere to mitigate their residual reactivity. This pretreatment step was executed to eliminate residual electrolytes and binder constituents affixed to the material. The elemental composition of the material was ascertained through the utilization of inductively coupled plasma mass spectrometry (ICP-MS), facilitated by the requisite solid digestion process (refer to Table 1 for details).
2.2. Experimental Procedures
The experimentation took place within a sealed, double-walled vessel possessing a maximum capacity of 1000 mL, equipped with an interconnected thermostat for precise temperature regulation and a stirring plate for homogenization of the leaching solution. Each experimental run employed a total solution volume of 500 mL. The system was purged with nitrogen to ensure a well-defined atmosphere and oxidation potential.
The leaching solution combined deionized water and 99% glucono-1.5-lactone (Thermo Fisher Scientific Chemicals, Haverhill, MA, USA. The incorporation of the black mass transpired via a funnel, followed by a subsequent addition of hydrogen peroxide through a dropwise funnel. The commencement of the reaction time was synchronized with the conclusion of hydrogen peroxide addition.
For sample extraction, individual aliquots (5 mL) were withdrawn using syringes, and solid-liquid separation was realized using a syringe filter with a porosity of 1 micron. The quantitative analysis of valuable metal contents within the process solutions was carried out via atomic emission spectrometry employing microwave-induced plasma.
The experimental design involved dual variations: temperature and acid concentration. The solid-to-liquid ratio was held constant at 25 g·L−1, with a rotational speed of 600 rpm, and a consistent 5 vol.% of reductant (H2O2) was employed to convert Co3+ to Co2+ in all trials. Sample collection intervals encompassed 1, 2, 4, 8, 16, 32, 64, 128, and 256 min time points for all experimental iterations.
Temperature variation spanned from 25 to 85 °C in increments of ten, maintaining a constant glucono-1.5-lactone concentration of 1 mol·l−1. Additionally, at a fixed leaching temperature of 85 °C, the gluconic acid concentrations of 0.5, 0.75, and 1 were subjected to testing.
Glucono-1.5-lactone (C6H10O6), also known as glucono delta-lactone (GDL), is a cyclic ester derived from gluconic acid and acts as a weak organic acid if solved in water. It has one carboxyl group. GDL is formed by the internal esterification of a hydroxyl group with the carboxyl group within the same molecule, resulting in the closure of the chain and the formation of the lactone ring. The dissociation reaction of hydrolyzed glucono-1.5-lactone is shown in Equation (1) [32].
In the context of the process’s “greenness”, the inclusion of hydrogen peroxide presents a nuanced impact. On the one hand, H2O2 serves as a reduction agent capable of effectively reducing organic content, aligning with the objective of minimizing environmental impact through the degradation of organic pollutants [33]. This aspect contributes positively to the eco-friendliness of the process by facilitating the breakdown of harmful substances. However, it is crucial to acknowledge that H2O2 can also initiate the generation of reactive oxygen species (ROS). While these ROS might play a role in driving reactions or influencing the process, their presence can introduce complexities in terms of process control and environmental impact [34]. ROS, depending on their concentration and nature, can potentially affect the efficiency of the reaction and, in higher concentrations, may pose environmental risks due to their reactivity [35]. Therefore, the role of H2O2 in this context is dual: it contributes to the oxidation of organic content, aligning with green objectives, yet it necessitates careful consideration due to its potential to generate reactive oxygen species, which can influence the process in diverse ways. Balancing the positive effects of H2O2 in organic content degradation with a comprehensive understanding and management of ROS formation becomes pivotal in assessing the overall “greenness” and environmental impact of the process [33,35]. Further exploration and discussion regarding the optimization and control of H2O2 concentration, reaction conditions, and potential mitigating strategies for ROS formation could enhance the understanding of its impact within the context of eco-friendly processes [33,34,35].
3. Results and Discussion
In this kinetics study, both the determination of the influence of acid concentration and temperature on the reaction rate of the dissolution of Co, Ni, and Li in gluconic acid, as well as the determination of the reaction order of the leaching process, were carried out.
3.1. Effect of Reaction Temperature
The effect of the reaction temperature (25 °C, 35 °C, 45 °C, 55 °C, 65 °C, 75 °C, 85 °C) and reaction time (1 min, 2 min, 4 min, 8 min, 16 min, 32 min, 64 min, 128 min, 256 min) was evaluated with a gluconic acid (glucono-1.5-lacton, C6H10O6) concentration of 1 mol·L−1, H2O2 concentration of 5 vol.%, solid/liquid (S/L) ratio of 25 g·L−1, and a stirring speed (ω) of 600 rpm. This step is performed to determine the effect of the reaction temperature on the leaching reaction of spent black mass. Figure 1 shows the effect of the reaction temperature on the leaching of cobalt, nickel and lithium at different reaction times. Based on this evaluation, it can be seen that the leaching efficiency of Ni, Co, and Li was increased by rising temperatures and longer leaching durations. These findings are consistent with other literature sources predicting improvement in the leaching of metals at elevated temperatures due to improved kinetic conditions [36].
For high leaching temperatures (e.g., 85 °C) and a leaching duration of at least 64 min, all evaluated metals could be transferred into a solution by more than 90%. It is particularly striking that lithium can be almost completely transferred into a solution after a very short time at correspondingly high temperatures. This can be related to the very high solubility of Li in acidic solutions. Furthermore, it was noticeable in the evaluation that for the other metal components (resp. Co and Ni), temperatures of at least 65 °C were necessary in the process in order to transfer more than 90% of the valuable metal into solution after a maximum duration of 256 min. Lower temperatures accordingly lead to lower yields and to a significant loss of these critical elements.
The experimental results demonstrated that under optimal conditions, significant leaching efficiency was achieved for cobalt, nickel, and lithium. Specifically, at a leaching temperature of 85 °C and with a minimum leaching duration of 64 min, we observed that over 90% of cobalt, nickel, and lithium could be successfully transferred into the solution.
3.2. Kinetic Analysis
In the kinetic analysis, the reactions that occurred during the leaching process could be determined using the shrinking core model. Therefore, in order to analyze the kinetic parameters and the rate-controlling step for the dissolving of black mass from spent lithium-ion batteries in gluconic acid solutions, a non-catalytic heterogeneous reaction model was assumed. The leaching reaction was divided into five steps within the context of the shrinking core theory [36,37]:
- The gluconic acid molecule (leaching agent) diffuses through the bulk solution to the solid-liquid interface.
- This molecule diffuses through the diffusion layer to the unreacted core surface.
- The gluconic acid molecule reaches this solid-liquid interface and reacts with solid core components, and metal ions are dissolved and released into the solution.
- The metal ion as the product will diffuse through the diffusion layer to the solid-liquid interface.
- The product diffuses into a bulk solution.
One of the following three processes could be the rate-limiting step in the reaction between solid particles and electrolytes: external diffusion of the reactant through the fluid’s boundary layer surrounding the particle, reaction on the solid’s surface between the fluid reactant and the solid, or internal diffusion of the reactant through the particle’s reaction products [30]. In order to better understand the leaching mechanism of black matter in gluconic acid, three distinct shrinking core models were examined (see Equations (2)–(4) [31].
- X—Fractional conversion (based on mole ratios of respective elements) [-]
- b’—Stoichiometric coefficient [-]; kg… Rate constant of film diffusion [min−1]
- cA—Bulk concentration of the fluid [mol·m−3]
- ρB—Molar density of B in the solid [mol·m−3]
- r0—Radius of unreacted core [mm]
- t—Reaction time [min]
- kr—Rate constant of surface reaction [min−1]
- kd—Apparent reaction rate constant [min−1]
- DB—Effective diffusion coefficient [m2·s−1]
In solid–liquid reactions, diffusion through the product layer or chemical reaction on the material’s surface is typically regulated by reaction rates. Based on the models for these two essential types of rate-limiting steps, the values of the rate constants and their correlation coefficients are shown in Table 2. The diffusion through the product layer on the material’s surface is the limiting stage for the dissolution of nickel, according to a thorough review of the data. For cobalt, the data situation does not seem to be as clear, as it can be concluded from the evaluations that a limitation by the chemical reaction at the reaction surface is to be expected. This different behavior to nickel can be explained by the necessary reduction of Co3+ to Co2+ in order to bring it into solution. This step is not necessary for the leaching of nickel, which explains the limitation of the dissolution of Co by the chemical reaction rate. Here, the correlation coefficients for the case of surface chemical reaction show the highest values and, thus, the best fit. Therefore, the simplified model for the relevant situation was used to linearize the values acquired from experiments related to temperature and acid content (see Equations (5) and (6)).
While acknowledging the non-catalytic assumption, it is important to note that the formation of reactive oxygen species could potentially induce auto-catalytic reactions, warranting further consideration in the study’s framework. The model graphs for temperature and the corresponding linearization are provided in Figure 2. From the slopes, apparent rate constants kc and kd were discovered.
Because the correlation coefficients are partially in undesirable ranges, the data for the dissolution of lithium do not provide satisfactory results for either of the analyzed models. As a result, it is not feasible to make a definitive claim regarding a reaction- or diffusion-controlled rate-determining step. On the other hand, it may be demonstrated using the data that lithium dissolves totally far more quickly than cobalt and nickel do, even at lower temperatures. Lithium dissolution is thus unquestionably the stage of this leaching mechanism that moves forward the fastest and is, therefore, not investigated further. Future work could involve high-resolution temporal analysis of lithium dissolution in the early stages of the leaching process, possibly utilizing more sensitive analytical techniques to capture the rapid kinetics.
Furthermore, it can be seen that a satisfactory fit of the data is achieved at low temperatures but that this situation deteriorates considerably at higher temperatures. This could be attributed to several factors that complicate the kinetics at elevated temperatures, such as changes in the rate-limiting step due to increased reaction rates, possible formation of secondary phases that could impact the leaching mechanism, or limitations in the model’s ability to capture complex processes occurring at high temperatures. Given these discrepancies, it may be necessary to consider more complex models that can account for multiple concurrent processes or changes in the rate-limiting step with temperature. Additionally, experimental factors such as particle agglomeration, changes in the surface area, or the impact of increased thermal motion at higher temperatures might need to be more thoroughly investigated to provide a comprehensive understanding of the kinetics.
3.3. Calculation of Activation Energy
The Arrhenius equation provided in Equation (7) can be used to determine the activation energy of Co and Ni based on the findings of kinetics studies depending on reaction temperature [31].
The pre-exponential factor is represented as A [min−1], Ea is the activation energy [kJ·mole−1], and T represents the reaction temperature [K]. The kc value derived from the surface chemical reaction control model is used to create an Arrhenius plot to determine the activation energy of Co, and the corresponding value of kd derived from the diffusion-controlled model is applied to calculate the activation energy of Ni. The Arrhenius plot of the nickel and cobalt leaching process is shown in Figure 3.
The value of activation energy for Ni and Co could be estimated based on the linear regression. The value of −Ea/R is represented by the linear regression’s slope. Table 3 shows the activation energy value using the surface chemical reaction model.
The value of activation energy for Ni and Co amounts to 70.1 kJ·mole−1 and 28.2 kJ·mole−1, respectively. Typically, a value of lower than 20 kJ·mole−1 indicates the presence of a diffusion-controlled system, whereas values greater than 40 kJ·mole−1 suggest a chemically controlled reaction [38]. However, Baba et al. [39] and Olanipekun [40] claimed that also diffusion-controlled reactions have unexpectedly high activation energies. It is worth emphasizing that, in certain cases, predicting the rate-controlling mechanism of the heterogeneous dissolution process can be more effectively achieved through the utilization of kinetic equations as opposed to relying solely on activation energy.
Furthermore, the assumption that the dissolution of nickel is diffusion-controlled can, nevertheless, be confirmed by the review of the data (R2 = 0.96), while the value of the activation energy for Co indicates a rather reaction-controlled regime. Since the correlation coefficient for Co is 0.93, a reaction-controlled mechanism can be assumed. Aydogan et al. [41] showed that a chemically regulated process is substantially dependent on temperature, whereas a diffusion-controlled process is only minimally dependent on it. Since the data from the kinetics study indicate a strong temperature dependence of the dissolution process for cobalt, a reaction-controlled model can certainly be assumed.
3.4. Determination of Reaction Order
The elucidation of the reaction order holds paramount significance in achieving a comprehensive portrayal of a reaction’s kinetics. Within this investigation, a series of experiments were conducted at a temperature of 85 °C, maintaining a consistent solid-to-liquid (S/L) ratio of 25 g·L−1, coupled with a supply of 5 vol.% H2O2. These experiments were performed under varying acid concentrations (0.5, 0.75, and 1 M) with the primary objective of ascertaining the aforementioned reaction order. The subsequent analysis of the concentrations of nickel and cobalt within the resultant solutions juxtaposed against the reaction duration is graphically depicted in Figure 4.
Utilizing reaction rate equations established in prior literature works enables the determination of the associated reaction order. In instances where the reaction adheres to first-order kinetics, it is recommended to employ Equation (8), whereas for reactions following second-order kinetics, Equation (9) is the more suitable choice [30].
To elucidate the reaction order for this study, kinetic curves (represented in Figure 4) were linearized by means of Equations (8) and (9) for Ni and Co, respectively.
A plot of ln(k) vs. c(C6H10O6) was used to study the impact of gluconic acid concentration on reaction rate (see Figure 5). According to Figure 5a,c, a good linear relationship is presented. Moreover, the supplementary data depicted in Figure 5 underscores that the correlation coefficients associated with the leaching of Ni and Co, when fitted to first-order reaction models, consistently surpass 0.9 across all presented scenarios. This compelling consistency supports the inference of first-order reaction kinetics, implying a direct proportionality between the reaction rate and the reactant concentrations.
3.5. Influence of Mean Particle Sizes
The black mass employed in this study was segregated into three distinct particle size categories (40–45 µm, 45–63 µm, and 63–125 µm) to investigate the impact of particle size on leaching behavior. Leaching procedures were conducted at 85 °C using a solution of 1 M gluconic acid, a solid–liquid ratio of 25 g·L−1, and the addition of 5 vol.% of H2O2. The sampling intervals remained consistent with those employed in our previous experiments. The results of these tests in dependency on the grain classes used can be seen in Figure 6.
Subsequently, the leaching mechanism was analyzed regarding the corresponding nickel and cobalt dissolution, and models were applied to interpret the data for the aforementioned particle size categories (arithmetic mean value, see Table 4).
For cobalt, the assumption of a reaction-controlled regime revealed that the most pronounced reaction rates were achieved with smaller particle diameters. This observation suggests that reaction rates increase as particle size diminishes, primarily due to the increased surface area. Minor fluctuations in the rate constant values for cobalt across the defined grain classes can be attributed to the inherent particle diversity and heterogeneity within the input material. For nickel, the diffusion-controlled regime shows that the difference in particle size plays a subordinate role.
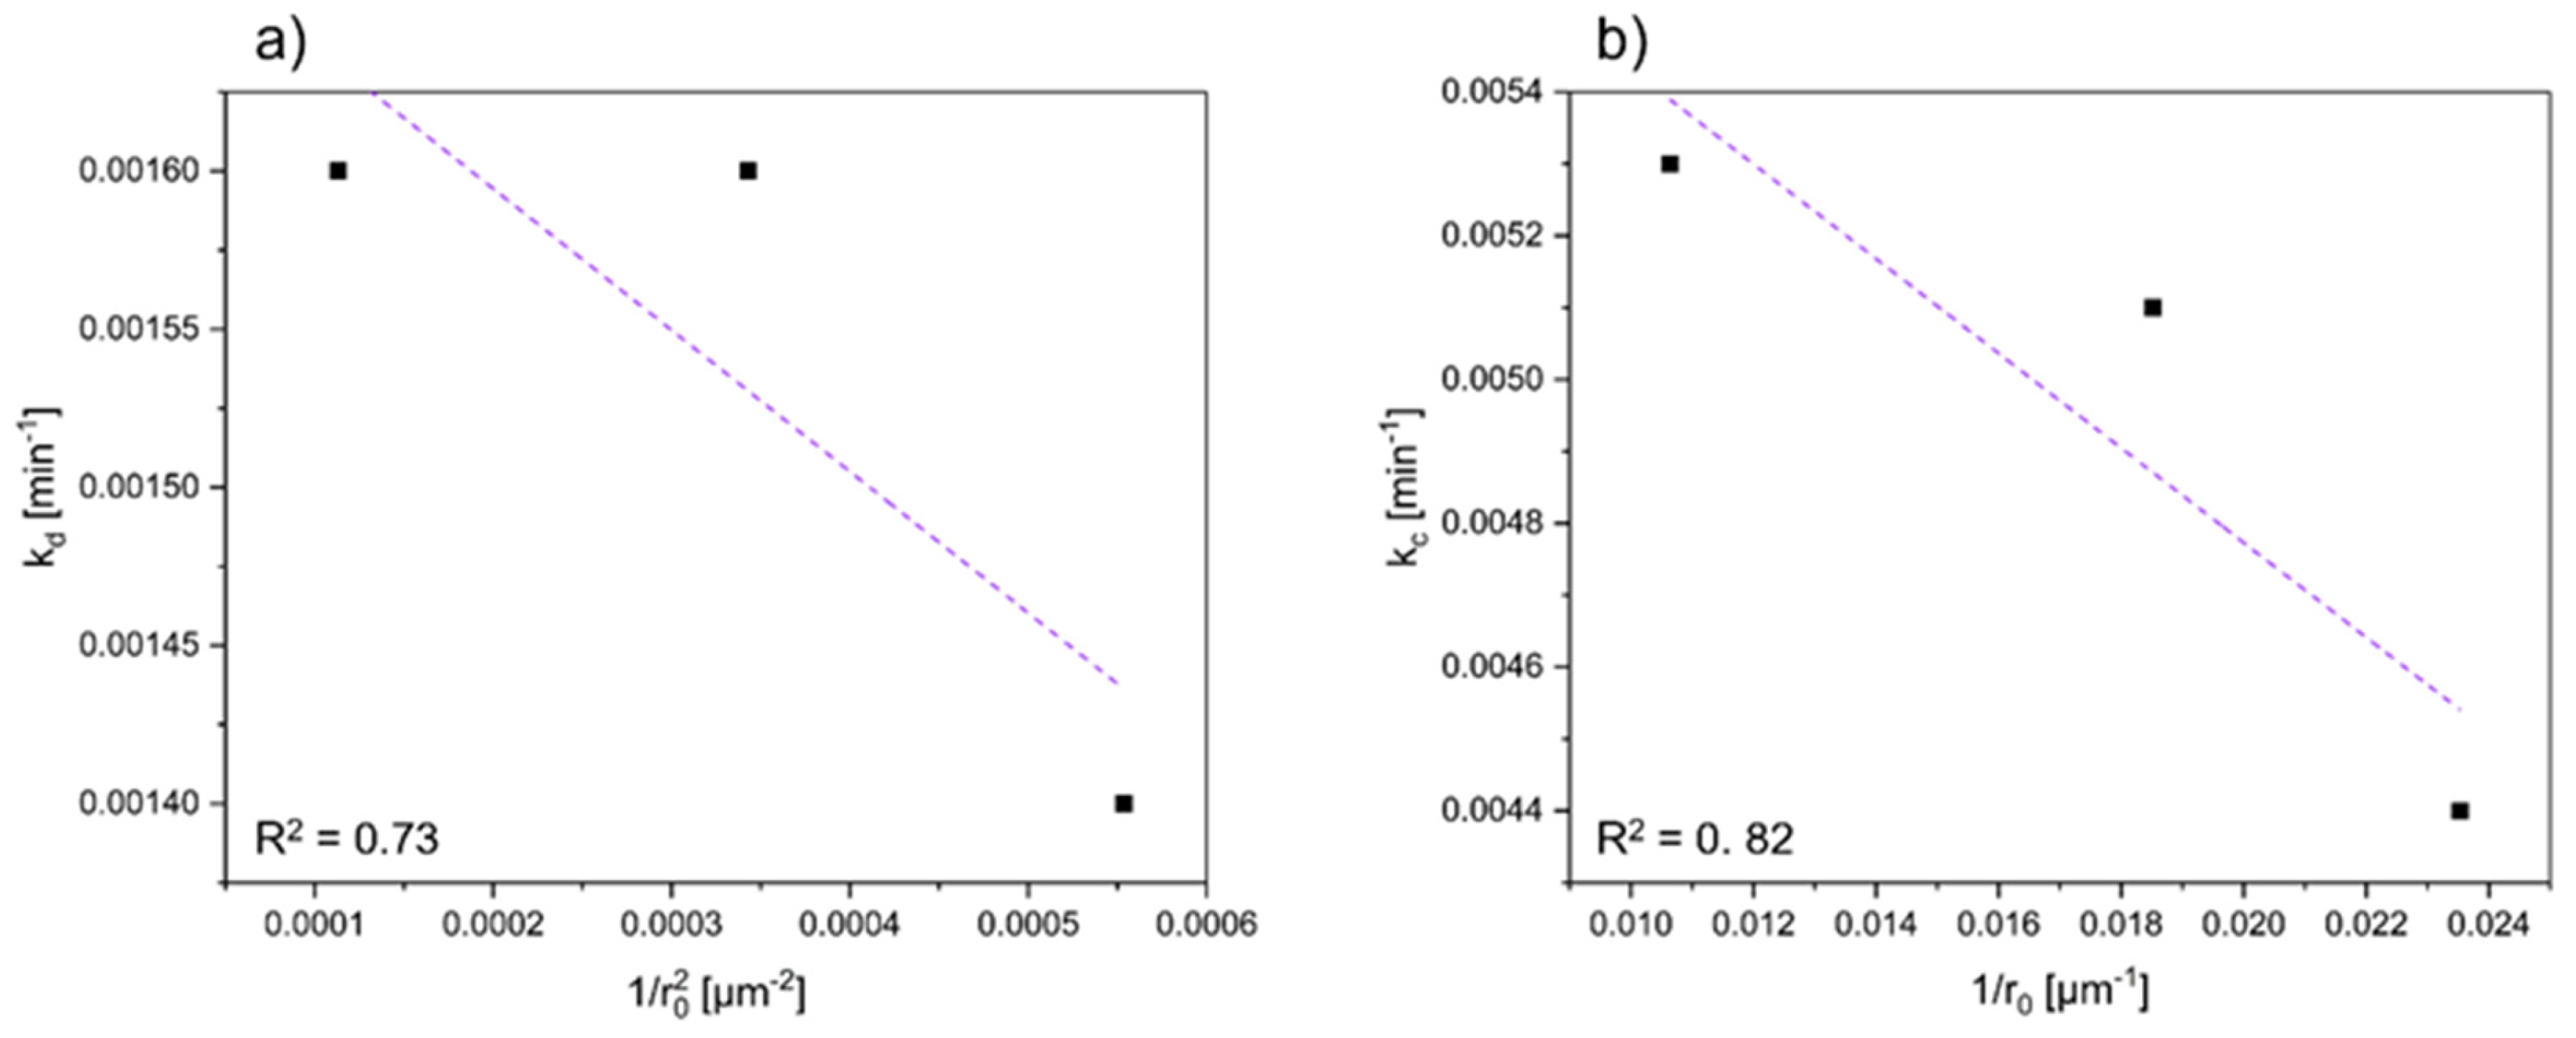
To elucidate the pivotal rate-determining step in this investigation, the kinetic analyses were elaborated, as illustrated in Figure 7. These analyses involved the linearization of kinetic data using Equation (5). In cases where the reaction rate is predominantly controlled by chemical reaction, there exists a linear correlation between the apparent rate constant and the reciprocal value of the particle radius, represented as 1/r0. As shown in Figure 7, a linear relationship between k and 1/r0 values could indeed be observed, affirming that the rate-limiting step in this process is the chemical reaction for cobalt. In comparison, a linearization of the data for nickel shows a dependence on the representation 1/r02, which in turn supports the assumption of a diffusion-controlled reaction. The values for the correlation coefficient, which are significantly below 0.9, can be attributed to the inhomogeneity of the input material, and corresponding deviations can, therefore, not be completely ruled out.
4. Conclusions
The dissolution kinetics of the black mass derived from spent lithium-ion batteries within an acidic gluconic electrolyte have been systematically examined across a temperature spectrum spanning 25–85 °C and acid concentrations ranging from 0.5 to 1 mol·l−1. Drawing insights from the outcomes garnered through the conducted experiments, the ensuing conclusions can be drawn.
The experimental results revealed the correlation between reaction temperature, leaching duration, and the leaching efficiency of cobalt, nickel, and lithium. Notably, the leaching efficiency of these metals exhibited an upward trend with increasing temperature and prolonged leaching times. At elevated leaching temperatures, e.g., 85 °C, and with leaching times exceeding 64 min, a remarkable outcome was observed. More than 90% of the evaluated metals could be successfully transferred into the solution. Particularly noteworthy was the rapid transfer of lithium, nearly achieving full solubility within a short period at high temperatures, attributed to its small size and high solubility in acidic solutions.
Drawing from the kinetics investigation, the leaching mechanism governing the dissolution of cobalt from black mass through gluconic acid was found to align with the surface chemical reaction control model, while a diffusion-controlled regime was found for the dissolution of nickel. This results in different rate-limiting steps for the leaching process of cobalt and nickel from black mass. This can be explained by the necessity of reducing Co3+ to Co2+. The addition of a reducing agent (e.g., H2O2) makes this reaction possible but requires that, in contrast to the dissolution of nickel, there is no diffusion-determined regime.
The activation energy values for nickel and cobalt were determined to be 70.1 and 28.2 kJ·mol−1, respectively. The attained outcomes indicate that the leaching reaction of cobalt and nickel follows a first-order reaction kinetics.
In the context of lithium dissolution, comprehensive evaluation within this study proved challenging due to the rapid nature of the dissolution process. As a result, the conclusive assessment of lithium behavior was not attainable within the parameters of this investigation.
Author Contributions
Conceptualization, E.G. and R.L.; methodology, E.G.; software, E.G.; validation, E.G.; formal analysis, E.G.; investigation, E.G.; resources, H.A.; data curation, E.G.; writing—original draft preparation, E.G.; writing—review and editing, E.G. and H.A.; visualization, E.G.; supervision, H.A.; project administration, E.G.; funding acquisition, E.G. All authors have read and agreed to the published version of the manuscript.
Funding
This research received no external funding.
Data Availability Statement
The data presented in this study are available in article.
Conflicts of Interest
The authors declare no conflicts of interest.
References
- Meshram, P.; Mishra, A.; Sahu, R. Environmental impact of spent lithium ion batteries and green recycling perspectives by organic acids—A review. Chemosphere 2020, 242, 125291. [Google Scholar] [CrossRef] [PubMed]
- Kresse, C.; Bastian, D.; Bookhagen, B. Lithium-Ionen-Batterierecycling in Deutschland und Europa; Bundesanstalt für Geowissenschaften und Rohstoffe: Hannover, Germany, 2022. [Google Scholar]
- Zechmeister, A.; Anderl, M.; Bartel, A.; Frei, E.; Gugele, B.; Gössl, M.; Mayer, S.; Heinfellner, H.; Heller, C.; Heuberet, A.; et al. Klimaschutzbericht 2022; Report; Umweltbundesamt: Wien, Austria, 2022. [Google Scholar]
- Statista: Annual Greenhouse Gas Emissions in the European Union (EU-27) from 1990 to 2021, by Sector. Available online: https://www.statista.com/statistics/1171183/ghg-emissions-sector-european-union-eu/ (accessed on 6 June 2023).
- IEA. Global Electric Vehicle Outlook 2022; IEA: Paris, France, 2022. [Google Scholar]
- Presse—Und Informationsamt der Bundesregierung: EU-Umweltrat: Nur Noch CO2-Frei Fahren. Available online: https://www.bundesregierung.de/breg-de/schwerpunkte/europa/verbrennermotoren-2058450 (accessed on 29 March 2022).
- Vertretung in Deutschland: EU-Staaten Stimmen—Endgültig—Für Emissionsfreie Autos ab 2035. Available online: https://germany.representation.ec.europa.eu/news/eu-staaten-stimmen-endgultig-fur-emissionsfreie-autos-ab-2035-2023-03-28_de (accessed on 3 April 2023).
- Europäische Kommission. Der Europäische Gründe Deal—Mitteilung der Kommission an das Europäische Parlament, den Europäischen Rat, den Rat, den Europäischen Wirtschafts- und Sozialausschuss und den Ausschuss der Regionen—Der Europäische Grüne Deal; Europäische Kommission: Brussels, Belgium, 2019. [Google Scholar]
- Europäische Kommission. Die Europäische Batterie-Allianz Macht Fortschritte: Gründung einer Europäischen Batterieakademie zur Verbesserung der Fähigkeiten für ein Rasch Wachsendes Batterieökosystem in Europa; Europäische Kommission: Brussels, Belgium, 2022. [Google Scholar]
- Europäische Kommission. Verordnung des Europäischen Parlaments über Batterien und Altbatterien, zur Aufhebung der Richtlinie 2006/66/EG und zur Änderung der Verordnung (EU) 2019/1020; Europäische Kommission: Brussels, Belgium, 2020. [Google Scholar]
- European Commission. Critical Raw Materials: Ensuring Secure and Sustainable Supply Chains for EU’s Green and Digital Future; European Commission: Brussels, Belgium, 2023. [Google Scholar]
- 2023/0081 (COD); Verordnung des Europäischen Parlaments und des Rates zur Schaffung eines Rahmens für Maßnahmen zur Stärkung des Europäischen Ökosystems der Fertigung von Netto-Null-Technologieprodukten (Netto-Null-Industrie-Verordnung). European Commission: Brussels, Belgium, 2023.
- Blengini, G.A.; Latunussa, C.E.L.; Eynard, U.; de Matos, C.T.; Wittmer, D.; Georgitzikis, K.; Pavel, C.; Carrara, S.; Mancini, L.; Unguru, M.; et al. Study on the EU’s List of Critical Raw Materials; Publications Office of the European Union: Luxembourg, 2020. [Google Scholar]
- Sidiq, A.L.; Floweri, O.; Karunawan, J.; Abdillah, O.B.; Santosa, S.P.; Iskandar, F. NCM cathode active materials reproduced from end-of-life Li-ion batteries using a simple and green hydrometallurgical recycling process. Mater. Res. Bull. 2022, 153, 111901. [Google Scholar] [CrossRef]
- Becker, R.; Fanghänel, E.; Habicher, W.-D.; Knölker, H.-J.; Metz, P.; Schwetick, K. Organikum—Organisch-Chemisches Grundpraktikum; Wiley-VCH Verlag: Weinheim, Germany, 2015. [Google Scholar]
- Lerchbammer, R.; Gerold, E.; Antrekowitsch, H. Gluconic acid leaching of spent lithium-ion batteries as an environmentally friendly approach to achieve high leaching efficiencies in the recycling of NMC active material. Metals 2023, 13, 1330. [Google Scholar] [CrossRef]
- Singh, O.V.; Kumar, R. Biotechnological production of gluconic acid: Future implications. Appl. Microbiol. Biotechnol. 2007, 75, 713–722. [Google Scholar] [CrossRef] [PubMed]
- Anastassiadis, S.; Morgunov, I.G. Gluconic acid production. Recent Pat. Biotechnol. 2007, 1, 167–180. [Google Scholar] [CrossRef] [PubMed]
- Liang, Z.; Ding, X.; Cai, C.; Peng, G.; Hu, J.; Yang, X.; Chen, S.; Liu, L.; Hou, H.; Liang, S.; et al. Acetate acid and glucose assisted subcritical reaction for metal recovery from spent lithium ion batteries. J. Clean. Prod. 2022, 369, 133281. [Google Scholar] [CrossRef]
- Yao, L.; Xi, Y.; Han, H.; Li, W.; Wang, C.; Feng, Y. LiMn2O4 prepared from waste lithium ion batteries through sol-gel process. J. Alloys Compd. 2021, 868, 159222. [Google Scholar] [CrossRef]
- Choi, J.-W.; Cho, C.-W.; Yun, Y.-S. Organic acid-based linear free energy relationship models for green leaching of strategic metals from spent lithium-ion batteries and improvement of leaching performance. J. Hazard. Mater. 2022, 423, 127214. [Google Scholar] [CrossRef] [PubMed]
- Wong, C.M.; Wong, K.H.; Chen, X.D. Glucose oxidase: Natural occurrence, function, properties and industrial applications. Appl. Microbiol. Biotechnol. 2008, 78, 927–938. [Google Scholar] [CrossRef] [PubMed]
- Bankar, S.B.; Bule, M.V.; Singhal, R.S.; Ananthanarayan, L. Glucose oxidase—An overview. Biotechnol. Adv. 2009, 27, 489–501. [Google Scholar] [CrossRef] [PubMed]
- Li, C.; Lin, J.; Gao, L.; Lin, H.; Lin, J. Modeling and simulation of enzymatic gluconic acid production using immobilized enzyme and CSTR-PFTR circulation reaction system. Biotechnol. Lett. 2018, 40, 649–657. [Google Scholar] [CrossRef] [PubMed]
- Chen, X.; Fan, B.; Xu, L.; Zhou, T.; Kong, J. An atom-economic process for the recovery of high value-added metals from spent lithium-ion batteries. J. Clean. Prod. 2016, 112, 3562–3570. [Google Scholar] [CrossRef]
- Wang, Y.; Xu, Z.; Zhang, X.; Yang, E.; Tu, Y. A green process to recover valuable metals from the spent ternary lithium-ion batteries. Sep. Purif. Technol. 2022, 299, 121782. [Google Scholar] [CrossRef]
- Gok, O.; Anderson, C.G.; Ciceli, G.; Cocen, E.I. Leaching kinetics of copper from chalcopyrite concentrate in nitrous-sulfuric acid. Physiochem. Probl. Miner. Process. 2013, 50, 399–413. [Google Scholar]
- Yuliusman, S.; Nurqomariah, A.; Fajaryanto, R. Recovery of cobalt and nickel from spent lithium ion batteries with citric acid using leaching process: Kinetics study. E3S Web Conf. 2018, 67, 03008. [Google Scholar] [CrossRef]
- Yuliusman, S.; Fajaryanto, R.; Nurqomariah, A. Acid leaching and kinetics study of cobalt recovery from spent lithium-ion batteries with nitric acid. E3S Web Conf. 2018, 67, 03025. [Google Scholar] [CrossRef]
- Zheng, Y.; Long, H.L.; Zhou, L.; Wu, Z.S.; Zhou, X.; You, L.; Yang, L.; Liu, J.W. Leaching Procedure an Kinetic Studies of Cobalt in Cathode Materials from Spent Lithium Ion Batteries Using Organic Citric Acid as Leachant. Int. J. Environ. Res. 2016, 10, 159–168. [Google Scholar]
- Levenspiel, O. Chemical Reaction Engineering, 2nd ed.; John Wiley: New York, NY, USA, 1972. [Google Scholar]
- Horeh, N.B.; Mousavi, S.M.; Shojaosadati, S.A. Bioleaching of valuable metals from spent lithium-ion mobile phone batteries using Aspergillus niger. J. Power Sources 2016, 320, 257–266. [Google Scholar] [CrossRef]
- Cheng, X.; Guo, G.; Cheng, Y.; Liu, M.; Ji, J. Effect of Hydrogen Peroxide on the Recovery of Valuable Metals from Spent LiNi0.6Co0.2Mn0.2O2 Batteries. Energy Technol. 2022, 10, 220039. [Google Scholar] [CrossRef]
- Nicol, M.J. The role and use of hydrogen peroxide as an oxidant in the leaching of minerals 1. Acid Solut. Hydrometall. 2020, 193, 105328. [Google Scholar] [CrossRef]
- Sun, F.; Chen, T.; Zou, X.; Liu, H.; Chu, Z.; Shu, D.; Wang, H.; Huang, F.; Chen, D. A quantitative analysis of hydroxyl radical generation as H2O2 encounters siderite: Kinetics and effect of parameters. Appl. Geochem. 2021, 126, 104893. [Google Scholar] [CrossRef]
- Fan, B.; Chen, X.; Zhou, T.; Zhang, J.; Xu, B. A Sustainable process for the recovery of valuable metals from spent lithium-ion batteries. Waste Manag. Res. 2016, 34, 474–481. [Google Scholar] [CrossRef] [PubMed]
- Li, L.; Bian, Y.; Zhang, X.; Guan, Y.; Fan, E.; Wu, F.; Chen, R. Process for recycling mixed-cathode materials from spent lithium-ion batteries and kinetics of leaching. Waste Manag. 2018, 71, 362–371. [Google Scholar] [CrossRef] [PubMed]
- Jackson, E. Hydrometallurgical Extraction and Reclamation; Ellis Horwood Ltd.: Chichester, UK, 1982; pp. 46–47. [Google Scholar]
- Baba, A.A.; Adekola, F.A.; Bale, R.B. Study of dissolution kinetics of a Nigerian cassiterite ore by hydrochloric acid. Sci. Focus 2009, 14, 198–207. [Google Scholar]
- Olanipekun, E.O. A kinetics study of the leaching of a Nigerian ilmenite ore by hydrochloric acid. Hydrometallurgy 1999, 53, 1–10. [Google Scholar] [CrossRef]
- Aydogan, S.; Aras, A.; Uçar, G.; Erdemoğlu, M. Dissolution kinetics of galena in acetic acid solutions with hydrogen peroxide. Hydrometallurgy 2007, 89, 189–195. [Google Scholar] [CrossRef]
Figure 1.
Effect of the reaction temperature in the leaching process on (a) nickel, (b) cobalt, and (c) lithium recovery (initial leaching conditions: c(C6H10O6) = 1 M, c(H2O2) = 5 vol.%, S/L ratio = 25 g/L, ω = 600 rpm).
Figure 1.
Effect of the reaction temperature in the leaching process on (a) nickel, (b) cobalt, and (c) lithium recovery (initial leaching conditions: c(C6H10O6) = 1 M, c(H2O2) = 5 vol.%, S/L ratio = 25 g/L, ω = 600 rpm).
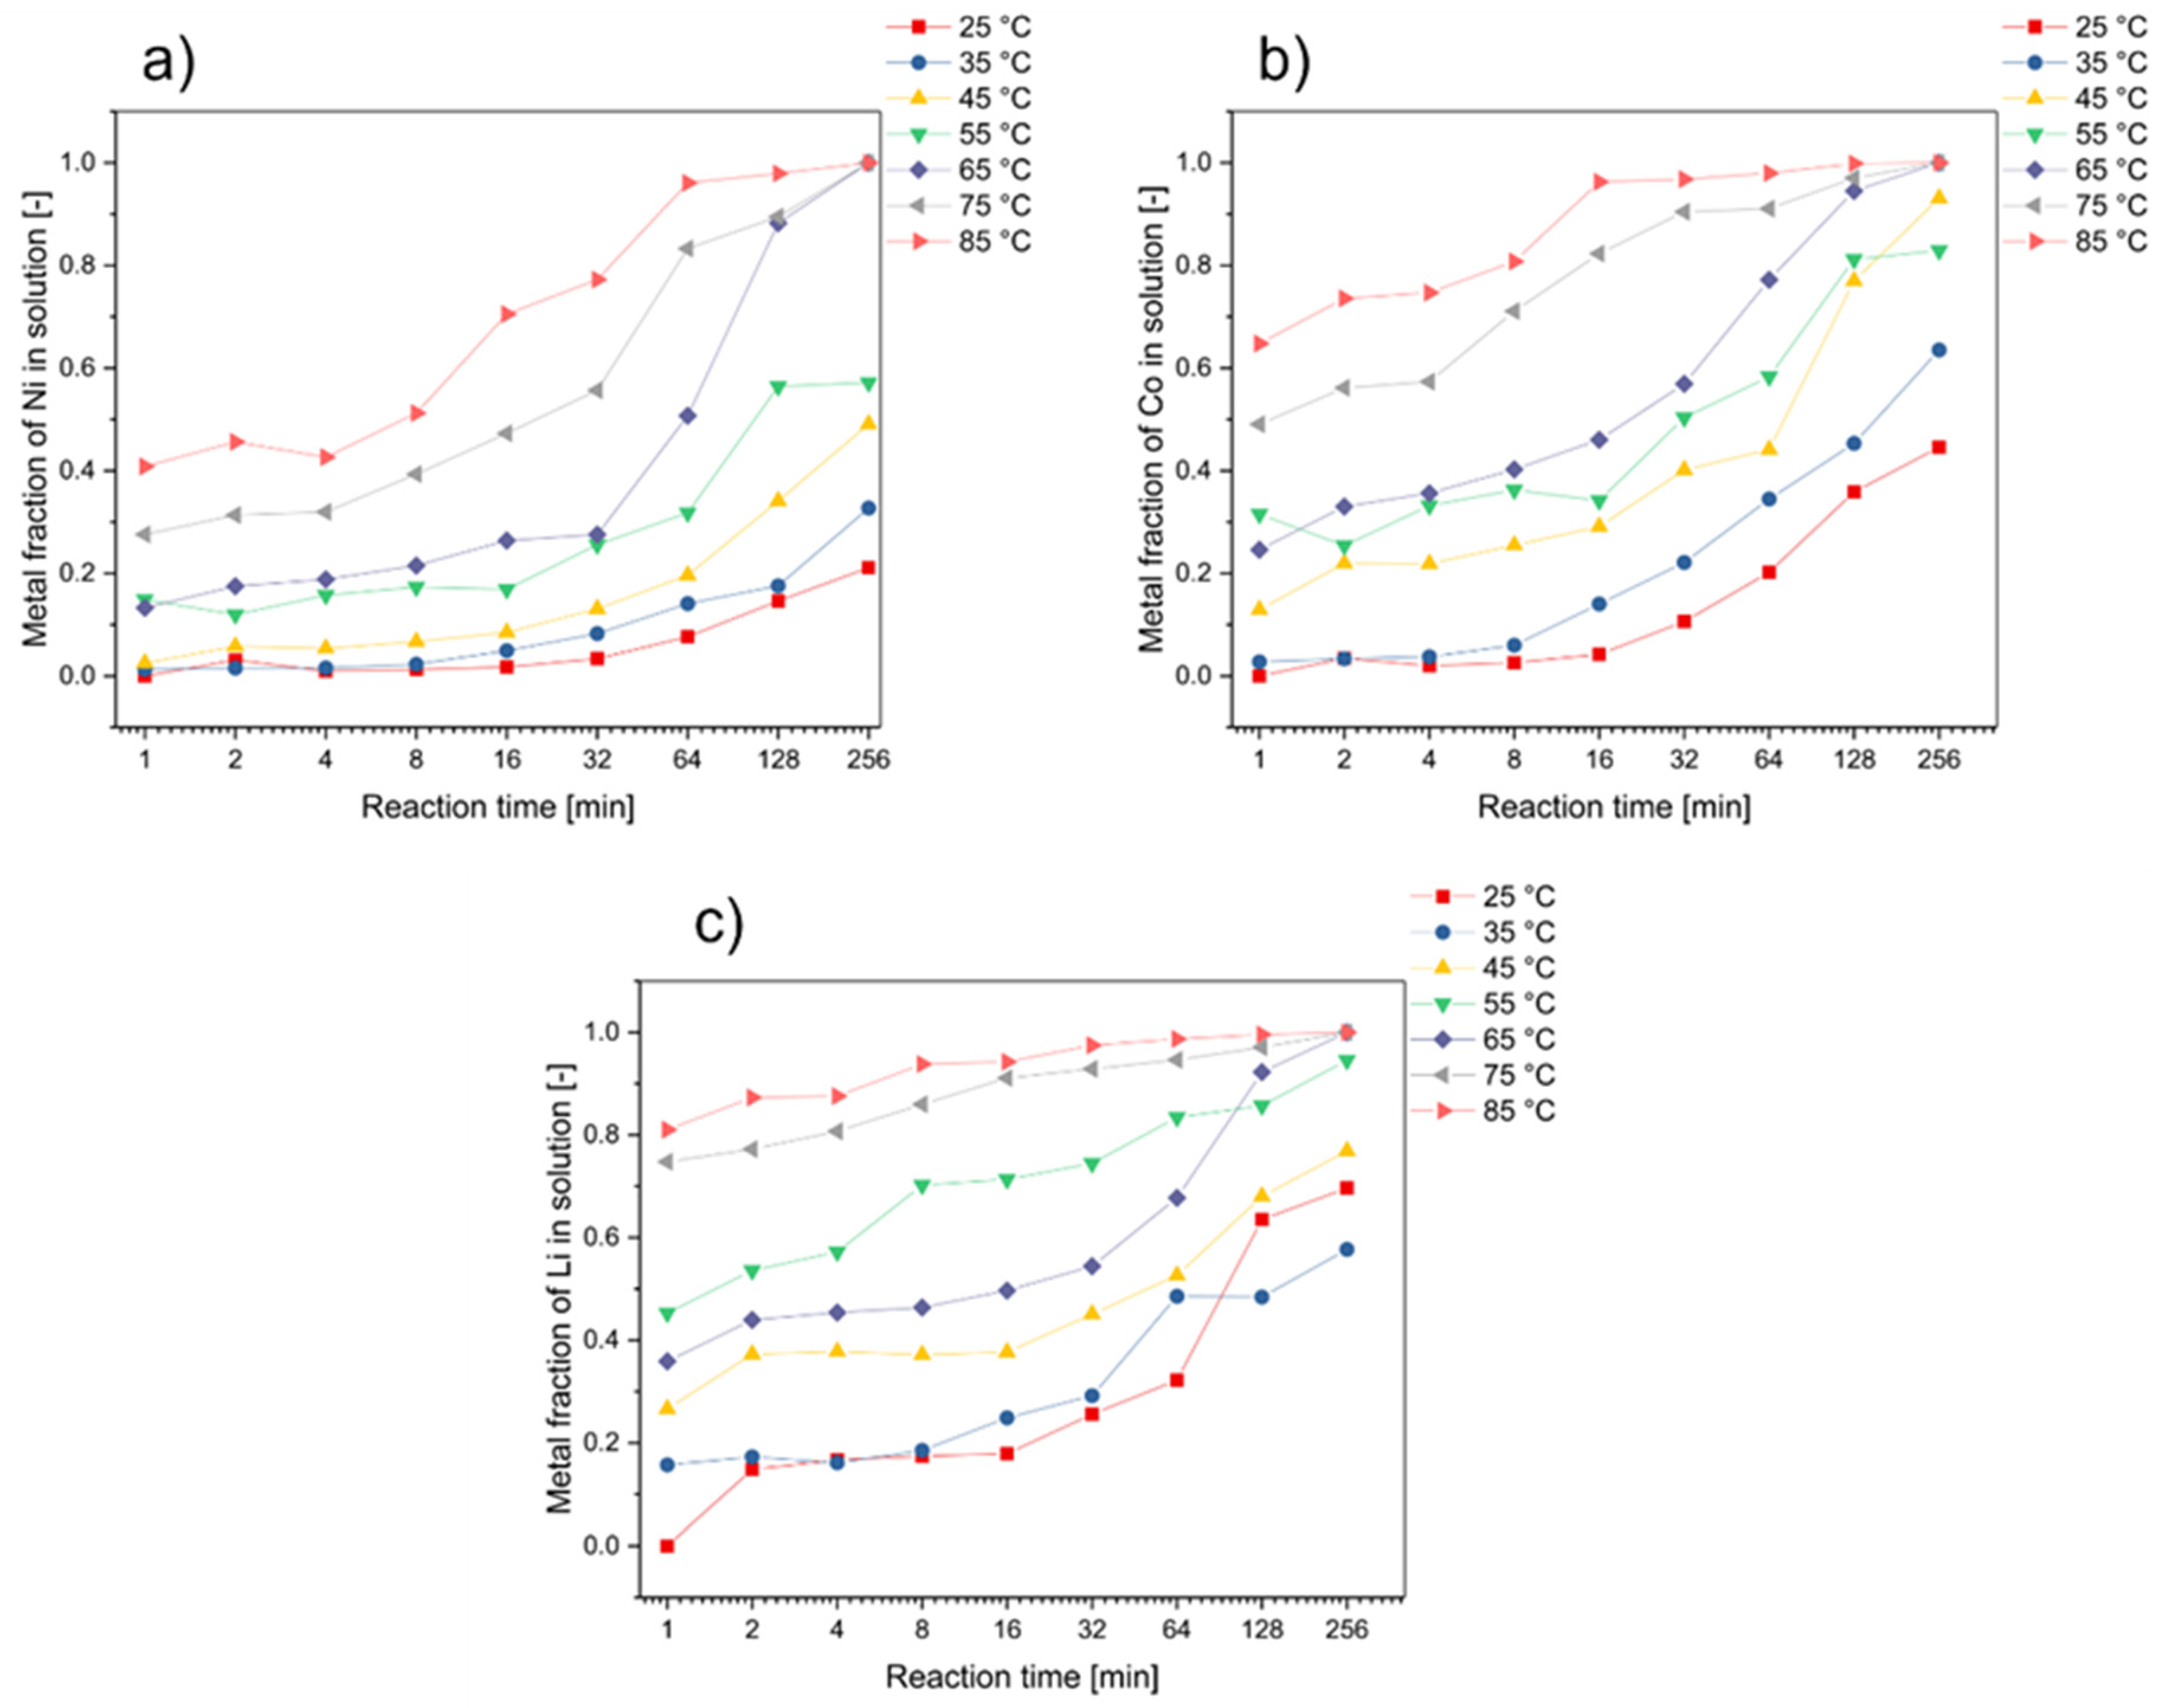
Figure 2.
Plot of the surface chemical reaction model for the effect of temperature on the reaction rate in dependence of reaction time based on the reaction-controlled model for (a) nickel and (b) cobalt, as well as based on the diffusion-controlled model for (c) nickel and (d) cobalt.
Figure 2.
Plot of the surface chemical reaction model for the effect of temperature on the reaction rate in dependence of reaction time based on the reaction-controlled model for (a) nickel and (b) cobalt, as well as based on the diffusion-controlled model for (c) nickel and (d) cobalt.
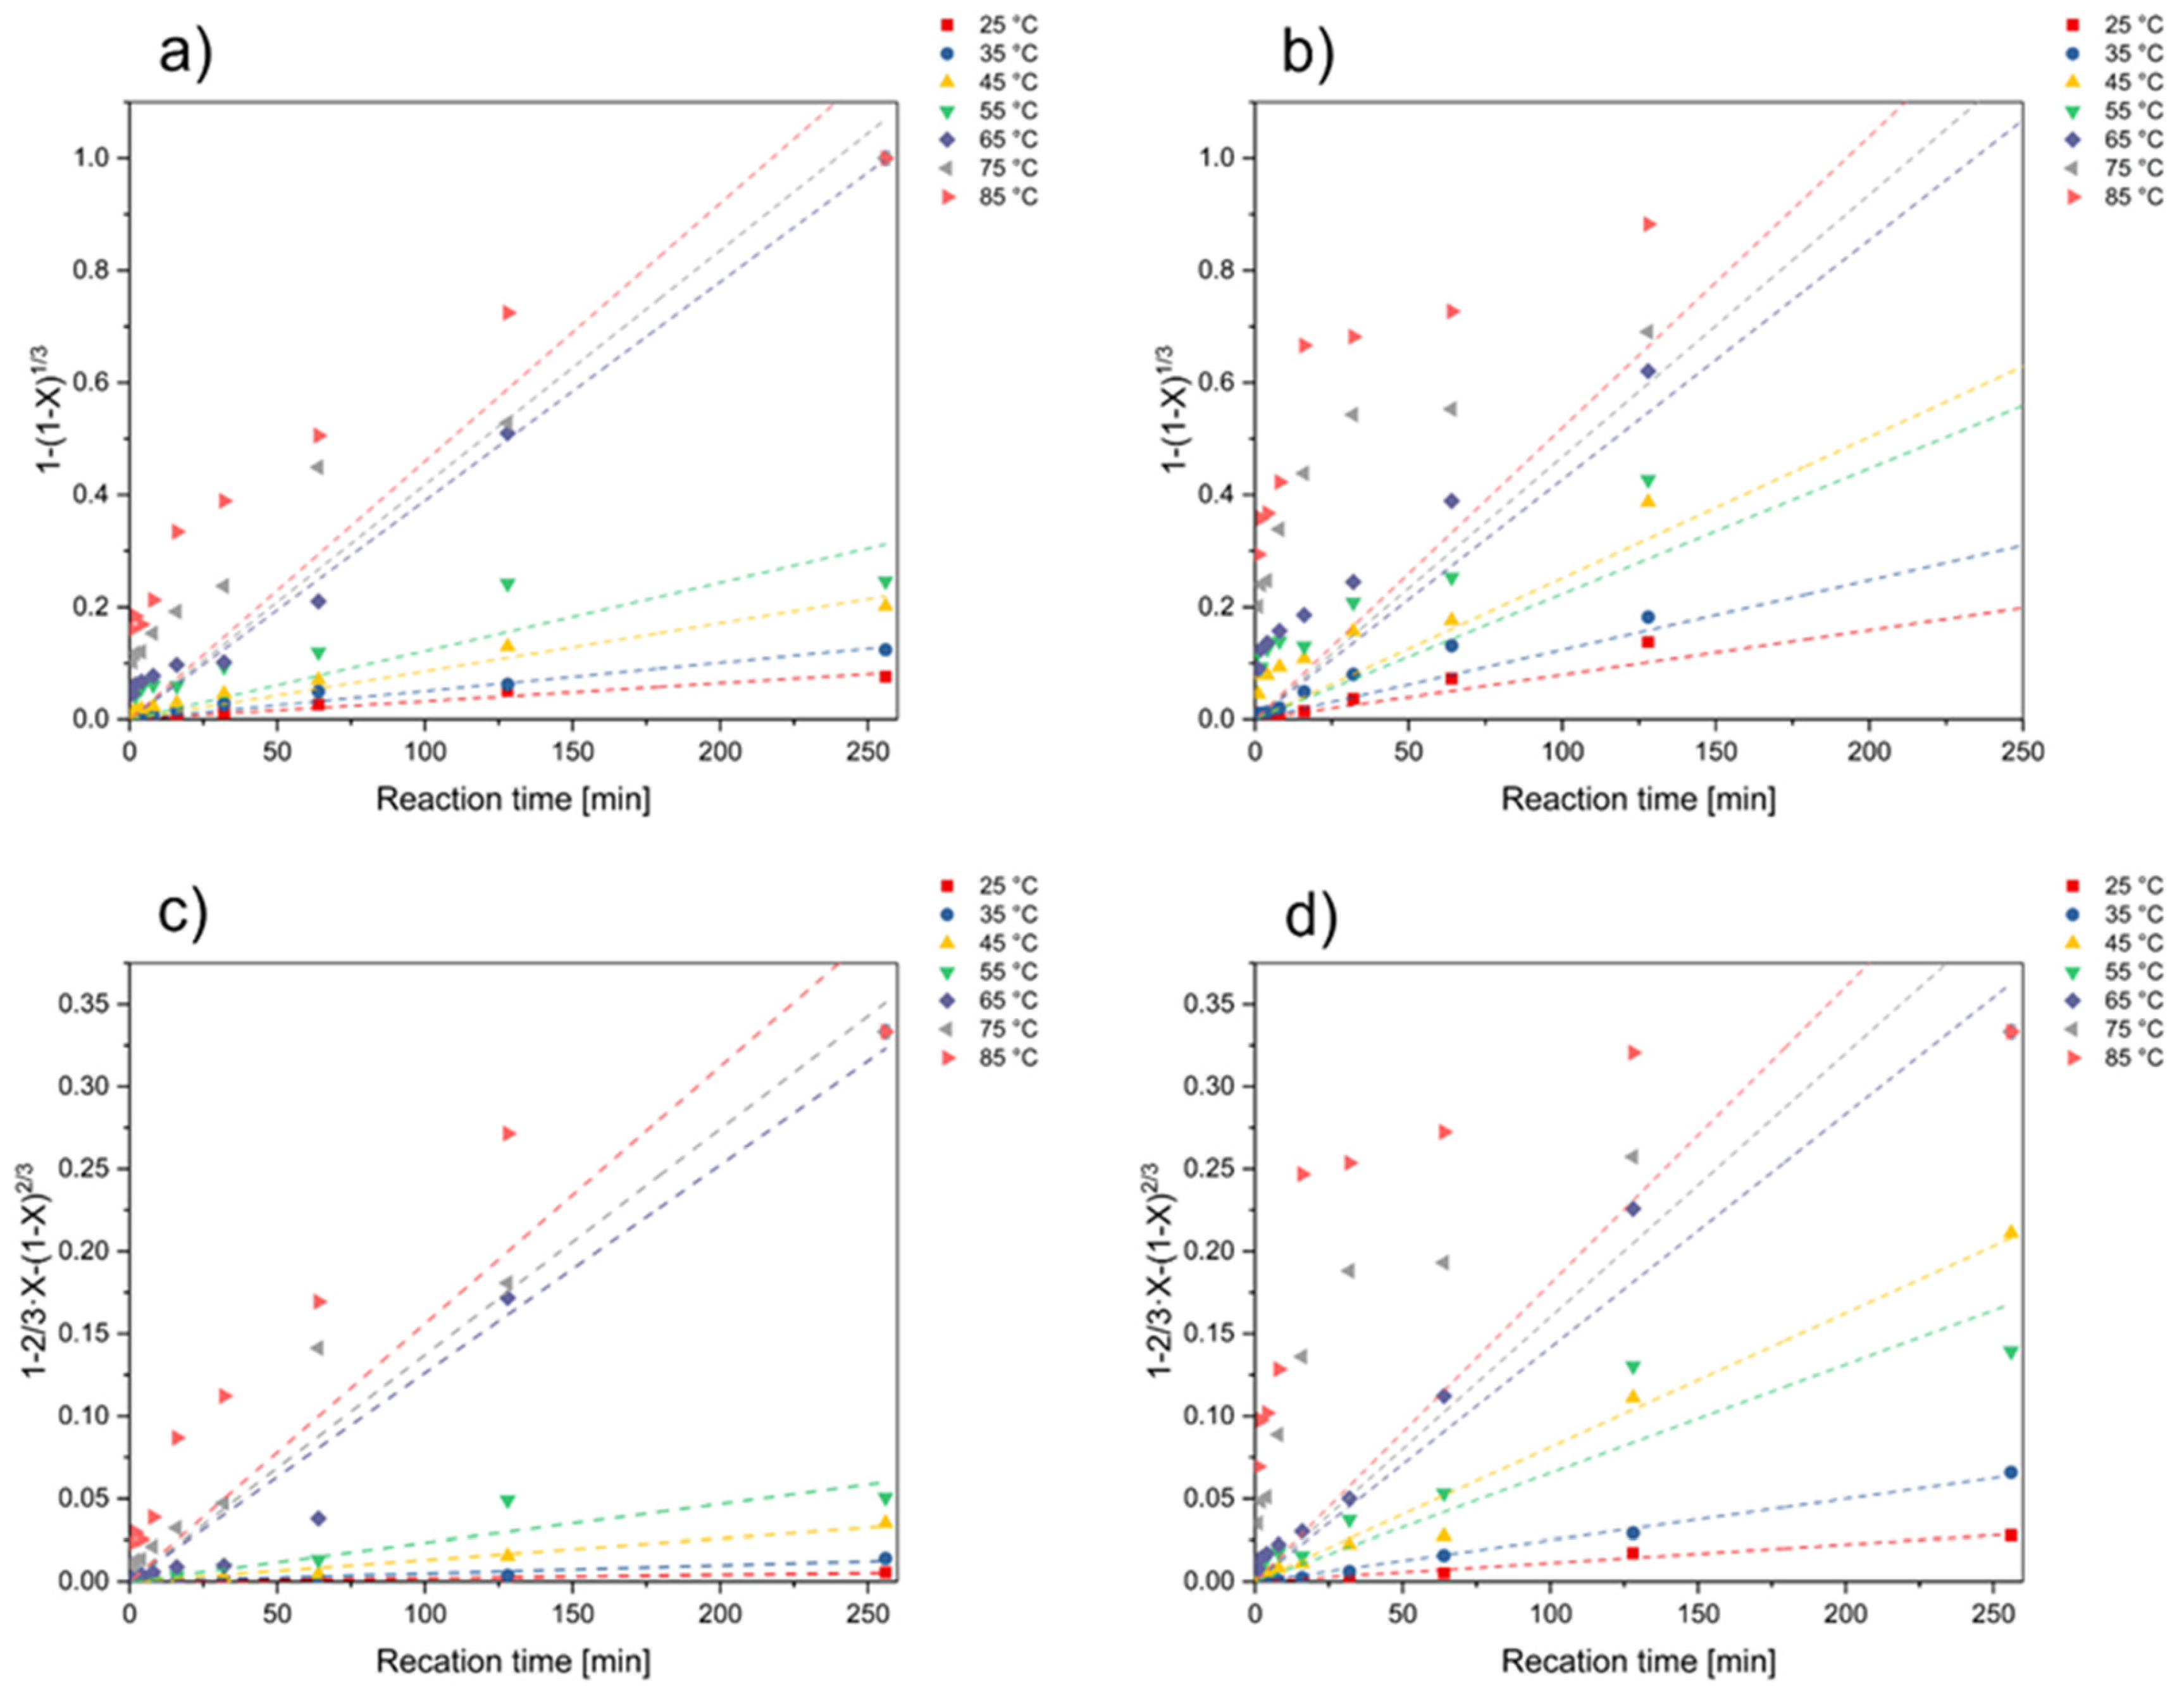
Figure 3.
Arrhenius plot of leaching for (a) nickel based on a diffusion-controlled model and (b) cobalt based on a reaction-controlled model.
Figure 3.
Arrhenius plot of leaching for (a) nickel based on a diffusion-controlled model and (b) cobalt based on a reaction-controlled model.

Figure 4.
Effect of gluconic acid concentration (C6H10O6) in the leaching process on (a) nickel and (b) cobalt leaching (initial leaching conditions: T = 85 °C, c(H2O2) = 5 vol.%, S/L ratio = 25 g/L, ω = 600 rpm).
Figure 4.
Effect of gluconic acid concentration (C6H10O6) in the leaching process on (a) nickel and (b) cobalt leaching (initial leaching conditions: T = 85 °C, c(H2O2) = 5 vol.%, S/L ratio = 25 g/L, ω = 600 rpm).

Figure 5.
Plot of the shrinking core model for the effect of concentration on the reaction rate in dependence of reaction time based on a first-order reaction model for (a) nickel and (c) cobalt, as well as based on the second order reaction model for (b) nickel and (d) cobalt.
Figure 5.
Plot of the shrinking core model for the effect of concentration on the reaction rate in dependence of reaction time based on a first-order reaction model for (a) nickel and (c) cobalt, as well as based on the second order reaction model for (b) nickel and (d) cobalt.
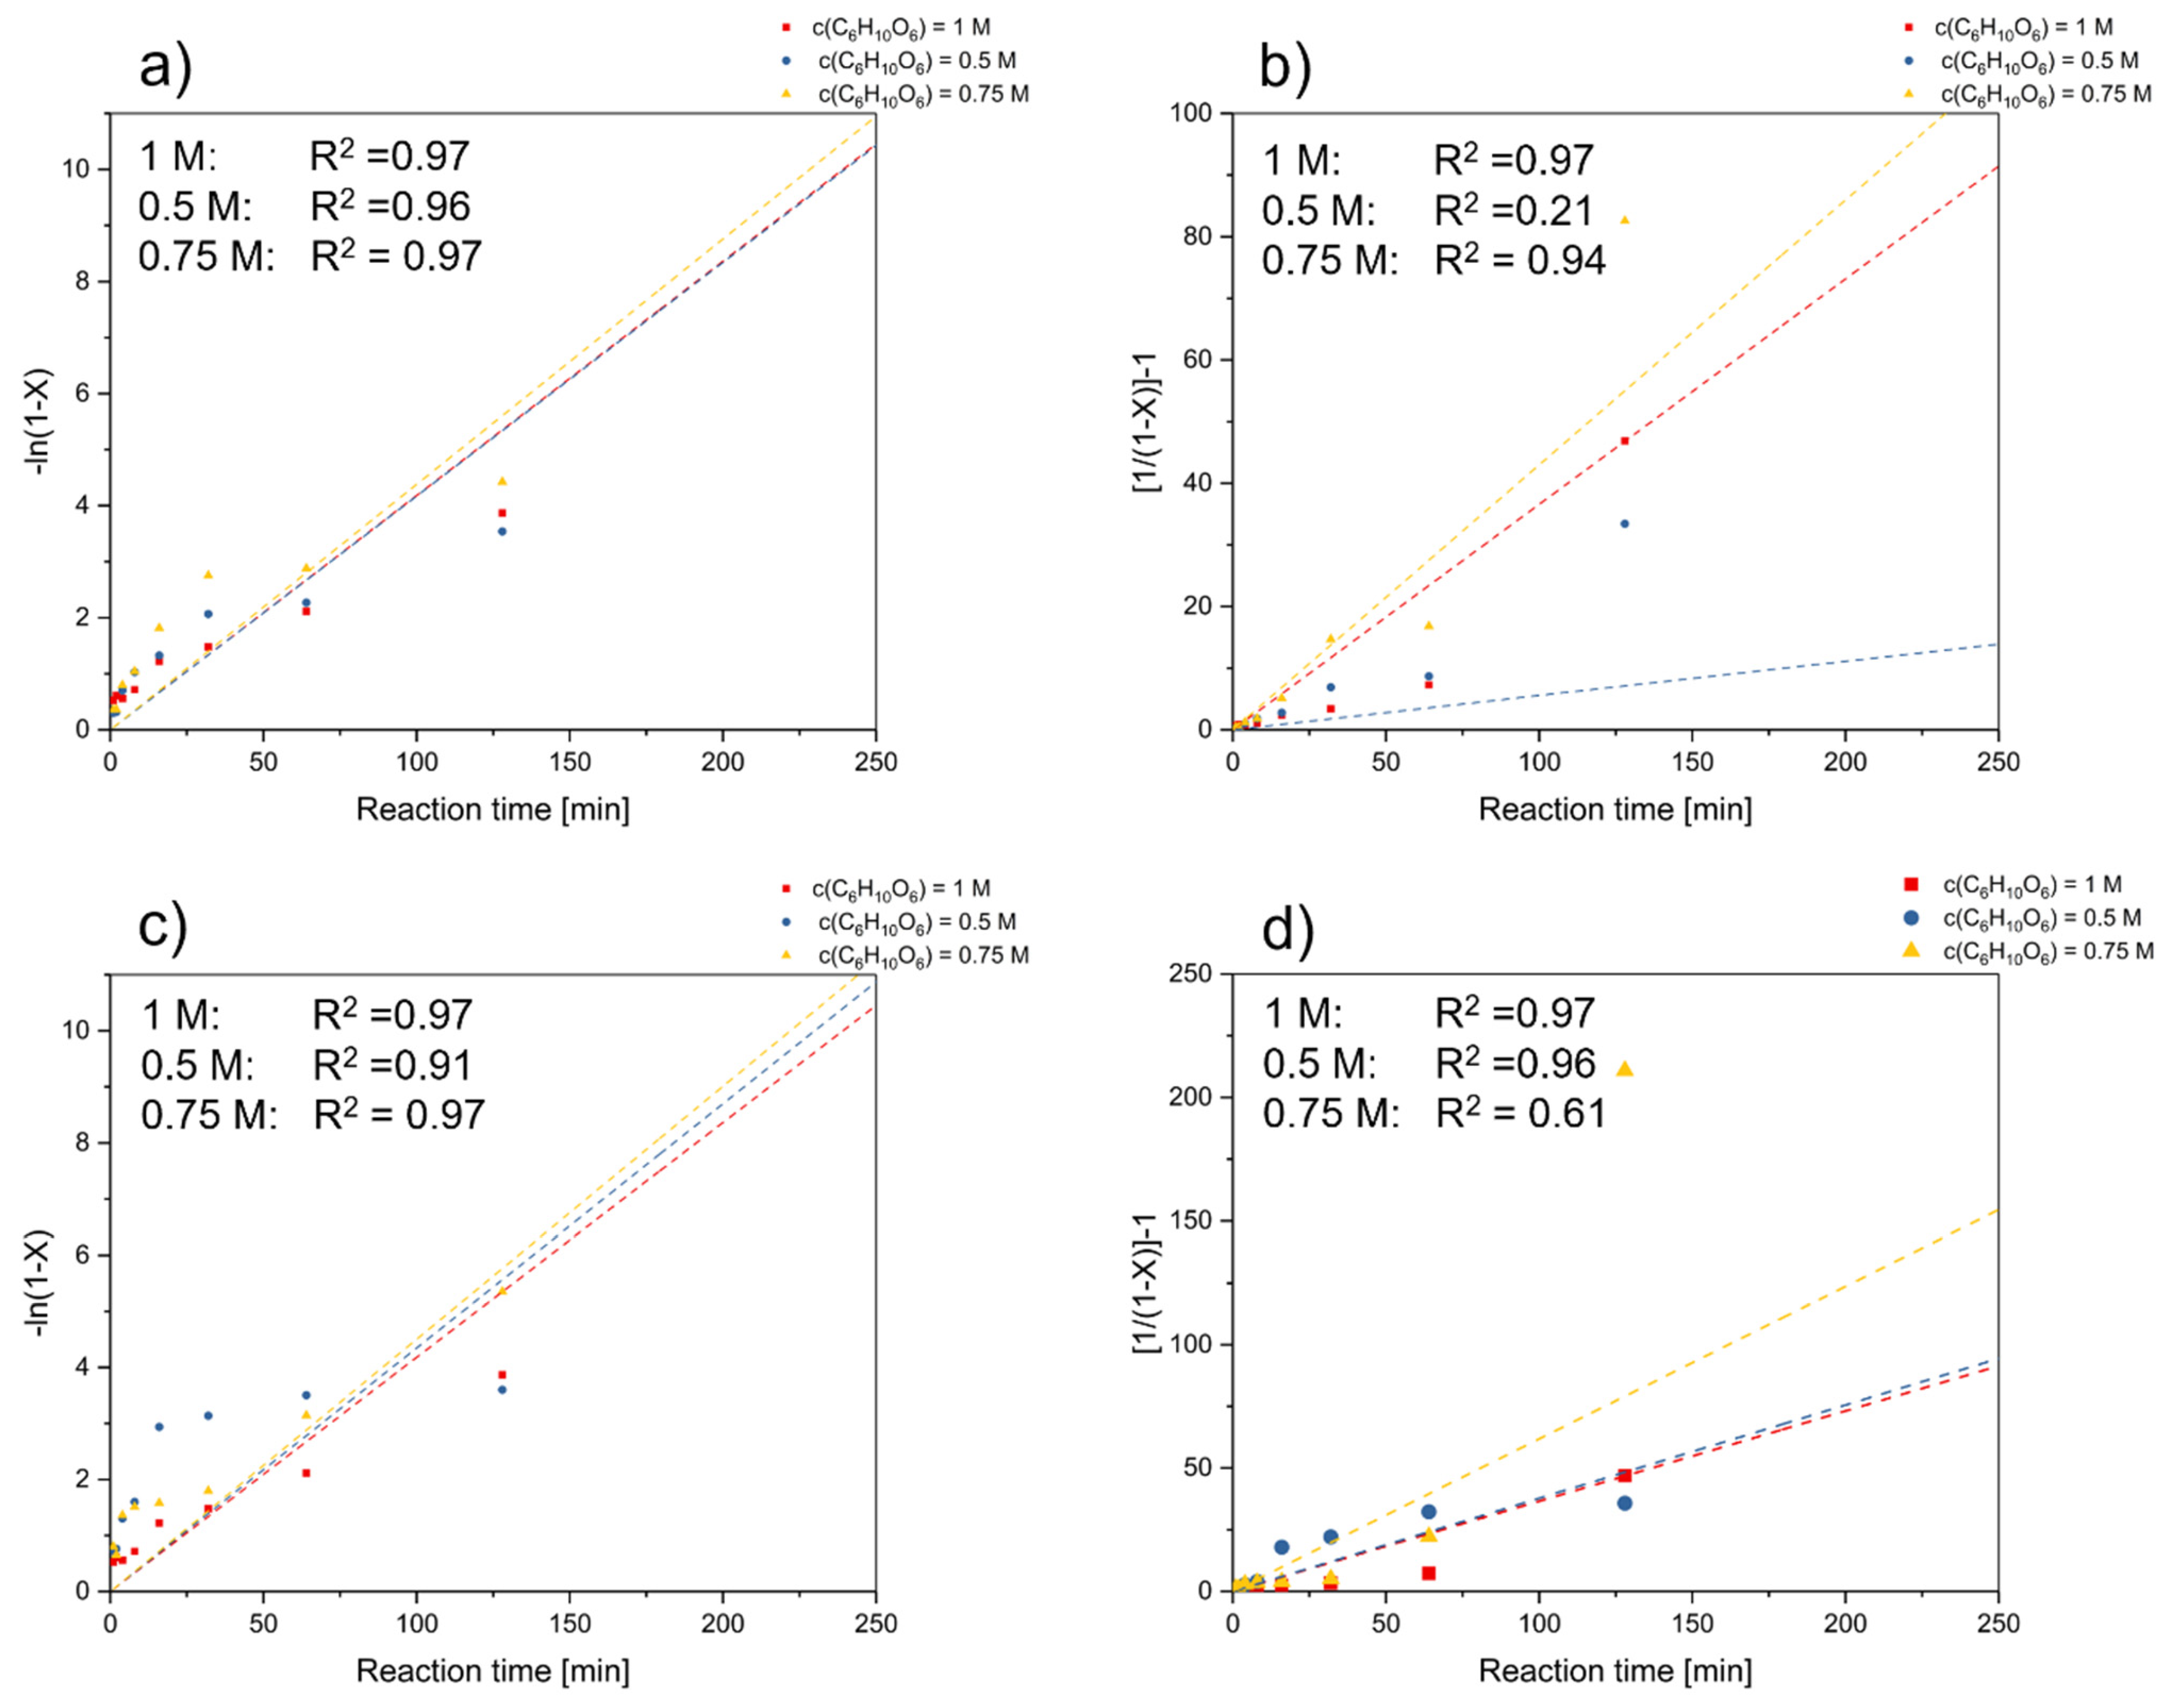
Figure 6.
Effect of particle size classes in the leaching process on (a) nickel and (b) cobalt recovery (initial leaching conditions: T = 85 °C, c(H2O2) = 5 vol.%, S/L ratio = 25 g/L, ω = 600 rpm, c = 1 mol/L).
Figure 6.
Effect of particle size classes in the leaching process on (a) nickel and (b) cobalt recovery (initial leaching conditions: T = 85 °C, c(H2O2) = 5 vol.%, S/L ratio = 25 g/L, ω = 600 rpm, c = 1 mol/L).

Figure 7.
Dependence of rate constant on particle size radius for (a) nickel (based on a diffusion-controlled model) and (b) cobalt (based on a reaction-controlled model).
Figure 7.
Dependence of rate constant on particle size radius for (a) nickel (based on a diffusion-controlled model) and (b) cobalt (based on a reaction-controlled model).

Table 1.
Elemental analysis (ICP-MS) of black mass after pyrolysis used for experiments.
| Element | Li | Al | Mn | Fe | Co | Ni | Cu |
|---|---|---|---|---|---|---|---|
| g/100 g BM | 3.38 | 5.18 | 3.2 | 2.39 | 14.0 | 9.8 | 1.45 |
Table 2.
Apparent rate constants and correlation coefficients for shrinking core model.
| Nickel | Surface Chemical Reaction | Diffusion through Product Layer | ||
|---|---|---|---|---|
| kr [min−1] | R2 | kd [min−1] | R2 | |
| Temperature [°C] | ||||
| 25 | 0.00032 | 0.97001 | 0.000020 | 0.97672 |
| 35 | 0.00050 | 0.97334 | 0.000049 | 0.95229 |
| 45 | 0.00086 | 0.96416 | 0.000130 | 0.98362 |
| 55 | 0.00122 | 0.82538 | 0.000234 | 0.91091 |
| 65 | 0.00390 | 0.99031 | 0.001260 | 0.97795 |
| 75 | 0.00418 | 0.93207 | 0.001370 | 0.97818 |
| 85 | 0.00460 | 0.84863 | 0.001560 | 0.89762 |
| Cobalt | Surface Chemical Reaction | Diffusion through Product Layer | ||
| kr [min−1] | R2 | kd [min−1] | R2 | |
| Temperature [°C] | ||||
| 25 | 0.000795 | 0.95444 | 0.000112 | 0.98040 |
| 35 | 0.001240 | 0.94991 | 0.000250 | 0.99603 |
| 45 | 0.002520 | 0.93979 | 0.000813 | 0.98779 |
| 55 | 0.002240 | 0.77820 | 0.000657 | 0.90657 |
| 65 | 0.004270 | 0.93907 | 0.001420 | 0.97884 |
| 75 | 0.004680 | 0.93907 | 0.001600 | 0.79229 |
| 85 | 0.005190 | 0.62942 | 0.001800 | 0.62508 |
| Lithium | Surface Chemical Reaction | Diffusion through Product Layer | ||
| kr [min−1] | R2 | kd [min−1] | R2 | |
| Temperature [°C] | ||||
| 25 | 0.001520 | 0.89476 | 0.000357 | 0.95108 |
| 35 | 0.001230 | 0.75774 | 0.000233 | 0.90290 |
| 45 | 0.001870 | 0.72296 | 0.000487 | 0.92073 |
| 55 | 0.003090 | 0.63294 | 0.001060 | 0.77527 |
| 65 | 0.004150 | 0.91846 | 0.001360 | 0.98077 |
| 75 | 0.004790 | 0.62489 | 0.001660 | 0.64111 |
| 85 | 0.005180 | 0.55799 | 0.001810 | 0.54256 |
Table 3.
Activation energy value for Ni based on a diffusion-controlled model and Co using the surface chemical reaction control model.
Table 3.
Activation energy value for Ni based on a diffusion-controlled model and Co using the surface chemical reaction control model.
| Metal | Slope | Ea [kJ·mole−1] | R2 |
|---|---|---|---|
| Ni | −8.43734 | 70.148045 | 0.95657 |
| Co | −3.3955 | 28.230187 | 0.93381 |
Table 4.
Correlation coefficient (R2) and reaction rate constants variation of nickel and cobalt dissolution from diffusion model for Ni and chemical reaction model for Co with different mean particle size.
Table 4.
Correlation coefficient (R2) and reaction rate constants variation of nickel and cobalt dissolution from diffusion model for Ni and chemical reaction model for Co with different mean particle size.
| Particle Size Category [µm] | Mean Particle Size [µm] | Ni | Co | ||
|---|---|---|---|---|---|
| kd [min−1] | R2 | kr [min−1] | R2 | ||
| 40–45 | 42.5 | 0.0014 | 0.9424 | 0.0044 | 0.7847 |
| 45–63 | 54 | 0.0016 | 0.8855 | 0.0051 | 0.6288 |
| 63–125 | 94 | 0.0016 | 0.8438 | 0.0053 | 0.5694 |
Disclaimer/Publisher’s Note: The statements, opinions and data contained in all publications are solely those of the individual author(s) and contributor(s) and not of MDPI and/or the editor(s). MDPI and/or the editor(s) disclaim responsibility for any injury to people or property resulting from any ideas, methods, instructions or products referred to in the content. |
© 2024 by the authors. Licensee MDPI, Basel, Switzerland. This article is an open access article distributed under the terms and conditions of the Creative Commons Attribution (CC BY) license (https://creativecommons.org/licenses/by/4.0/).
Share and Cite
MDPI and ACS Style
Gerold, E.; Lerchbammer, R.; Antrekowitsch, H. Recovery of Cobalt, Nickel, and Lithium from Spent Lithium-Ion Batteries with Gluconic Acid Leaching Process: Kinetics Study. Batteries 2024, 10, 120. https://doi.org/10.3390/batteries10040120
AMA Style
Gerold E, Lerchbammer R, Antrekowitsch H. Recovery of Cobalt, Nickel, and Lithium from Spent Lithium-Ion Batteries with Gluconic Acid Leaching Process: Kinetics Study. Batteries. 2024; 10(4):120. https://doi.org/10.3390/batteries10040120
Chicago/Turabian StyleGerold, Eva, Reinhard Lerchbammer, and Helmut Antrekowitsch. 2024. "Recovery of Cobalt, Nickel, and Lithium from Spent Lithium-Ion Batteries with Gluconic Acid Leaching Process: Kinetics Study" Batteries 10, no. 4: 120. https://doi.org/10.3390/batteries10040120
Note that from the first issue of 2016, this journal uses article numbers instead of page numbers. See further details here.