
Postmortem Analysis of 18650 Graphite/LFP Cells in a Long-Term Aging Study for Second-Life Applications


1
Universite Claude Bernard Lyon 1, Ampère, UMR5005, INSA Lyon, Ecole Centrale de Lyon, CNRS, F-69100 Villeurbanne, France
2
EIGSI La Rochelle, EIGSI Lab., F-17000 La Rochelle, France
3
Univ. Grenoble Alpes, Univ. Savoie Mont Blanc, CNRS, Grenoble INP, LEPMI, F-38000 Grenoble, France
4
EVE System, F-69440 Taluyers, France
*
Author to whom correspondence should be addressed.
Batteries 2024, 10(4), 119; https://doi.org/10.3390/batteries10040119
Submission received: 14 February 2024
/
Revised: 11 March 2024
/
Accepted: 20 March 2024
/
Published: 2 April 2024
(This article belongs to the Section Battery Materials and Interfaces: Anode, Cathode, Separators and Electrolytes or Others)
Abstract
:Second-life applications for lithium-ion batteries offer industry opportunities to defer recycling costs, enhance economic value, and reduce environmental impacts. However, cells are affected by numerous aging phenomena which can lead to an acceleration in capacity loss. This paper uses postmortem techniques to compare aging phenomenon in 1.1 Ah 18650 graphite/LFP cells, examining the differences between a pristine cell and three cells aged to 40~30% of state of health (SoH). Macroscopic and microscopic techniques are used to identify aging phenomenon occurring in the cell on both positive and negative electrodes. Energy-dispersive X-ray spectroscopy (EDXS) and scanning electron microscopes (SEMs) with back-scattered electron (BSE) detector are used to analyze each electrode. These methods are used to analyze the morphology and the material on each electrode. The results show a stable positive LFP electrode whereas numerous deposits and cracking occurred on the negative electrode. A discussion of the appearance of those aging phenomenon is presented. Impacts for industrial cells in second-life applications are finally discussed.
1. Introduction
Lithium-ion batteries are widely used in electric vehicles (EV). The lifespan of EV batteries is limited and varies based on the selected chemistry, storage conditions, and use. The literature suggests a capacity decrease of 20% to 30% for an EV at the end of its first life. Batteries still retain 70% to 80% of their initial capacity [1,2]. Batteries from EV can be reused in second-life applications for 70% to 40% of their cell nominal capacity. It is an opportunity to postpone recycling and reduce the environmental impact.
Most of the aging studies on lithium-ion cell focus on their use in EV. However, lithium-ion cells can be impacted by various aging mechanisms, some of which are known to cause an acceleration in the loss of capacity after hundreds or thousands of cycles. The acceleration in capacity fade, also called aging-knee, may reduce the lifespan in second-life applications and reduce the benefits of reuse of lithium-ion cells. All lithium-ion cells—lithium iron phosphate (LFP), lithium manganese oxide (LMO), or lithium nickel manganese cobalt oxides (NMC)—may encounter an acceleration in capacity fade [3,4,5,6,7,8,9]. The acceleration in capacity fade apparition depends on several factors: cell chemistry, temperature of use, current, and depth of discharge [9]. A review by Peter et al. discusses this phenomenon and gives some postmortem analyses of cells undergoing this acceleration in capacity fade [9]. Those studies point out a possible acceleration in capacity fade that could prevent a reuse in second-life applications due to a low capacity or a limited number of operating cycles. A review of non-invasive diagnosis techniques has been published by Carlos et al. to analyze lithium-ion cells using electric data [10]. A pic tracking technique is used by Wheeler et al. to diagnose the remaining capacity in a long-term aging study on lithium-ion G/LFP cells [11]. Those cells are analyzed in this postmortem study.
The degradation of a lithium battery is the result of many different aging mechanisms which can affect the electrodes (the active material, the current collector, the binder…), the electrolyte, or the separator. Birkl et al. show the main degradation mechanisms: the solid electrolyte interface (SEI) (growth, decomposition, and cracking); electrodes (cracking, dissolution, exfoliation, and binder decomposition); current collector (corrosion); and lithium dendrites (separator drilling and internal short-circuits) [12]. Local lithium deposition can lead to an increase in capacity fade and the loss of usable lithium [3]. Identifying each aging mechanism can be complex, given the large number of them. However, it is possible to group them together into the following aging modes: loss of lithium inventory (LLI), loss of active material at the negative electrode (LAMNE), or at the positive electrode (LAMPE). The aging may vary at different rates under cycling. A previous study by Wheeler et al. presents a method based on incremental capacity analysis (ICA) and differential voltage analysis (DVA) to estimate the aging of the negative electrode from 100% to 40% of the nominal capacity [11]. In this paper, a small decrease in capacity of the negative electrode is observed in the first 500 equivalent full cycles (EFCs) and a faster decrease after 1500 EFCs. Moreover, the cell capacity decreases faster while the negative electrode degrades rapidly. In this paper, a postmortem analysis is conducted in order to give some insights of the aging of the negative electrode on the full cell operation.
Waldmann et al. show that numerous postmortem studies have been carried out on lithium-ion cells [13]. The following physical-chemical analysis methods can be performed on the samples to analyze the electrode surface: microscopy, chemical analysis methods sensitive to electrode surfaces, or chemical analysis methods for electrode bulk analysis. A wide range of methods can be used to identify electrode degradation, separator degradation, or material degradation. A wide range of methods are available: microscopy, energy-dispersive X-ray spectroscopy (EDXS), scanning electron microscope (SEM), Raman spectroscopy, etc. Each method can be used to characterize one or more of the following phenomena: growth of a film on the electrode, clogging of pores, delamination of the electrode or the separator, cracks in the electrode coating, deformation, changes on particle surface, particle cracks, exfoliation, metal dissolution and transition, and electrolyte degradation. Coin cell reassembly from an electrode sample versus a reference electrode (lithium) enables the measurement of the electrode’s capacity. It is also used to obtain the electrode’s pseudo-OCP. Among the numerous aging phenomena, the growth of the SEI during aging caused by electrolyte decomposition is the main reason for the cell capacity loss. In a previous study, Waldmann et al. found a thicker SEI layer on graphite particles [14]. Burns et al. observed in cycled graphite/NMC 111 cells an acceleration in capacity fade and a surface film on the graphite electrode [15]. The surface film results from an oxidation product which limits or blocks ion transportation into the electrode. Tiaszny et al. observed a similar bulky deposit on the negative electrode in a graphite/LiMn2O4 cell [16]. Moreover, repeated changes in electrode material volume due to lithiation and delithiation can bend electrodes, weakening the contact of the active material to the separator and the current collector [17]. In the literature, very few postmortem studies analyze the deposits on the electrode at a very low state of health (SoH): a cell SoH below 40%. A postmortem analysis at a very low SoH may give some insights on inhomogeneous aging of the cell and the electrodes, the different types of deposits that can occur on the electrodes, and their chemical composition. This information is necessary to understand the aging behavior and produce a prognosis of the remaining useful life of lithium-ion cells in second-life applications.
This paper focuses on the aging phenomenon appearing in a long-term aging study in A123 1.1 Ah graphite/LFP 18650 commercial cells in first and second-life conditions. Three cells are aged down to 40~30% of SoH and two of them are opened in a postmortem study, as well as a pristine cell. This cell is used as a reference sample. Postmortem analysis is used to compare the aging mechanisms between the pristine cell and three aged cells in order to identify the aging phenomenon occurring in long-term aging. Macroscopic and microscopic techniques are used to identify the aging mechanisms occurring in the cell on both positive and negative electrodes. Photography, SEM, EDXS and coin cells are used to analyze the morphology and materials on each electrode.
2. Experiments
2.1. Graphite/LFP Cell Aging Experiment
Experiments were conducted on three A123 18650 graphite/LFP cells with a nominal capacity of 1.1 Ah. The cell was aged in a thermal chamber at 50 °C, with a depth of discharge (DoD) set to 100%. The cell was discharged following a current profile derived from the worldwide harmonized light vehicles test procedures (WLTP) until the cell voltage reached 2.5 V [18]. This WLTP cycle featured an average discharge rate of C/3, a maximum discharge C-rate of 2.7C, and a maximum regenerative C-rate of 1.2C. This discharge cycle accounted for energy regeneration during vehicle braking. The data obtained regarding the experimental evolution of the cell’s state of health are presented in Figure 1. The cell state of health reached 40~30% at the end of the experiment depending on the cell. The characterization was conducted after every 100 cycles to measure the cell capacity.
All three cells experienced a linear decline in the state of health during the first 1500, 2200 and 2300 transferred ampere-hours. All cells experienced acceleration in the slope after these first stages. Subsequently, a faster cell capacity decrease is observed. The linear decline in capacity can be attributed to LLI, while the acceleration in capacity fade can be related to LAM [19]. Indeed, a loss of capacity and active material at the negative electrode (LAMNE) can occur due to uniform or non-uniform aging phenomena.
Cells 1 and 2 are opened in a postmortem study in order to identify the causes of this capacity loss after a long-term aging cycle. Those cells are opened and analyzed in the same condition as the pristine cell for comparison. Then, the morphology of the electrode materials and their compositions are analyzed. Cells were dismantled in a glove box under an argon atmosphere. Samples were not washed in order to not damage the samples with bulky deposits and to compare all the samples in the same conditions. It was unclear if washing would affect those fragile deposits as discussed by Waldmann et al. [13]. Coin cells were made in a glove box under argon atmosphere using LP30 electrolyte. Chemical elements were detected using EDXS and estimated using the PhiRhoZ estimation technique.
2.2. Pristine Cell Characterization
The positive electrode (LFP) from the pristine cell in Figure 2a did not undergo any specific damage after disassembly. Visual analysis does not reveal any specific surface deposits or mechanical fragility (cracks, exfoliation) for the pristine electrode. Using both secondary electron (SE) and back-scattered electron (BSE) detectors, a few rare defects exist on the LFP electrode surface in white on the left-hand side in Figure 3a. SE and BSE give the same result; however, only SE is represented in Figure 3a. Results in Table 1 were obtained using EDXS to give a higher presence of oxygen and fluorine in the white defect. Darker areas have a similar composition as the rest of the electrode. The origin of this rare defect is unclear and could come from contamination during dismantling, manufacturing, or from deposits which formed within the cell.
The negative electrode (graphite) from the pristine cell in Figure 2b has a uniform color, indicating a homogeneous lithiation of the graphite [20]. Grey areas near imprints of the current collector tab exist. The top and bottom edges of the negative electrode are darker due to non-used/non-lithiated graphite in this area because the negative electrode is larger than the positive one. Using SEM, graphite particles are uniformly distributed on the surface. Rare defects exist such as fibrous aggregate as is visible in the center of Figure 3b. Using EDXS and the results in Table 1, this aggregate has a significantly higher concentration of fluorine and oxygen compared to the pristine graphite from the pristine cell. This defect probably corresponds to a local abnormal concentration of the binder. The binder network should be homogeneously distributed on graphite particles [21]. On average, the pristine graphite electrode has 78.6% carbon, 8.3% nitrogen, 6.6% fluor, 4% oxygen, and traces of phosphorus on the section in the red box in Figure 3b using EDXS mapping.
2.3. Aged Electrodes Characterization
2.3.1. Macroscopic Analysis
The positive electrode suffers no specific damage on disassembly, contrary to the pristine positive electrode. A visual analysis of cells 1 and 2 reveals no surface deposits or mechanical changes to the positive electrode between the pristine and the aged cells using EDXS or SEM.
On the contrary, visual analysis in cells 1 and 2 on the negative electrode suffers inhomogeneous aging: local deposits, cracking and exfoliation. Cell 2 is used for SEM and EDXS analysis and cell 1 for photography. Defects are mainly present at both ends of the jellyroll at the core of the cell or near the casing in Figure 4: (i) the inner end of the coil (the end of the coil at the heart of the cell) is marked by the appearance of a large number of cracks and the active material detached from the collector; (ii) the edge at the outer end (end of the coil close to the cell casing) is marked by cracking, detached graphite from the current collector, and golden/orange-colored deposits on the electrode surface in Figure 4b; (iii) a grey-colored deposit between the golden/orange deposit and the rest of the electrode exists and enlarged pictures of Figure 4b are shown in Figure 4c,d; (iv) the middle of the jellyroll has less deposit formations and traces are repeatedly formed on the edge at the electrical connector that provides the electrical link between the current collector and the tabs in Figure 4g,h. In Figure 5b, the most common defect on the electrode is composed of an orange-gold deposits surrounded by a light gray deposit. Both of these deposits are visible on the graphite electrode (dark grey).
In our study, the total surface area occupied on the electrode by the main deposit, made up of the orange-gold in Figure 4c and gray in Figure 4d deposits, is 8.4% for the A side and 13.2% for the B side. The average surface area occupied is around 11%. Local formation of deposits on the negative electrode led to the loss of access to the graphite. Other rare surface defects exist within the electrode such as white deposits on the electrode surface in Figure 4f or standalone grey deposits in Figure 4e. The white deposit surface could suggest the presence of electrolyte salt. Darker areas, within the white deposits, could suggest the presence of gas bubbles in the electrode prior to cell dismantling. Bubbles evacuate when the cell is opened and the rest of the electrode, still in contact with electrolyte, undergoes a deposit of electrolyte salt (due to evaporation of electrolyte during the cell opening procedure). Gold/orange-colored areas crack and peel easily from the copper current collector. This bulky deposit is probably the result of the degradation of lithium with the electrolyte. Lithium metal deposits should react with the electrolyte and thicken the bulky deposit as discussed above. The deposit in Figure 4e has a color similar to the border zone (d) (grey surfaces) and a similar shape. Light grey patches on the grey surface suggest the formation of an additional deposit. The position of the deposit in Figure 4e is at the same position of deposit in Figure 4f on the other side of the electrode. This deposit is similar to the gray deposit near the collector tab in Figure 4h.
2.3.2. SEM and EDXS Analysis
SEM and EDXS analyses were performed on cell 2 in a similar manner to the analysis of the pristine electrode. The results on the positive electrode from the aged cell give similar results using BSE detectors in Figure 5 and EDXS mapping results in Table 2. The same amount of material is detected. No changes were observed from macroscopic, SEM, or EDXS measurements.
Using SEM, the analysis of the dark grey area in cell 2 (cf. Figure 6a) shows a similar surface to the sample from the pristine cell. Nevertheless, the EDXS in cell 2’s in the dark grey area gives a presence of oxygen of 7% on the electrode, contrary to the pristine sample (Table 2). This slight increase in oxygen without deposits on-top the graphite could be due to a thickening of the SEI on graphite particles during aging experiments. A slight increase in nitrogen is also detected, going from 8% on average to more than 10% for the aged cell (Table 2). This result may correlate with an increase in SEI on graphite particles. However, this increase may be correlated to air contamination. Further investigation should be done to properly link the presence of oxygen and nitrogen to SEI formation on graphite particles in a test without air contamination.
Cell 2’s light gray area (cf. Figure 6b) shows the presence of spheres on the surface of graphite particles between 0.5 and 1 μm. Using EDXS, the fluorine content rises around 60% for a detection on a completely coated graphite particle. Both EDXS measurements from Figure 6a,b have the same amount of oxygen. The high presence of fluorine and the shape of the crystals observed on the surface correspond to the same deposit of lithium fluoride (LiF) detected by Anderson et al. [22].
The orange/gold deposition in Figure 4c is characterized by a very high proportion of oxygen at the surface in Table 2. The deposit in Figure 6c,d is observed with EDXS color mapping in Figure 7. The result gives a high quantity of oxygen. The inhomogeneous deposit on the left-hand side of Figure 6c has less oxygen and a higher presence of fluorine and phosphorus than the default on the right-hand side. This may suggest a localized thicker defect mainly composed of electrolyte reduction products appearing on top of this first inhomogeneous deposit. Nonetheless, both deposits are sufficiently thick to hide graphite particles. Those deposits are bulky and much different than standard SEI on graphite particles: both primary SEI in the pristine cell in Figure 3b and the SEI increase in Figure 6a do not make modifications of the graphite particle shape. Those deposits will be investigated in the next section using EDXS.
The deposit in Figure 6d is blurred and hard to observe. It was not possible to have good focus in this picture for this section of deposits on the electrode. Thus, the blurred deposit in Figure 6d may suggest the presence of a non-visible compound for the SEM detector. Such material would be a non-electronic conducting compound such as inorganic salt.
EDXS mapping obtained in Figure 7 shows the distribution of elements on the bulky deposit (orange/gold) observed on the graphite electrode. The two red rectangles help in locating the bulky deposit observed in Figure 6c and the blurred deposit in Figure 6d. Moreover, a higher concentration of oxygen is detected because of a more pronounced green color in the top right-hand corner. Figure 7b gives the mapping result for the oxygen only. The blurred SEM picture from Figure 6d is located in the top right-hand corner of the picture. Fluorine is detected on all the mapping sections in Figure 7c with a lower proportion in the blurred section from Figure 6d in the top right-hand corner. Phosphorus is detected in the same areas as fluorine. However, the blurred deposits on the surface may hide fluorine deposits, leading to lower detection of this element. Moreover, the bulky oxygen deposit on the electrode can lead to a lower beam penetration in the material. We expect deposits with high amounts of oxygen to be on top of LiF and graphite particles.
2.3.3. Electrochemical Analysis in Coin Cells
Electrochemical characterizations were performed on both positive and negative electrodes for samples from the pristine cell and samples from cell 2. Those electrodes were tested in CR2032 coin cells in a half-cell experiment by employing a portion of each electrode versus a lithium foil in a coin cell. The positive electrode had no change in capacity between the pristine cell and the aged cell in Figure 8a. We did not find a capacity loss at the positive electrode or any sign of aging such as particle cracking or surface reactivity, as was found in other studies such as Lee et al. in the case of NMC reach cells. As a result, we consider no aging of the LFP electrode due to our results from MEB, EDXS, and electrochemical results. On the negative electrode, samples from the dark grey area in the aged cell 2 yielded a slightly lower capacity by comparison to the pristine cell. The samples gave an average of 9% capacity loss, which is lower than the estimated capacity loss of 30% for the full cell data in Wheeler et al. [11]. This result was estimated by using both ICA and DVA techniques on a negative electrode pseudo-open circuit potential (pseudo-OCP), as illustrated in Figure 8b. The arrow and dashed lines give the displacement of a specific point using DVA technique. We were not able to test the gold/orange-colored areas in the coin cells because they crack and peel easily from the copper current collector, contrary to the pristine electrode. This behavior may indicate a larger capacity loss or even an inability to operate on the bulky deposits to explain the larger capacity fade of the full electrode than in the “pristine-like” area.
All defects observed on both cells are summarized in Figure 9. Deposits and loss of contact between the separator and the graphite lead to unusable surface sections of the graphite electrode. Inhomogeneous aging leads to loss of active material (LAMNE) and loss of lithium inventory (LLI) due to the impossibility to transfer the remaining available lithium through the electrolyte. Several defects may block lithium transport in the cell: gas bubbles in Figure 9d, loss of electric contact and cracking with the current collector in Figure 9b, light gray areas with LiF in Figure 9c, or around bulky deposits in Figure 9a. Both LAMNE and LLI lead to a direct blockage of lithium in those areas and result in a capacity loss. The rest of the electrode remains functional despite a loss of capacity.
3. Discussion
For the three cells discharged following profile derived from WLTP, negative electrodes undergo aging through SEI thickening and material damage under cycling: formation of LiF, thick deposits, cracking, exfoliation. On the contrary, it is worth mentioning that the LFP positive electrode does not undergo specific aging leading to material degradation, detachment from the electrode, or the appearance of surface defects. In this section, we aim to discuss our findings and compare those data with other authors’ results and conclusions. This discussion provides some possible reactions that could explain the apparition of LiF and bulky deposits on the electrodes. Those local deposits are correlated with the loss of active material at the negative electrode. We recall that the dark gray area (graphite electrode) only lost 9% capacity on average, whereas a 30% capacity loss of the negative electrode was detected in a previous study [11]. Bulky deposits were extremely fragile and impossible to characterize in coin cells. Moreover, they detach easily from the current collector. We believe those areas are inoperable and would explain the greater capacity loss detected in the full-cell configuration.
Commercial lithium-ion cells generally contain lithium hexafluorophosphate (LiPF6) salt dissolved in a cyclic ethylene carbonate (EC) with linear dimethyl carbonate (DMC) and/or diethyl carbonate (DEC) solvents as the electrolyte. Hou et al. recall that a cascade of reduction reactions occur during the first cycle, and that the initially formed SEI contains inorganic species and organic species [23]. Li2CO3 and LiF are inorganic species commonly reported as formed in the primary SEI layer with other organic species such as lithium ethylene decarbonates (LEDC, (CH2OCO2Li)2) or lithium alkyl carbonates (ROCO2Li) [24]. SEI formation and further reactions leading to cell aging depend on the negative electrode components (material, chemistry, structure), electrolyte components, and concentrations including salts, additives, impurities, or reaction-side products [23]. The formation of LiF can come from various sources: (i) degradation of the electrolyte salt LiPF6 thank to the reaction (1), (ii) reactions (3) and (4) with the first layers of Li2CO3 SEI, or (iii) reaction (2) to water. The first two paths of LiF formation can occur in commercial lithium-ion cells. The last condition requires a contamination with H2O during cell manufacturing. The reaction (2) with water contamination is discussed in the literature [23]. LiPF6 is known to be unstable with lithium carbonate in DMC [24]. The thermal decomposition of LiPF6 follows Equation (1) and exhibits a potential-dependent kinetics [25]. This decomposition can occur in high temperature conditions or at high overpotential or at low potentials at the pristine edge plane [23,25]. According to Andersson et al., the formation of LiF on the carbon electrode increases the interfacial resistance because of a poor conductivity of this deposit [22]. In the opinion of Anderson et al., the transformation of Li2CO3 to LiF does not account for the very large increase in LiF in their study. Salt decomposition reactions may be the main reason of LiF formation. Its formation could be due to LiPF6 degradation catalyzed by graphite exposure (e.g., SEI and/or graphite cracking) [22]. Henschel et al. studied the aging of lithium-ion cells after use in electric vehicles [26]. The conducting salt LiPF6 degrades in several reactions leading to the formation of several products: acidic and non-acidic oregano(fluoro)phosphates. Henschel et al. determined that LiPF6 salt undergoes a significant decomposition in electric vehicles, resulting in lower concentration than the initial electrolyte salt [26]. Numerous acidic and non-acidic organo(fluoro) phosphates, as well as POF3 were identified in many samples, which supported the authors’ findings:
The reaction of LiPF6 with Li2CO3, a common contributor of the primary SEI, is given in Equation (3) [27]. Li2CO3 has poor mechanical strength and low resistance to graphite volume expansion during the lithiation and delithiation process. Cracks can appear through the primary SEI, leading to an increase in reaction rate. Parimalam et al. consider the same reaction with LiPF6 and Li2CO3 but through a different reaction path than in Equation (4) leading to LiPO2F2, LiF, and CO2 [24].
The detection of LiF on some graphite particles implies the appearance of other compounds as side reaction products. The formation of PF5 in Equation (1) can lead to an additional consumption of lithium in Equation (5) and the subsequent formation of LiF and LixPFy deposits. PF5 is also highly reactive in the presence of water, producing phosphoryl fluoride (POF3) and hydrogen fluoride (HF) in Equation (6).
The formation of POF3 and CO2 by previous reactions of LiPF6 can react with Li+, leading to a new compound formation such as LiF, Li2CO3, LixPOFy deposits, and gas generation. Aurbach provides the principle of reactions (7) and (8) without necessarily defining their stoichiometry [28].
Other decomposition of electrolytes components can lead to several products such as gases, ethers, phosphates or fluorophosphates, short-chain organic molecules, oligomers/polymers, inorganic carbonates, and oxides [24,27]. These reactions of decomposition of the electrolyte may lead to a cell dry out. Fang et al. shows that the battery lifespan is influenced by the amount of electrolytes [29]. Authors propose that the transition from linear to nonlinear aging could be induced by a continuous loss of electrolytes. This assumption may explain the bulky deposits observed in our postmortem study on the electrode. Local loss of electrolytes leading to a dry out can isolate graphite particles, leading to a loss of active material. Despite this, other areas of the negative electrode remained able to retain 90% of the initial capacity. A study should be carried out to explain the correlation between the heavy deposits, probably due to high reactivity with electrolyte, which might lead to cell dry out, and the high brittleness of graphite and its detachment from the current collector in the same area.
As a result, the aging of graphite/LFP cells to low states of health, representative of a use in second-life applications, has various stages of aging resulting from different electrochemical processes. A representation of those aging processes is given as successive aging phenomena in Figure 10. This figure aims to provide a general view of the formation of inhomogeneous aging on the negative electrode. However, it does not aim to detail the composition of the bulky deposits. First, the primary layer of SEI appears after the cell manufacturing in Figure 10a. During the use in first-life applications, the SEI thickens on the graphite particles as represented by a thicker line on graphite particles in Figure 10b. The use of lithium-ion cells involves lithiation and delithiation operations of the graphite particles. Subsequently, cracks can appear through the SEI due to bad mechanical strength of Li2CO3, resulting in possible contact of the electrolyte and LiPF6 with graphite particles in Figure 10c. In the case of deep discharge, the graphite can experience a change in particle volume of up to 10% [30]. The crack initiates a new reaction forming additional SEIs and other reactions resulting in LiF and gas emissions in Figure 10d. These gas emissions cause a local increase in pressure and possible deformations. In large quantities, a gas bubble can form and impede the passage of lithium ions. The gases formed trigger new reactions, resulting in the consumption of cyclable lithium and new deposits on the electrodes. LiF is insulating and prevents lithium ions from transferring to the electrode. Lithium may stay on the electrode in contact with electrolytes leading to additional reactions and deposits in Figure 10e. Inorganic compounds also participate in the formation of this new deposit. The sequence of these phenomena leads to a significant consumption of cyclable lithium and the deposition of a highly resistive or even insulating layer on the negative electrode in Figure 10f.
4. Conclusions
Aging tests and postmortem analyses show that graphite/LFP lithium-ion cells hold up very well over time. Namely, no safety problems arose during the tests, and no dendritic formation was observed. The postmortem study showed that the LFP electrode does not age over time and over a very large number of charge/discharge cycles. No electrical or mechanical changes were observed. Indeed, mechanical properties were maintained after several thousand cycles.
The negative electrode, on the other hand, shows a high degree of degradation after thousands of cycles. In fact, some local areas were severely degraded by the apparition of LiF formation, thick SEI deposition, graphite cracking, and exfoliation. This paper does not investigate the reason for fragile graphite in aged cells contrary to the pristine cell. The lower mechanical stability during cell opening could be a sign of structural changes inside the graphite electrode such as loss of mechanical stability due to poorer binder mechanical strength. Poorer mechanical stability and loss of contact with the current collector could be another reason for the loss of active material at the negative electrode. Bulky deposits on the electrode were detected; however, they were mainly composed of oxygen and were attributed to electrolyte decompositions. The bulky deposit leads to unusable electrode sections in the cell. Inhomogeneous aging of graphite electrodes leads to localized loss of active material and overconsumption of lithium. The loss of active material at the negative electrode can be a sign of acceleration in capacity loss due to increase in lithium reaction and loss of lithium inventory (LLI).
Local defects lead to graphite isolation, blocked lithium onto the surface, increased parasitic reactions with the electrolyte, increased deposits onto the surface, and changes in its morphology. The impossibility to use a fraction of the electrode highlights the direct impact of loss of active material at the negative electrode (LAMNE) in commercial cells and the overall cell capacity. The localized loss of lithium due to inhomogeneous aging besides standard SEI formation leads to an increase in capacity fade.
This postmortem study confirms the apparition of inhomogeneous aging on the negative electrode, while the positive electrode operates in the same manner as the pristine electrode. As a result, the lithiation and delithiation no longer takes place over the entire surface of the electrode, leading to lithium being trapped in those areas and resulting in a supplementary capacity fade. Thus, the loss of capacity in the graphite/LFP cell is due to SEI formation and loss of active material at the negative electrode, leading to a supplementary capacity fade in long-term aging. Therefore, it is necessary to diagnose the negative electrode’s state of health in order to provide an accurate prognosis of the remaining useful life of batteries in second-life applications.
Author Contributions
Conceptualization, W.W., Y.B., P.V., A.S. and E.R.; methodology, W.W., Y.B., P.V. and A.S.; visualization, W.W., Y.B., P.V. and A.S.; data curation, W.W.; writing—original draft, W.W.; formal analysis, W.W., Y.B., P.V. and A.S.; writing—review and editing, W.W., Y.B., P.V. and A.S.; funding acquisition, Y.B., P.V., A.S. and E.R.; project administration, Y.B., P.V. and A.S. All authors have read and agreed to the published version of the manuscript.
Funding
This research was funded by EVE System and ANRT, grant number CIFRE 2018/1625.
Data Availability Statement
The raw data supporting the conclusions of this article will be made available by the authors on request.
Conflicts of Interest
The authors declare that they have no known competing financial interests or personal relationships that could have appeared to influence the work reported in this paper. Authors Elie Riviere is employee of EVE System company, who provided funding and technical support for the work. The funder had no role in the design of the study; in the collection, analysis, or interpretation of data, in the writing of the manuscript, or in the decision to publish the results.
References
- Martinez-Laserna, E.; Sarasketa-Zabala, E.; Villarreal Sarria, I.; Stroe, D.-I.; Swierczynski, M.; Warnecke, A.; Timmermans, J.-M.; Goutam, S.; Omar, N.; Rodriguez, P. Technical Viability of Battery Second Life: A Study From the Ageing Perspective. IEEE Trans. Ind. Appl. 2018, 54, 2703–2713. [Google Scholar] [CrossRef]
- Quinard, H.; Redondo-Iglesias, E.; Pelissier, S.; Venet, P. Fast Electrical Characterizations of High-Energy Second Life Lithium-Ion Batteries for Embedded and Stationary Applications. Batteries 2019, 5, 33. [Google Scholar] [CrossRef]
- Klett, M.; Eriksson, R.; Groot, J.; Svens, P.; Ciosek Högström, K.; Lindström, R.W.; Berg, H.; Gustafson, T.; Lindbergh, G.; Edström, K. Non-Uniform Aging of Cycled Commercial LiFePO4//Graphite Cylindrical Cells Revealed by Post-Mortem Analysis. J. Power Sources 2014, 257, 126–137. [Google Scholar] [CrossRef]
- Baumhöfer, T.; Brühl, M.; Rothgang, S.; Sauer, D.U. Production Caused Variation in Capacity Aging Trend and Correlation to Initial Cell Performance. J. Power Sources 2014, 247, 332–338. [Google Scholar] [CrossRef]
- Ecker, M.; Nieto, N.; Käbitz, S.; Schmalstieg, J.; Blanke, H.; Warnecke, A.; Sauer, D.U. Calendar and Cycle Life Study of Li(NiMnCo)O2-Based 18650 Lithium-Ion Batteries. J. Power Sources 2014, 248, 839–851. [Google Scholar] [CrossRef]
- Harris, S.J.; Harris, D.J.; Li, C. Failure Statistics for Commercial Lithium Ion Batteries: A Study of 24 Pouch Cells. J. Power Sources 2017, 342, 589–597. [Google Scholar] [CrossRef]
- Mathieu, R.; Briat, O.; Gyan, P.; Vinassa, J.-M. Fast Charging for Electric Vehicles Applications: Numerical Optimization of a Multi-Stage Charging Protocol for Lithium-Ion Battery and Impact on Cycle Life. J. Energy Storage 2021, 40, 102756. [Google Scholar] [CrossRef]
- Mathieu, R.; Briat, O.; Gyan, P.; Vinassa, J.-M. Comparison of the Impact of Fast Charging on the Cycle Life of Three Lithium-Ion Cells under Several Parameters of Charge Protocol and Temperatures. Appl. Energy 2021, 283, 116344. [Google Scholar] [CrossRef]
- Attia, P.M.; Bills, A.; Brosa Planella, F.; Dechent, P.; Dos Reis, G.; Dubarry, M.; Gasper, P.; Gilchrist, R.; Greenbank, S.; Howey, D.; et al. Review—“Knees” in Lithium-Ion Battery Aging Trajectories. J. Electrochem. Soc. 2022, 169, 060517. [Google Scholar] [CrossRef]
- Pastor-Fernández, C.; Yu, T.F.; Widanage, W.D.; Marco, J. Critical Review of Non-Invasive Diagnosis Techniques for Quantification of Degradation Modes in Lithium-Ion Batteries. Renew. Sustain. Energy Rev. 2019, 109, 138–159. [Google Scholar] [CrossRef]
- Wheeler, W.; Venet, P.; Bultel, Y.; Sari, A.; Riviere, E. Aging in First and Second Life of a G/LFP 18650 Cell: Diagnosis and Evolution of the State of Health of the Cell and the Negative Electrode under Cycling. Batteries 2024. under review. [Google Scholar]
- Birkl, C.R.; Roberts, M.R.; McTurk, E.; Bruce, P.G.; Howey, D.A. Degradation Diagnostics for Lithium Ion Cells. J. Power Sources 2017, 341, 373–386. [Google Scholar] [CrossRef]
- Waldmann, T.; Iturrondobeitia, A.; Kasper, M.; Ghanbari, N.; Aguesse, F.; Bekaert, E.; Daniel, L.; Genies, S.; Gordon, I.J.; Löble, M.W.; et al. Review—Post-Mortem Analysis of Aged Lithium-Ion Batteries: Disassembly Methodology and Physico-Chemical Analysis Techniques. J. Electrochem. Soc. 2016, 163, A2149–A2164. [Google Scholar] [CrossRef]
- Waldmann, T.; Wilka, M.; Kasper, M.; Fleischhammer, M.; Wohlfahrt-Mehrens, M. Temperature Dependent Ageing Mechanisms in Lithium-Ion Batteries—A Post-Mortem Study. J. Power Sources 2014, 262, 129–135. [Google Scholar] [CrossRef]
- Burns, J.C.; Kassam, A.; Sinha, N.N.; Downie, L.E.; Solnickova, L.; Way, B.M.; Dahn, J.R. Predicting and Extending the Lifetime of Li-Ion Batteries. J. Electrochem. Soc. 2013, 160, A1451–A1456. [Google Scholar] [CrossRef]
- Stiaszny, B.; Ziegler, J.C.; Krauß, E.E.; Schmidt, J.P.; Ivers-Tiffée, E. Electrochemical Characterization and Post-Mortem Analysis of Aged LiMn2O4–Li(Ni0.5Mn0.3Co0.2)O2/Graphite Lithium Ion Batteries. Part I: Cycle Aging. J. Power Sources 2014, 251, 439–450. [Google Scholar] [CrossRef]
- Waldmann, T.; Gorse, S.; Samtleben, T.; Schneider, G.; Knoblauch, V.; Wohlfahrt-Mehrens, M. A Mechanical Aging Mechanism in Lithium-Ion Batteries. J. Electrochem. Soc. 2014, 161, A1742–A1747. [Google Scholar] [CrossRef]
- United Nations. Addendum 15: Global Technical Regulation No. 15, Worldwide Harmonized Light Vehicles Test Procedure. ECE/TRANS/180/Add.15; United Nations: New York, NY, USA, 2014; pp. 1–234. [Google Scholar]
- Dubarry, M.; Truchot, C.; Liaw, B.Y. Synthesize Battery Degradation Modes via a Diagnostic and Prognostic Model. J. Power Sources 2012, 219, 204–216. [Google Scholar] [CrossRef]
- Shellikeri, A.; Watson, V.; Adams, D.; Kalu, E.E.; Read, J.A.; Jow, T.R.; Zheng, J.S.; Zheng, J.P. Investigation of Pre-Lithiation in Graphite and Hard-Carbon Anodes Using Different Lithium Source Structures. J. Electrochem. Soc. 2017, 164, A3914–A3924. [Google Scholar] [CrossRef]
- Ender, M.; Joos, J.; Weber, A.; Ivers-Tiffée, E. Anode Microstructures from High-Energy and High-Power Lithium-Ion Cylindrical Cells Obtained by X-Ray Nano-Tomography. J. Power Sources 2014, 269, 912–919. [Google Scholar] [CrossRef]
- Andersson, A.M.; Edström, K. Chemical Composition and Morphology of the Elevated Temperature SEI on Graphite. J. Electrochem. Soc. 2001, 148, A1100. [Google Scholar] [CrossRef]
- Hou, T.; Yang, G.; Rajput, N.N.; Self, J.; Park, S.-W.; Nanda, J.; Persson, K.A. The Influence of FEC on the Solvation Structure and Reduction Reaction of LiPF6/EC Electrolytes and Its Implication for Solid Electrolyte Interphase Formation. Nano Energy 2019, 64, 103881. [Google Scholar] [CrossRef]
- Parimalam, B.S.; MacIntosh, A.D.; Kadam, R.; Lucht, B.L. Decomposition Reactions of Anode Solid Electrolyte Interphase (SEI) Components with LiPF6. J. Phys. Chem. C 2017, 121, 22733–22738. [Google Scholar] [CrossRef]
- Leung, K. Predicting the Voltage Dependence of Interfacial Electrochemical Processes at Lithium-Intercalated Graphite Edge Planes. Phys. Chem. Chem. Phys. 2015, 17, 1637–1643. [Google Scholar] [CrossRef] [PubMed]
- Henschel, J.; Horsthemke, F.; Stenzel, Y.P.; Evertz, M.; Girod, S.; Lürenbaum, C.; Kösters, K.; Wiemers-Meyer, S.; Winter, M.; Nowak, S. Lithium Ion Battery Electrolyte Degradation of Field-Tested Electric Vehicle Battery Cells—A Comprehensive Analytical Study. J. Power Sources 2020, 447, 227370. [Google Scholar] [CrossRef]
- Spotte-Smith, E.W.C.; Petrocelli, T.B.; Patel, H.D.; Blau, S.M.; Persson, K.A. Elementary Decomposition Mechanisms of Lithium Hexafluorophosphate in Battery Electrolytes and Interphases. ACS Energy Lett. 2023, 8, 347–355. [Google Scholar] [CrossRef]
- Aurbach, D. Review of Selected Electrode–Solution Interactions Which Determine the Performance of Li and Li Ion Batteries. J. Power Sources 2000, 89, 206–218. [Google Scholar] [CrossRef]
- Fang, R.; Dong, P.; Ge, H.; Fu, J.; Li, Z.; Zhang, J. Capacity Plunge of Lithium-Ion Batteries Induced by Electrolyte Drying-out: Experimental and Modeling Study. J. Energy Storage 2021, 42, 103013. [Google Scholar] [CrossRef]
- Schweidler, S.; De Biasi, L.; Schiele, A.; Hartmann, P.; Brezesinski, T.; Janek, J. Volume Changes of Graphite Anodes Revisited: A Combined Operando X-Ray Diffraction and In Situ Pressure Analysis Study. J. Phys. Chem. C 2018, 122, 8829–8835. [Google Scholar] [CrossRef]
Figure 1.
Evolution of the cells’ state of health during the experiment.
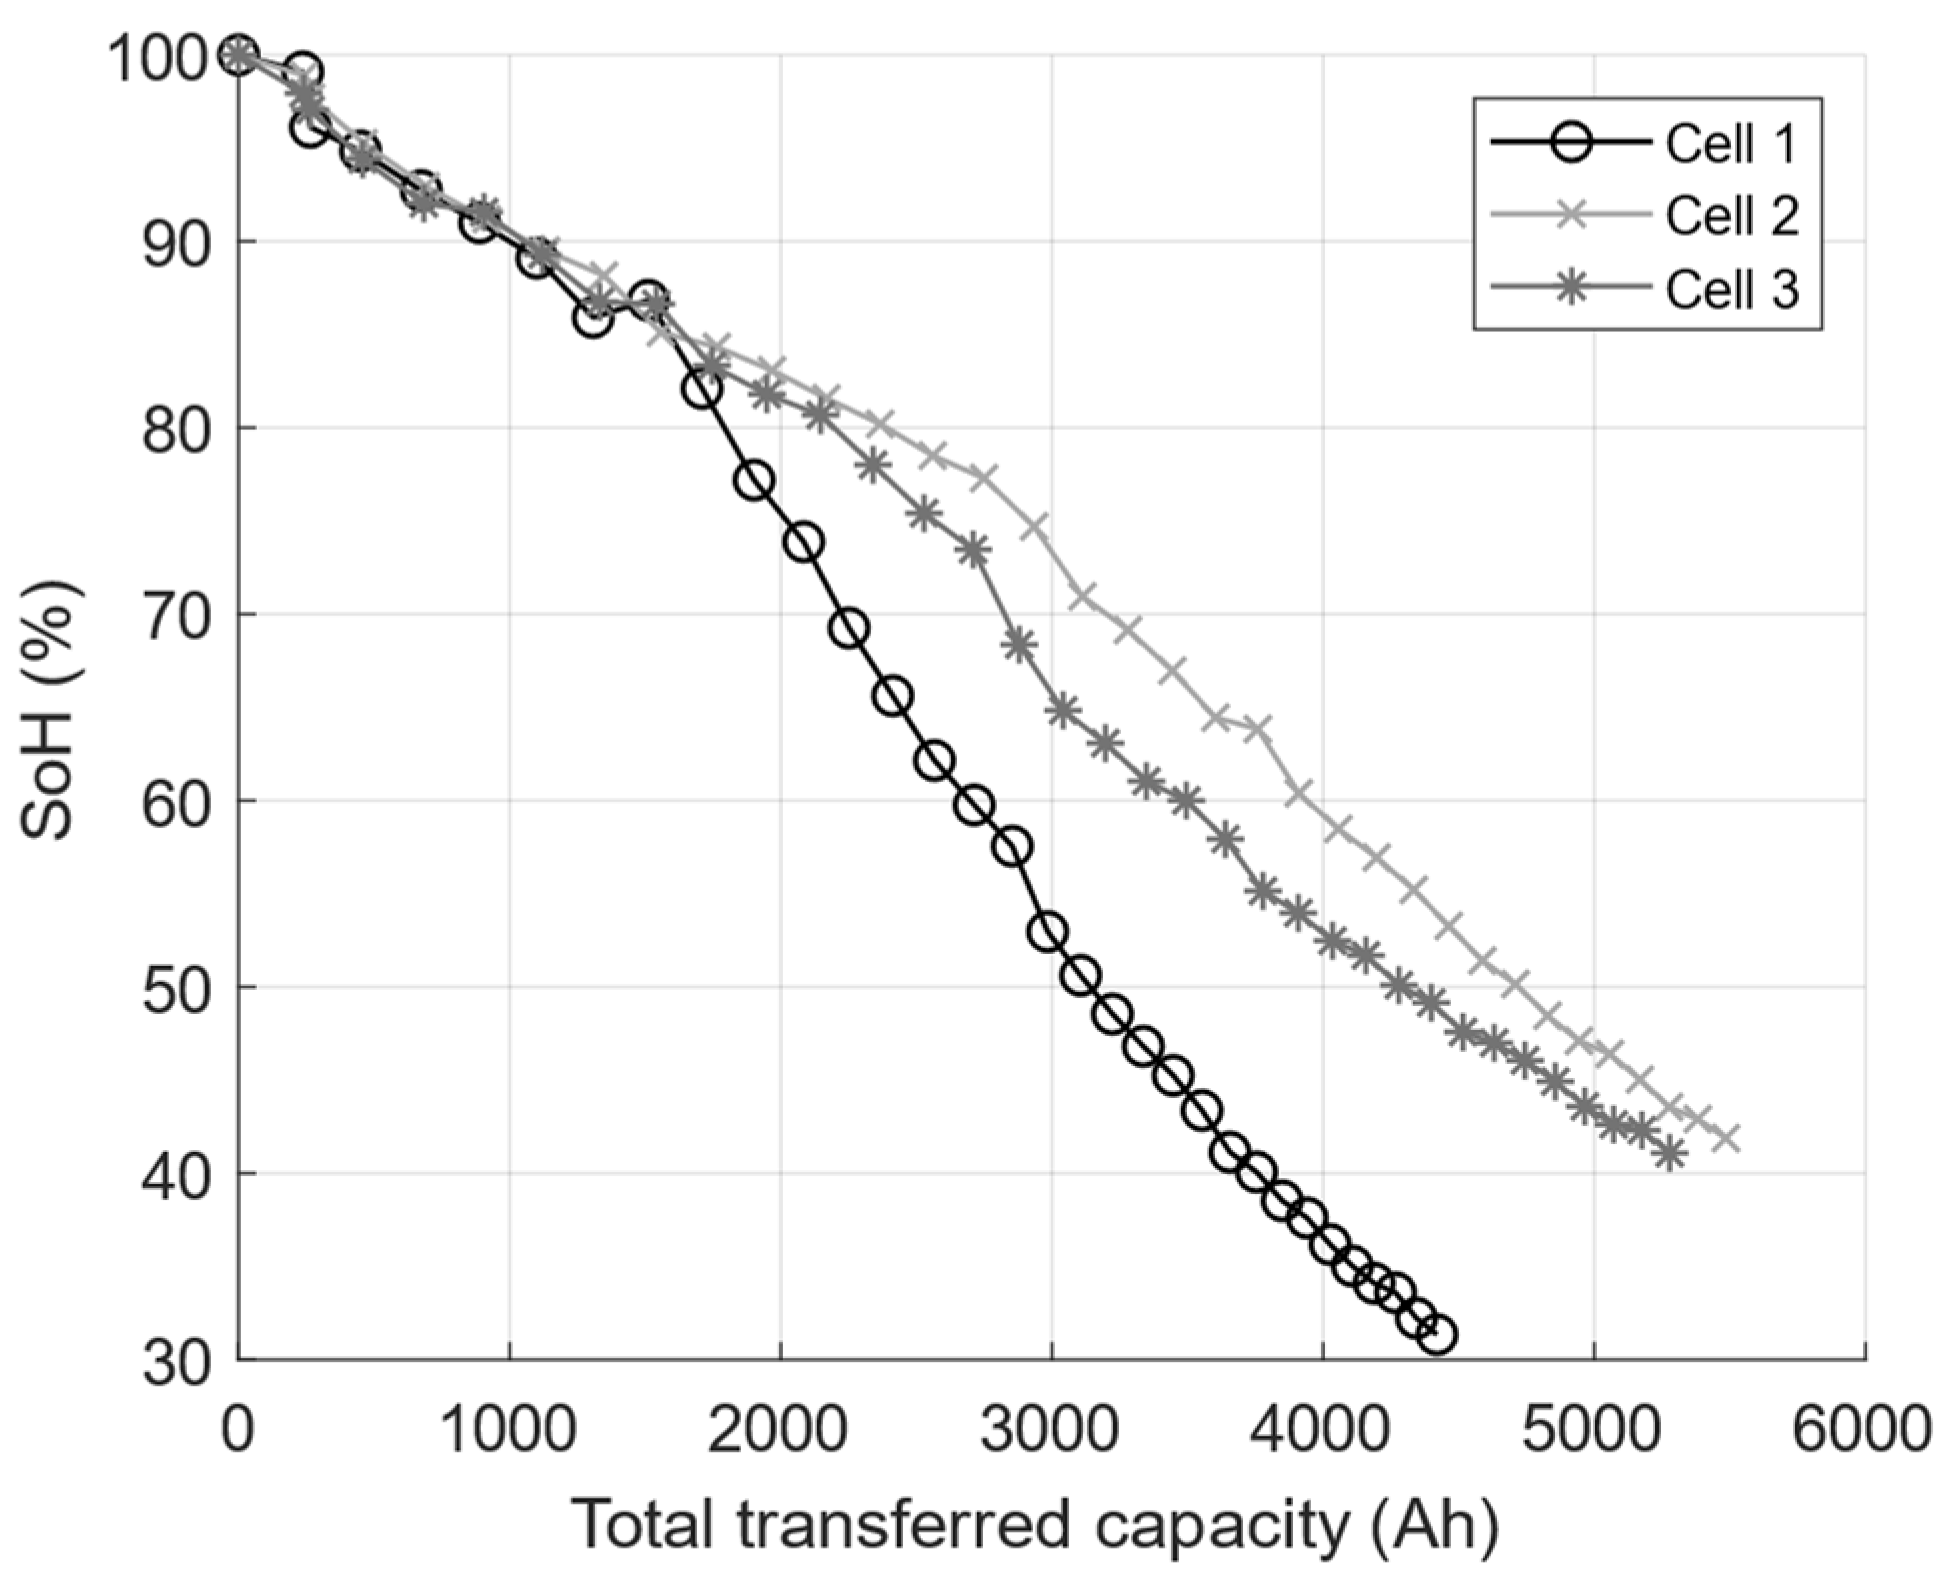
Figure 2.
Sections of pristine electrodes for (a) the LFP electrode and (b) the graphite electrode. The positive electrode is 718 mm long and 55.4 mm wide and the negative electrode is 764 mm long and 57.4 mm wide.
Figure 2.
Sections of pristine electrodes for (a) the LFP electrode and (b) the graphite electrode. The positive electrode is 718 mm long and 55.4 mm wide and the negative electrode is 764 mm long and 57.4 mm wide.
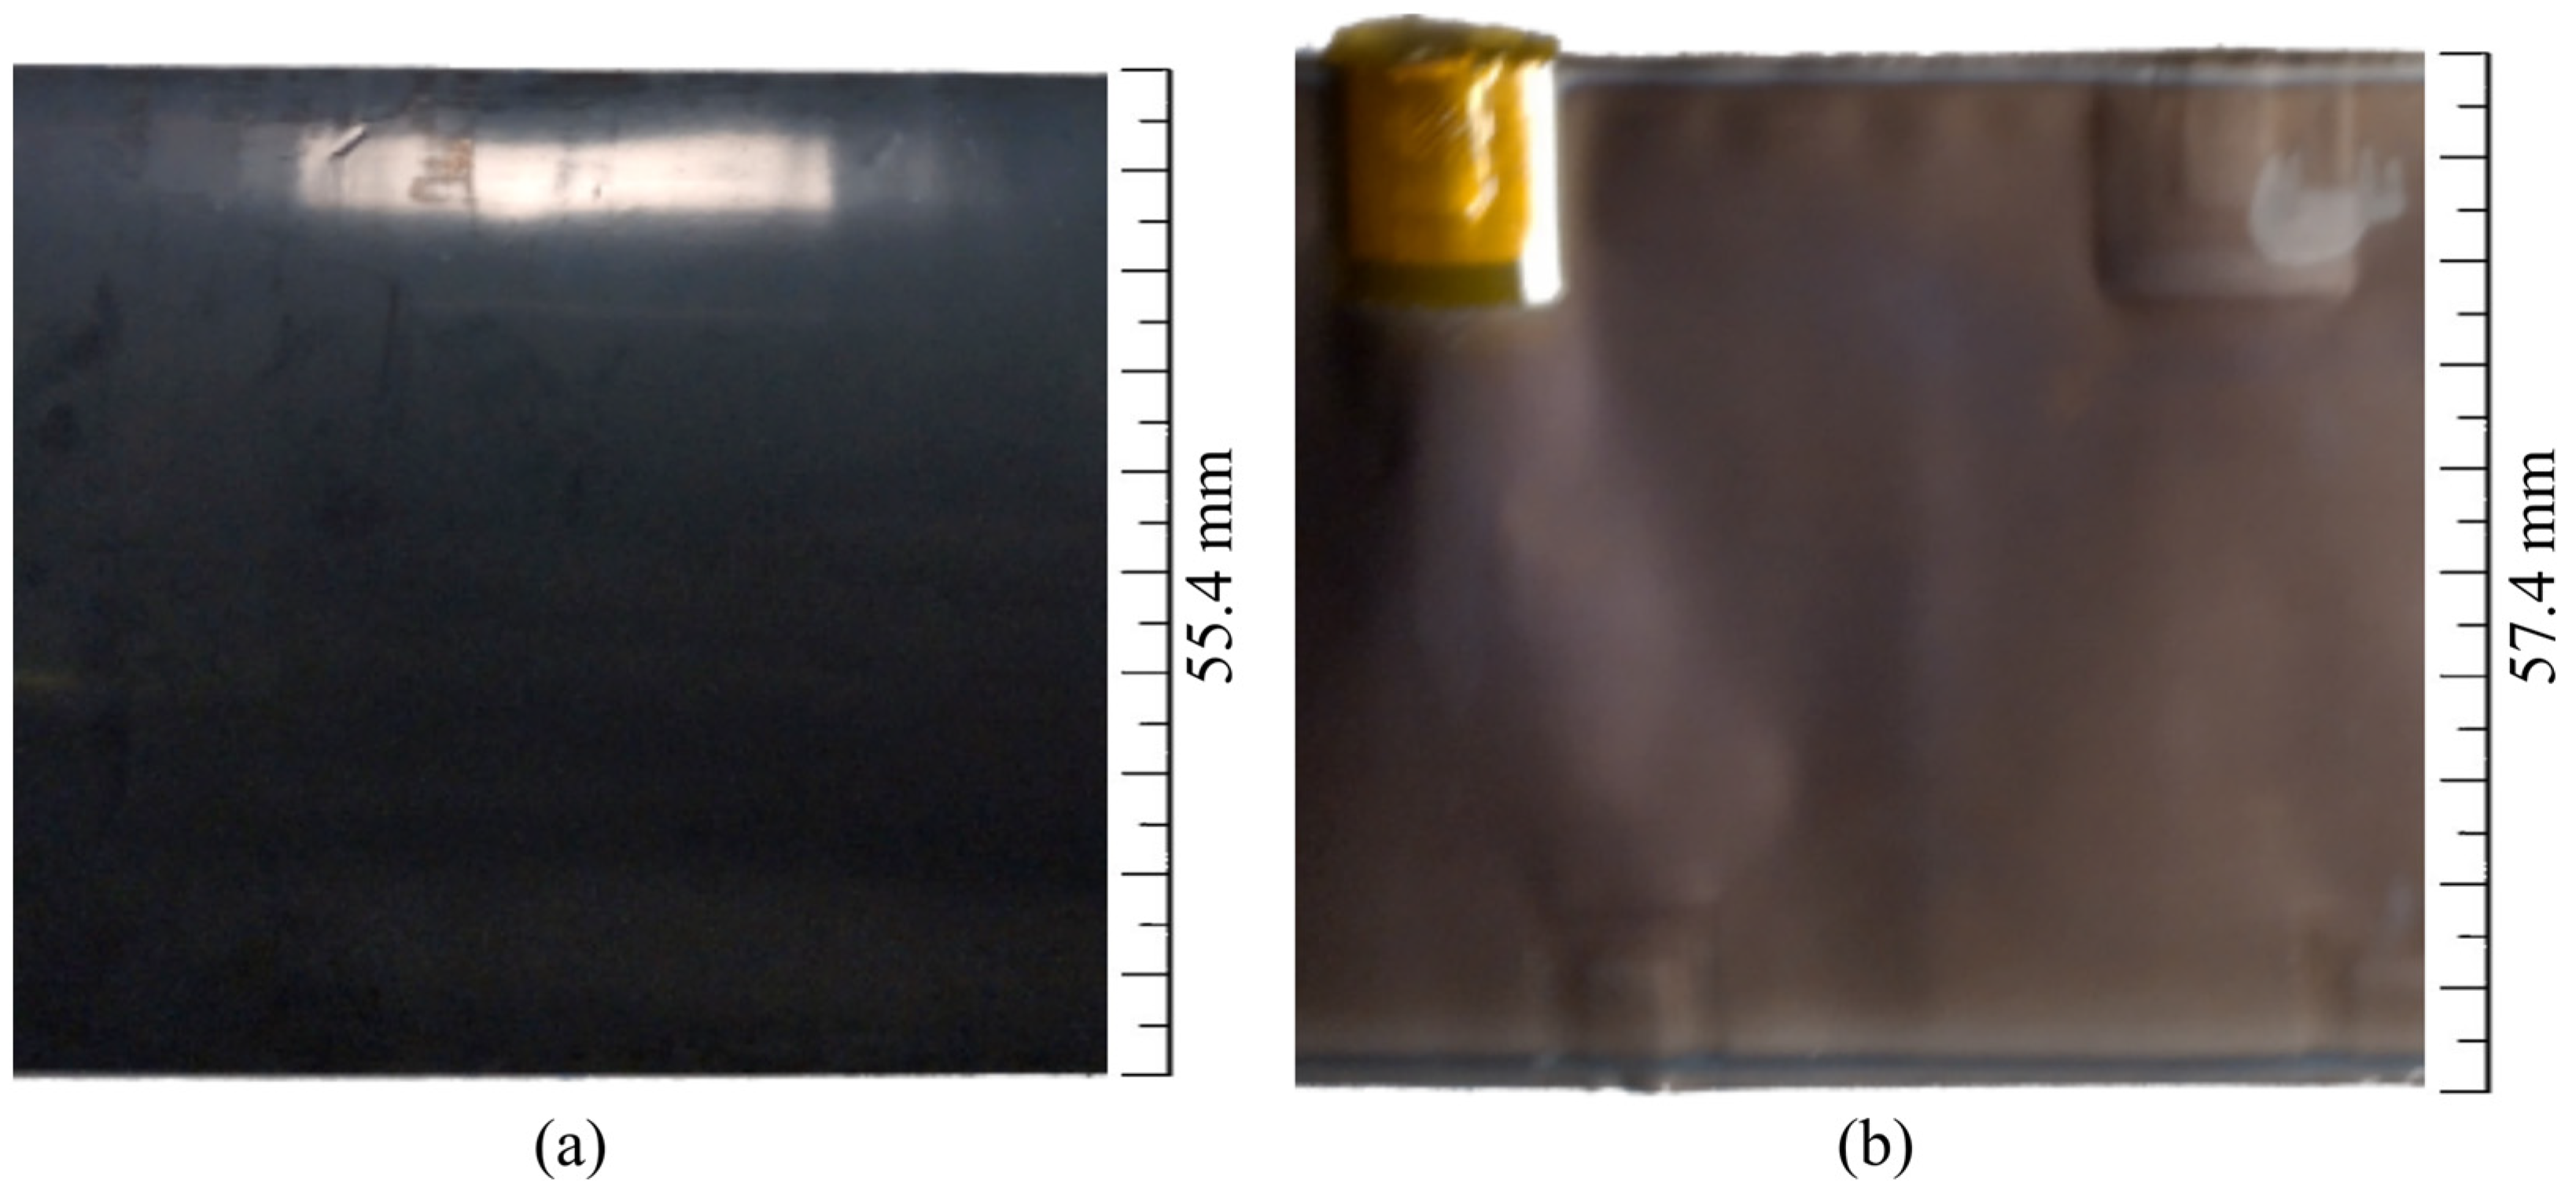
Figure 3.
SEM pictures using a BSE detector from the pristine cell for (a) the LFP electrode and (b) the graphite electrode. Positions 1 to 5 refers to the position of their respective results in Table 1.
Figure 3.
SEM pictures using a BSE detector from the pristine cell for (a) the LFP electrode and (b) the graphite electrode. Positions 1 to 5 refers to the position of their respective results in Table 1.
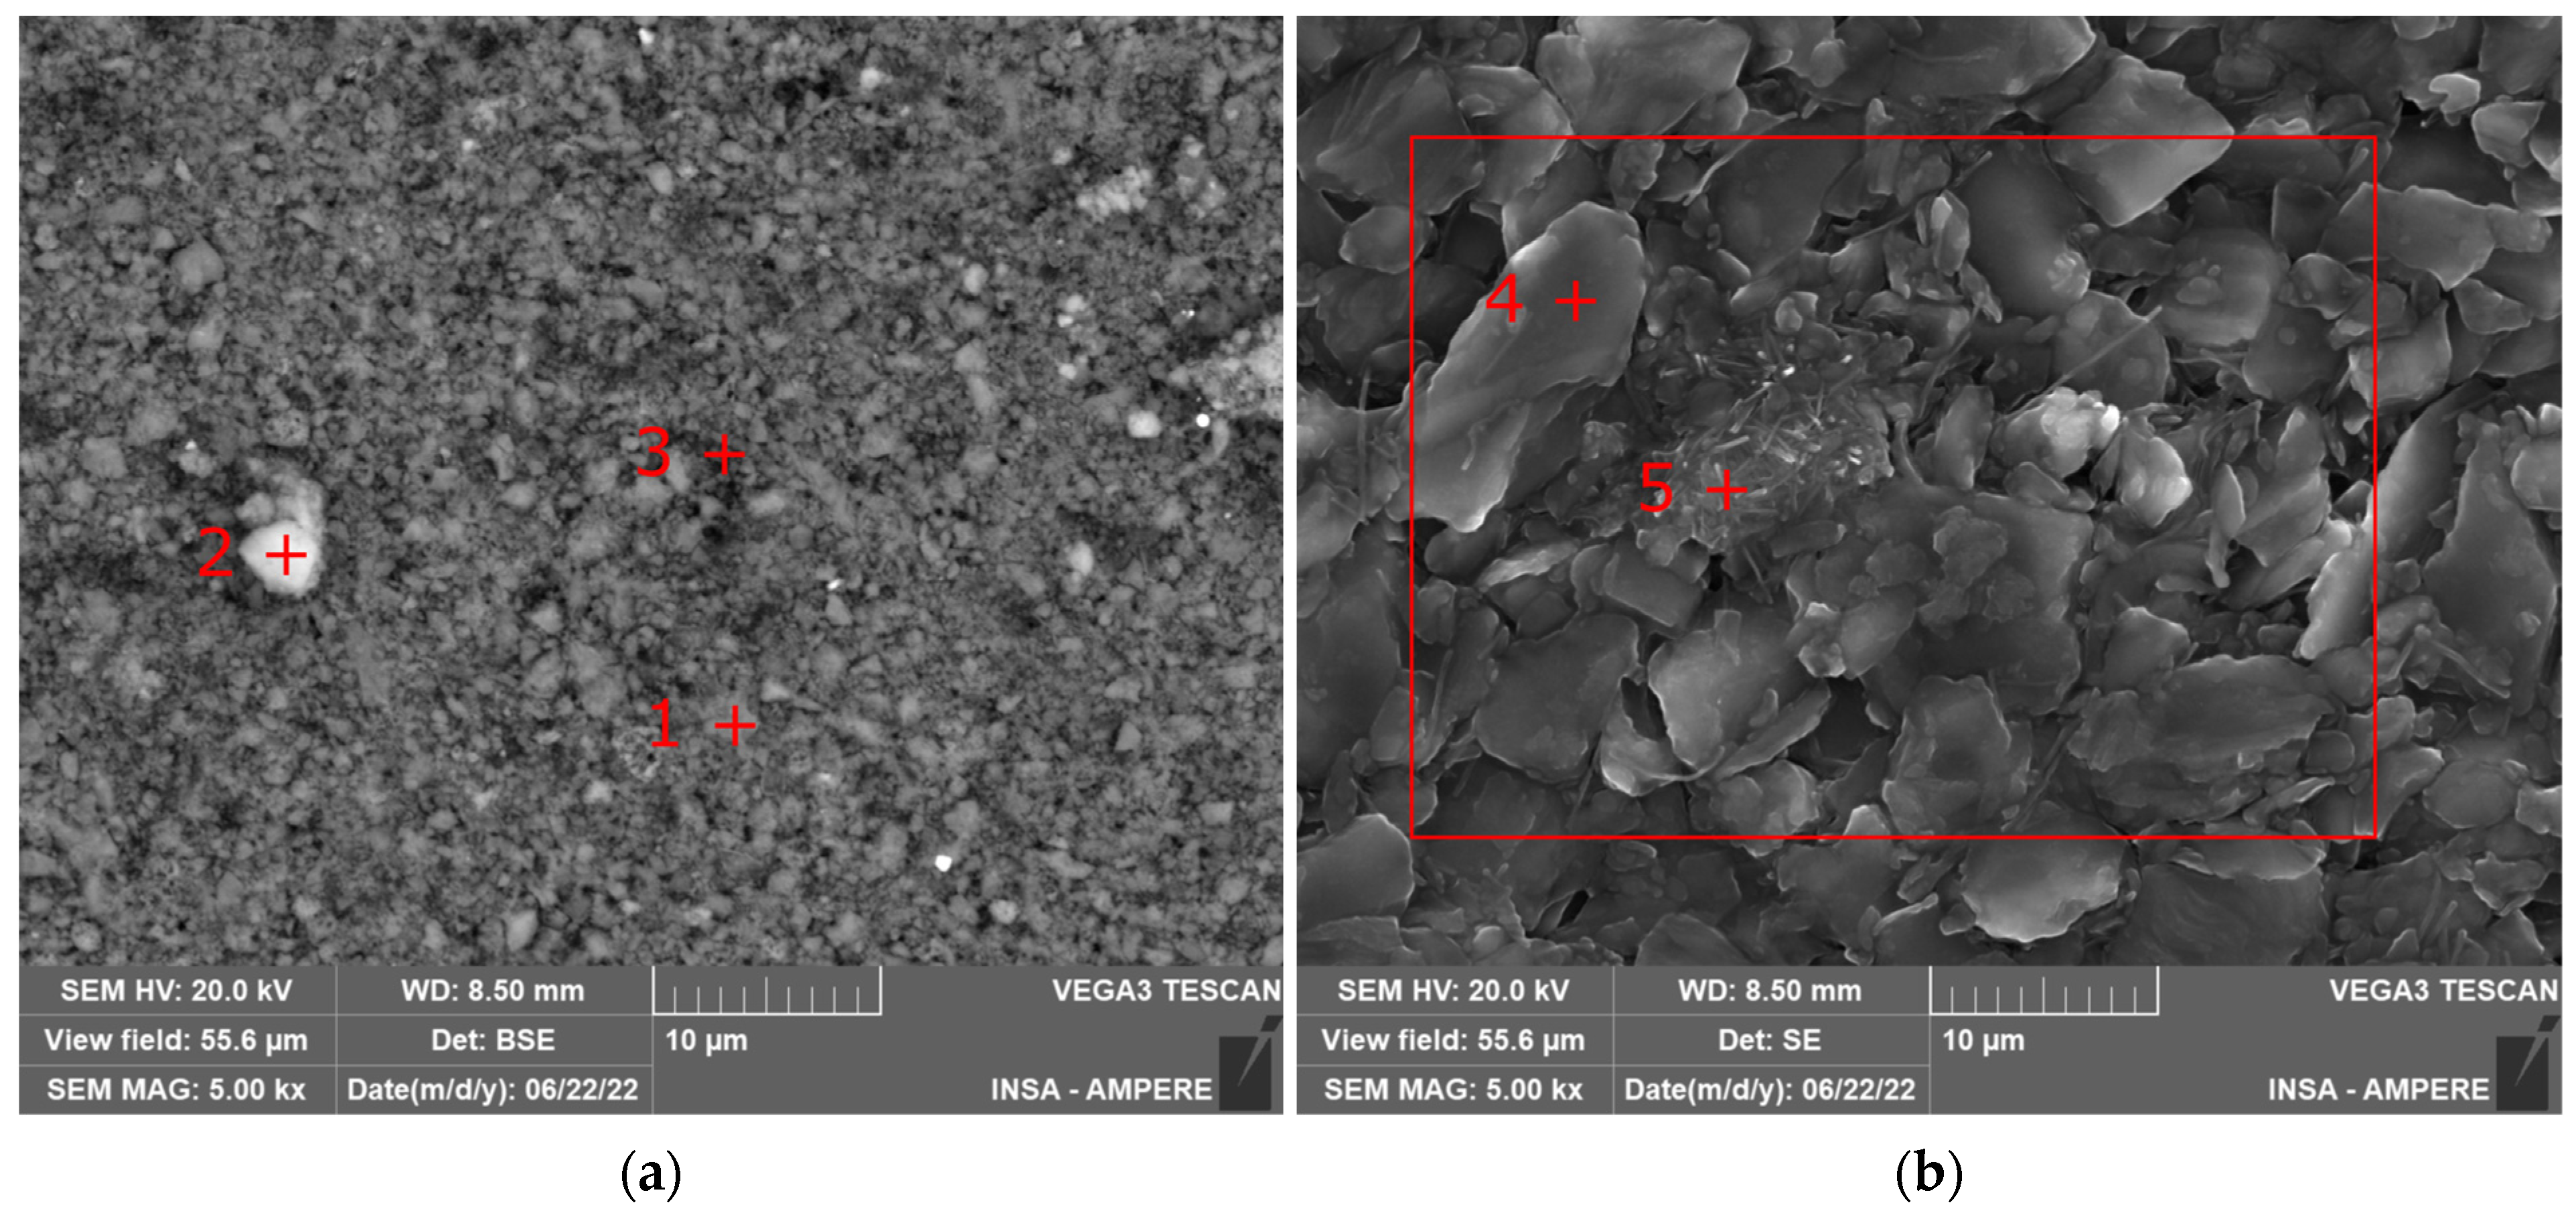
Figure 4.
Macroscopic view of deposits on the negative electrode: (a) analysis of both sides of the negative electrode (cell 2); (b) most common defect on the electrode composed of orange-gold deposits surrounded by a light gray deposit on the graphite, the graphite exhibits a dark grey color; (c,d) enlargements of Figure 4b for defect orange-gold and light gray; (e–h) additional deposits on the electrode.
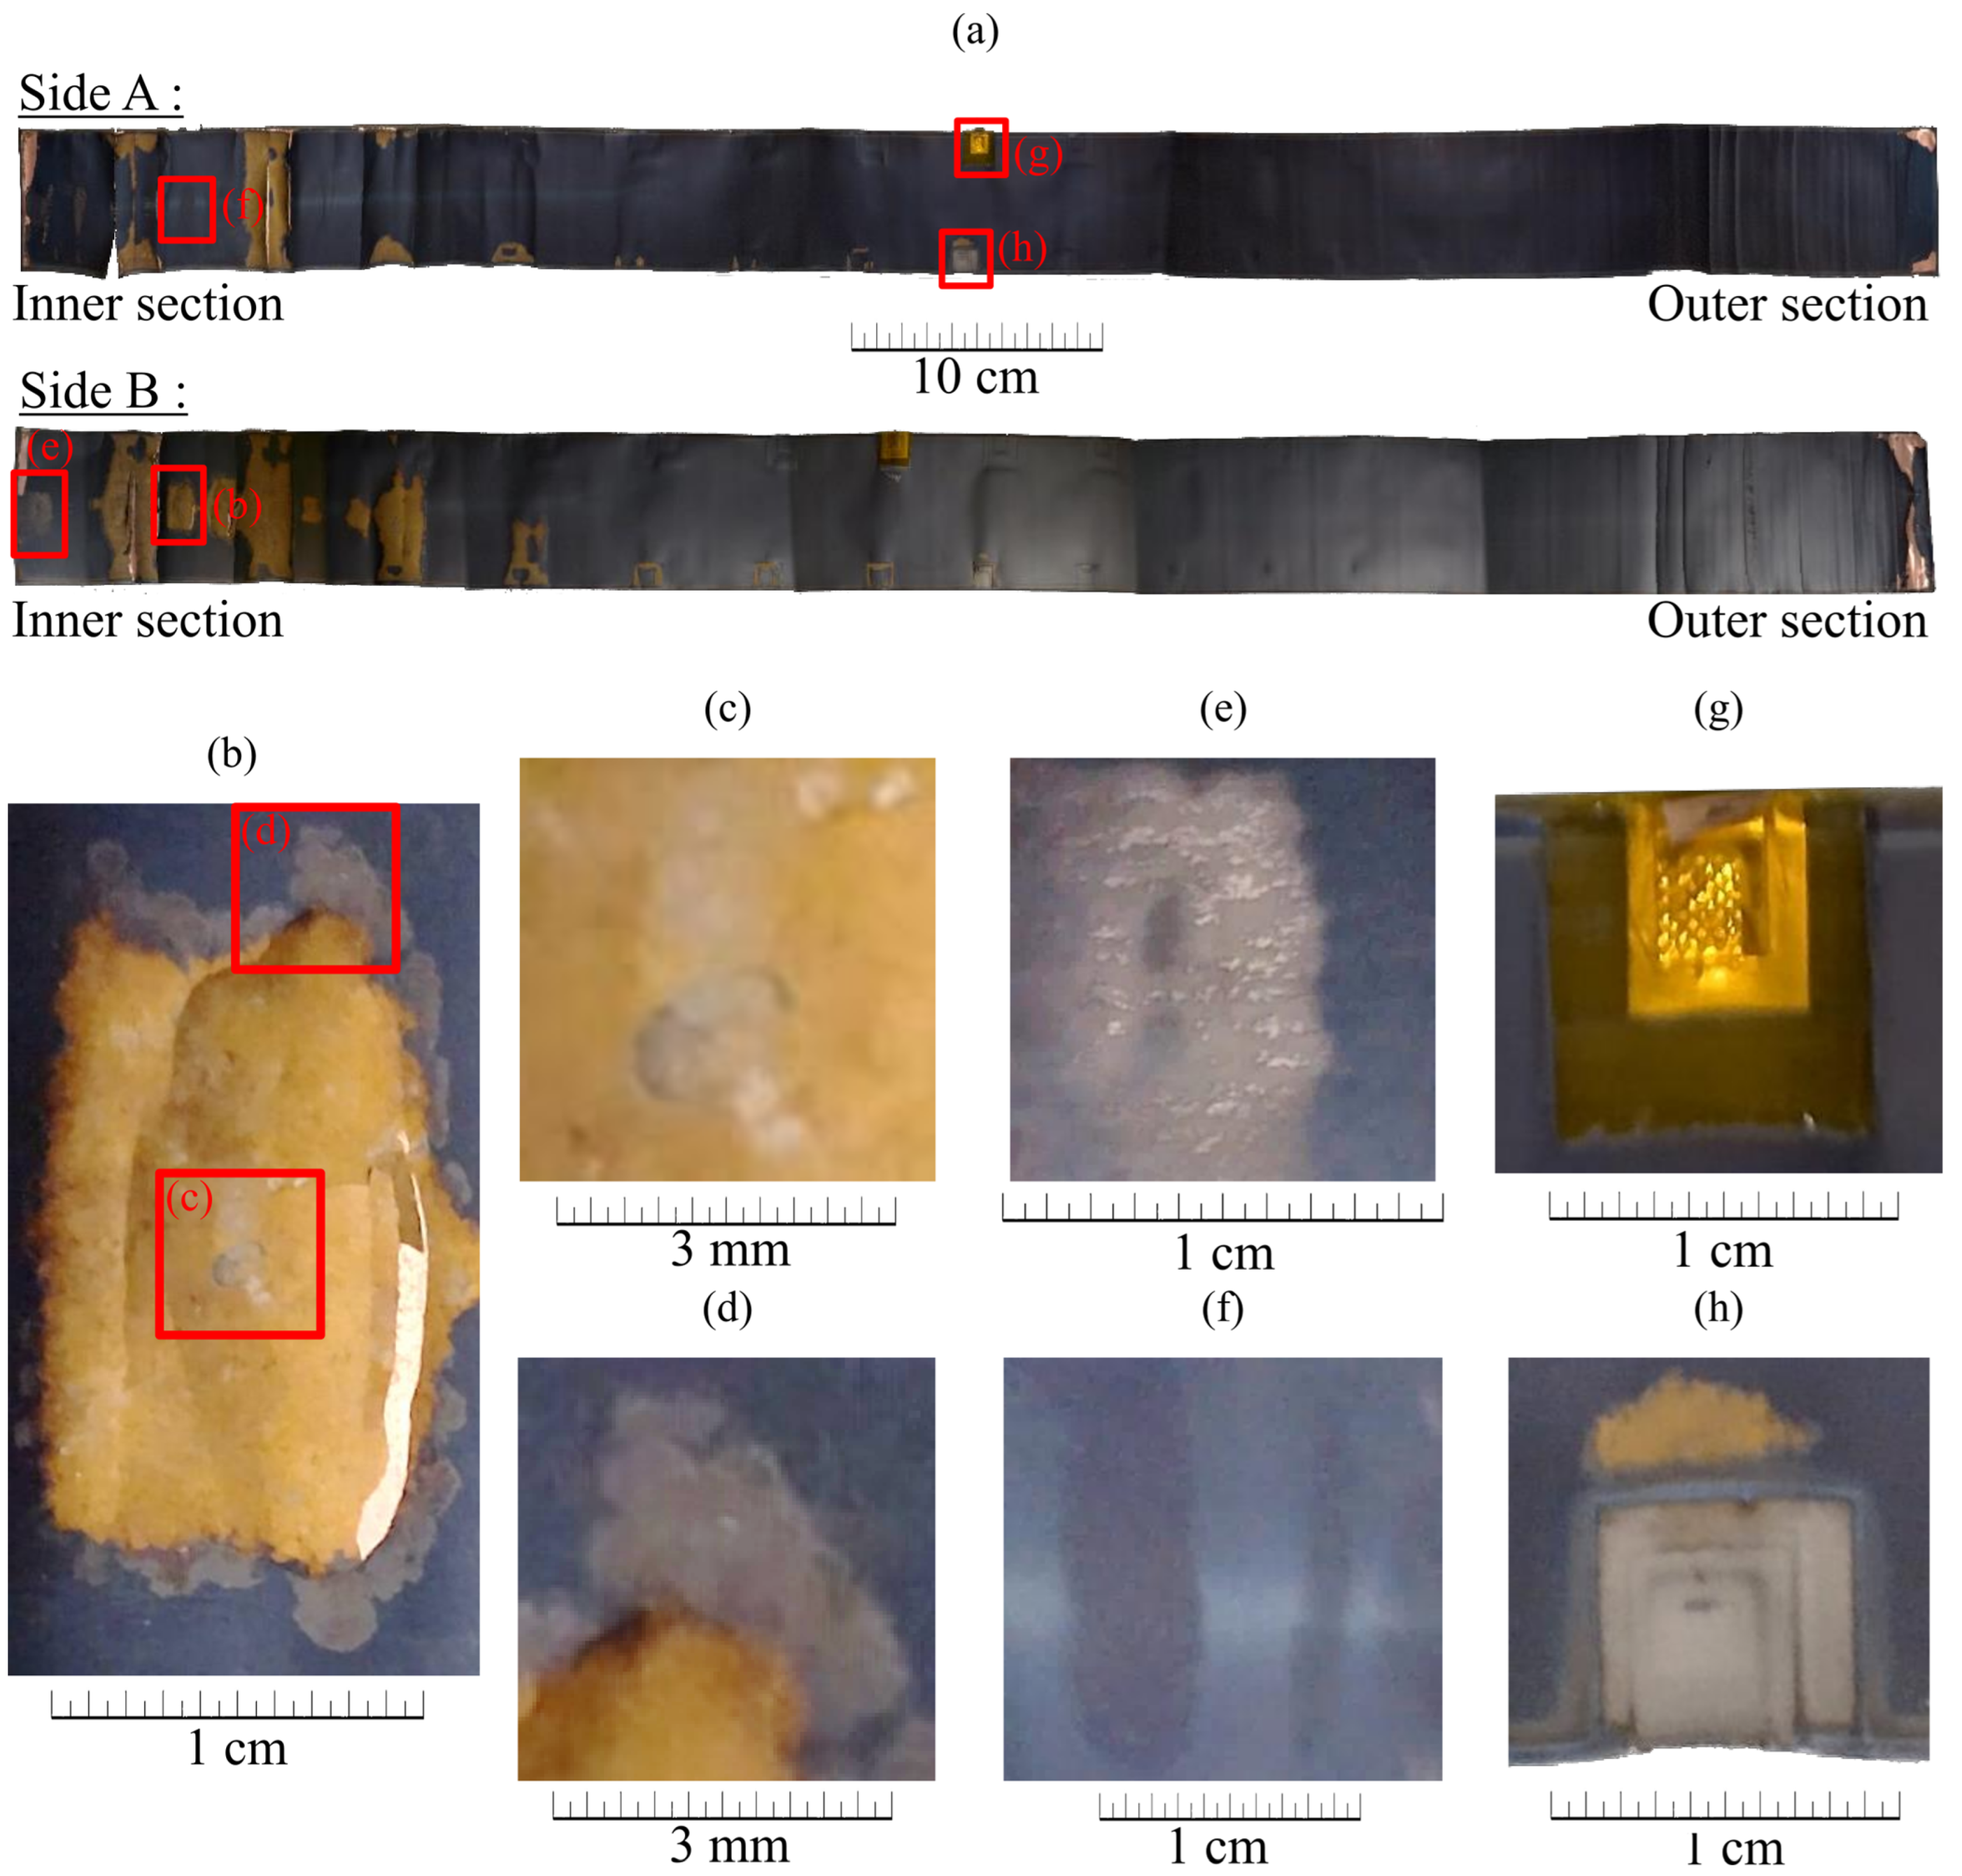
Figure 5.
Image from the SEM BSE detector for the positive electrode for (a) a view field of 278 μm and (b) a view field of 55.6 μm. The red box indicates the position of the EDXS mapping result in Table 2.
Figure 5.
Image from the SEM BSE detector for the positive electrode for (a) a view field of 278 μm and (b) a view field of 55.6 μm. The red box indicates the position of the EDXS mapping result in Table 2.
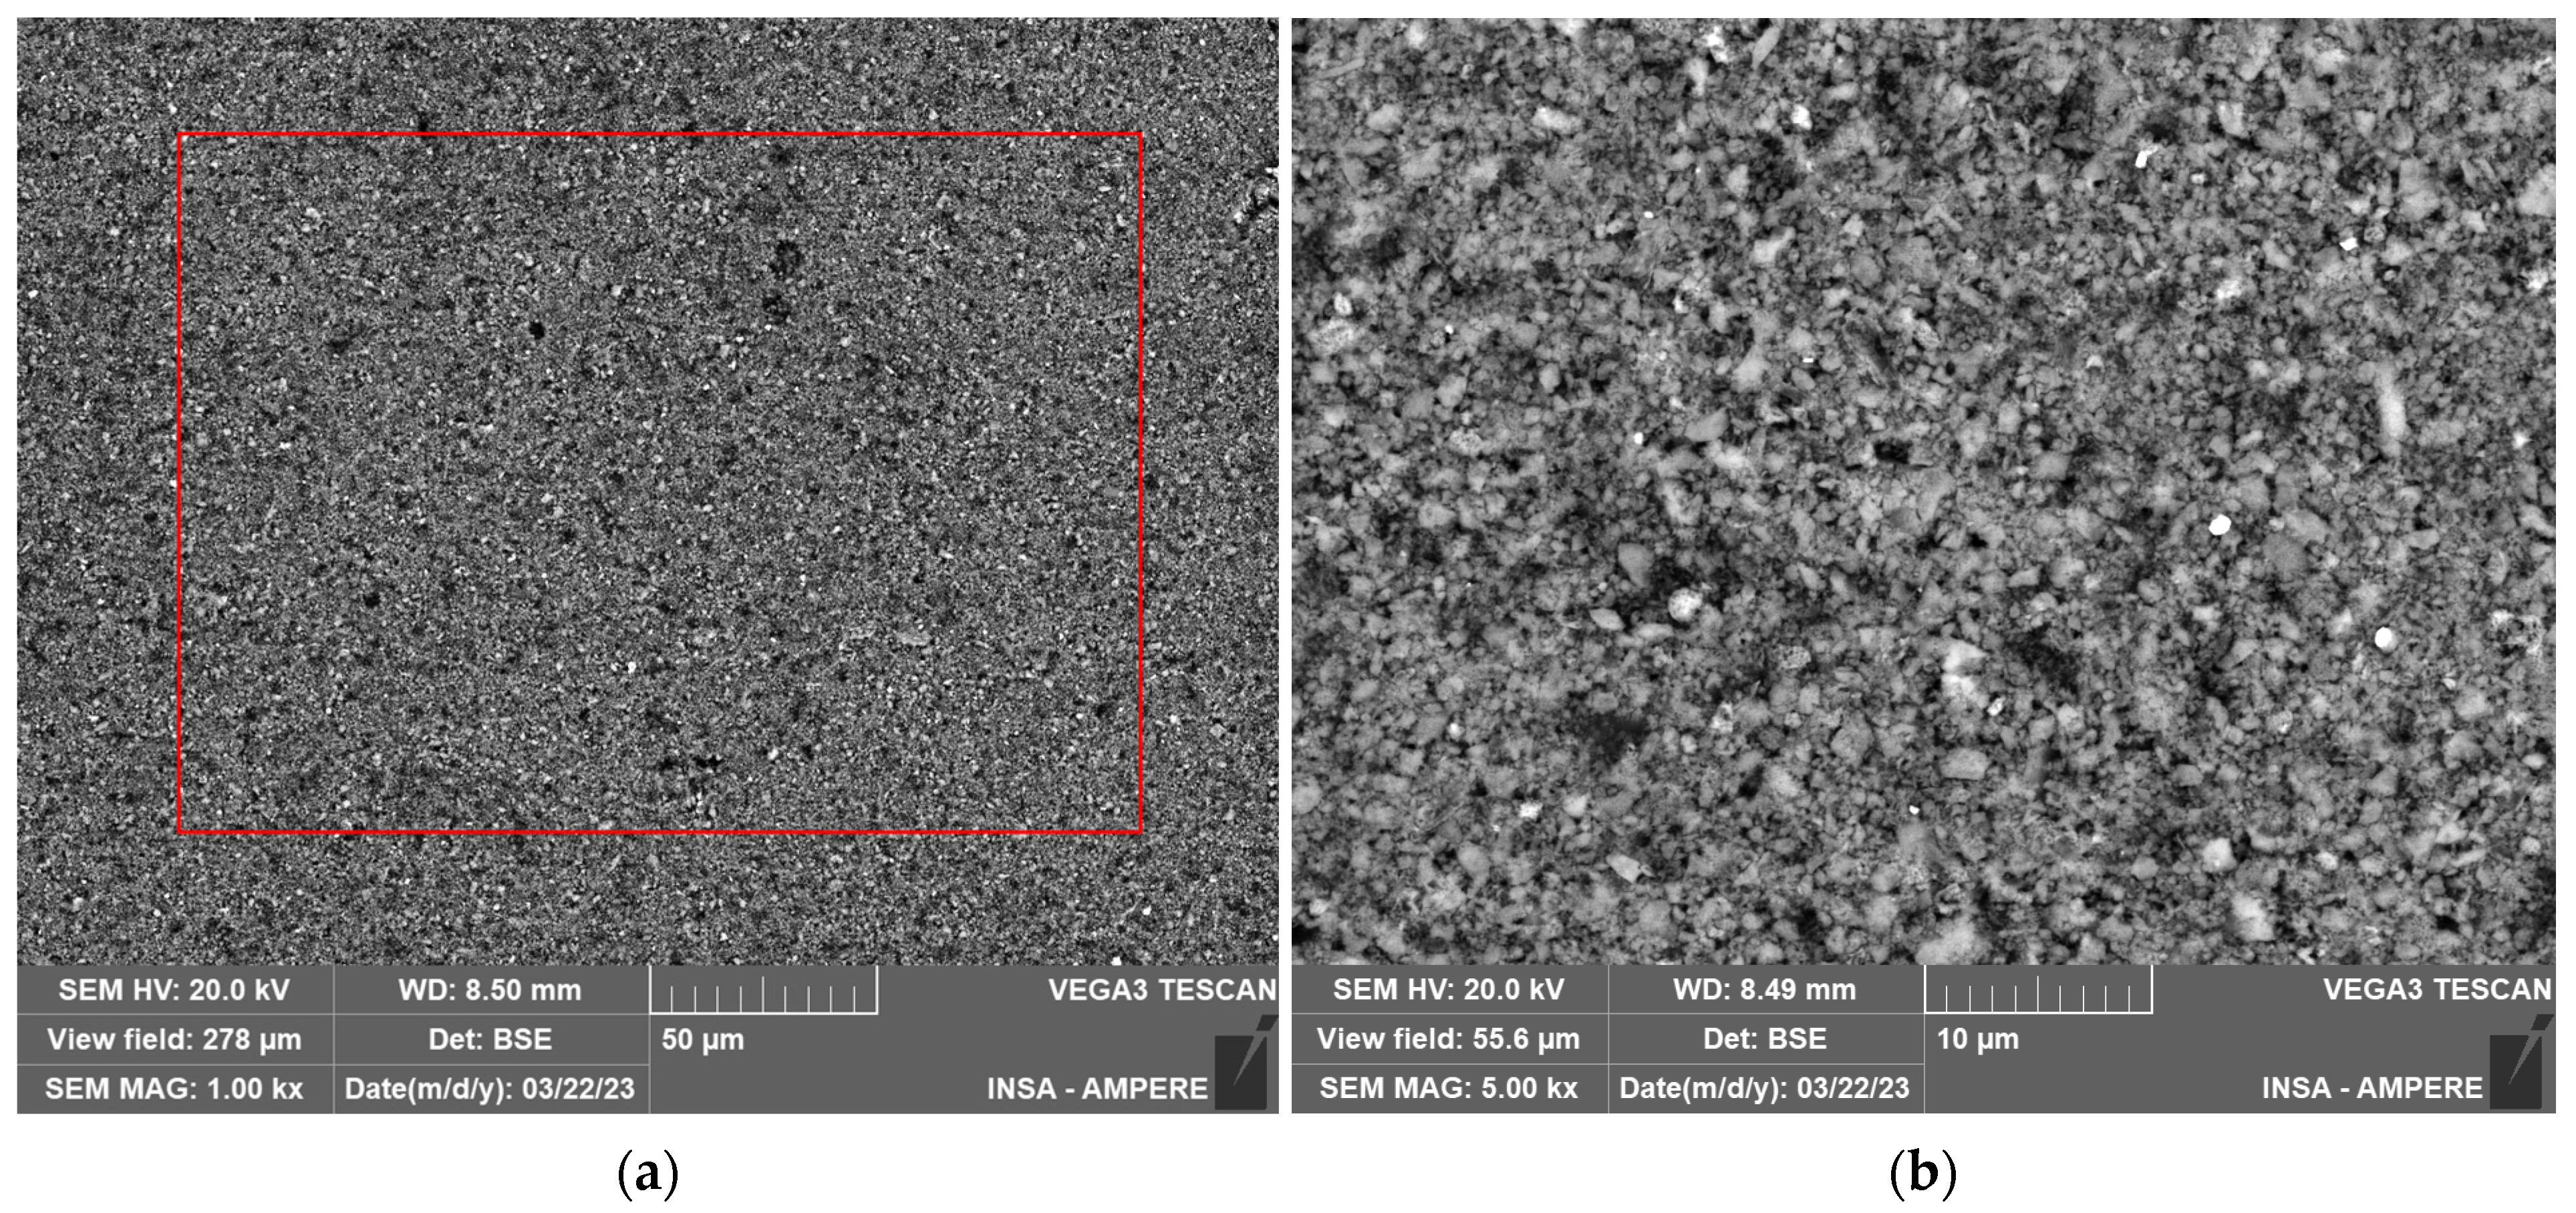
Figure 6.
Images from SEM BSE detector for (a) a pristine-like area, (b) light gray deposit, and (c,d) gold/orange deposit. Positions 6 to 9 refers to the position of their respective results in Table 2.
Figure 6.
Images from SEM BSE detector for (a) a pristine-like area, (b) light gray deposit, and (c,d) gold/orange deposit. Positions 6 to 9 refers to the position of their respective results in Table 2.

Figure 7.
EDXS mapping for (a) all detected deposits on the bulky deposits in Figure 6c,d, (b) oxygen only, and (c) fluorine only. The red boxes indicate the respective position of SEM image in Figure 6c,d.
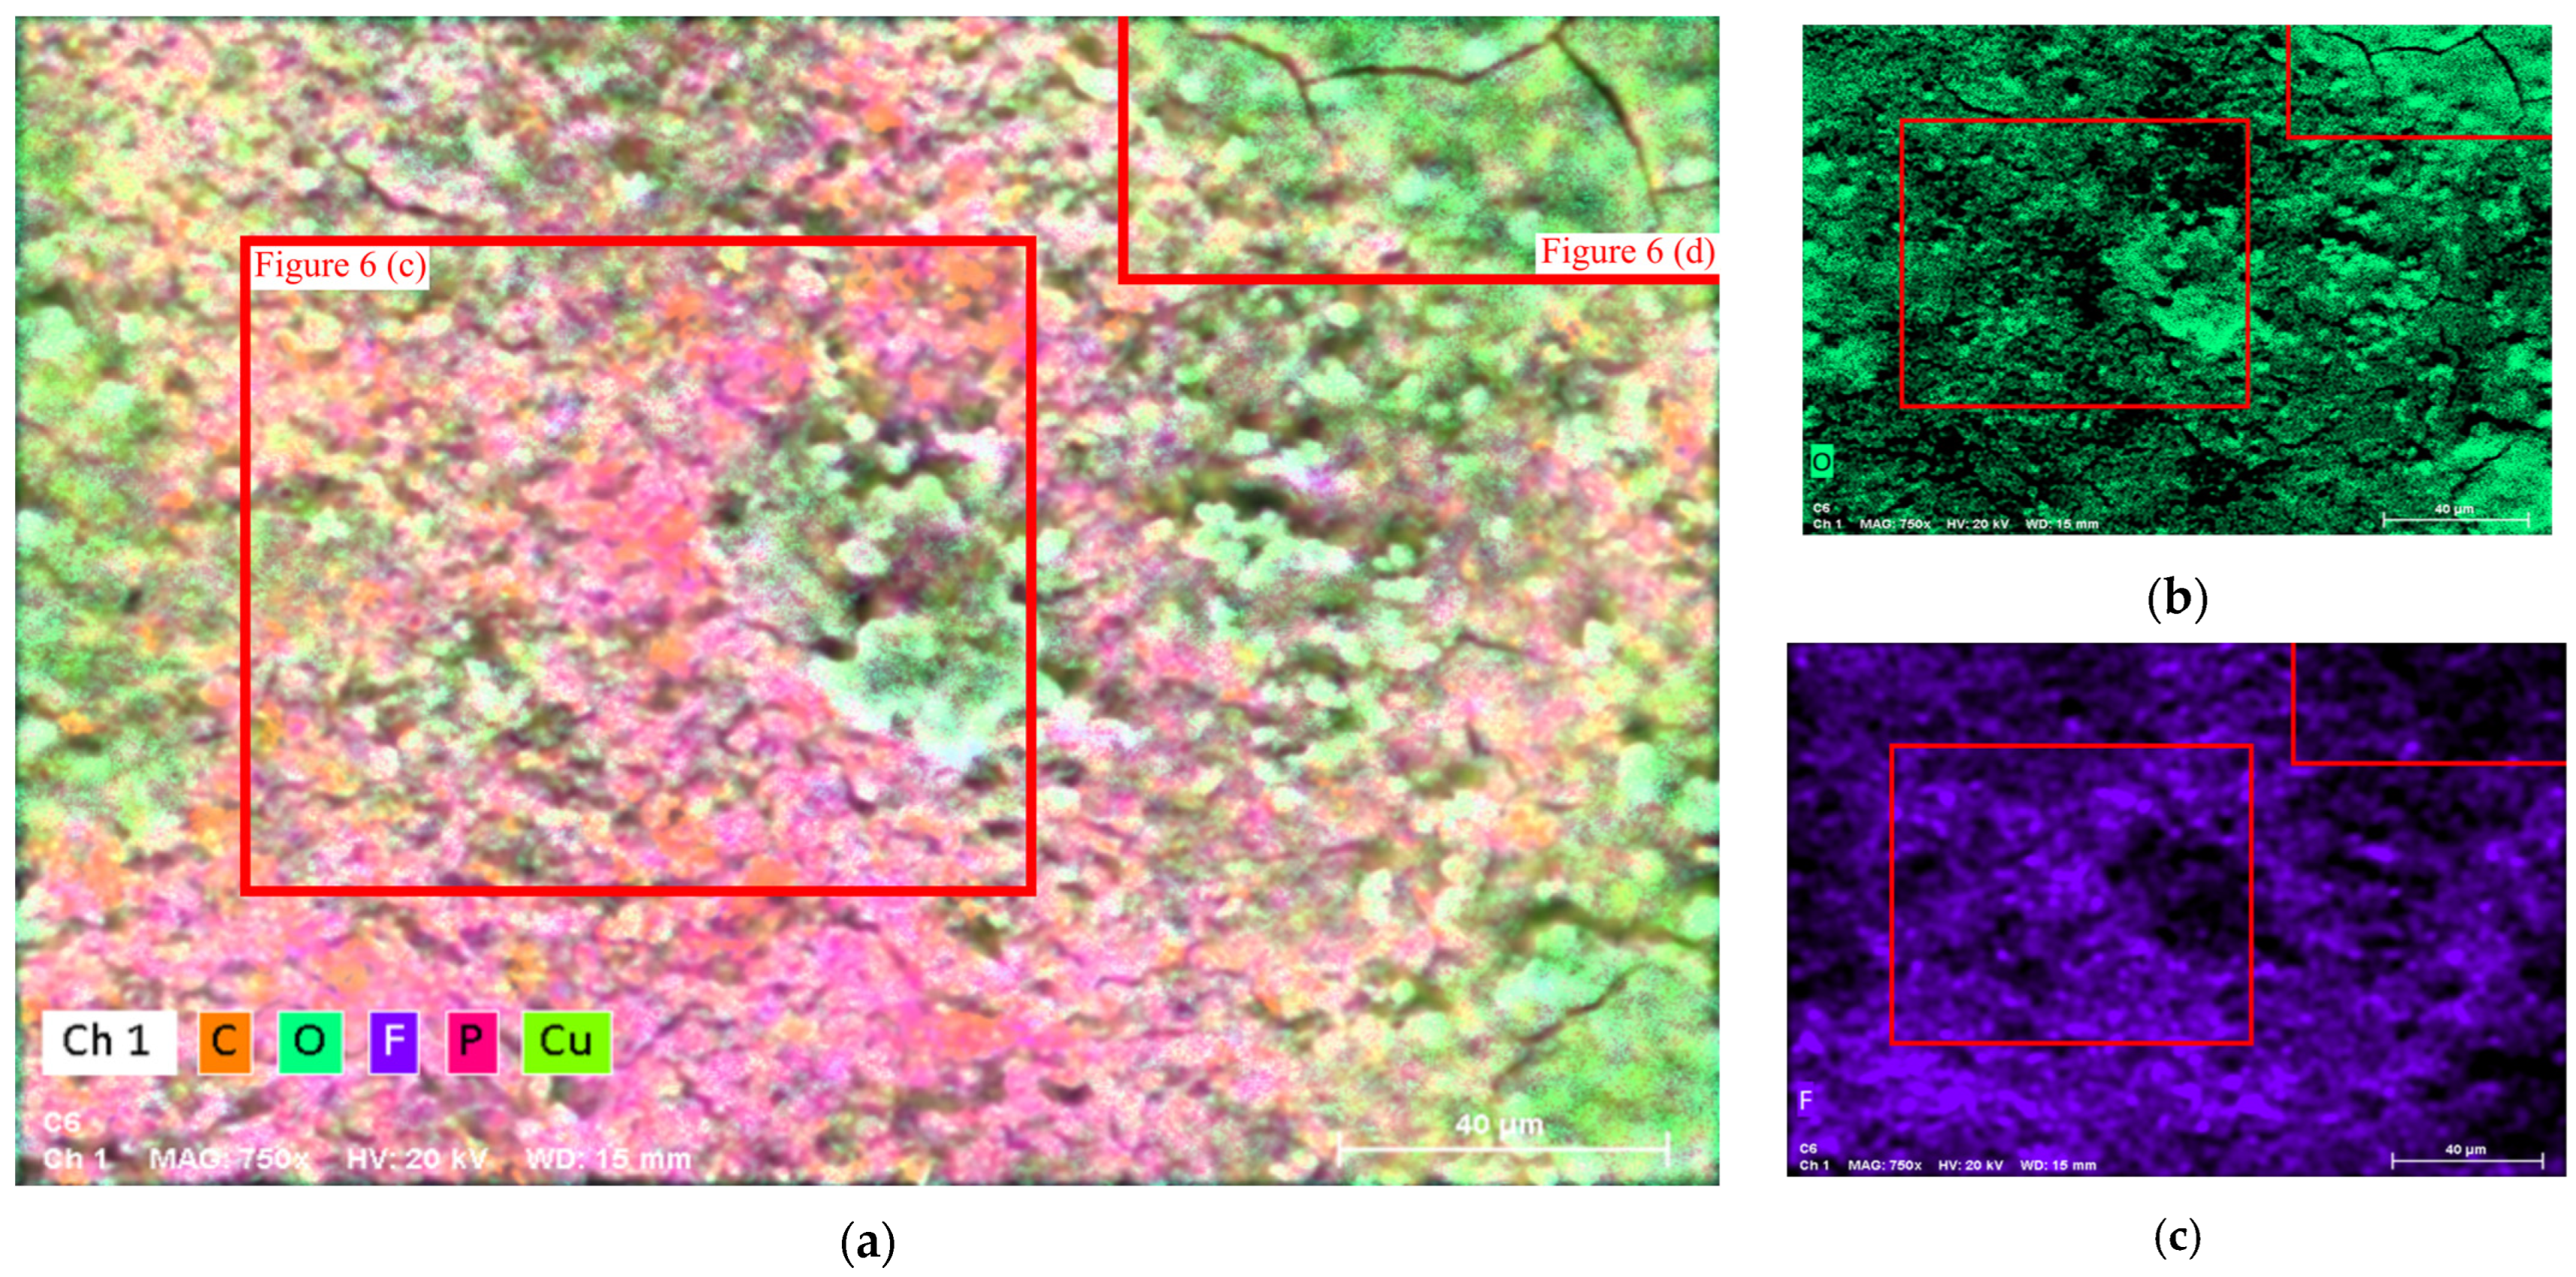
Figure 8.
Electrochemical characterization of pristine and aged materials for (a) samples from the positive electrode and (b) samples from the negative electrode.
Figure 8.
Electrochemical characterization of pristine and aged materials for (a) samples from the positive electrode and (b) samples from the negative electrode.
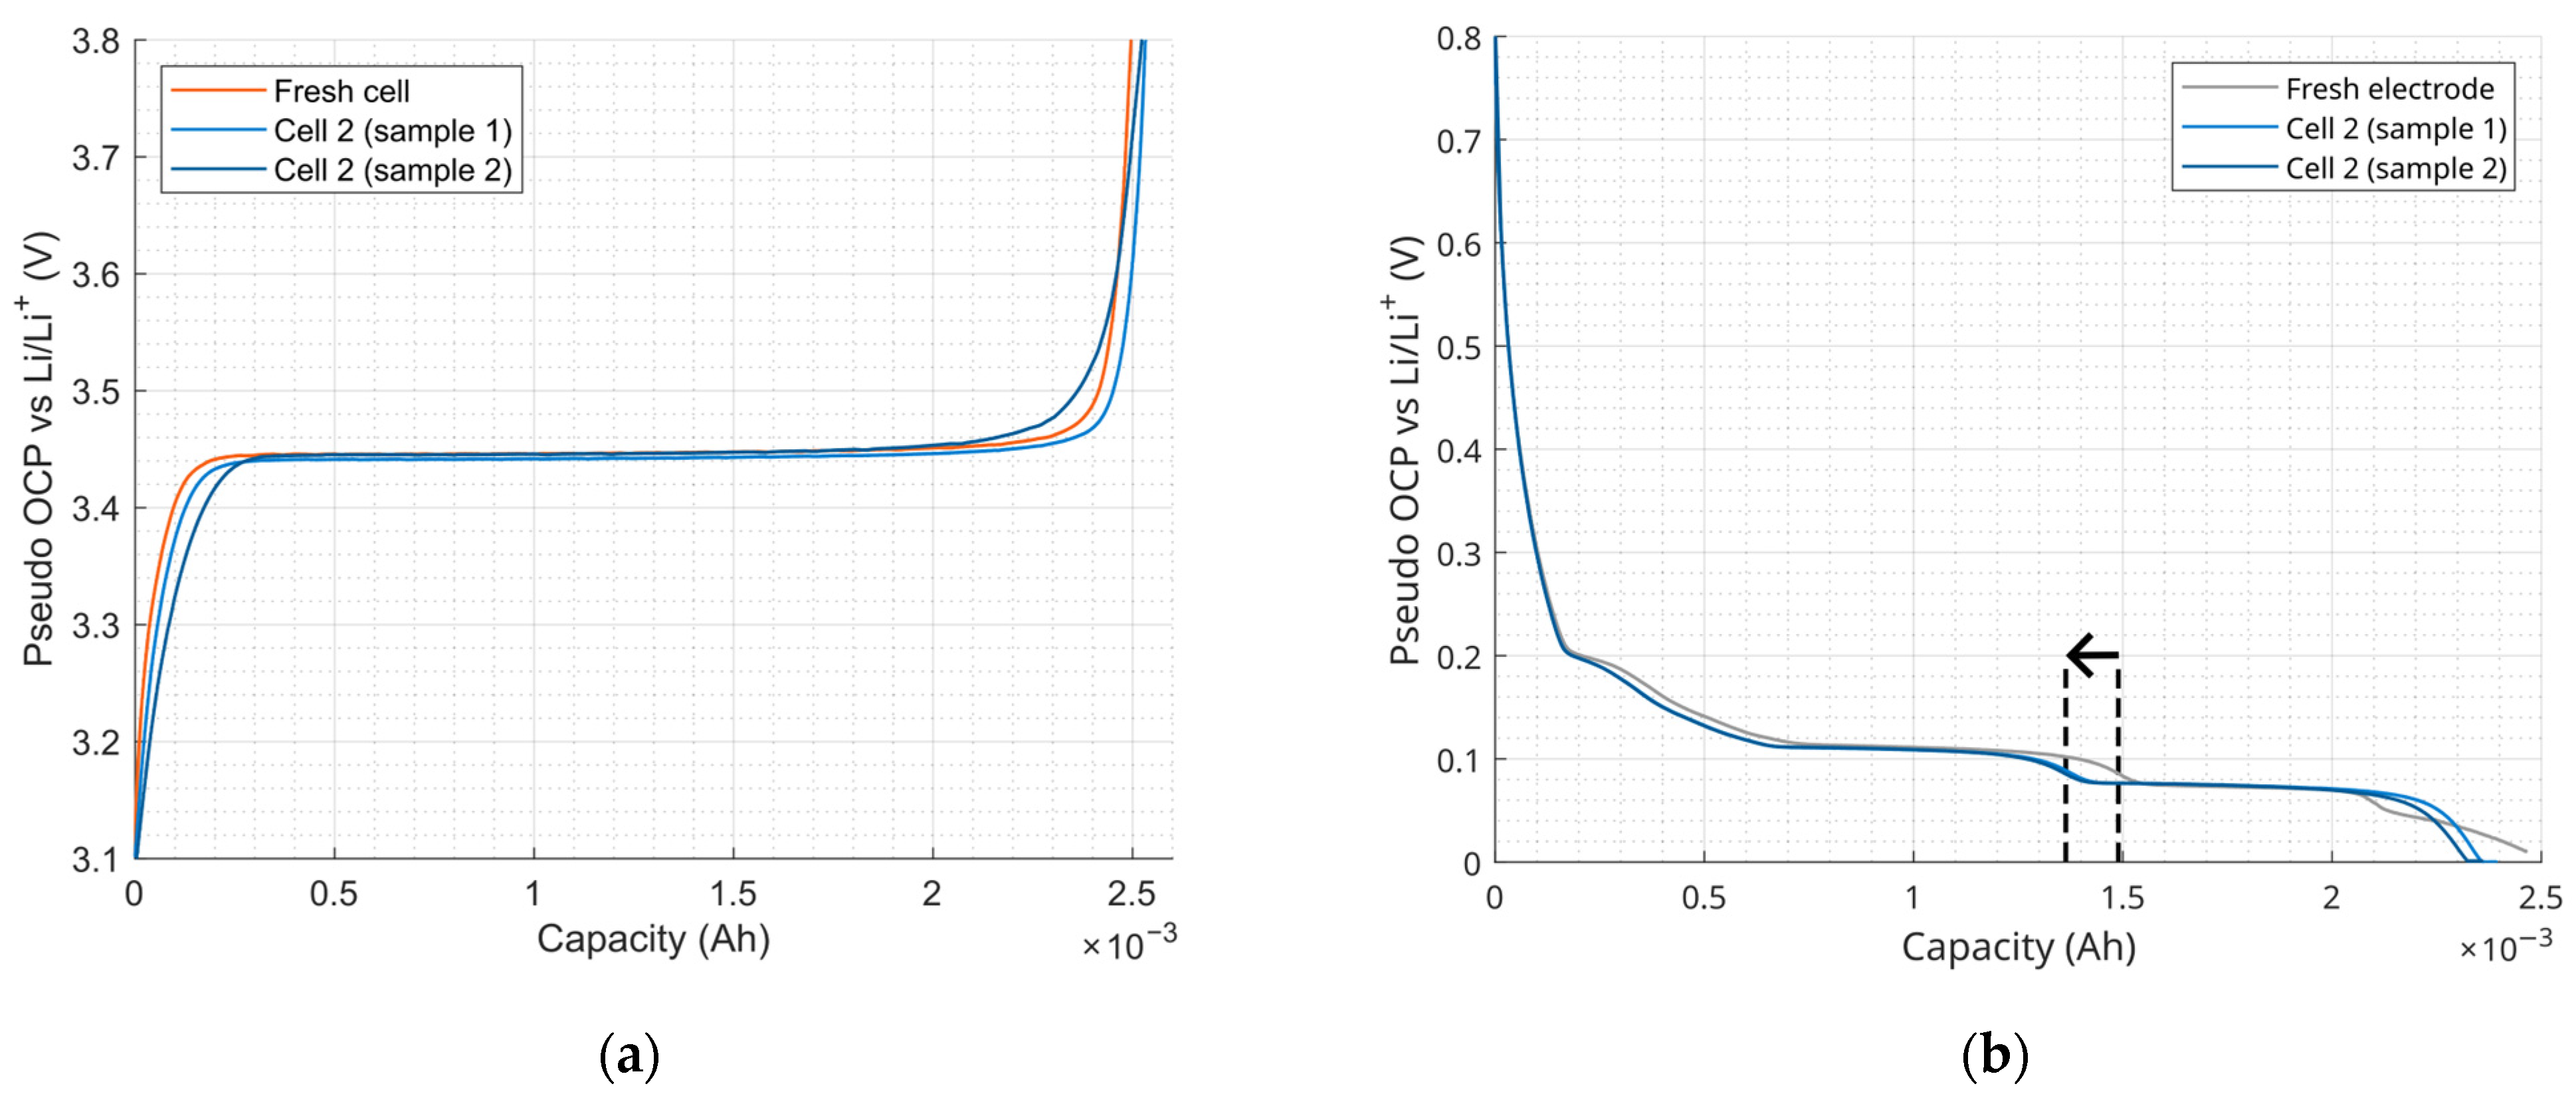
Figure 9.
Exploded view of a cell with the negative electrode, the separator and the positive electrode. Aging mechanisms observed in graphite/LFP cell are (a) LiF formation in grey and thick layer deposition in orange, (b) graphite cracking and exfoliation, (c) first LiF formation, and (d) traces of gas bubble.

Figure 10.
Proposed deposits mechanisms on the surface of the negative electrode: (a) primary SEI formation, (b) SEI growth, (c) SEI cracking, (d) LiF formation, (e) bulky deposit formation, and (f) thickening and reformation. Partial view of a full cell, the positive electrode is not represented.
Figure 10.
Proposed deposits mechanisms on the surface of the negative electrode: (a) primary SEI formation, (b) SEI growth, (c) SEI cracking, (d) LiF formation, (e) bulky deposit formation, and (f) thickening and reformation. Partial view of a full cell, the positive electrode is not represented.


Table 1.
Chemical compounds detected on samples from the pristine electrode (EDXS).
| Grey Areas in LFP Electrode: Position 1 from Figure 3a 1 | White Defect in LFP Electrode: Position 2 from Figure 3a 1 | Dark Grey Areas in LFP Electrode: Position 3 from Figure 3a 1 | Graphite Particle in Graphite Electrode: Position 4 from Figure 3b 1 | Defect in Graphite Electrode: Position 5 from Figure 3b 1 | EDXS Mapping on Graphite Electrode: Zone from Figure 3b 1 | |
|---|---|---|---|---|---|---|
| C | 15.09 ± 4.93 | 18.66 ± 5.82 | 15.9 ± 5.04 | 86.79 ± 19.14 | 78.38 ± 17.48 | 78.60 ± 17.20 |
| Fe | 30.43 ± 1.69 | 29.0 ± 1.62 | 26.1 ± 1.46 | / | / | / |
| F | 1.18 ± 0.62 | 7.37 ± 2.46 | 4.83 ± 1.66 | 1.57 ± 0.68 | 10.04 ± 2.78 | 6.64 ± 1.90 |
| N | / | / | / | 10.04 ± 4.00 | 5.65 ± 2.50 | 8.33 ± 3.10 |
| O | 36.5 ± 9.03 | 53.71 ± 12.84 | 31.80 ± 7.94 | / | 3.26 ± 1.32 | 4.08 ± 1.46 |
| Cu | / | / | / | 1.13 ± 0.14 | 1.74 ± 0.18 | 1.45 ± 0.14 |
| P | 15.66 ± 1.27 | 13.26 ± 1.09 | 14.36 ± 1.18 | 0.48 ± 0.10 | 0.93 ± 0.14 | 0.90 ± 0.12 |
1 Data expressed as mass [%] ± Δabs. (2 sigma error).
Table 2.
Chemical compounds detected a on the negative electrode sample.
| EDXS Mapping on Aged LFP from Figure 5a 1 | Non-Damaged Graphite from Position 6 in Figure 6a 1 | Graphite Grain Covered with LiPF6 from Position 7 in Figure 6b 1 | Heterogeneous Bulky Deposit on Top Graphite from Position 8 in Figure 6c 1 | Bulky Deposit on Top Graphite from Position 9 in Figure 6d 1 | |
|---|---|---|---|---|---|
| C | 12.40 ± 2.84 | 77.59 ± 17.34 | 28.45 ± 7.44 | 43.96 ± 10.86 | 18.9 ± 5.18 |
| Fe | 30.06 ± 1.67 | / | / | / | / |
| F | 3.76 ± 0.91 | 1.75 ± 0.74 | 62.06 ± 14.08 | * | * |
| N | / | 11.58 ± 4.44 | / | * | * |
| O | 37.21 ± 7.79 | 7.11 ± 2.50 | 7.80 ± 15.86 | 51.50 ± 12.88 | 77.11 ± 17.52 |
| Cu | / | 1.98 ± 0.18 | 1.69 ± 0.86 | 4.54 ± 0.36 | 3.99 ± 0.32 |
1 Data expressed as mass [%] ± Δabs. (2 sigma error). * Values unavailable due to detection error.
Disclaimer/Publisher’s Note: The statements, opinions and data contained in all publications are solely those of the individual author(s) and contributor(s) and not of MDPI and/or the editor(s). MDPI and/or the editor(s) disclaim responsibility for any injury to people or property resulting from any ideas, methods, instructions or products referred to in the content. |
© 2024 by the authors. Licensee MDPI, Basel, Switzerland. This article is an open access article distributed under the terms and conditions of the Creative Commons Attribution (CC BY) license (https://creativecommons.org/licenses/by/4.0/).
Share and Cite
MDPI and ACS Style
Wheeler, W.; Bultel, Y.; Venet, P.; Sari, A.; Riviere, E. Postmortem Analysis of 18650 Graphite/LFP Cells in a Long-Term Aging Study for Second-Life Applications. Batteries 2024, 10, 119. https://doi.org/10.3390/batteries10040119
AMA Style
Wheeler W, Bultel Y, Venet P, Sari A, Riviere E. Postmortem Analysis of 18650 Graphite/LFP Cells in a Long-Term Aging Study for Second-Life Applications. Batteries. 2024; 10(4):119. https://doi.org/10.3390/batteries10040119
Chicago/Turabian StyleWheeler, William, Yann Bultel, Pascal Venet, Ali Sari, and Elie Riviere. 2024. "Postmortem Analysis of 18650 Graphite/LFP Cells in a Long-Term Aging Study for Second-Life Applications" Batteries 10, no. 4: 119. https://doi.org/10.3390/batteries10040119
Note that from the first issue of 2016, this journal uses article numbers instead of page numbers. See further details here.