
Li-Ion Battery Thermal Characterization for Thermal Management Design
National Renewable Energy Laboratory, 15013 Denver West Parkway, Golden, CO 80401, USA
*
Author to whom correspondence should be addressed.
Batteries 2024, 10(4), 136; https://doi.org/10.3390/batteries10040136
Submission received: 2 February 2024
/
Revised: 2 March 2024
/
Accepted: 4 April 2024
/
Published: 18 April 2024
(This article belongs to the Special Issue Thermal Management in Lithium-Ion Batteries: Latest Advances and Prospects)
Abstract
:Battery design efforts often prioritize enhancing the energy density of the active materials and their utilization. However, optimizing thermal management systems at both the cell and pack levels is also key to achieving mission-relevant battery design. Battery thermal management systems, responsible for managing the thermal profile of battery cells, are crucial for balancing the trade-offs between battery performance and lifetime. Designing such systems requires accounting for the multitude of heat sources within battery cells and packs. This paper provides a summary of heat generation characterizations observed in several commercial Li-ion battery cells using isothermal battery calorimetry. The primary focus is on assessing the impact of temperatures, C-rates, and formation cycles. Moreover, a module-level characterization demonstrated the significant additional heat generated by module interconnects. Characterizing heat signatures at each level helps inform manufacturing at the design, production, and characterization phases that might otherwise go unaccounted for at the full pack level. Further testing of a 5 kWh battery pack revealed that a considerable temperature non-uniformity may arise due to inefficient cooling arrangements. To mitigate this type of challenge, a combined thermal characterization and multi-domain modeling approach is proposed, offering a solution without the need for constructing a costly module prototype.
1. Introduction
Battery electric vehicles (BEVs) improve renewable energy integration and enhance grid energy efficiency, leading to reduced greenhouse gas emissions. Accelerating BEV adoption needs to address both the range and charge anxieties of BEV users. These forces point toward development in extreme-fast-charge (XFC) enabled battery design and increased specific energy and volumetric energy density. Fast charge rates shall be comparable to refueling a petroleum-fueled vehicle and the range should exceed vehicles on the road today [1]. The increase in energy densities and charging capability results in an increase in heat generation, which requires upsizing the battery thermal management system (BTMS) [2].
The need for BTMSs arises from the sensitivity of lithium-ion batteries to their operating temperatures [3]. If the cells become too hot, the life cycle of the battery is significantly decreased. Inversely, if the cell temperature is too low, the power performance and the available capacity drop significantly. In designing a full vehicle pack, it is imperative to account for all the heat sources within the battery pack and to couple the form factor with the appropriate thermal management system.
Today, batteries have excellent thermal efficiency—generally around 98% under normal cycling conditions found within BEVs. Any inefficiencies, although small at the cell level, stack upon themselves once integrated into a battery pack. For instance, a pack with a rated power output of 150 kW is expected to generate 3 kW of heat load on the system when considering that same 98% heat efficiency. The inclusion of a cooling system designed to reject 3 kW of heat load results in an addition of approximately 5 kg to the battery system [4]. This calculation does not include the cooling requirement under extreme fast charging, which could be as high as 15 kW [5]. Assuming the thermal management mass scales with system power and a battery pack with a specific energy of 300 Wh/kg at the cell level, a 15 kW management system accounts for 5% of the mass of the batteries within the pack. This example does not account for the impact on the system volume.
The advent of newer lithium-ion chemistries, such as high-nickel NMCs [6,7] and silicon-based anodes [8], alongside efforts to achieve higher energy densities, drives the need for continually more robust thermal management systems. The higher the energy density, the larger the volumetric heating from inefficiencies. Even with improvements in efficiency, the cooling load will increase because of the decrease in the available heat transfer area, resulting in an increase in the heat flux to be rejected by battery systems. An accurate estimate of heat generation rate versus operating condition (e.g., state of charge or C-rate) is needed to effectively design a thermal management unit that can keep up with this demand.
Characterizing heat generation sources is a crucial step in designing a BTMS [9]. The reliability of heat source characterization relies on a fundamental understanding at various levels within a battery pack. In this study, we provide a concise review of the different heat generation terms within a battery pack. Additionally, we detail the operating parameters, such as the C-rate and temperature, as well as the interconnect design, which play crucial roles in influencing the amount of heat generated. Furthermore, we offer examples demonstrating how heat measurements in isothermal battery calorimeters during electrochemical cycling aid in overcoming practical design challenges. Finally, we illustrate how to match the design of thermal management units with target battery performance.
2. Methods
All heat generation measurements discussed in this article were collected at the National Renewable Energy Laboratory’s Battery Thermal and Life Analysis Laboratory. In these experiments, a battery sample is placed within an isothermal calorimeter and cycled within the heat chamber via an external power supply, as illustrated in Figure 1. The heat chamber is submerged within a liquid isothermal bath. The heat dissipated from a battery sample is measured using heat flux sensors attached to the surface of the heat chamber. The total thermal energy is calculated by temporally integrating the measured heat flux profile. Due to the thermal lag between the sample surface and the sensors in the calorimeter, it is important to note that the measured heat flux may not accurately represent the time-resolved heat flux at the cell surface, especially under high power loads. A more detailed explanation of the calorimeter technique is provided in Isothermal Battery Calorimeters [10]. “Isothermal” is used to describe the temperature condition of the full system that is used to measure heat generated by the device under test. The full system is controlled to ±0.001 °C, which allows ±5 mW of baseline heat stability. This setup, while isothermal at the full system scale, still allows the device under test to experience a temperature increase.
By integrating battery thermal characterization at cell level with system-level simulations using battery computer-aided engineering (CAE) tools, such as multi-scale multi-domain battery modeling [11,12], the thermal performance of a battery system can be assessed. These combined experimental and modeling approaches can accelerate battery prototype development and reduce development cost. A design trade-off analysis of BTMSs can be conducted without building a costly system. More importantly, these approaches are effective for quantifying spatial thermal and electrochemical inhomogeneities that are difficult and expensive to measure in experiments.
3. Results and Discussion
3.1. Cell Heat Generation
The main source of heat within a battery pack is the cells themselves. Heat generation in a battery cell arises from two components: the electrode sandwich and current collectors, which can be expressed as
where is the heat in the unit of W and is volumetric heat in the unit of W/m3.
The electrical heat produced by both positive and negative current collectors follows Ohm’s law and can be calculated using Equation (2) [1,13].
where represents electrical conductivity and represents the local electric potential.
For the electrochemical heat generated by the electrode sandwich, Bernardi et al. [14] proposed a comprehensive equation that considers electrochemical reactions, joule heating, phase changes, and mixing effects. Mixing heat and phase change heat are typically small and can be neglected [15,16]. Therefore, the volumetric heat generated by the sandwich can be simplified to Equation (3).
where is the volumetric reaction current in the unit of A/m3; is the open circuit voltage; is the sandwich volage between current collectors; and is the temperature in K. The first term corresponds to irreversible overpotential heat due to ohmic losses in the sandwich, while the second term represents the reversible entropic heat.
Joule heating from the electrolyte and resistance within the cell matrix are the largest contributors to the heat signature [17]. Ohmic heating sourced from the ion flux within the electrolyte is the largest source of cell heat originating from the materials within the cell during normal operation. The heat sourced from the electrolyte can be attributed to low electrolyte conductivity/diffusivity at higher C-rates and formation/growth of the solid electrolyte interface (SEI). Matrix ohmic heating is the heat generated within the solid portion of the lithium-ion cell. Matrix ohmic heating has historically been neglected due to the relatively larger electrical conductivity compared to the electrolyte ionic conductivity. In the drive to bolster specific energy, cell designs have increased the electrode thickness from around 40 µm to over 100 µm [18]. This maximization of active material in turn impacts the relative amount of inactive current conductors and increases the amount of heating from the current conductors. These heat sources are the resistances at interfaces between cell components and ohmic losses of the current-conducting substrate. Electrolyte and matrix ohmic heating are dependent on factors such as the C-rate, cell size, and cell age. The heating rates scale with the increase in each of these parameters. Advanced diagnostic techniques, such as the micro calorimeter developed by Santhanagopalan et al. [19], measure the time-resolved thermal performance of small battery samples while conducting an electrochemical impedance spectroscopy (EIS) characterization. This enables the identification of the heat contribution of each individual component while also relating their bulk contribution.
The chemical reactions within the cell generate both reversible and irreversible heat. The reversible heating source is a result of the entropic changes in the lattice structure when lithium is inserted into or pulled from the structure. While there are some irreversible entropic losses, a reversible reaction dominates the heat signature at low cycle rates—usually those under C/10 charge or discharge [17]. The irreversible heating is attributed to the charge transfer overpotential during the oxidation and redox at the interfaces between the electrolyte and active cell materials. Under normal operating conditions, the reversible heat sources contribute to 10% of the total cell heating, whereas the irreversible losses account for around 40% [17].
Individual cell energy inefficiencies are correlated to transport and kinetic properties within the cell. At the cell level, this correlation can be illustrated through the comparison between energy and power cells. An energy cell designed to prioritize meeting an energy requirement will typically have higher active material loading, which will have adverse heat effects due to the longer path the ions have to travel during intercalation. This longer pathway results in irreversible heat losses. Similarly, the total effective thermal conductivity of these higher electrode loading cells is also lower, resulting in increased levels of heat not dispersing throughout the cell. In contrast, a power cell designed for high current outputs to meet a power target will have a lower material loading and thinner electrodes, leading to lower irreversible losses due to ion transport. Although these cells have a better thermal signature, they suffer from a total energy standpoint due to having less active material and a larger fraction of the total mass/volume being dedicated to substrates that do not participate in the cell reaction. Designing a system that minimizes heat losses within the battery requires an understanding and quantification of each heat source.
3.2. Cell Heat Generation with C-Rate and Temperature
The heat generated by the cell increases as the cell’s cycled C-rate increases. This is mostly because of ohmic joule heating, which increases proportionally to the square of C-rates. The joule heating can be simply modeled using Ohm’s law:
where is the heating rate; denotes the cell current; and is the total cell resistance. In this case, the resistance captures both ionic diffusion resistances within the active material and electrolyte, as well as the electrical resistances of the electron’s path.
The local temperature during operation has an inverse effect on cell heat generation. As the temperature decreases, the ionic conductivity of the electrolyte decreases due to the increased viscosity of the electrolyte, creating more resistance to the ionic flow. Conversely, the battery operates more efficiently at higher temperatures, but the trade-off for increased performance is usually a decrease in battery life. Thermal management systems work to balance this trade-off between performance and life degradation.
Figure 2a illustrates the heat generation of a 12 Ah LMO/LTO pouch cell across multiple temperatures at various C-rates, with the cutoff voltages set at 2.8 V and 1.6 V. At a rate of 1C, the heat generation rate was approximately 0.25 W at 30 °C, 0.50 W at 0 °C, and 1.5 W at −15 °C. This effect was also evident at the higher rate of 4C. The heat generation tripled from 2 W to 6 W between 30 °C and 0 °C, and doubled from 6 W to around 13 W between 0 °C and −15 °C. This behavior of the cell indicates that there was a resistance spike between 30 °C and 0 °C, likely due to a rapid decrease in the ionic conductivity between those temperatures. Over this same temperature change, the cell discharge capacity was inversely proportional to the cell resistance.
Figure 2b demonstrates this decrease in available energy by showing how the available capacity vs. the C-rate of the cell changes. Comparing the change in discharge capacities against the amount of heat generation at the different temperatures and C-rates also serves to evaluate transport limitations within the cell. Comparing Figure 2a,b, we can see that the amount of heat generation was not always proportional to the improvement in cell capacity. In addition, we must note that although these results are specific to the cell studied under this example, the analysis procedure outlined here broadly applies to multiple chemistries and/or cell designs. In fact, these heat signals can be used to benchmark performance across different cell formats with the same chemistry, or vice versa.
Next, we aimed to understand how heat generation is impacted by both temperature and discharge rate. For an ideal ohmic resistor for a given ambient temperature, the heat generation rate should scale with the square of the C-rate. At 30 °C, the heat generation rate was 0.18 W at 1C, 0.67 W at 2C, and 2.5 W at 4C. When normalized for the currents (i.e., when the heat generation rate is divided by the square of the C-rate), we see that the resistance at 4C was approximately 87% of that at 1C. This is attributed to the enhanced transport properties heating within the cell at higher currents. Subsequently, the ambient temperature was lowered from 30 °C to 0 °C and the experiment was repeated. At 0 °C, the average heat rate increased from 1C to 4C and was nearly three times what it was at 30 °C. A similar trend was observed moving from 0 °C to −15 °C. The 4C heat rate increased from 2.5 W at 30 °C to 6 W at 0 °C and to around 13 W at −15 °C. From these results, it is evident that the capacity at 0 °C decreased as the C-rate increased. At −15 °C this correlation was amplified. The cell’s discharge capacity fell to a point at −15 °C where the 2C capacity was only approximately 77% of the available capacity at 30 °C, indicating a need for an external heat source to minimize the performance loss at low temperatures.
3.3. Evolution of Heat Generation in Battery Formation Cycling
Heat generation rates change with cell aging, leading to a decrease in capacity and an increase in resistance [20]. However, there is currently a lack of publicly available experimental quantification regarding the effect of aging on battery heat generation. Several factors can influence changes in cell resistance and heat generation, including the formation of the solid–electrolyte interface, changes to wetting properties of the electrodes and/or the separator membrane, degradation of the electrolyte additives, gas generation, mechanical degradation, and lithium plating.
Cells often undergo formation cycles, where the potential within the different cell components equilibrate and the surface layers on the electrodes mature before the cell capacities level off. Cell formation is a widely empirical, tightly controlled process. The formation parameters, such as ambient temperature, durations, and voltages (or currents), of the charge and discharge are often determined from an extensive experimental design process.
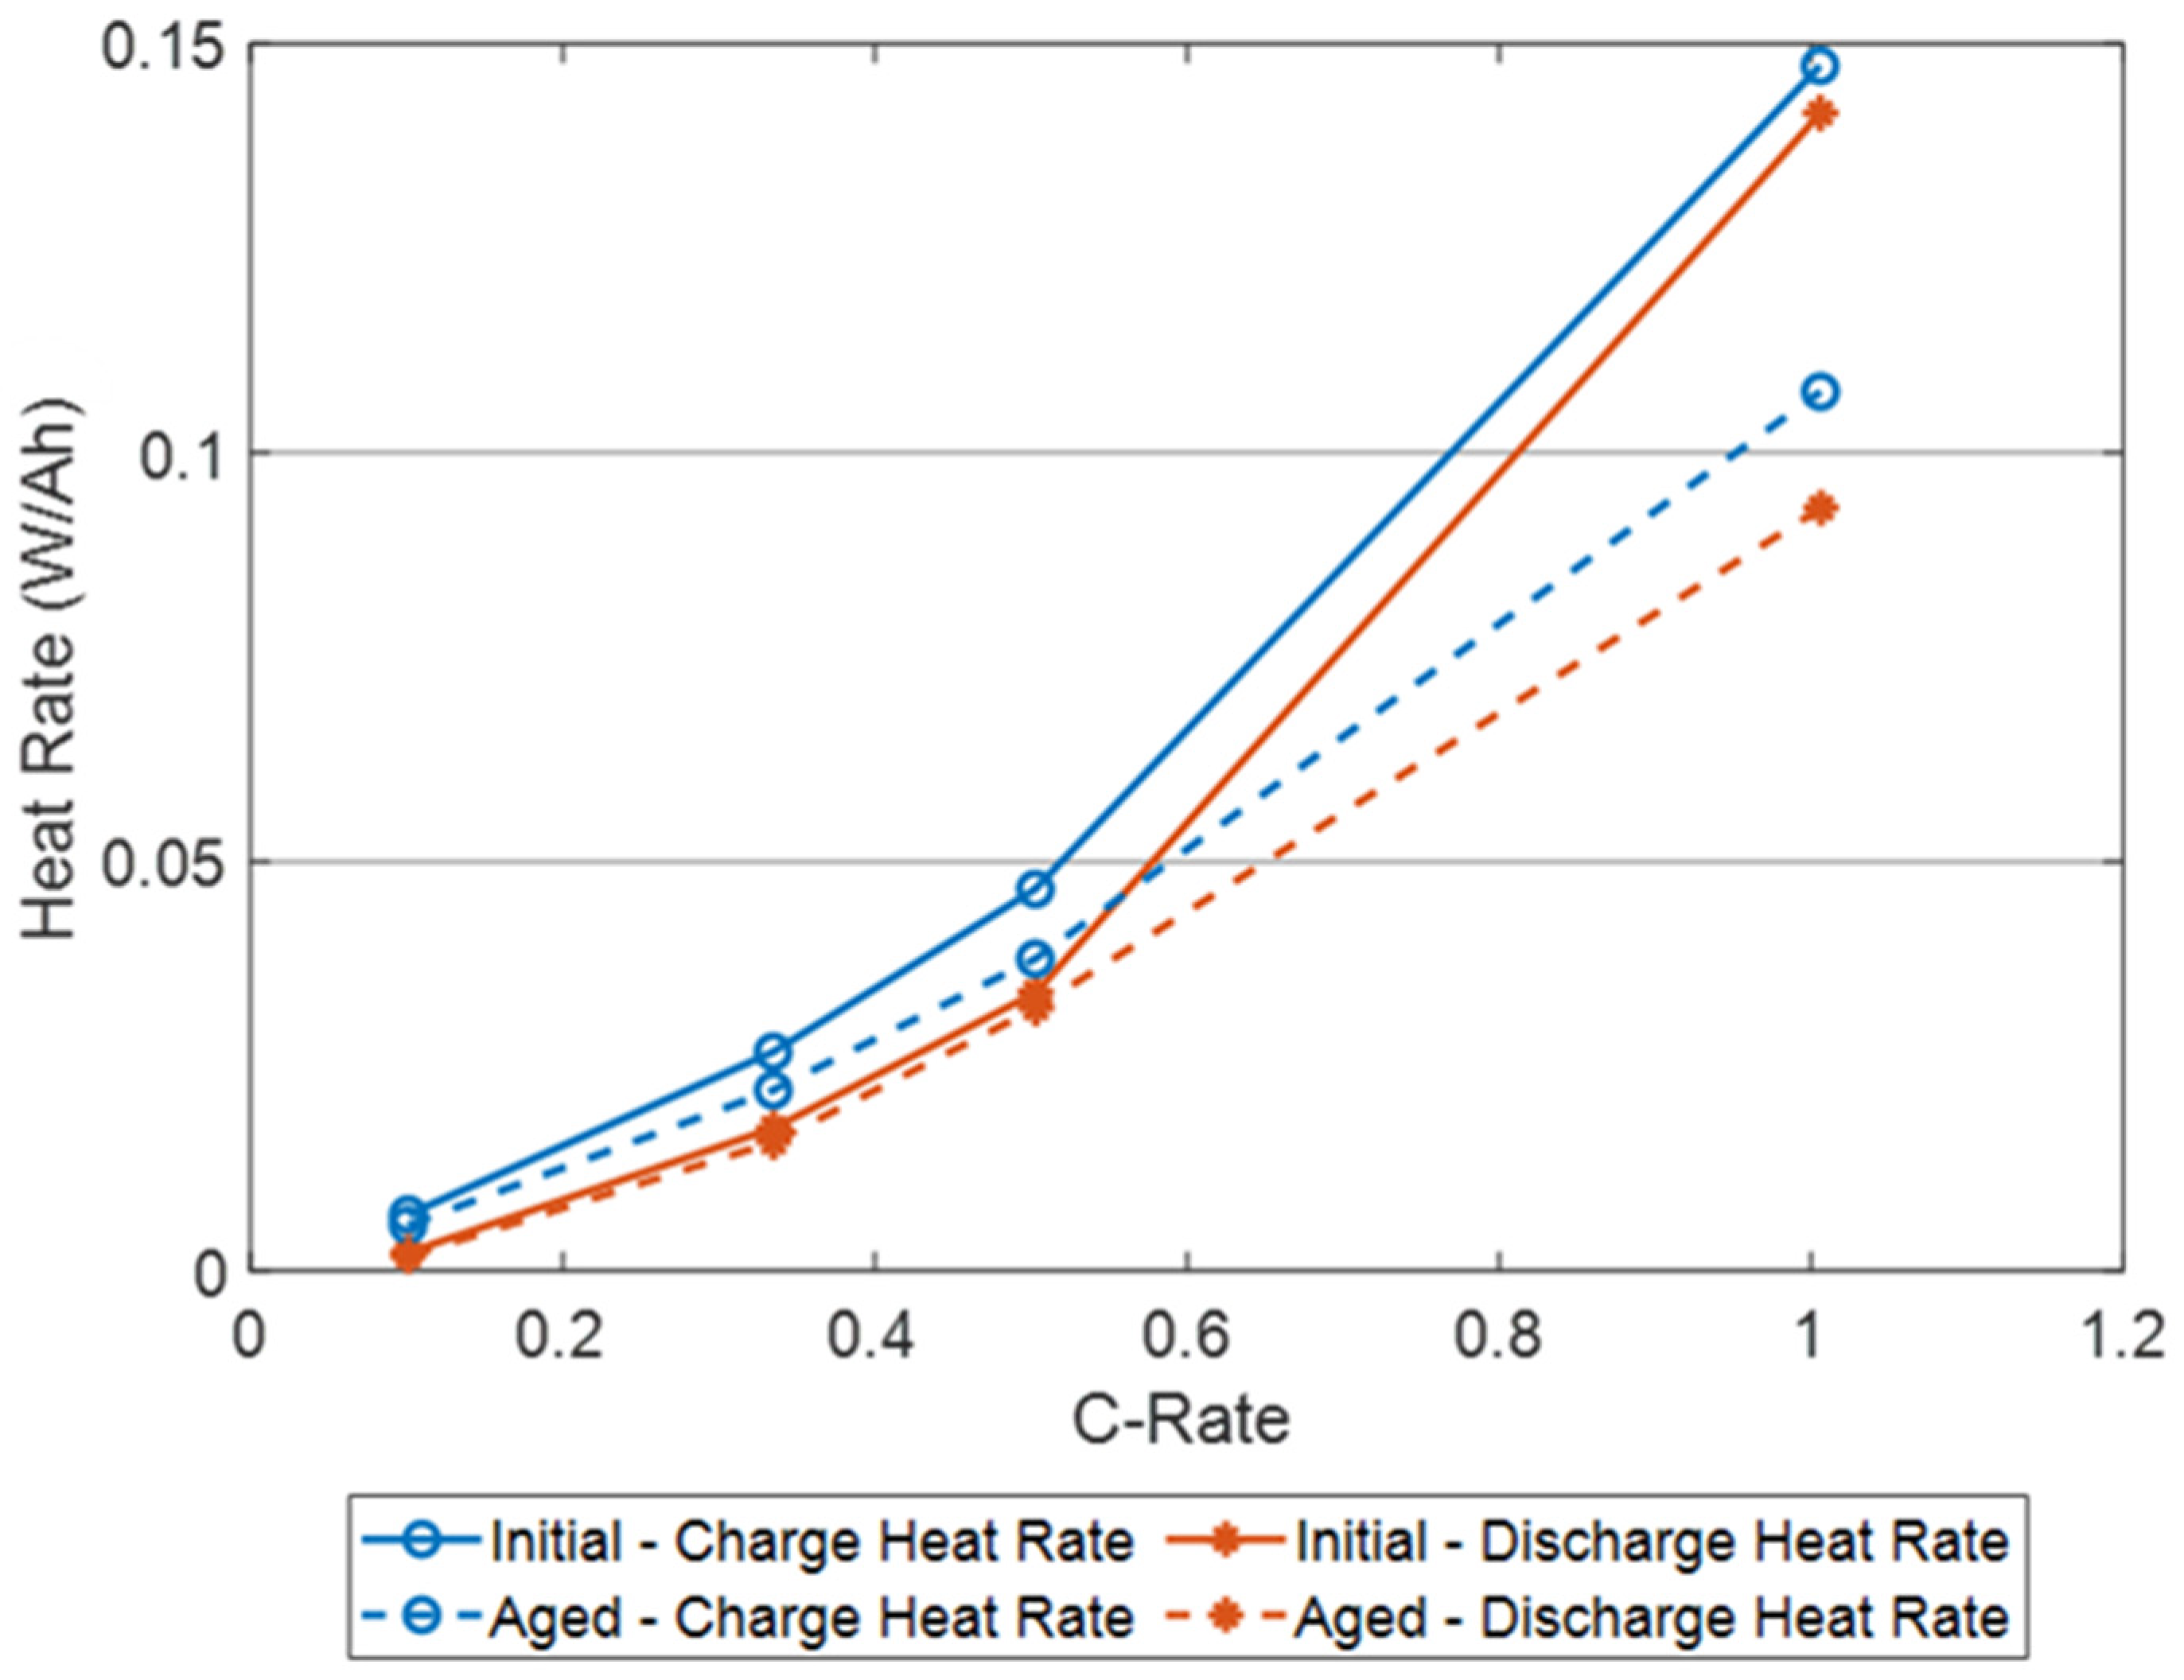
Figure 3 shows an increase in the heating rates with increasing current (i.e., C-rates) passing through 4.4 Ah cylindrical LFP/graphite cells with cutoff voltages of 3.6 V and 2.0 V. The cell samples underwent constant-current constant-voltage (CCCV) charging with a cutoff current of C/20. During discharge, the cell samples were discharged at specified C-rates with a cutoff voltage of 2.0 V. In this study, these measurements were repeated for 30 cycles after the first formation cycle. As noted, there was an increase in the slope of the heat-generation rate versus the charging rate (C-rate) past the C/2 currents for the initial cycle. This increase leveled off with cell cycling, indicating that the limitations were likely from surface limitations because of inactive electrode materials and limited electrolyte-wettability, rather than inherently poor conductivity in the bulk electrolyte at the higher currents. With formation aging, the surface impedances at the electrodes leveled off, resulting in lower heat generation rates. It is also worth noting that the difference between the heating rates during charge and discharge was slightly higher at the C/3 and C/2 rates for the initial cycle than at 1C. This indicates that the heat generation rate during the initial charge step helps to quantify limitations at the electrode surface.
3.4. Module and Full Pack Interconnect Design
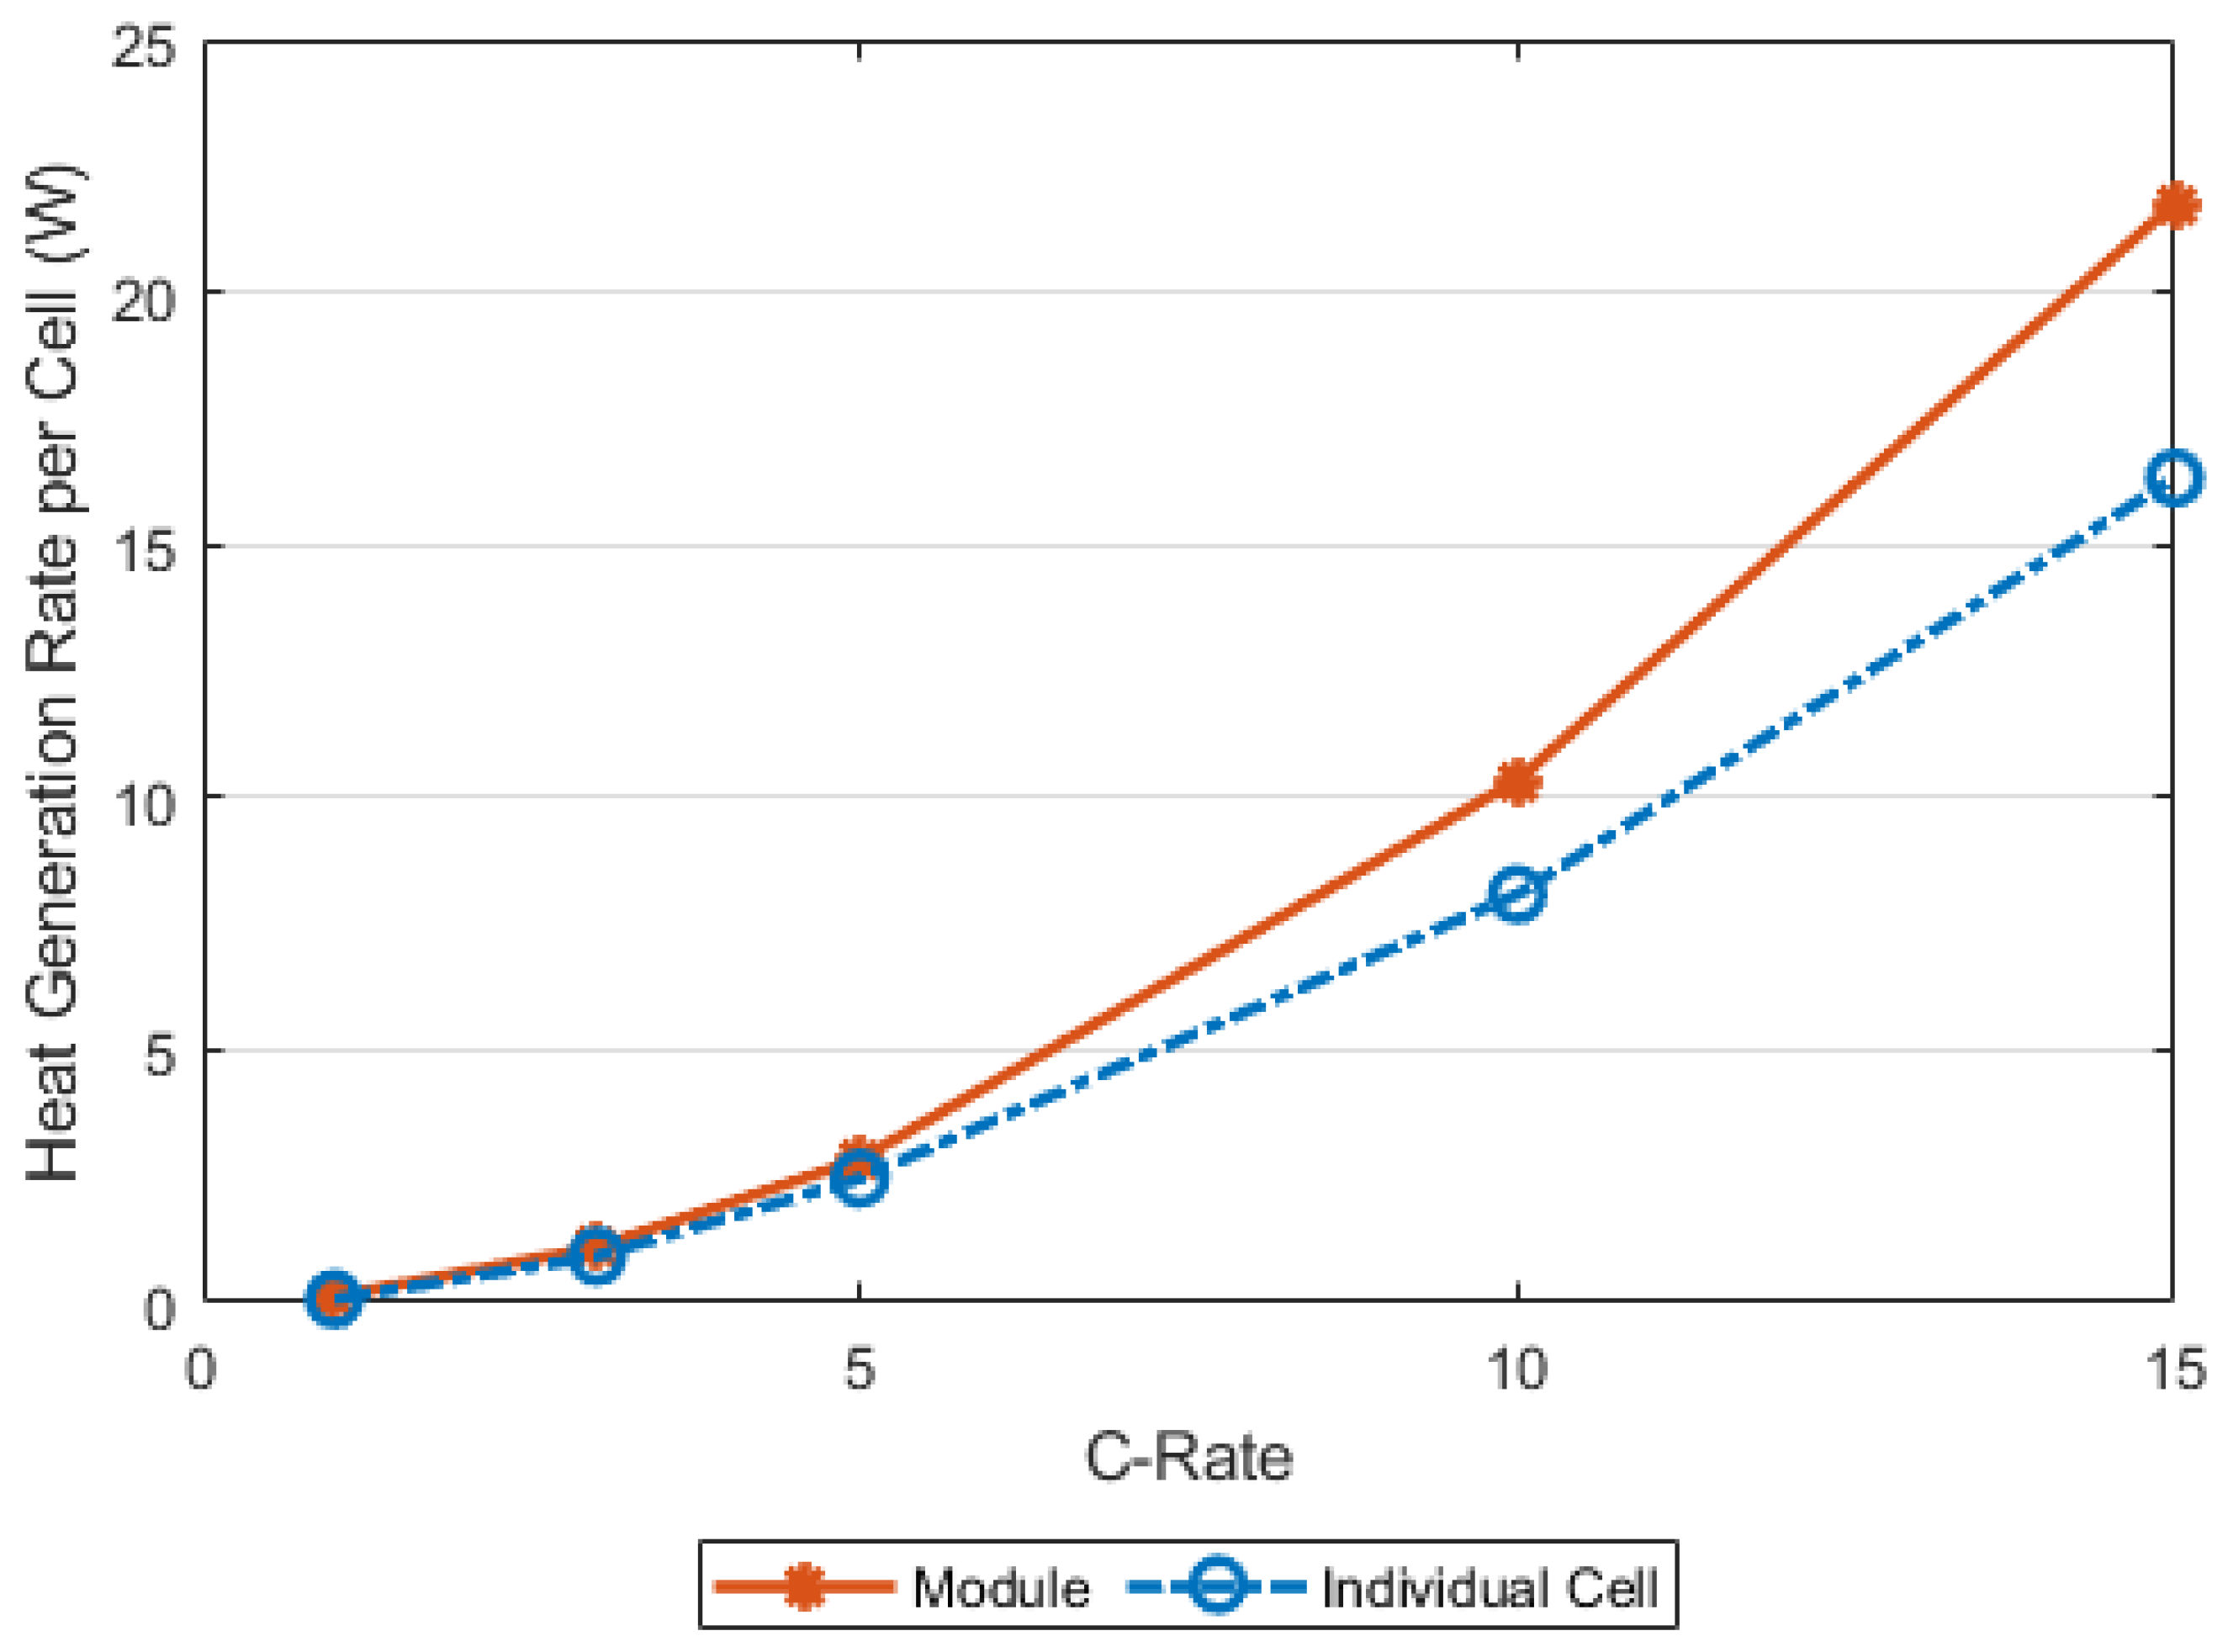
A previous experiment conducted in-house revealed the possibility of additional heating occurring when a cylindrical 4.5 Ah LFP/graphite cell was incorporated into a module compared to what was measured at the cell level. The module was designed for a hybrid electrical vehicle application, and the cell was intended for high-power applications. The power-to-energy ratio, defined as the maximum rated power over a known duration divided by the available energy in the battery, is greater than 10 [4]. Figure 4 compares the heat generation rates from the single LFP cell in a module, with heat generation rates normalized on a per-cell basis, to that of an identical but stand-alone cell at different discharge currents.
The increase in heat between the stand-alone cell and cells in the module is attributed to the module interconnects. The equivalent discharge current at the relevant hybrid electric vehicle application for this cell is approximately 8C. At this current rate, the module generates approximately 20% more heat per cell than the stand-alone cell. We can determine that this additional heating is a result of interconnects by applying Ohm’s law. In this case, the average interconnect resistance is approximately 0.25 Ω.
Accounting for the total heat source is critical when designing a BTMS. In this case, scaling the expected total heat based solely on each cell’s heat signature would result in a thermal management system unable to keep up with the heat generated, resulting in higher operating temperatures than designed and a decrease in expected life and possibly creating an unsafe thermal runaway condition if subjected to prolonged use.
3.5. Temperature Variation within a Battery Pack
System design must also account for possible temperature variation within the pack and ensure that the heat generated is effectively removed. A 5 kWh pack designed for a plug-in hybrid electrical vehicle with an expected 10-mile range (PHEV-10) utilizing a novel thermal management system serves as a case study to illustrate this point. The pack was made of approximately 100 pouch cells, each with a capacity of 15 Ah. An active cooling system was implemented, consisting of a vapor compression system with a cold plate positioned under an array of the pouch cells. The cells were arranged horizontally with the long edge of each cell positioned directly against the cold plate. The cells were in contact on both sides with other cells. The pack was instrumented with thermocouples to collect the temperature of each cell at three points: the furthest from the cold plate, the closest to the cold plate, and halfway between the other two measurements. The pack underwent an experimental procedure consisting of a preliminary heat soak, where the pack was held in an ambient temperature of 40 °C until thermal equilibrium was achieved. Then, the pack was subjected to a PHEV-10 charge-depleting power profile while the cooling system was switched on.
Figure 5 shows the temperature response to the drive cycle. Under these conditions, the maximum cell temperature rises to approximately 55 °C while the minimum temperature of the cells is driven below the ambient temperature. This variation between cell minimum and maximum temperature results in a temperature spread as high as 12 °C at times. The highest temperature of the cell was found at the top portion farthest away from the cooling plate, and the coldest at the bottom, adjacent to the cooling plate. The heat was removed more rapidly from the bottom of the cell than it could flow internally from the hotter portion at the top. This is because the heat was dissipated to the cold plate from the bottom of the cells. Consequently, temperature gradients naturally developed within the cell.
This temperature variation likely causes the top portions of the cells to not only age faster from the elevated temperature, but also experience an elevated power demand to compensate for the performance lost by the cooler region of the cells. To quantify this claim of increased aging, Smith et al. [21] presented data that showed that moving from aging a cell (NMC/graphite) at 45 °C compared to aging at 55 °C results in 7% more capacity loss after 300 days.
3.6. Battery Thermal Management System Design
Computer-aided engineering tools for battery modeling have become robust tools for BTMS design. Over the last decade, battery modeling efficiency has been significantly enhanced with multi-scale multi-domain modeling approaches [11], which have been implemented in a few commercial software [22]. However, physics-based battery simulations, such as pseudo two-dimensional models [23], remain time-consuming. Alternatively, semi-empirical or empirical models have demonstrated the effectiveness in BTMS designs. Examples include the NTGK model [24] and resistor-capacitor (RC) equivalent circuit models (ECMs) [25].
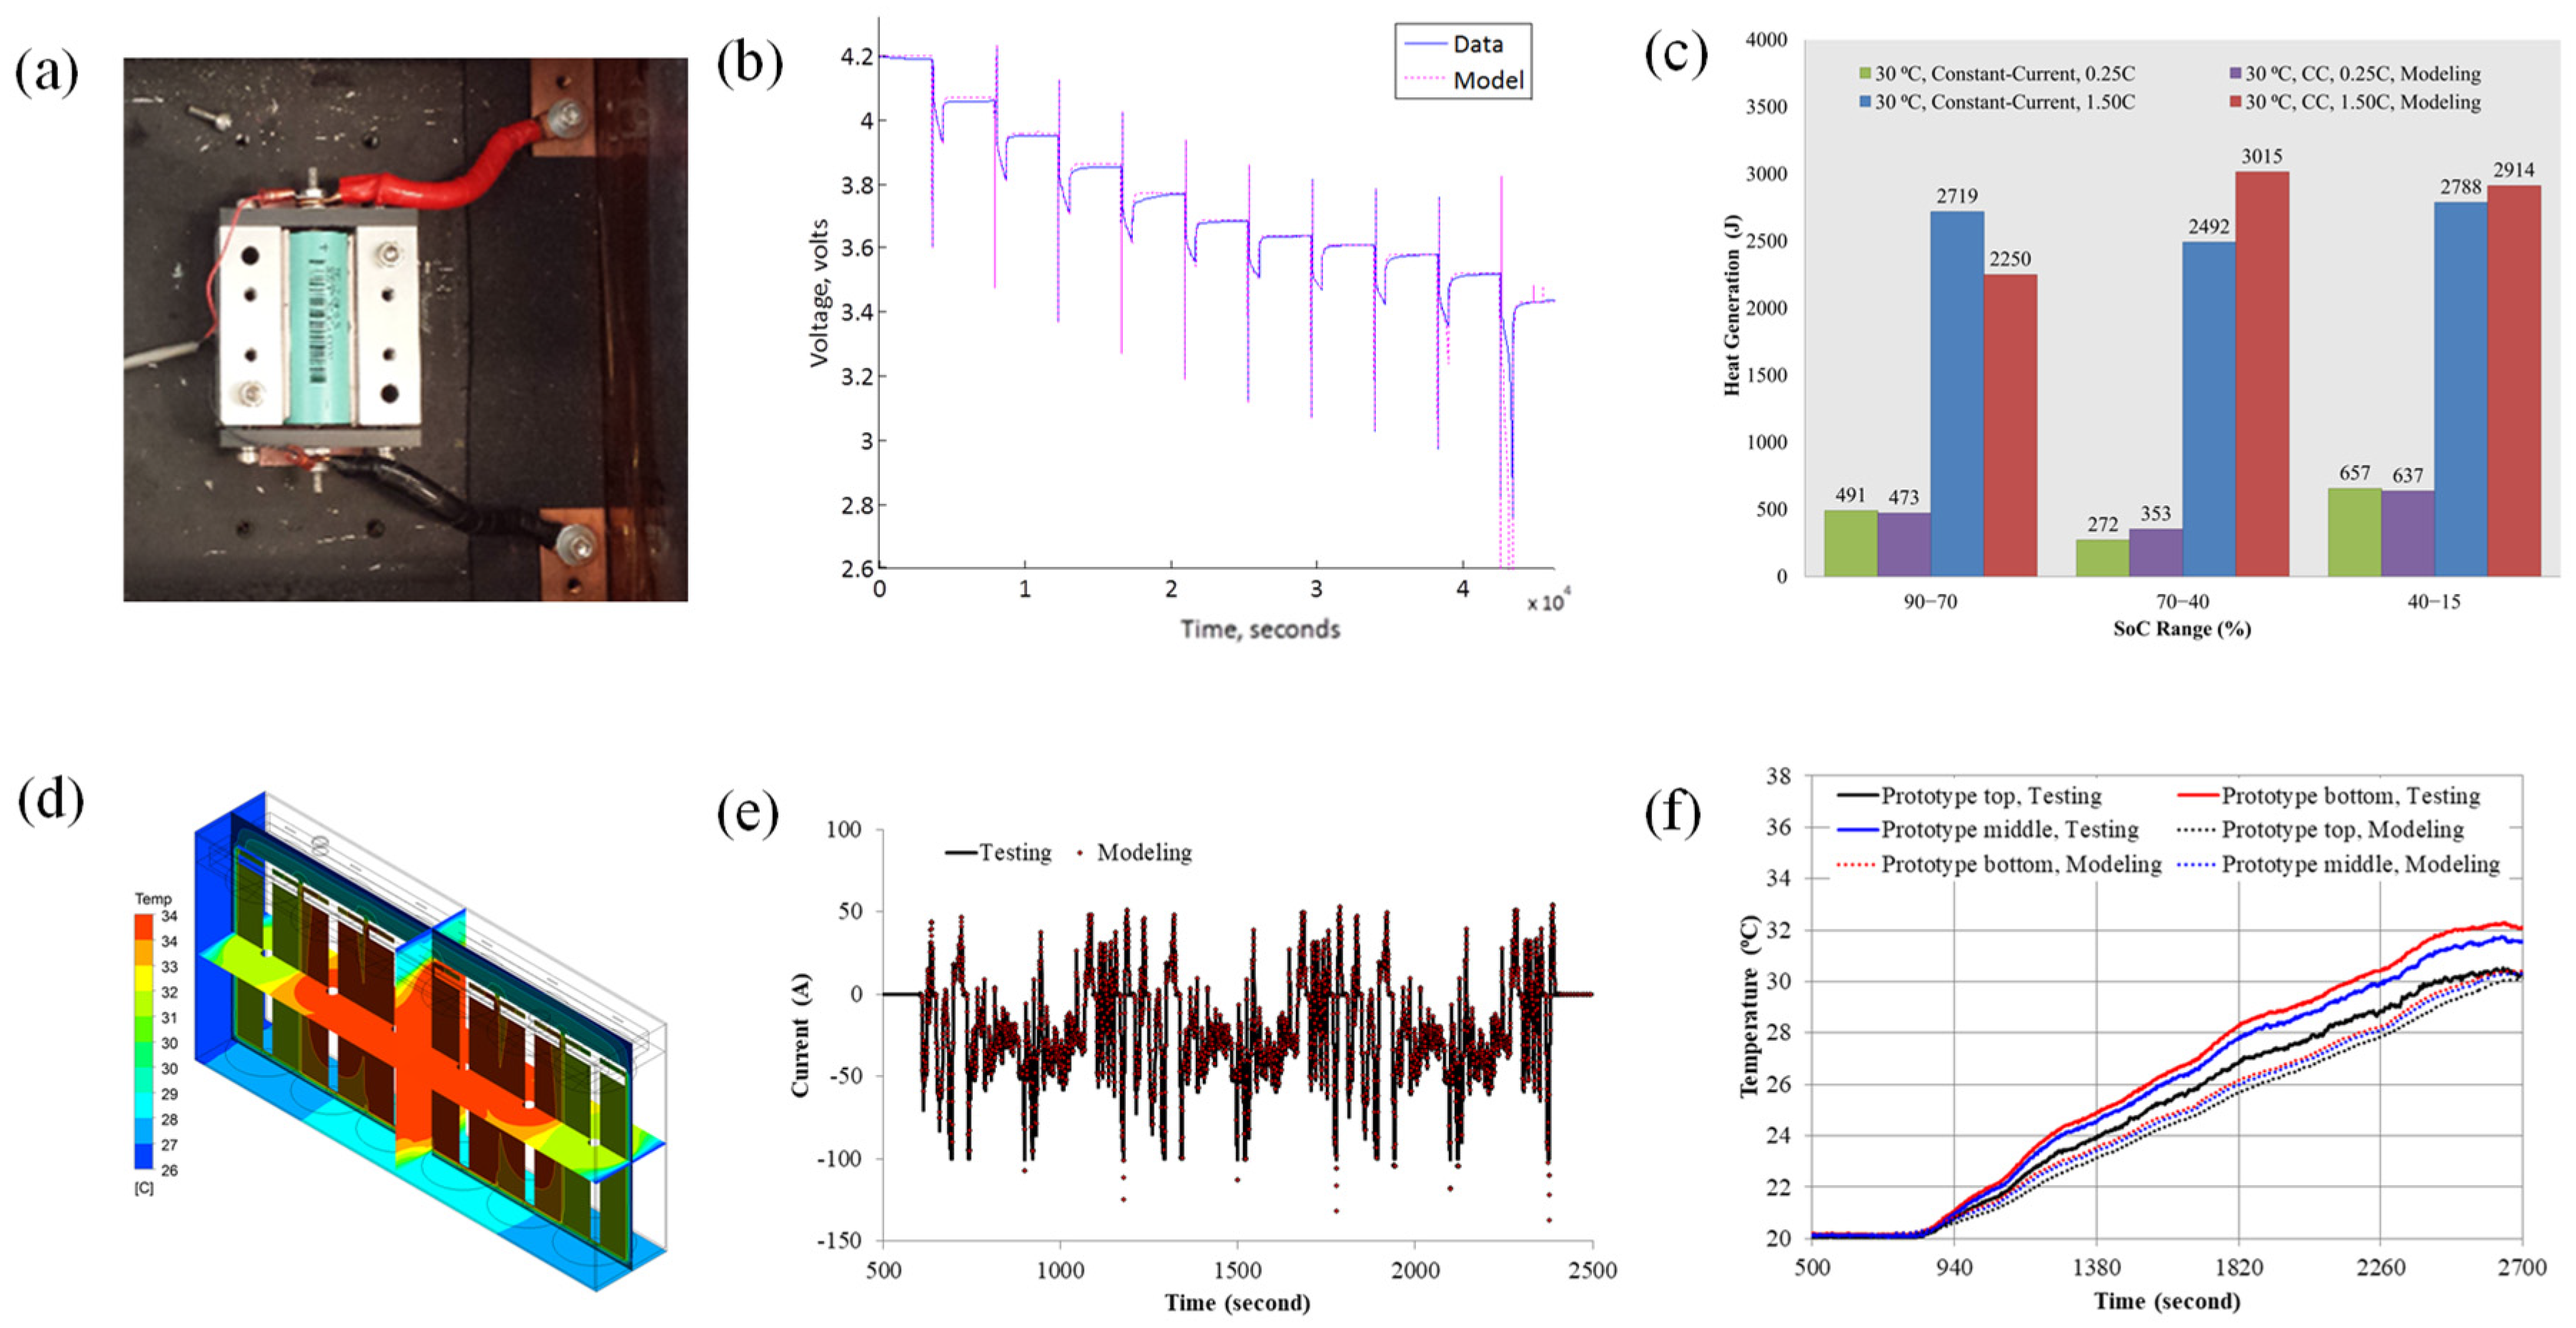
Figure 6 illustrates a bottom–up approach for evaluating a novel battery packaging design considering efficient thermal management performance. This approach combines battery cell characterization testing and 3D battery modeling employing a second-order RC (2RC) ECM. First, an isothermal calorimeter is used to characterize a 5 Ah 26700 NMC battery cell, measuring its electrical behavior and associated heat generated under varying loads and temperatures. These data are used to develop the 2RC ECM and validate its predictive capability for real-world scenarios. Figure 6b,c illustrate the model accuracy achieved after both electrical and thermal validation.
Once validated, the cell-level model is upscaled for 3D simulations of a battery prototype composed of six individual cells and a battery housing. Under the US06 driving cycle power loading, the prototype’s current response predicted using the model is nearly identical with the experimental measurement, as shown in Figure 6e. Additionally, the simulated spatial temperature distribution on the prototype surface closely matches that measured using the thermocouple during US06 cycling. Figure 6f shows that the maximum discrepancy is less than 2.5 °C, indicating that heat transfer pathways from the cells to prototype ambient through the housing components are accurately presented.
As shown in Figure 6d, the simulation quantified the temperature difference between the center cells and corner cells, which is an essential input for temperature gradient control. The results suggest the design load needs to be limited or the heat dissipation performance in the axial direction of jelly rolls should be enhanced using the BTMS.
4. Conclusions
Precise heat signature measurement within batteries has vast implications for BTMS designs, which profoundly shapes battery pack performance, longevity, and safety. The thermal performance of battery cells is influenced by an intricate interplay of variables, including cell chemistry, cell design, and operational parameters such as the C-rate and temperature range. This paper introduces a calorimetry characterization methodology aimed at dissecting the various components contributing to heat generation. It leverages isothermal battery calorimeters to capture heat signatures across various operating conditions.
The calorimetry characterizations have revealed several key factors affecting heat generation within a battery pack:
- C-rate: the heat generated by a Li-ion cell increases as the cell’s C-rate increases. Especially at high C-rates, the heat is proportional to the square of the C-rates.
- Temperature: Temperature also plays a significant role, affecting energy efficiency due to changes in cell resistance. Notably, the discharged capacity could be increased at subzero temperatures at higher discharge C-rates. This is because of substantial self-heating at higher C-rates.
- Cycling: The calorimetry measurement captured the reduction of heat generation rates during formation and subsequent aging cycles. This reduction is attributed to the formation of solid electrolyte interphase (SEI) layers, which can enhance cell performance, particularly at higher C-rates.
- Module interconnects: This study underscores the importance of considering the heat contribution from interconnects when designing BTMSs. Interconnects can considerably increase heat generation, as demonstrated in the case of a LiFePO4 (LFP) module for a hybrid electric vehicle, where interconnects led to approximately 20% more heat per cell compared to standalone cells at application current rates of around 8C. Measuring heat signatures from single cells and comparing them against the heat signatures in modules or packs provides information on the engineering limitations associated with how the cells are packaged.
BTMSs serve multiple roles, not only managing heat generated to control cell temperatures but also minimizing temperature variations within battery packs. The presence of significant temperature heterogeneities can exert detrimental effects on battery performance and longevity. With single-sided cooling, up to a 12 °C temperature difference could be generated within a real 5 kWh battery pack designed for a plug-in hybrid electric vehicle.
The optimization of cooling strategies can be effectively addressed using a bottom–up approach, which integrates battery thermal characterization and cutting-edge battery computer-aided engineering tools. As exemplified in the presented case study, the approach provided accurate predictions of thermal performance in a battery module prototype.
Author Contributions
Conceptualization, A.S. and S.S.; methodology, M.K. and A.S.; software, C.Y.; validation, A.S. and C.Y.; formal analysis, A.S. and C.Y.; investigation, A.S., C.Y. and M.K.; resources, A.S.; data curation, A.S. and M.K.; writing—original draft preparation, A.S. and C.Y.; writing—review and editing, C.Y., A.C. and S.S.; visualization, A.S., M.K., and C.Y.; supervision, M.K.; project administration, M.K.; funding acquisition, M.K. All authors have read and agreed to the published version of the manuscript.
Funding
This work was supported by U.S. DOE EERE Vehicle Technologies Office under Contract No. DE-AC36-08GO28308.
Data Availability Statement
Data are contained within the article.
Acknowledgments
This work was authored by the National Renewable Energy Laboratory(Golden, CO, USA), operated by Alliance for Sustainable Energy, LLC, for the U.S. Department of Energy (DOE) under Contract No. DE-AC36-08GO28308. Funding provided by U.S. Department of Energy Office of Energy Efficiency and Renewable Energy Vehicle Technologies Office. The authors acknowledge Brian Cunningham, Samuel Gillard, and Haiyan Croft from the U.S. DOE for their support in this research. The views expressed herein do not necessarily represent the views of the DOE or the U.S. Government. The U.S. Government retains and the publisher, by accepting the article for publication, acknowledges that the U.S. Government retains a nonexclusive, paid-up, irrevocable, worldwide license to publish or reproduce the published form of this work, or allow others to do so, for U.S. Government purposes.
Conflicts of Interest
The authors declare no conflict of interest.
References
- Gnann, T.; Funke, S.; Jakobsson, N.; Plötz, P.; Sprei, F.; Bennehag, A. Fast charging infrastructure for electric vehicles: Today’s situation and future needs. Transp. Res. Part D Transp. Environ. 2018, 62, 314–329. [Google Scholar] [CrossRef]
- Liu, Y.; Zhu, Y.; Cui, Y. Challenges and opportunities towards fast-charging battery materials. Nat. Energy 2019, 4, 540–550. [Google Scholar] [CrossRef]
- Zeng, Y.; Chalise, D.; Lubner, S.D.; Kaur, S.; Prasher, R.S. A review of thermal physics and management inside lithium-ion batteries for high energy density and fast charging. Energy Storage Mater. 2021, 41, 264–288. [Google Scholar] [CrossRef]
- United States Advanced Battery Consortium. USABC Li-Ion Battery Thermal Management System Requirements. Available online: http://uscar.org/download/246/energy-storage-system-goals/12843/thermal-management-system-goals.pdf (accessed on 6 October 2021).
- Keyser, M.; Pesaran, A.; Li, Q.; Santhanagopalan, S.; Smith, K.; Wood, E.; Ahmed, S.; Bloom, I.; Dufek, E.; Shirk, M.; et al. Enabling fast charging–Battery thermal considerations. J. Power Sources 2017, 367, 228–236. [Google Scholar] [CrossRef]
- Tian, X.; Guo, R.; Bai, Y.; Li, N.; Wang, X.; Wang, J.; Wu, C. High-Performance High-Nickel Multi-Element Cathode Materials for Lithium-Ion Batteries. Batteries 2023, 9, 319. [Google Scholar] [CrossRef]
- Deng, D. Li-ion batteries: Basics, progress, and challenges. Energy Sci. Eng. 2015, 3, 385–418. [Google Scholar] [CrossRef]
- Eshetu, G.G.; Zhang, H.; Judez, X.; Adenusi, H.; Armand, M.; Passerini, S.; Figgemeier, E. Production of high-energy Li-ion batteries comprising silicon-containing anodes and insertion-type cathodes. Nat. Commun. 2021, 12, 5459. [Google Scholar] [CrossRef]
- Pesaran, A.; Keyser, M.; Burch, S. An Approach for Designing Thermal Management Systems for Electric and Hybrid Vehicle Battery Packs. In Proceedings of the 4th Vehicle Thermal Management Systems, London, UK, 24–27 May 1999. [Google Scholar]
- Keyser, M.; Smith, K. Battery Thermal Modeling and Testing. NREL/PR-5400-50916, Arlington, Virginia. 2011. Available online: https://www.nrel.gov/docs/fy11osti/50916.pdf (accessed on 1 March 2024).
- Kim, G.-H.; Smith, K.; Lawrence-Simon, J.; Yang, C. Efficient and Extensible Quasi-Explicit Modular Nonlinear Multiscale Battery Model: GH-MSMD. J. Electrochem. Soc. 2017, 164, A1076–A1088. [Google Scholar] [CrossRef]
- Panchal, S.; Dincer, I.; Agelin-Chaab, A.; Fraser, R.; Fowler, M. Transient electrochemical heat transfer modeling and experimental validation of a large sized LiFePO4/graphite battery. Int. J. Heat Mass Transf. 2017, 109, 1239–1251. [Google Scholar] [CrossRef]
- Kim, U.S.; Shin, C.B.; Kim, C.-S. Effect of electrode configuration on the thermal behavior of a lithium-polymer battery. J. Power Sources 2008, 180, 909–916. [Google Scholar] [CrossRef]
- Bernardi, D.; Pawlikowski, E.; Newman, J. A General Energy Balance for Battery Systems. J. Electrochem. Soc. 1985, 132, 5–12. [Google Scholar] [CrossRef]
- Bandhauer, T.M.; Garimella, S.; Fuller, T.F. A Critical Review of Thermal Issues in Lithium-Ion Batteries. J. Electrochem. Soc. 2011, 158, R1. [Google Scholar] [CrossRef]
- Gu, W.B.; Wang, C.Y. Thermal-Electrochemical Modeling of Battery Systems. J. Electrochem. Soc. 2000, 147, 2910–2922. [Google Scholar] [CrossRef]
- Srinivasan, V.; Yang, C.Y. Analysis of Electrochemical and Thermal Behavior of Li-Ion Cells. J. Electrochem. Soc. 2003, 150, A98. [Google Scholar] [CrossRef]
- Quinn, J.B.; Waldmann, T.; Richter, K.; Kasper, M.; Wohlfahrt-Mehrens, M. Energy Density of Cyclindrical Li-Ion Cells: A Comparison of Commercial 18650 to the 21700 Cells. J. Electrochem. Soc. 2018, 165, A3284–A3291. [Google Scholar] [CrossRef]
- Santhanagopalan, S.; Keyser, M.; Saxon, A.; Ireland, J. Methods and Devices for Electrochemical System Analysis. U.S. Patent 10,107,696, 23 October 2018. [Google Scholar]
- Shen, W.; Wang, N.; Zhang, J.; Wang, F.; Zhang, G. Heat Generation and Degradation Mechanism of Lithium-Ion Batteries during High-Temperature Aging. ACS Omega 2022, 7, 44733–44742. [Google Scholar] [CrossRef]
- Smith, K.; Saxon, A.; Keyser, M.; Lundstrom, B.; Cao, Z.; Roc, A. Life prediction model for grid-connected Li-ion battery energy storage system. In Proceedings of the 2017 American Controls Conference (ACC), Seattle, WA, USA, 24–26 May 2017; pp. 4062–4068. [Google Scholar]
- Ansys, Inc. Ansys Fluent Theory Guide; Release 2021R2; Ansys, Inc.: Canonsburg, PA, USA, July 2021. [Google Scholar]
- Doyle, M.; Fuller, T.F.; Newman, J. Modeling of Galvanostatic Charge and Discharge of the Lithium/Polymer/Insertion Cell. J. Electrochem. Soc. 1993, 140, 1526–1533. [Google Scholar] [CrossRef]
- Kim, U.S.; Yi, J.; Shin, C.B.; Han, T.; Park, S. Modeling the Dependence of the Discharge Behavior of a Lithium-Ion Battery on the Environmental Temperature. J. Electrochem. Soc. 2011, 158, A611. [Google Scholar] [CrossRef]
- Wang, Q.; Jiang, B.; Li, B.; Yan, Y. A critical review of thermal management models and solutions of lithium-ion batteries for the development of pure electric vehicles. Renew. Sustain. Energy Rev. 2016, 64, 106–128. [Google Scholar] [CrossRef]
Figure 1.
Illustration of battery thermal characterization using isothermal battery calorimeters at National Renewable Energy Laboratory. The battery in the test chamber of the isothermal battery calorimeter (bottom). In the graph (right), the red curve shows electrical power input to the battery, and the green curve shows the measured heat signature.

Figure 2.
(a) Graph illustrating how heat generation changes with both temperature and discharge rate. (b) Graph demonstrating the decrease in available electrical energy as the cycle temperature decreases from 30 °C to 0 °C to −15 °C.
Figure 2.
(a) Graph illustrating how heat generation changes with both temperature and discharge rate. (b) Graph demonstrating the decrease in available electrical energy as the cycle temperature decreases from 30 °C to 0 °C to −15 °C.

Figure 3.
Illustration of heat generation decreasing after formation cycling of a cylindrical LFP/graphite cell. In some cases, the cell efficiency can increase (i.e., lower heat generation rate) following a break-in period. In this cell, the 1C heat rate decreases from approximately 0.15 to 0.1 W/Ah following the break-in period.

Figure 4.
Heat generation from a single lithium-iron-phosphate cell within a module compared on a per-cell basis to an identical cell in a stand-alone configuration at different discharge currents. The increase in heat between the individual cell and the module is attributed to joule heating of the module interconnects. In this case, the average interconnect resistance is approximately 0.25 Ω.

Figure 5.
The temperature response of a PHEV-10 battery pack to a specific drive cycle was evaluated at an initial temperature of 40 °C. Under these conditions, the maximum cell temperature rises to around 55 °C, while the minimum temperature of the cells is driven below the ambient temperature of 40 °C. Specifically, the highest temperature is measured at the top portion farthest away from the cooling plate, while the coldest temperature is observed at the bottom, adjacent to the cooling plate.

Figure 6.
A bottom–up approach combining cell characterization and 3D modeling for BTMS design: (a) a cell under calorimeter testing; (b) validation of model electrical performance; (c) validation of model heat generation prediction; (d) temperature distribution within the protype calculated using the 3D model; (e) comparison of current response between testing and modeling; and (f) discrepancies in prototype surface temperatures between testing and modeling.

Disclaimer/Publisher’s Note: The statements, opinions and data contained in all publications are solely those of the individual author(s) and contributor(s) and not of MDPI and/or the editor(s). MDPI and/or the editor(s) disclaim responsibility for any injury to people or property resulting from any ideas, methods, instructions or products referred to in the content. |
© 2024 by the authors. Licensee MDPI, Basel, Switzerland. This article is an open access article distributed under the terms and conditions of the Creative Commons Attribution (CC BY) license (https://creativecommons.org/licenses/by/4.0/).
Share and Cite
MDPI and ACS Style
Saxon, A.; Yang, C.; Santhanagopalan, S.; Keyser, M.; Colclasure, A. Li-Ion Battery Thermal Characterization for Thermal Management Design. Batteries 2024, 10, 136. https://doi.org/10.3390/batteries10040136
AMA Style
Saxon A, Yang C, Santhanagopalan S, Keyser M, Colclasure A. Li-Ion Battery Thermal Characterization for Thermal Management Design. Batteries. 2024; 10(4):136. https://doi.org/10.3390/batteries10040136
Chicago/Turabian StyleSaxon, Aron, Chuanbo Yang, Shriram Santhanagopalan, Matthew Keyser, and Andrew Colclasure. 2024. "Li-Ion Battery Thermal Characterization for Thermal Management Design" Batteries 10, no. 4: 136. https://doi.org/10.3390/batteries10040136
Note that from the first issue of 2016, this journal uses article numbers instead of page numbers. See further details here.