
A Novel Feature Engineering-Based SOH Estimation Method for Lithium-Ion Battery with Downgraded Laboratory Data


1
National Active Distribution Network Technology Research Center (NANTEC), Beijing Jiaotong University, Beijing 100044, China
2
Corporate Public Affairs Department, Contemporary Amperex Technology Co., Ltd., Ningde 352100, China
*
Author to whom correspondence should be addressed.
Batteries 2024, 10(4), 139; https://doi.org/10.3390/batteries10040139
Submission received: 13 March 2024
/
Revised: 15 April 2024
/
Accepted: 16 April 2024
/
Published: 19 April 2024
(This article belongs to the Section Battery Modelling, Simulation, Management and Application)
Abstract
:Accurate estimation of lithium-ion battery state of health (SOH) can effectively improve the operational safety of electric vehicles and optimize the battery operation strategy. However, previous SOH estimation algorithms developed based on high-precision laboratory data have ignored the discrepancies between field and laboratory data, leading to difficulties in field application. Therefore, aiming to bridge the gap between the lab-developed models and the field operational data, this paper presents a feature engineering-based SOH estimation method with downgraded laboratory battery data, applicable to real vehicles under different operating conditions. Firstly, a data processing pipeline is proposed to downgrade laboratory data to operational fleet-level data. The six key features are extracted on the partial ranges to capture the battery’s aging state. Finally, three machine learning (ML) algorithms for easy online deployment are employed for SOH assessment. The results show that the hybrid feature set performs well and has high accuracy in SOH estimation for downgraded data, with a minimum root mean square error (RMSE) of 0.36%. Only three mechanism features derived from the incremental capacity curve can still provide a proper assessment, with a minimum RMSE of 0.44%. Voltage-based features can assist in evaluating battery state, improving accuracy by up to 20%.
1. Introduction
With the climate crisis and environmental pollution on the rise, electric vehicles with low-carbon emissions and the utilization of renewable energy have become the solution for traditional fuel vehicles [1,2]. Lithium-ion batteries are widely adopted due to their high energy density, long cycle life, etc. [3,4]. As the core components delivering energy to electric vehicles, their performance determines the capabilities and driving range of the vehicle. As the mileage increases, the number of charging and discharging cycles gradually increases. Meanwhile, the repeated electrochemical reactions within the battery will cause irreversible loss of materials [5]. Then, the battery will experience performance degradation, which is significantly characterized by a decrease in the maximum available capacity [6]. The state of health (SOH) of a battery is generally defined as the ratio of the maximum available capacity in the current state to that of fresh batteries because capacity can represent the maximum ability of a battery to discharge power [7]. Therefore, accurate estimation of battery state is important to improve the safety and stability of battery operation.
The existing SOH estimation methods can be broadly categorized into three types: the experimental-based, the model-based, and the data-driven methods [8,9,10]. The experimental measurement method requires specific tests (full charge/discharge/specific pulses) on the battery to obtain the battery capacity/internal resistance, which is universal to different types of batteries [11]. However, it requires high-precision test equipment and is poorly maneuverable, as it can only be performed under laboratory conditions [12].
The electrochemical model and equivalent circuit model are commonly adopted battery models in model-based methods. Equivalent circuit models are often combined with optimization algorithms such as the least squares method and Kalman filtering to calculate model parameters and hence obtain the current battery capacity [13,14]. For example, Paris Ali Topan et al. [15] used the Thevenin battery model to describe the polarization characteristics and dynamic behavior of the battery and used the Kalman filter (KF) for parameter estimation. The estimated parameters can be used to predict the SOH with an error of more than 5%. Hu et al. [16] determined the dependence of the parameters of the first-order equivalent circuit model on the SOC, and then carried out the estimation of the internal resistance using extended Kalman filters with different time scales to monitor the SOH. On the other hand, electrochemical modeling simulates the internal chemical changes in a battery during charging and discharging [17]. Some research has established a mapping relationship between the electrochemical reaction rate constants and material concentrations and the battery SOH to realize the state estimation [18]. For example, Q. Zhang et al. [19] developed an electrochemical–thermal model that considers the double electric layer model. Sensitivity analysis of electrochemical processes during battery aging was performed based on electrochemical impedance spectroscopy and relaxation time method distribution. Finally, some key parameters (maximum solid-phase concentration of positive and negative electrodes) with high health correlation were selected to estimate battery state. Furong Gao et al. [20] proposed a joint estimation method of SOC and SOH based on a pseudo-two-dimensional (P2D) model. After the standard P2D model was simplified and reformulated into a nonlinear state-space form with observability, a particle filter (PF) algorithm was applied to predict the average lithium concentration at the cut-off voltages of charging and discharging for estimating the battery SOH. Although the model-based estimate provides some interpretability, it is generally more complex, is more computational, and has high-data-quality requirements, making it difficult to apply on real operational data.
The data-driven method uncovers the degradation behavior of battery performance from historical data and employs specific machine learning (ML) algorithms to predict the battery health state. Critical components of the approach include feature extraction, which is highly correlated with capacity, and the development of ML models. The incremental capacity (IC) curve and differential voltage (DV) curve are widely employed as a tool to analyze the aging mechanism of batteries, which are also applied to extract the aging features, such as the peak position, peak height, and peak area [21,22,23,24,25,26]. For example, Caihao Weng et al. [27] identified peak heights correlated with battery aging behavior based on incremental capacity analysis (ICA) by analyzing the battery aging-cycle data. Then, an SOH estimation algorithm was developed. Taedong Goh et al. [28] obtained reference voltage curves of the constant current charging stage from fresh batteries and measured the input voltage curves of aged batteries under the same operating conditions for comparison. By aligning the input voltage curve with the reference curve, the peak position of the DV curve can be used to estimate the battery capacity. However, the IC curve generally requires constant current (CC) charging and discharging at a low current. Furthermore, other researchers have focused on digging out features from voltage ans temperature data measured during battery charging and discharging, such as charging time/capacity in a fixed voltage interval or the amount of voltage/capacity change in a fixed period time [29,30,31]. Jianfang Jia et al. [32] extracted the time of the CC phase from the voltage profile as a health factor to capture the battery capacity degradation process response. Laifa Tao [33] extracted geometrical features from the current and voltage profiles, mainly slopes, which were shown to be more sensitive to the performance degradation of lithium-ion batteries and are used to estimate the battery SOH. After capturing the features that provide battery aging information, ML algorithms such as Gaussian Process Regression (GPR) [32,34], Artificial Neural Networks (ANNs) [35,36], and Support Vector Regression (SVR) [37,38] are deployed to establish the mapping relationship. The data-driven method is adaptable and does not require excessive analysis of the complex electrochemical reactions, but only requires the data from the battery operation for the estimation of the aging state. However, most of the existing studies rely on high-precision data from lab tests. It is doubted whether the lab-developed SOH estimation pipeline is effective when oriented to real-world data with large charge/discharge currents and low sampling accuracy and frequency.
This paper focuses on the research gap between laboratory data-based SOH estimation models and real-world fleet data and is dedicated to developing SOH evaluation algorithms for deployment in the field. This involves laboratory data being downgraded to fleet-data quality, and then, SOH estimation models are developed for real-like vehicle data under various operating conditions to fill the gap between laboratory data and operational data. The main contributions of this paper are as follows:
- (1)
- A data processing pipeline for downgrading laboratory data to real-vehicle data is proposed, where data are reduced for sampling accuracy, sampling frequency, and data integrity. The process guarantees the transferability of the developed algorithms to the field data.
- (2)
- Six features highly correlated with capacity are extracted based on IC curves and voltage curves. Even with low-quality post-downgraded data, the mechanistic features from IC curves can still capture battery aging better, while the voltage information can assist in the aging assessment.
- (3)
- The developed SOH evaluation is applicable to field data, is not sensitive to battery type, and does not depend on any algorithm.
The sections are organized as follows: Section 2 describes the experimental design and data collection. Section 3 shows the methodology, including the data processing procedure, feature extraction, feature analysis, and ML algorithms. Section 4 presents and discusses the SOH estimation results, and Section 5 concludes this study.
2. Experimental Design and Data Collection
In this study, ten ternary cells with a rated capacity of 36 Ah and a rated voltage of 3.6 V were tested under five aging conditions with different temperature and current rate (C-rate) stresses. The specific parameters are shown in Table 1 below.
The detailed experimental steps are as follows: (1) Constant current–constant voltage (CC-CV) charge: charge the battery with the set C-rate to the cut-off voltage of 4.15 V, and then charge it with a constant voltage until the current decreases to 0.05 C. (2) CC discharge: discharge the battery with the set C-rate to the cut-off voltage of 2.5 V. (3) Repeat steps (1) and (2) until the battery capacity declines to 80% of the rated capacity, then stop the aging experiment.
With the cycle gradually increasing, the chemical products of the irreversible reaction inside the battery continue to accumulate, resulting in a continuous loss of chemical materials. This process will lead to changes in the battery internal parameters such as an increase in the internal resistance and a change in the open circuit voltage (OCV), which is the reason for the decline in battery performance. The capacity degradation curve of the 10 batteries is shown in Figure 1.
Battery cycle life varies significantly between operating conditions, with B7 and B8 cells having up to about 900 cycles, and B5 and B6 cells having only about 200 cycles. The battery aging path is also not linear, but rather changes abruptly from a near-linear decline stage to an accelerated decline stage. Capacity is not strictly monotonically decreasing over the full battery life. Capacity recovery occurs in certain cycles, which may be associated with pauses in the experiments. Irregular tests are common in vehicle operation. Consequently, these points were not removed. This phenomenon complicates the SOH estimation by increasing the uncertainty of the process.
3. Methodology
3.1. Data Processing Procedure for Deterioration of Data Quality
The data of lithium-ion batteries collected under real-vehicle conditions differ significantly from laboratory conditions, mainly in three aspects: the sampling frequency of the collector, the sampling precision, and the completeness of the charging and discharging process [39].
The alignment of laboratory data quality with real operating data facilitates the developed model’s transferability. Therefore, the charging data under laboratory conditions are processed to achieve data quality like that of real-vehicle data. The processing procedure consists of the following main aspects.
Sampling frequency. Under laboratory conditions, the data are collected at 1 HZ, which means that the data are collected every second. Meanwhile, for real vehicles, a sampling frequency of this speed is hard to reach. In most cases, the collection frequency is only 0.1 HZ or even lower, meaning that the interval between the two sets of data is more than 10 s. The features extracted at different sampling frequencies vary greatly, with some features even being invalid at some frequencies. For example, the lower the sampling frequency, the sparser the points for the IC curve, and the greater the error in the location of the peak points. To reduce the sampling frequency, the lab raw data were down-sampled by taking every 9th data point to reduce the frequency to 1 sample in 10 s. The last data point was added additionally if the 9th data point was not collected.
Sampling precision. The data precision of the laboratory acquisition equipment is very high. The sampling error of the voltage and current is only about 0.05%. The voltage acquisition precision is only about 1 mV, and the current acquisition precision is only about 0.1 A for the fleet data, which is a huge gap between the lab and real-world data [32]. The lower precision of the voltage and current will cause errors in the calculation of capacity and will gradually accumulate in the charging and discharging process. As a result, the peak height feature derived from the IC curve may be erroneous compared to that obtained from high-precision data due to insufficient precision. To emulate the precision of the data collected from the real vehicle, it is necessary to reduce the laboratory precision to 1 mV for voltage and 0.1 A for current. Meanwhile, the capacity gathered by the experimental equipment will not be used but calculated by the ampere-time integration method.
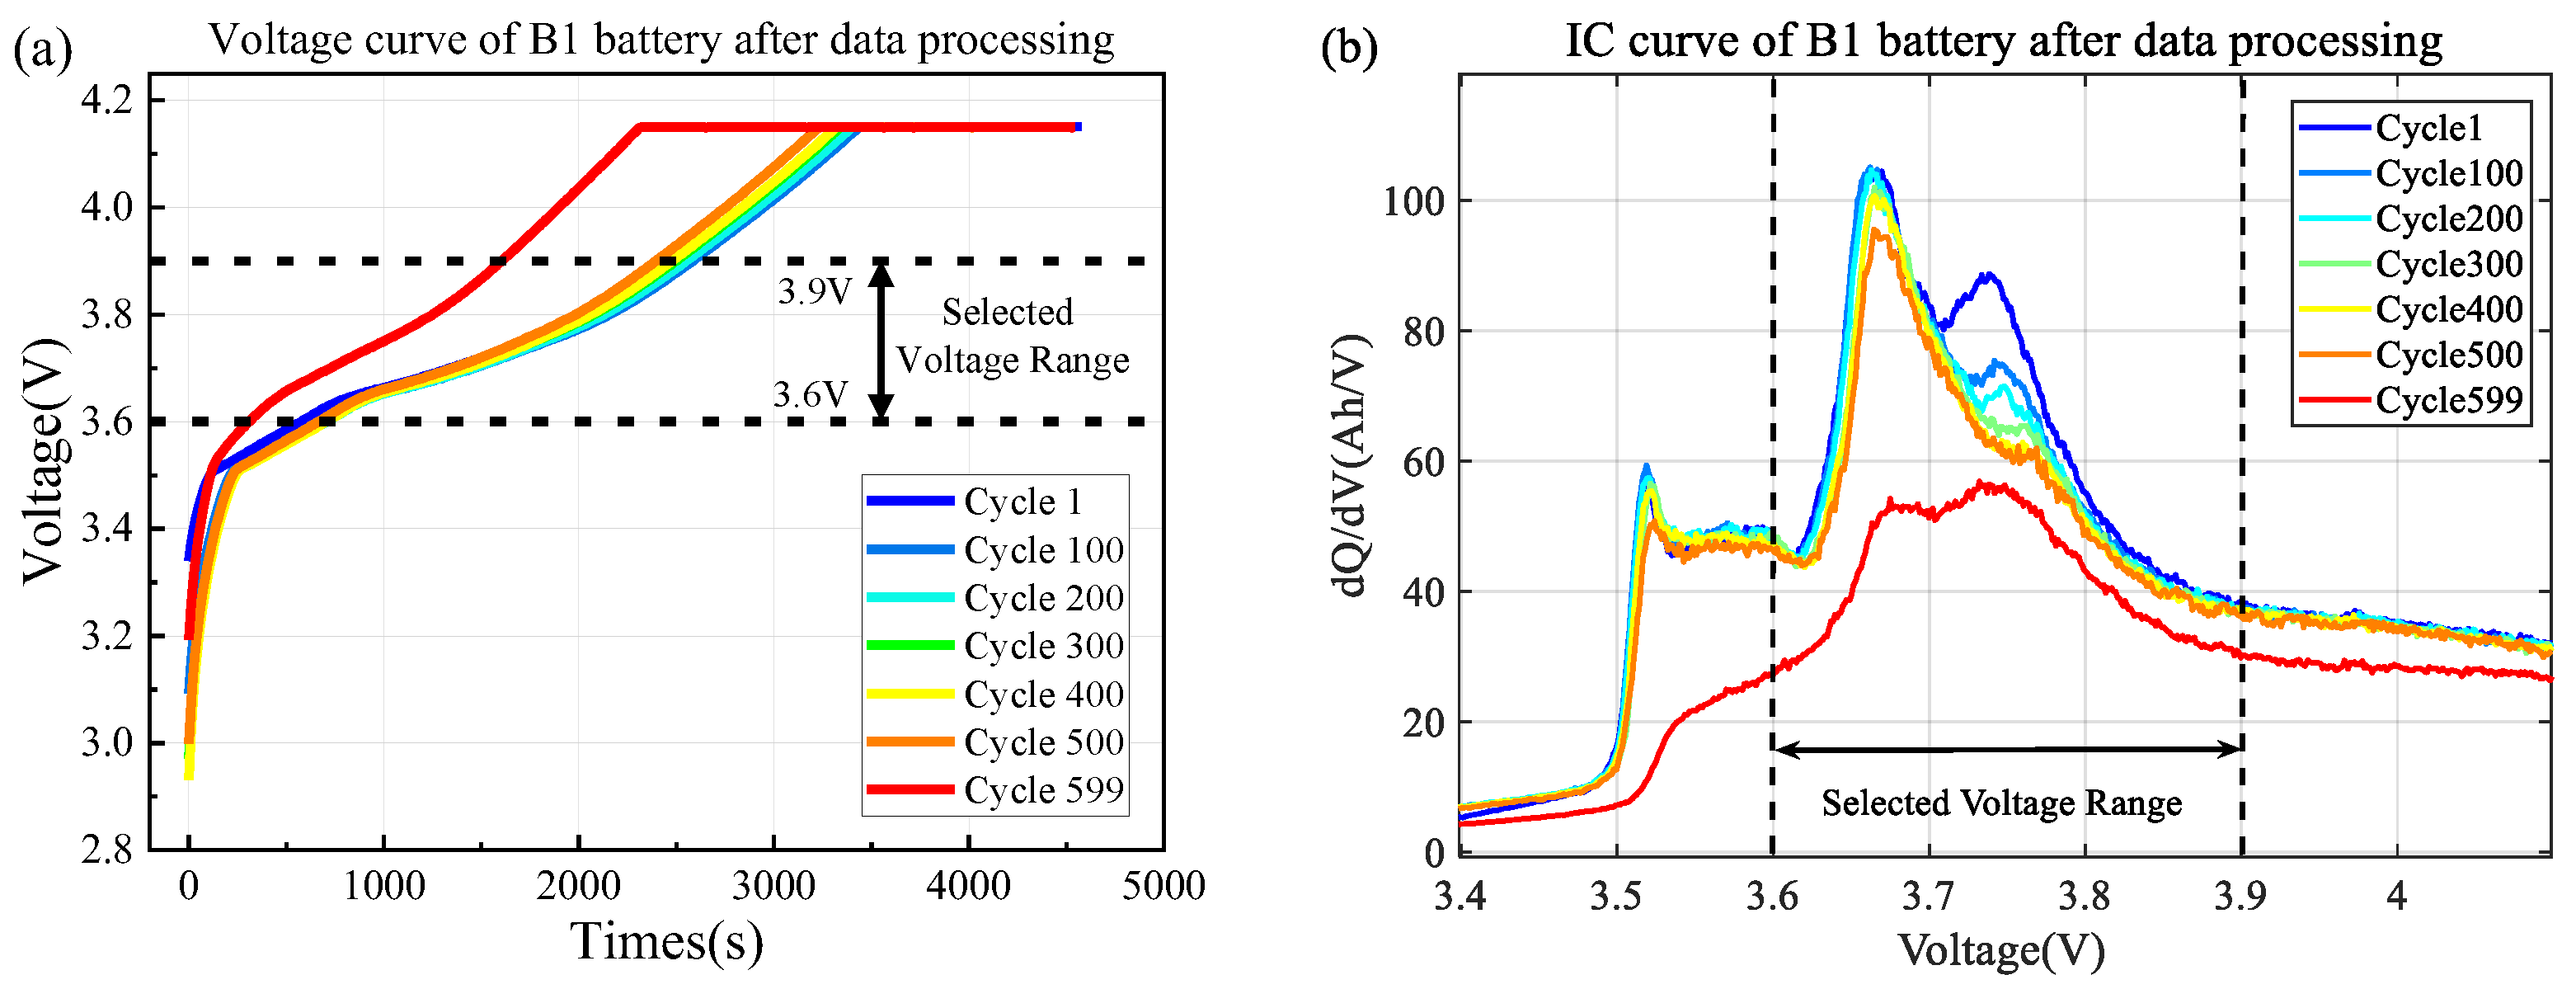
Integrity of charge/discharge data. Each battery cycle under lab conditions comprises a full charge and discharge process that contains all of the information on battery aging. The vehicle does not charge to a full state with an empty charge, nor does it discharge to a nonempty state with a full charge. Therefore, each charge/discharge process is incomplete, with only partial information. This will result in a partial loss of the mechanistic information contained in the IC curve. However, most vehicle users will not stop charging until the battery is fully charged or near its full state, which indicates that most of the charge data contain aging information in high SOC intervals. For a closer resemblance to the real-vehicle data, the raw data under lab conditions are divided into intervals based on voltage. Only the segments with a voltage range from 3.6 V to 3.9 V during the charge, which was selected in accordance with most of the literature reports, are used for feature extraction and health estimation [40]. To clearly illustrate the voltage range selected in this paper, we plot the voltage profile over the whole charging process in Figure 2a and the selected range is labeled.
3.2. Feature Extraction
3.2.1. Incremental Capacity (IC) Curve-Based Feature
The voltage-capacity curve (Q-V curve) can provide the IC curve after differential transformation. After this transformation, the voltage plateau on the Q-V curve becomes a more salient peak on the IC curve. Therefore, the change in the IC curve during the whole battery life has a certain relationship with the battery aging state, and the electrochemical health status can be analyzed side by side. Although the IC curves may fail under a high C-rate and low data quality, the trend of the IC curves with aging was plotted for the downgraded lab data of the B1 battery in this study, as illustrated in Figure 2b, and labeled with the selected voltage range. It can be observed that the IC curve is greatly affected by the noise, shown by the obvious jagged shape. However, with the cycle increase, the peak height and peak position of the IC curve change regularly. It shows that the peak value gradually decreases, while the voltage position of the peak is shifted to the right. Especially in the voltage range from 3.6 V to 3.9 V, there is still a main peak, although the shape of the peak is not smooth.
Since the IC curve contains rich information about the intrinsic aging of the battery, it is still employed even though it is relatively unsmooth in the deteriorated data. In this paper, three features are selected for the characterization of battery aging on the IC curves of the downgraded data, which are the main peak height, the voltage point corresponding to this peak, and the area surrounded by the curve and the axes in the voltage range from 3.6 V to 3.9 V, named peak height, peak position, and peak area, respectively. Figure 3 shows the evolution curves of the three extracted IC features of the B1 battery with capacity degradation. The peak height has a sharp fluctuation in the pre-aging period and a reduced fluctuation in the middle and late-aging period, which has a higher correlation with the capacity. The peak position has a sharp volatility throughout the cycle life, but still exhibits an overall upward trend as the battery capacity decays. It is particularly noteworthy that peak area has a better correlation with the capacity. The change is more regular and almost linearly correlated with the capacity decline. In addition, to provide a clearer visualization of the IC-based features as the cycle increases, we also show the IC-based features versus cycle times, as shown in Figure 3d–f.
3.2.2. Voltage-Based Feature
The research of Severson et al. showed that the voltage-dependent sequences contain much information related to the health of the battery and demonstrated that their standard deviations have a high correlation with the SOH. Inspired by such studies, this paper also attempts to derive relevant features based on voltage information. Since the test charge mode is CC-CV, the selected range has not reached the charge cut-off voltage, and thus, the current is a fixed value. The trend of the voltage profile in the range varies with the increasing aging, and Figure 4 shows the evolution of the voltage within the selected range after the downgrade processing of B1 battery data. Even after the data downgrading process, the voltage curve still shows a smooth trend, which is different from the IC curve.
The simulated real-vehicle data show a regular change in the voltage curve, in which the time required to charge from 3.6 V to 3.9 V becomes progressively shorter as the aging increases, and the curve is shifted upwards overall. Therefore, the voltage series within the range contains the aging information, for which statistics can be calculated to be used as inputs in the ML algorithms, specifically the mean, variance, skewness, and kurtosis of the series. The formulas are shown in Table 2 below.
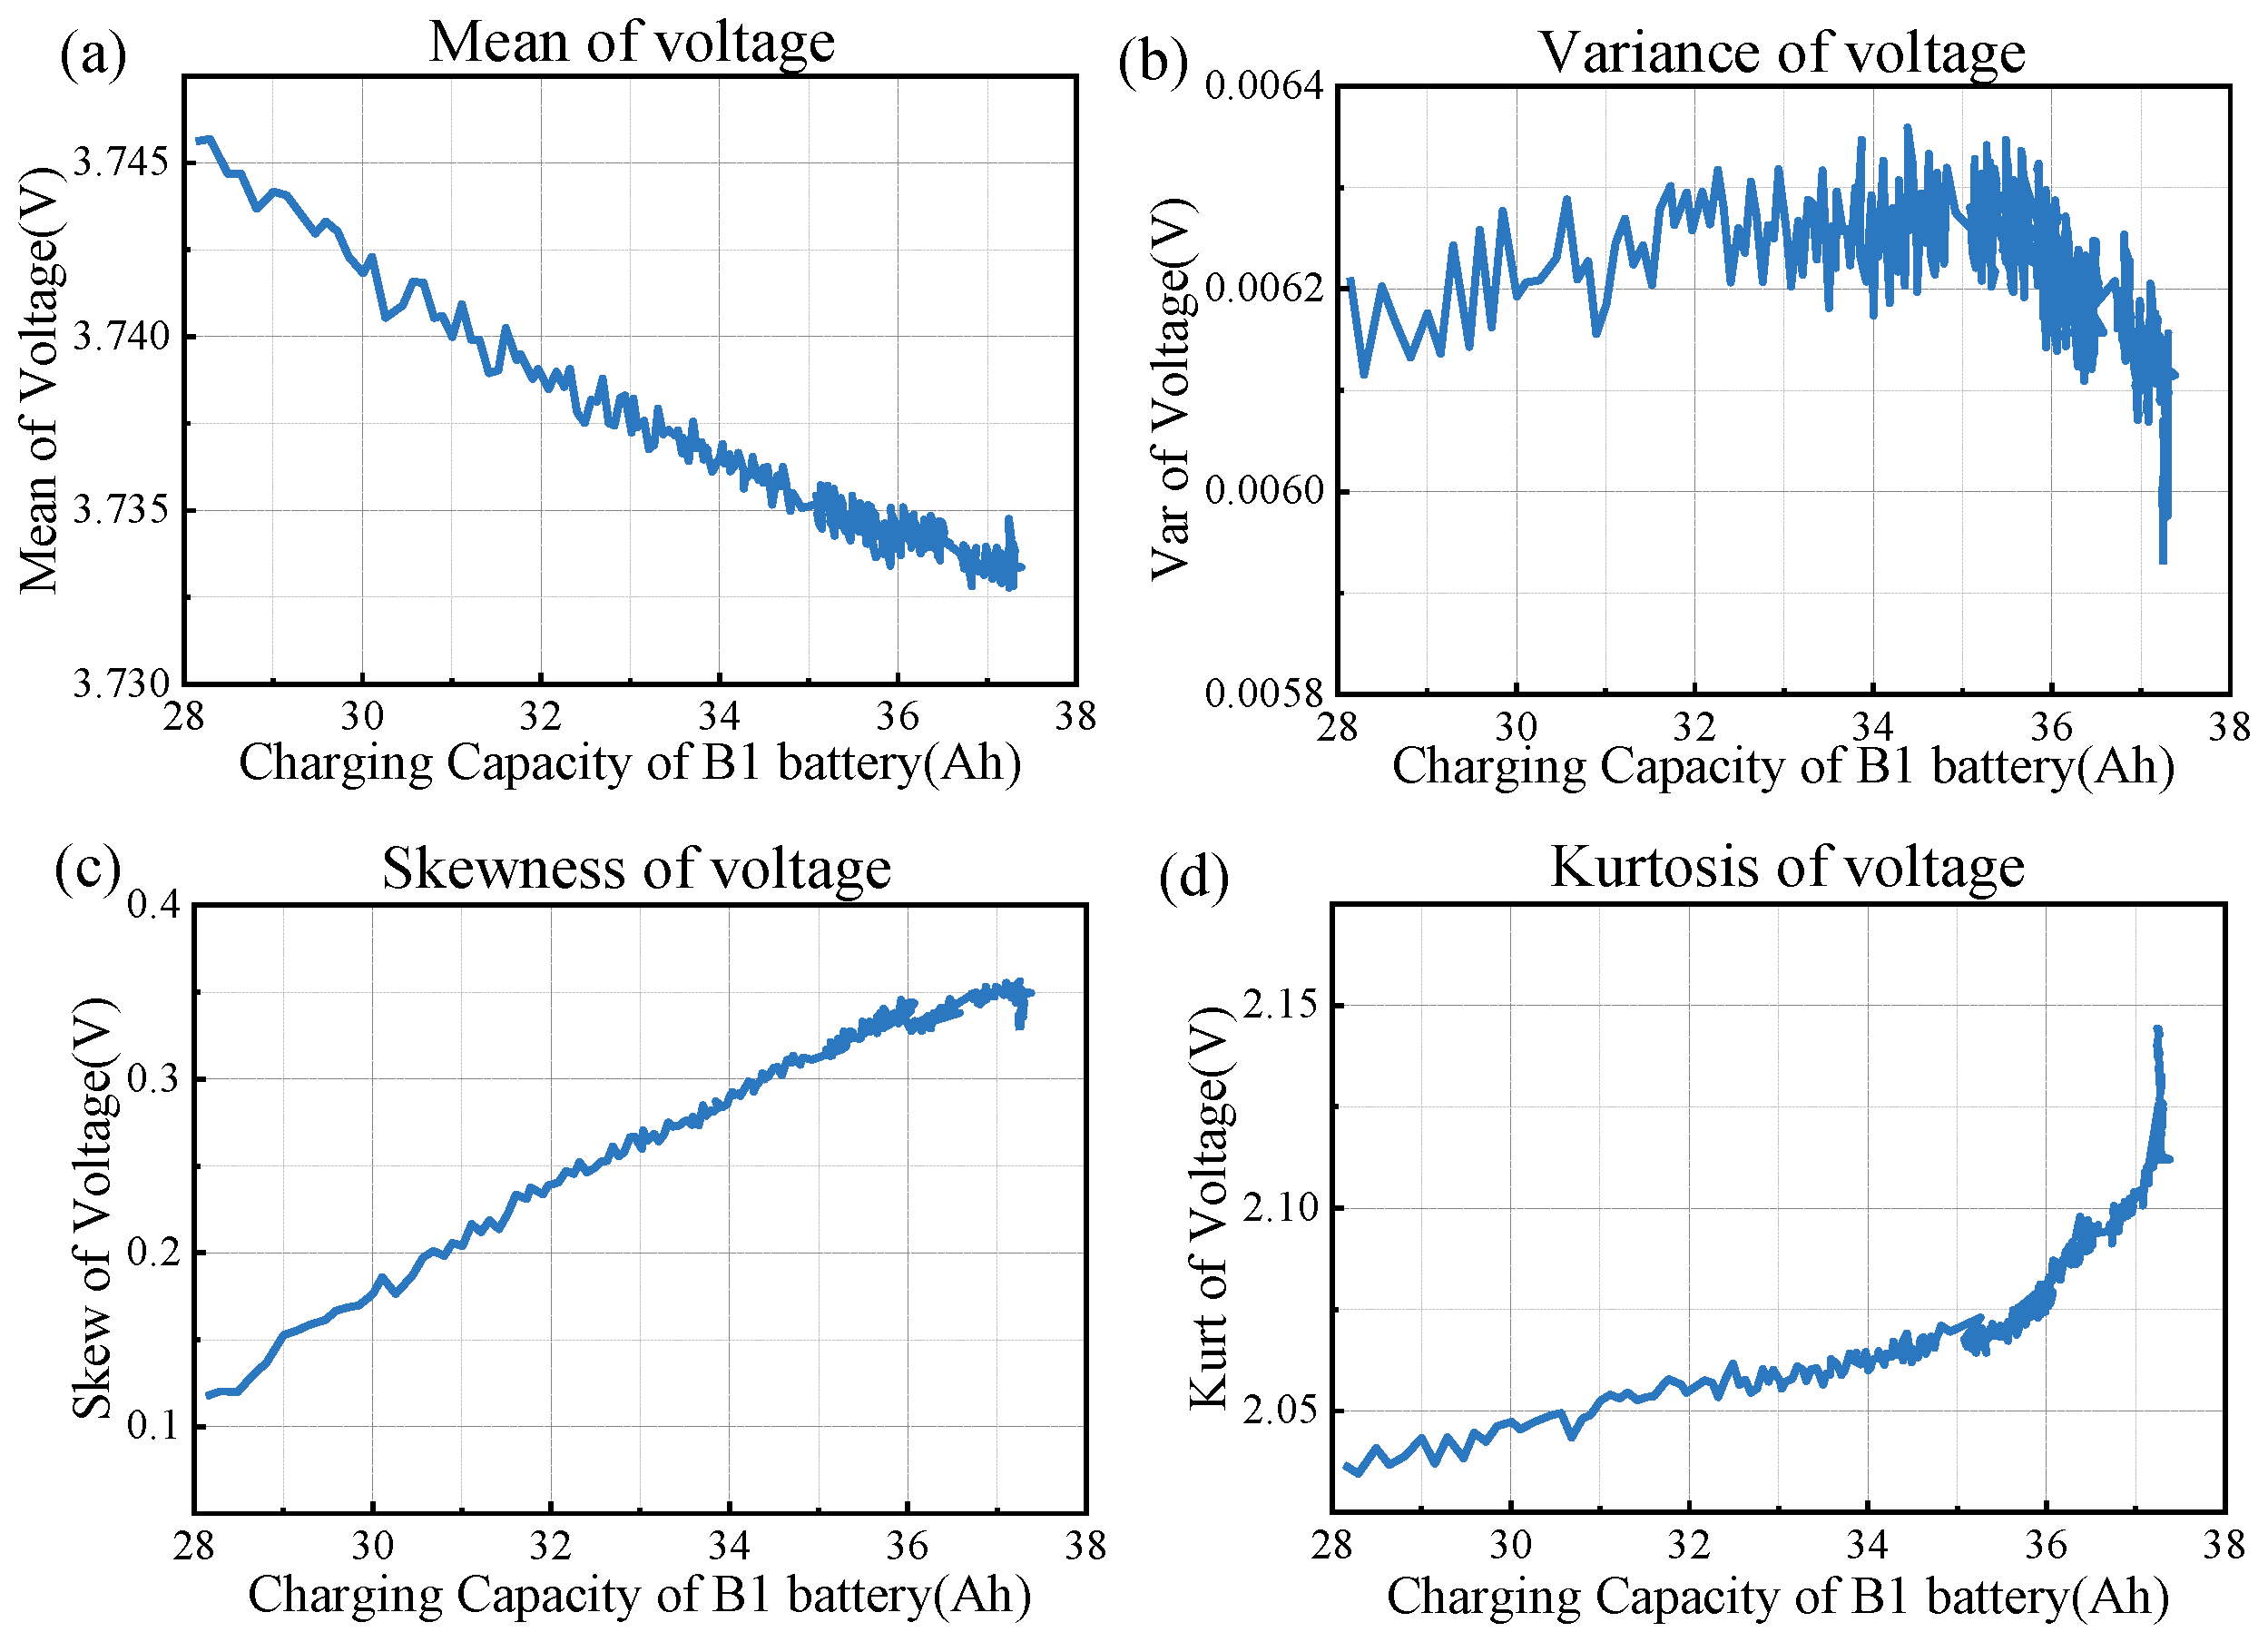
As can be seen in Figure 5, among the statistical features of the voltage series, the three features of mean, skewness, and kurtosis have a higher correlation with the capacity and change more regularly as the capacity declines. Although the performance of the variance feature is more general, it is also changing as the battery capacity declines. In particular, the mean, kurtosis, and skewness of the voltage show an almost linear increase or decrease with capacity decay. This further suggests that the voltage curves in this region are evolving, implying an intrinsic electrochemical aging phenomenon of the battery from the shape of the curves.
3.3. Feature Analysis
For further quantification of the relationship between the proposed features and battery aging, Pearson correlation coefficients were used to evaluate the relevance of each feature to the SOH of the batteries, and the calculation formula is shown in Equation (1). The Pearson correlation coefficient reflects the correlation between two variables (feature and battery capacity); the larger the absolute value of ρ, the stronger the correlation. When ρ > 0, the two variables are positively correlated. When ρ < 0, the correlation is negative.
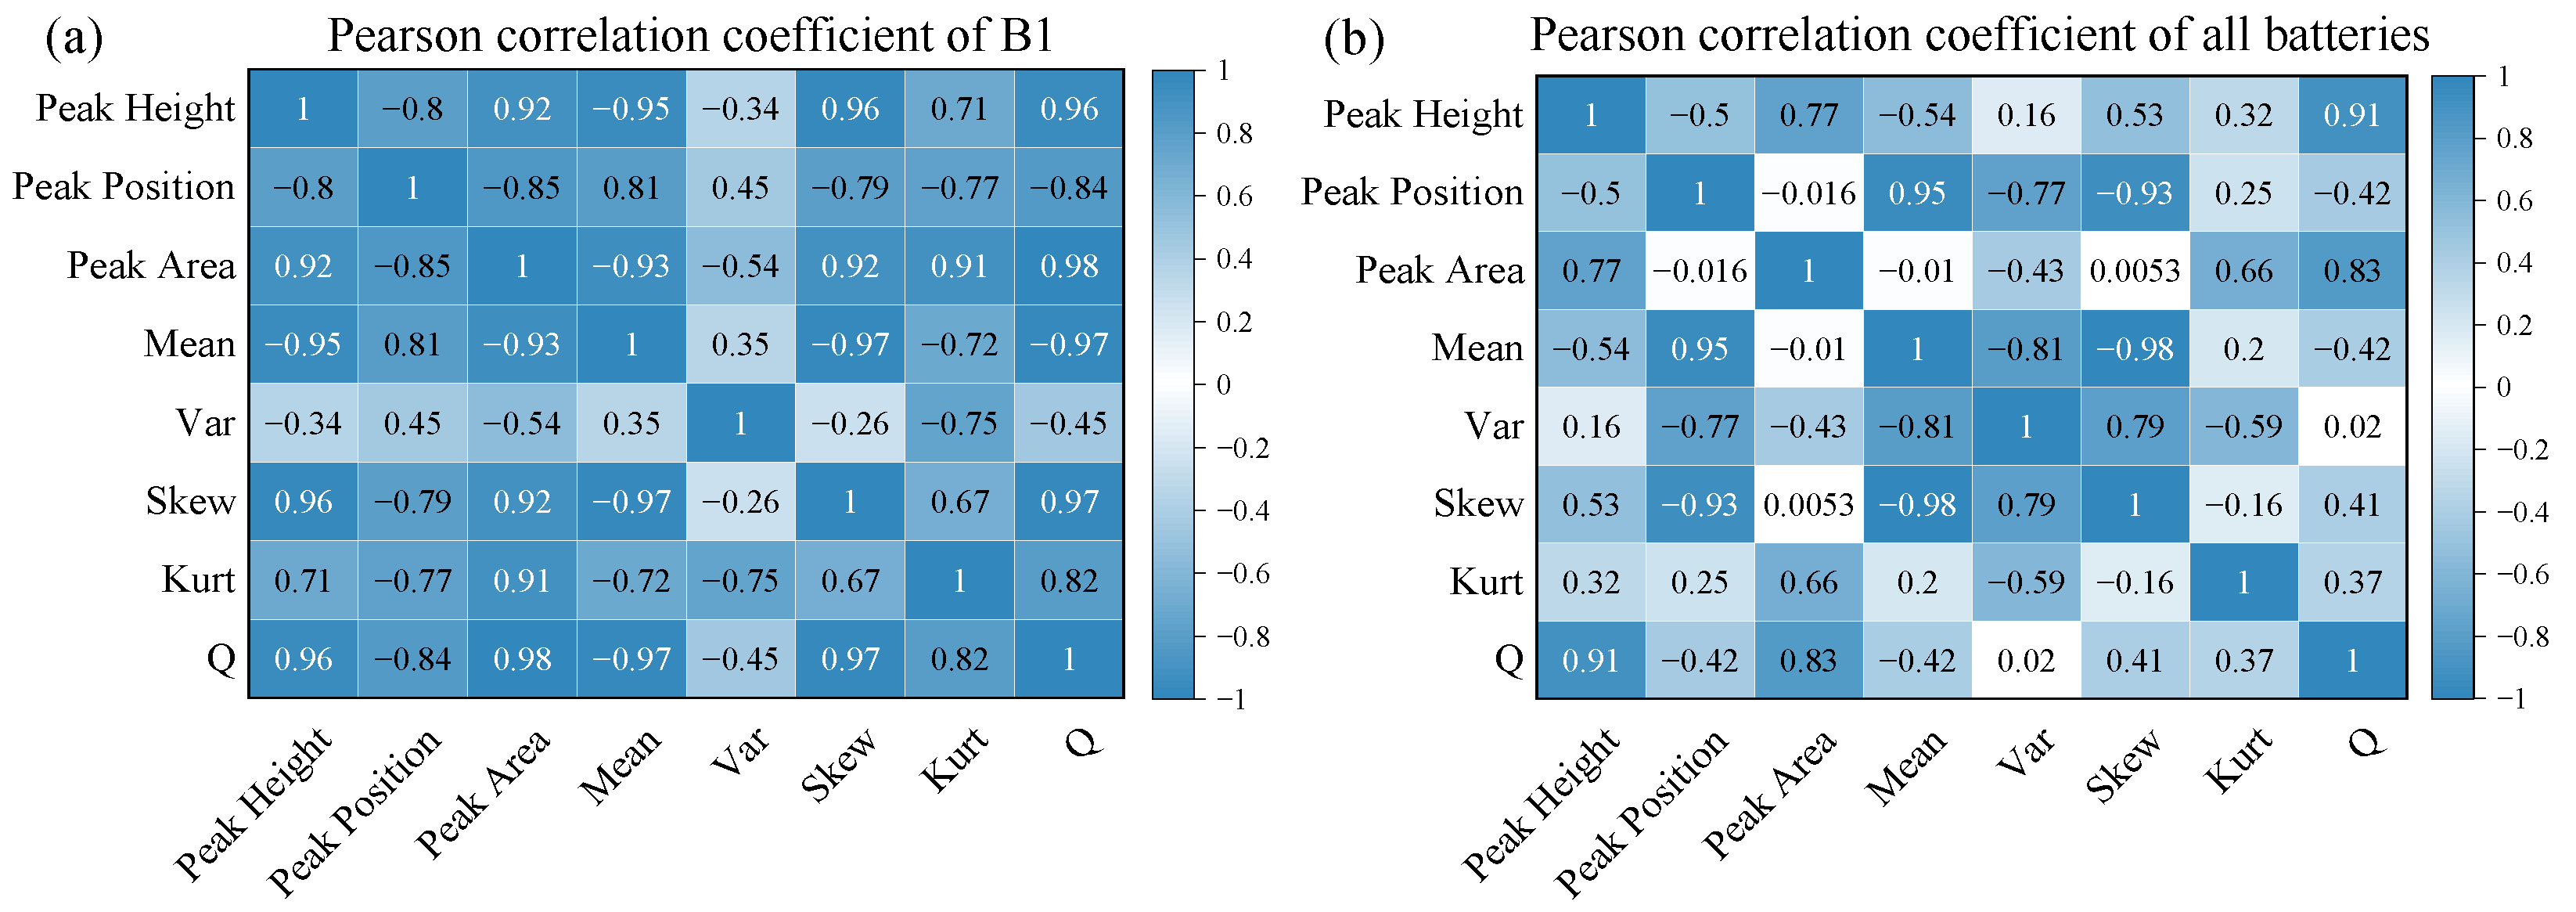
Figure 6a demonstrates the correlation between the features and the capacity of the B1 battery. Except for the voltage variance feature whose correlation is lower than 0.6, the correlation of the other six features (three IC-based features and three voltage-based features) is above 0.8, which indicates that the extracted features can reflect the battery’s capacity degradation. Figure 6b extends the correlation analysis to all cells. The correlation between the proposed features and capacity shows a different degree of drop due to the different cycling conditions and temperatures, which lead to significant differences in battery life and aging paths. In particular, the correlation between voltage variance and capacity is only 0.02. This observation is consistent with the trend of the voltage variance curves in Figure 5b which show a more irregular trend compared to the other three voltage-class features. The voltage variance will be discarded in the subsequent inputs, even though it performs well in the relevant literature. In addition, even if the battery is expanded to all working conditions, the IC peak and peak area features still maintain a high correlation above 0.8 with capacity, while the voltage-based features have correlations below 0.6. The more severe drop in the voltage-based features indicates that the voltage is sensitive to the operating environment. Even though it performs well on a single cell, it is hard for the voltage features to maintain favorable performance under different operating conditions and accurately reflect the information of that aging path. In other words, once the aging conditions of the battery are changed, it may be difficult for the voltage-dependent features to capture the capacity trajectory. Therefore, the ability of the IC-based features and the voltage-based features to track battery degradation will be evaluated separately in the next section.
3.4. Machine Learning (ML) Algorithms
This section establishes the relation between the feature set and the SOH by employing diverse ML methods to validate the reliability of the constructed features on the downgraded data. To make the proposed method deployable in the battery management system (BMS), the dominant ML methods such as SVRs [41,42,43], BP [44,45,46], and RF [47,48] are employed. Due to the strong correlation between the proposed features and capacity, a high SOH estimation accuracy can be expected.
3.4.1. Support Vector Regression (SVR)
SVR is a very important branch of SVMs. Unlike general linear regression, SVR computes losses only when the error between the predicted and observed values is greater than a specified tolerable deviation ε and optimizes the model by maximizing the interval bandwidth and minimizing the total loss. Therefore, the regression problem solved is to find an optimal hyperplane, which can arrange all of the sample points from the hyperplane at the “shortest” distance.
For a linear hard-spaced SVR, the optimization objective is as follows:
where w is the weight, b is the intercept, and the points located within the boundary satisfy the conditions shown in Equation (3), where ε is the maximum loss error:
With the introduction of slack variables , the SVR problem can be rewritten as
3.4.2. Back Propagation (BP) Neural Network
A BP neural network is a neural network with three or more layers, where several neurons make up each layer of the network, with connections between each neuron on the left side and each one on the right side, and no connections between the upper and lower neurons within each layer.
The BP neural network is constructed based on the forward propagation of the input signal and the back propagation of the prediction error. The output of the hidden layer is shown in Equation (5), where wij is the weight between the income layer and the hidden layer, aj is the bias between the input layer and the hidden layer, and g(x) is the excitation function.
The output of the output layer is shown in Equation (6), where wjk and bk are the weight and bias between the hidden layer and the output layer, respectively.
For the calculation of the error, the error formula is taken as follows:
where is the desired output; then, the error denoted as can be expressed as follows:
The iterative formula for updating weights is expressed by Equation (9), where the learning rate is set to η.
The updated iterative formula for the bias is as follows:
The initial parameter settings are required to determine the number of hidden layers, the number of neurons, the learning rate, the activation function, etc. Repeating the iterative process will allow the model to learn the optimal weights and bias matrix.
3.4.3. Random Forest (RF)
Random forest is an algorithm that utilizes the bootstrap aggregating idea to integrate multiple decision trees. Each decision tree is comparable to a weak learner, and the random forest constructed from all of the decision trees is comparable to a strong learner, which is the bagging implementation of RF. The decision tree is the basic unit. The specific process is to adopt a random method to build a forest. The forest consists of a lot of decision trees and each decision tree is unrelated to each other, which makes a separate prediction whenever new data enter the model. For regression problems, a simple arithmetic average is used, where the final prediction of the model is the averaged result of each tree.
4. Results and Discussion
4.1. SOH Estimation Results
The degradation paths of the 10 batteries under different operating conditions all show a process starting from nearly linear decay and transitioning to accelerated decay, but there are differences in the degradation rates due to different operating conditions. Based on the six features extracted from the IC curve and the voltage profile, three SOH estimation models are constructed by three ML algorithms mentioned above. To evaluate the performance of the three algorithms for SOH estimation, maximum absolute error (MAXE) and root mean square error (RMSE) are used. The formulas are shown in Equations (11) and (12).
For the division of the data set, five batteries are selected from different working conditions as the training set, which are B1, B3, B5, B7, and B9, and the remaining five batteries are used as the validation set. The estimation results of the validation set on the three ML algorithms are shown in Figure 7 and the statistical results are shown in Figure 8. The results show that all ML algorithms can achieve excellent SOH estimation accuracy in various working cases. The three algorithms have comparable evaluation, which is attributed to the fact that the proposed features are well adapted to different operation conditions, all of which capture the aging state of the batteries better. This further indicates that the proposed features are not algorithm-dependent. Further analysis shows that the BP neural network is slightly better than the others, with RMSEs within 1% for all batteries, except for the short-life B6 battery where the MAXE reaches 2.8%. RF may not cope with the accurate prediction of long/short-life batteries, with the error reaching a MAXE of 3.85% for B6, and the performance for long-life B8 having the next largest error reaching 3.15%. The performance of SVR for different batteries does not differ much, with RMSEs of around 0.8%, which indicates that the robustness of SVR in migrating applications is superior.
The three ML algorithms show higher errors for the B6 battery, which is due to the large C-rate of this battery at low temperatures, resulting in a more complex aging pattern. It is manifested by a capacity dive after about 200 cycles, with about 250 cycles in its lifetime, which also increases the difficulty of the estimation. However, the temperature of the validation set ranges from 25 °C to 40 °C, and the charge and discharge C-rate covers 0.5 C to 1.5 C, which further illustrates that the predicted model can perform the task of SOH estimation for different aging regimes. Even with the hindrances of aging mode complexity, short lifetime, and low sampling precision and sampling frequency, high accuracy estimation with a MAXE of 2.5% was obtained based on the proposed features. It is noteworthy that the error is only 1% in the first 200 cycles (80% of the full life), which further implies that the proposed model and features can provide high-accuracy estimations for batteries with complex aging patterns. The life model developed for the actual operating data format can cope with batteries under complex operating conditions, which is of positive significance for practical applications.
4.2. Discussion of the Performance of IC-Based and Voltage-Based Feature Subsets
In the previous section, it was concluded that the developed SOH evaluation frameworks can achieve high-accuracy estimation without relying on the algorithms. However, the inputs contain IC-related features and voltage-related features. To provide further guidance on feature selection principles for real-world data, this section quantitatively evaluates the respective effects of IC-based and voltage-based features as inputs to the three algorithms, respectively.
The division of the training and validation sets as well as the parameterization of the algorithm in this comparison remains the same as in Section 4.1. As shown in Figure 9d, cells under the three algorithms show the best results for the sets containing six features (noted as the proposed feature set) and the worst for the voltage-based feature set, both in terms of error bar range, mean, and median. The error distribution between the ML algorithms is almost the same when the proposed feature sets are used as inputs, while the error distribution of IC-based features also shows slight fluctuations, with the narrowest error range obtained for RF, which is only 50% of that of BP and SVR. The worst case is the voltage-based feature set, whose performance fluctuates widely across ML algorithms. The RMSE of the validation set for different algorithms and input sets is shown in Table 3, where all feature sets have comparable results with different algorithms, with a maximum RMSE of only 0.52%, the IC-based set is slightly worse, with a maximum RMSE of 0.65%, and the RMSE of the voltage-based feature set is as high as 2.59%. Thus, these results show that the best results are achieved with the proposed feature sets, the second best with the IC-based feature set, and the worst with the voltage-based feature set, but the estimation accuracy can be improved by 20% when the voltage information is combined with the IC information.
To further analyze the performance on a single cell, the predicted effects of the B4 cell with the three inputs are shown in Figure 9. Since the input effect in the validation set does not differ on each cell, only one case is shown in this paper. The performance of the B4 battery is quite different based on the three inputs. Although all three inputs can follow the aging state of the battery well in the early stage of the SVR algorithm, with an error of only about 3%, in the later stage, the voltage feature can no longer continue to capture the declining trend of the battery capacity. In the last 100 cycles, the prediction effect of the voltage feature decreases exponentially. This may be due to the fact that the aging pattern of ternary batteries typically decays in the low SOC range, while when downgrading lab data, the range used is the high region of 3.6–3.9 V. Additionally, in the BP neural network, the performance effect of the voltage feature shows large-scale fluctuations or even fails to follow the trend of capacity changes, which may result from the variable parameter settings, which are the same as in the previous section. This also indicates that the voltage-based features are dependent on the algorithm and the parameter settings, which is also evident in RF.
In practical usage, even though the IC curves cannot be accurately acquired under the large C-rate, the rough IC curves obtained can still reflect battery aging. Although the voltage information was found to represent battery aging under laboratory conditions, when the data are degraded to field data, the voltage information is dependent on the algorithm and the voltage range selected, which is different from previous studies. However, when the voltage information is combined with the mechanism information obtained from the IC curve, it can assist in the evaluation of battery state and can improve the accuracy by 20%.
5. Limitations and Outlook
The present study can also be improved in the future. First, as a framework for developing SOH models applicable to real-vehicle scenarios based on laboratory data, the proposed framework does not consider battery type. Therefore, the proposed framework can be applied to a wider range of battery materials. Second, our data downgrading strategy can be simulated by advanced simulation techniques to match the real scenarios, including data asynchrony, varying sampling frequency, and unfixed usage range, and can be considered based on laboratory battery pack data. Finally, the proposed framework does not assume a specific data source. Therefore, it is possible to explore scenarios that contain other detection signals. The proposed framework is promising to help maximize the potential for developing field SOH models based on laboratory data.
6. Conclusions
Accurate battery SOH estimation can maintain stable vehicle operation. However, most of the existing studies have developed SOH models for high-precision data obtained in the laboratory, which cannot be directly applied to field data. To address this gap, this paper proposes an SOH estimation method oriented to real-vehicle data and demonstrates deployment in the BMS. A flowline for downgrading the lab data into field data is proposed, which is carried out through assessing sampling precision and sampling frequency, and performing data cutting. Two types of features, mechanism features and voltage features (three features each of the two classes), are extracted based on the IC curves and statistics for the class of real-vehicle data. It is shown that the Pearson correlation coefficients between the features and the capacity are greater than 0.8, except for the voltage variance. Finally, ten ternary lithium-ion batteries were selected for experimental validation under five operating conditions. After the raw data were processed to reduce the data quality, excellent estimation results were achieved by using three ML algorithms, with the MAXE within 2.8% and an RMSE of only 0.52%. An assessment with an RMSE of 0.65% can also be achieved by the mechanistic information of the IC curve. The voltage information can assist in the SOH estimation, which can improve the accuracy by 20%. This study proposes a promising solution for developing an SOH model for electric vehicles.
Author Contributions
Conceptualization, J.W. and C.Z.; methodology, J.W. and C.Z.; software, J.W. and X.L.; validation, X.M., L.Z. and W.Z.; formal analysis, J.W.; investigation, X.M.; resources, X.M. and W.Z.; data curation, J.W. and X.L.; writing—original draft preparation, J.W.; writing—review and editing, C.Z. and X.L.; visualization, L.Z.; supervision, W.Z.; project administration, C.Z.; funding acquisition, C.Z. All authors have read and agreed to the published version of the manuscript.
Funding
This research study was funded by the National Key Research and Development Program of China (Grant No. 2022YFB2502304), the Young Scientists Fund of the National Natural Science Foundation of China (Grant No. 52222708), and the Fundamental Research Funds for the Central Universities (Grant No. 2021YJS156).
Data Availability Statement
The data presented in this study are available on request from the corresponding author. The data are not publicly available due to confidentiality of ongoing projects.
Conflicts of Interest
The authors declare no conflicts of interest.
References
- Sudjoko, C.; Sasongko, N.A.; Utami, I.; Maghfuri, A. Utilization of Electric Vehicles as an Energy Alternative to Reduce Carbon Emissions. IOP Conf. Ser. Earth Environ. Sci. 2021, 926, 012094. [Google Scholar] [CrossRef]
- Sandaka, B.P.; Kumar, J. Alternative Vehicular Fuels for Environmental Decarbonization: A Critical Review of Challenges in Using Electricity, Hydrogen, and Biofuels as a Sustainable Vehicular Fuel. Chem. Eng. J. Adv. 2023, 14, 100442. [Google Scholar] [CrossRef]
- Chen, J.; Qi, G.; Wang, K. Synergizing Machine Learning and the Aviation Sector in Lithium-Ion Battery Applications: A Review. Energies 2023, 16, 6318. [Google Scholar] [CrossRef]
- Diouf, B.; Pode, R. Potential of Lithium-Ion Batteries in Renewable Energy. Renew. Energy 2015, 76, 375–380. [Google Scholar] [CrossRef]
- Gao, Y.; Jiang, J.; Zhang, C.; Zhang, W.; Ma, Z.; Jiang, Y. Lithium-Ion Battery Aging Mechanisms and Life Model under Different Charging Stresses. J. Power Sources 2017, 356, 103–114. [Google Scholar] [CrossRef]
- Wang, S.; Yin, Z.; Lu, X.; Yang, D.; Tian, S.; Han, Y.; Zheng, Z. Research on the Influence of Battery Cell Static Parameters on the Capacity of Different Topology Battery Packs. Energies 2021, 14, 1610. [Google Scholar] [CrossRef]
- Yang, S.; Zhang, C.; Jiang, J.; Zhang, W.; Zhang, L.; Wang, Y. Review on State-of-Health of Lithium-Ion Batteries: Characterizations, Estimations and Applications. J. Clean. Prod. 2021, 314, 128015. [Google Scholar] [CrossRef]
- Li, Y.; Luo, L.; Zhang, C.; Liu, H. State of Health Assessment for Lithium-Ion Batteries Using Incremental Energy Analysis and Bidirectional Long Short-Term Memory. World Electr. Veh. J. 2023, 14, 188. [Google Scholar] [CrossRef]
- Jiang, Y.; Chen, Y.; Yang, F.; Peng, W. State of Health Estimation of Lithium-Ion Battery with Automatic Feature Extraction and Self-Attention Learning Mechanism. J. Power Sources 2023, 556, 232466. [Google Scholar] [CrossRef]
- Lin, M.; Yan, C.; Wang, W.; Dong, G.; Meng, J.; Wu, J. A Data-Driven Approach for Estimating State-of-Health of Lithium-Ion Batteries Considering Internal Resistance. Energy 2023, 277, 127675. [Google Scholar] [CrossRef]
- Bao, Y.; Dong, W.; Wang, D. Online Internal Resistance Measurement Application in Lithium Ion Battery Capacity and State of Charge Estimation. Energies 2018, 11, 1073. [Google Scholar] [CrossRef]
- Braco, E.; San Martín, I.; Sanchis, P.; Ursúa, A. Fast Capacity and Internal Resistance Estimation Method for Second-Life Batteries from Electric Vehicles. Appl. Energy 2023, 329, 120235. [Google Scholar] [CrossRef]
- Plett, G.L. Sigma-Point Kalman Filtering for Battery Management Systems of LiPB-Based HEV Battery Packs: Part 2: Simultaneous State and Parameter Estimation. J. Power Sources 2006, 161, 1369–1384. [Google Scholar] [CrossRef]
- Hu, C.; Youn, B.D.; Chung, J. A Multiscale Framework with Extended Kalman Filter for Lithium-Ion Battery SOC and Capacity Estimation. Appl. Energy 2012, 92, 694–704. [Google Scholar] [CrossRef]
- Topan, P.A.; Ramadan, M.N.; Fathoni, G.; Cahyadi, A.I.; Wahyunggoro, O. State of Charge (SOC) and State of Health (SOH) Estimation on Lithium Polymer Battery via Kalman Filter. In Proceedings of the 2016 2nd International Conference on Science and Technology-Computer (ICST), Yogyakarta, Indonesia, 27–28 October 2016; IEEE: New York, NY, USA, 2017; pp. 93–96. [Google Scholar] [CrossRef]
- Zou, Y.; Hu, X.; Ma, H.; Li, S.E. Combined State of Charge and State of Health Estimation over Lithium-Ion Battery Cell Cycle Lifespan for Electric Vehicles. J. Power Sources 2015, 273, 793–803. [Google Scholar] [CrossRef]
- Bartlett, A.; Marcicki, J.; Onori, S.; Rizzoni, G.; Yang, X.G.; Miller, T. Electrochemical Model-Based State of Charge and Capacity Estimation for a Composite Electrode Lithium-Ion Battery. IEEE Trans. Control Syst. Technol. 2016, 24, 384–399. [Google Scholar] [CrossRef]
- Wang, G.; Cui, N.; Li, C.; Cui, Z.; Yuan, H. A State-of-Health Estimation Method Based on Incremental Capacity Analysis for Li-Ion Battery Considering Charging/Discharging Rate. J. Energy Storage 2023, 73, 109010. [Google Scholar] [CrossRef]
- Wang, D.; Zhang, Q.; Huang, H.; Yang, B.; Dong, H.; Zhang, J. An Electrochemical–Thermal Model of Lithium-Ion Battery and State of Health Estimation. J. Energy Storage 2022, 47, 103528. [Google Scholar] [CrossRef]
- Liu, B.; Tang, X.; Gao, F. Joint Estimation of Battery State-of-Charge and State-of-Health Based on a Simplified Pseudo-Two-Dimensional Model. Electrochim. Acta 2020, 344, 136098. [Google Scholar] [CrossRef]
- Dubarry, M.; Liaw, B.Y. Identify Capacity Fading Mechanism in a Commercial LiFePO4 Cell. J. Power Sources 2009, 194, 541–549. [Google Scholar] [CrossRef]
- Dubarry, M.; Truchot, C.; Liaw, B.Y. Synthesize Battery Degradation Modes via a Diagnostic and Prognostic Model. J. Power Sources 2012, 219, 204–216. [Google Scholar] [CrossRef]
- Lin, Y.; Jiang, B.; Dai, H. Battery Capacity Estimation Based on Incremental Capacity Analysis Considering Charging Current Rate. World Electr. Veh. J. 2021, 12, 224. [Google Scholar] [CrossRef]
- Bloom, I.; Jansen, A.N.; Abraham, D.P.; Knuth, J.; Jones, S.A.; Battaglia, V.S.; Henriksen, G.L. Differential Voltage Analyses of High-Power, Lithium-Ion Cells: 1. Technique and Application. J. Power Sources 2005, 139, 295–303. [Google Scholar] [CrossRef]
- Dubarry, M.; Svoboda, V.; Hwu, R.; Liaw, B.Y. Incremental Capacity Analysis and Close-to-Equilibrium OCV Measurements to Quantify Capacity Fade in Commercial Rechargeable Lithium Batteries. Electrochem. Solid-State Lett. 2006, 9, A454–A457. [Google Scholar] [CrossRef]
- Kato, H.; Kobayashi, Y.; Miyashiro, H. Differential Voltage Curve Analysis of a Lithium-Ion Battery during Discharge. J. Power Sources 2018, 398, 49–54. [Google Scholar] [CrossRef]
- Weng, C.; Cui, Y.; Sun, J.; Peng, H. On-Board State of Health Monitoring of Lithium-Ion Batteries Using Incremental Capacity Analysis with Support Vector Regression. J. Power Sources 2013, 235, 36–44. [Google Scholar] [CrossRef]
- Goh, T.; Park, M.; Seo, M.; Kim, J.G.; Kim, S.W. Capacity Estimation Algorithm with a Second-Order Differential Voltage Curve for Li-Ion Batteries with NMC Cathodes. Energy 2017, 135, 257–268. [Google Scholar] [CrossRef]
- Wang, J.; Zhang, C.; Zhang, L.; Su, X.; Zhang, W.; Li, X.; Du, J. A Novel Aging Characteristics-Based Feature Engineering for Battery State of Health Estimation. Energy 2023, 273, 127169. [Google Scholar] [CrossRef]
- Paulson, N.H.; Kubal, J.; Ward, L.; Saxena, S.; Lu, W.; Babinec, S.J. Feature Engineering for Machine Learning Enabled Early Prediction of Battery Lifetime. J. Power Sources 2022, 527, 231127. [Google Scholar] [CrossRef]
- Li, Y.; Stroe, D.I.; Cheng, Y.; Sheng, H.; Sui, X.; Teodorescu, R. On the Feature Selection for Battery State of Health Estimation Based on Charging–Discharging Profiles. J. Energy Storage 2021, 33, 102122. [Google Scholar] [CrossRef]
- Jia, J.; Liang, J.; Shi, Y.; Wen, J.; Pang, X.; Zeng, J. SOH and RUL Prediction of Lithium-Ion Batteries Based on Gaussian Process Regression with Indirect Health Indicators. Energies 2020, 13, 375. [Google Scholar] [CrossRef]
- Lu, C.; Tao, L.; Fan, H. Li-Ion Battery Capacity Estimation: A Geometrical Approach. J. Power Sources 2014, 261, 141–147. [Google Scholar] [CrossRef]
- Feng, H.; Shi, G. SOH and RUL Prediction of Li-Ion Batteries Based on Improved Gaussian Process Regression. J. Power Electron. 2021, 21, 1845–1854. [Google Scholar] [CrossRef]
- Bezha, M.; Nanahara, T.; Nagaoka, N. Development of Fast SoH Estimation of Li-Ion Battery Pack/Modules Using Multi Series-Parallel Based ANN Structure. In Proceedings of the 2021 IEEE 12th Energy Conversion Congress & Exposition-Asia (ECCE-Asia), Singapore, 24–27 May 2021; pp. 1719–1724. [Google Scholar] [CrossRef]
- Bezha, M.; Bezha, K.; Nagaoka, N. SOH Estimation of Battery Pack Composed on Reused Li-Ion Cells Based on Adaptive ANN Machine Learning Algorithm. In Proceedings of the 2020 IEEE International Conference on Consumer Electronics-Taiwan (ICCE-Taiwan), Taoyuan, Taiwan, 28–30 September 2020. [Google Scholar] [CrossRef]
- Liu, Z.; Zhao, J.; Wang, H.; Yang, C. A New Lithium-Ion Battery SOH Estimation Method Based on an Indirect Enhanced Health Indicator and Support Vector Regression in PHMs. Energies 2020, 13, 830. [Google Scholar] [CrossRef]
- Wu, T.; Huang, Y.; Xu, Y.; Jiang, J.; Liu, S.; Li, Z. SOH Prediction for Lithium-Ion Battery Based on Improved Support Vector Regression. Int. J. Green. Energy 2023, 20, 227–236. [Google Scholar] [CrossRef]
- Song, L.; Zhang, K.; Liang, T.; Han, X.; Zhang, Y. Intelligent State of Health Estimation for Lithium-Ion Battery Pack Based on Big Data Analysis. J. Energy Storage 2020, 32, 101836. [Google Scholar] [CrossRef]
- He, Z.; Shen, X.; Sun, Y.; Zhao, S.; Fan, B.; Pan, C. State-of-Health Estimation Based on Real Data of Electric Vehicles Concerning User Behavior. J. Energy Storage 2021, 41, 102867. [Google Scholar] [CrossRef]
- Smola, A.J.; Schölkopf, B. A Tutorial on Support Vector Regression. Stat. Comput. 2004, 14, 199–222. [Google Scholar] [CrossRef]
- Drucker, H.; Burges, C.J.; Kaufman, L.; Smola, A.; Vapnik, V. Support Vector Regression Machines. Adv. Neural Inf. Process Syst. 1996, 9, 155–161. [Google Scholar]
- Wei, J.; Dong, G.; Chen, Z. Remaining Useful Life Prediction and State of Health Diagnosis for Lithium-Ion Batteries Using Particle Filter and Support Vector Regression. IEEE Trans. Ind. Electron. 2018, 65, 5634–5643. [Google Scholar] [CrossRef]
- Wen, J.; Chen, X.; Li, X.; Li, Y. SOH Prediction of Lithium Battery Based on IC Curve Feature and BP Neural Network. Energy 2022, 261, 125234. [Google Scholar] [CrossRef]
- Wang, Y.; Xu, C.; Ziebert, C.; Wu, X.; Bao, W.; Liu, H.; Sun, Y.; Zheng, Y. A Fast Prediction of Open-Circuit Voltage and a Capacity Estimation Method of a Lithium-Ion Battery Based on a BP Neural Network. Batteries 2022, 8, 289. [Google Scholar] [CrossRef]
- Speiser, J.L.; Miller, M.E.; Tooze, J.; Ip, E. A Comparison of Random Forest Variable Selection Methods for Classification Prediction Modeling. Expert. Syst. Appl. 2019, 134, 93–101. [Google Scholar] [CrossRef] [PubMed]
- Li, Y.; Zou, C.; Berecibar, M.; Nanini-Maury, E.; Chan, J.C.W.; van den Bossche, P.; Van Mierlo, J.; Omar, N. Random Forest Regression for Online Capacity Estimation of Lithium-Ion Batteries. Appl. Energy 2018, 232, 197–210. [Google Scholar] [CrossRef]
- Breiman, L. Random Forests. Mach. Learn. 2001, 45, 5–32. [Google Scholar] [CrossRef]
Figure 1.
Capacity degradation curve of 10 tested cells.

Figure 2.
Voltage curve and IC curve after downgrade processing of B1 cell data. (a) Voltage curve; (b) IC curve.
Figure 2.
Voltage curve and IC curve after downgrade processing of B1 cell data. (a) Voltage curve; (b) IC curve.

Figure 3.
The evolution curves of the three extracted IC features with B1 battery degradation. (a) The peak height, (b) the peak position, and (c) the peak area surrounded by the curve and the axes in the voltage range from 3.6 V to 3.9 V as a function of the capacity; (d) the peak height, (e) the peak position, and (f) the peak area as a function of the charge–discharge cycle.

Figure 4.
The evolution of the voltage profile after the downgrade processing of B1 battery data.

Figure 5.
The evolution curves of voltage-based statistical features of the B1 battery with capacity degradation. (a) The mean of the voltage. (b) The variance of the voltage. (c) The skewness of the voltage. (d) The kurtosis of the voltage.
Figure 5.
The evolution curves of voltage-based statistical features of the B1 battery with capacity degradation. (a) The mean of the voltage. (b) The variance of the voltage. (c) The skewness of the voltage. (d) The kurtosis of the voltage.

Figure 6.
(a) Pearson correlation coefficient of the feature set of the B1 cell vs. capacity; (b) Pearson correlation coefficient of the feature set of all cells vs. capacity.
Figure 6.
(a) Pearson correlation coefficient of the feature set of the B1 cell vs. capacity; (b) Pearson correlation coefficient of the feature set of all cells vs. capacity.

Figure 7.
SOH estimation results for the validation set using SVR, BP, and RF. (a) B2 estimation results with errors. (b) B4 estimation results with errors. (c) B6 estimation results with errors. (d) B8 estimation results with errors. (e) B10 estimation results with errors.
Figure 7.
SOH estimation results for the validation set using SVR, BP, and RF. (a) B2 estimation results with errors. (b) B4 estimation results with errors. (c) B6 estimation results with errors. (d) B8 estimation results with errors. (e) B10 estimation results with errors.

Figure 8.
Statistical results of SOH estimation for the validation set with different cells. (a) RMSE error; (b) ME error.
Figure 8.
Statistical results of SOH estimation for the validation set with different cells. (a) RMSE error; (b) ME error.

Figure 9.
Comparison of SOH estimation results from three different feature set inputs. (a) Estimation results and errors for the B4 cell using the SVR algorithm. (b) Estimation results and errors for the B4 cell using the BP algorithm. (c) Estimation results and errors for the B4 cell using the RF algorithm. (d) Error bars of all cells.


Table 1.
Battery aging experimental conditions.
| Battery Number | Test Temperature (°C) | Charge–Discharge Rate (C) |
|---|---|---|
| B1, B2 | 25 | 1–1 |
| B3, B4 | 45 | 1–1 |
| B5, B6 | 10 | 1–1 |
| B7, B8 | 25 | 0.5–1 |
| B9, B10 | 25 | 1–1.5 |
Table 2.
Statistical feature calculation formula.
| Statistics | Formula |
|---|---|
| Mean | |
| Variance | |
| Skewness | |
| Kurtosis |
Table 3.
RMSE statistics for three feature sets in three ML algorithms.
| Type of Features | SVR | BP | RF |
|---|---|---|---|
| IC-based features | 0.64% | 0.61% | 0.44% |
| Voltage-based features | 2.59% | 2.14% | 0.61% |
| Proposed features | 0.52% | 0.36% | 0.43% |
Disclaimer/Publisher’s Note: The statements, opinions and data contained in all publications are solely those of the individual author(s) and contributor(s) and not of MDPI and/or the editor(s). MDPI and/or the editor(s) disclaim responsibility for any injury to people or property resulting from any ideas, methods, instructions or products referred to in the content. |
© 2024 by the authors. Licensee MDPI, Basel, Switzerland. This article is an open access article distributed under the terms and conditions of the Creative Commons Attribution (CC BY) license (https://creativecommons.org/licenses/by/4.0/).
Share and Cite
MDPI and ACS Style
Wang, J.; Zhang, C.; Meng, X.; Zhang, L.; Li, X.; Zhang, W. A Novel Feature Engineering-Based SOH Estimation Method for Lithium-Ion Battery with Downgraded Laboratory Data. Batteries 2024, 10, 139. https://doi.org/10.3390/batteries10040139
AMA Style
Wang J, Zhang C, Meng X, Zhang L, Li X, Zhang W. A Novel Feature Engineering-Based SOH Estimation Method for Lithium-Ion Battery with Downgraded Laboratory Data. Batteries. 2024; 10(4):139. https://doi.org/10.3390/batteries10040139
Chicago/Turabian StyleWang, Jinyu, Caiping Zhang, Xiangfeng Meng, Linjing Zhang, Xu Li, and Weige Zhang. 2024. "A Novel Feature Engineering-Based SOH Estimation Method for Lithium-Ion Battery with Downgraded Laboratory Data" Batteries 10, no. 4: 139. https://doi.org/10.3390/batteries10040139
Note that from the first issue of 2016, this journal uses article numbers instead of page numbers. See further details here.