
Mechanical Measurement Approach to Characterize Venting Behavior during Thermal Runaway of 18650 Format Lithium-Ion Batteries

Abstract
:
1. Introduction
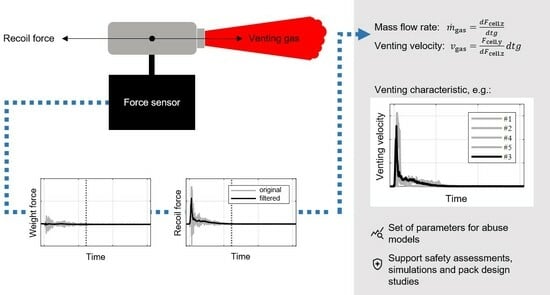
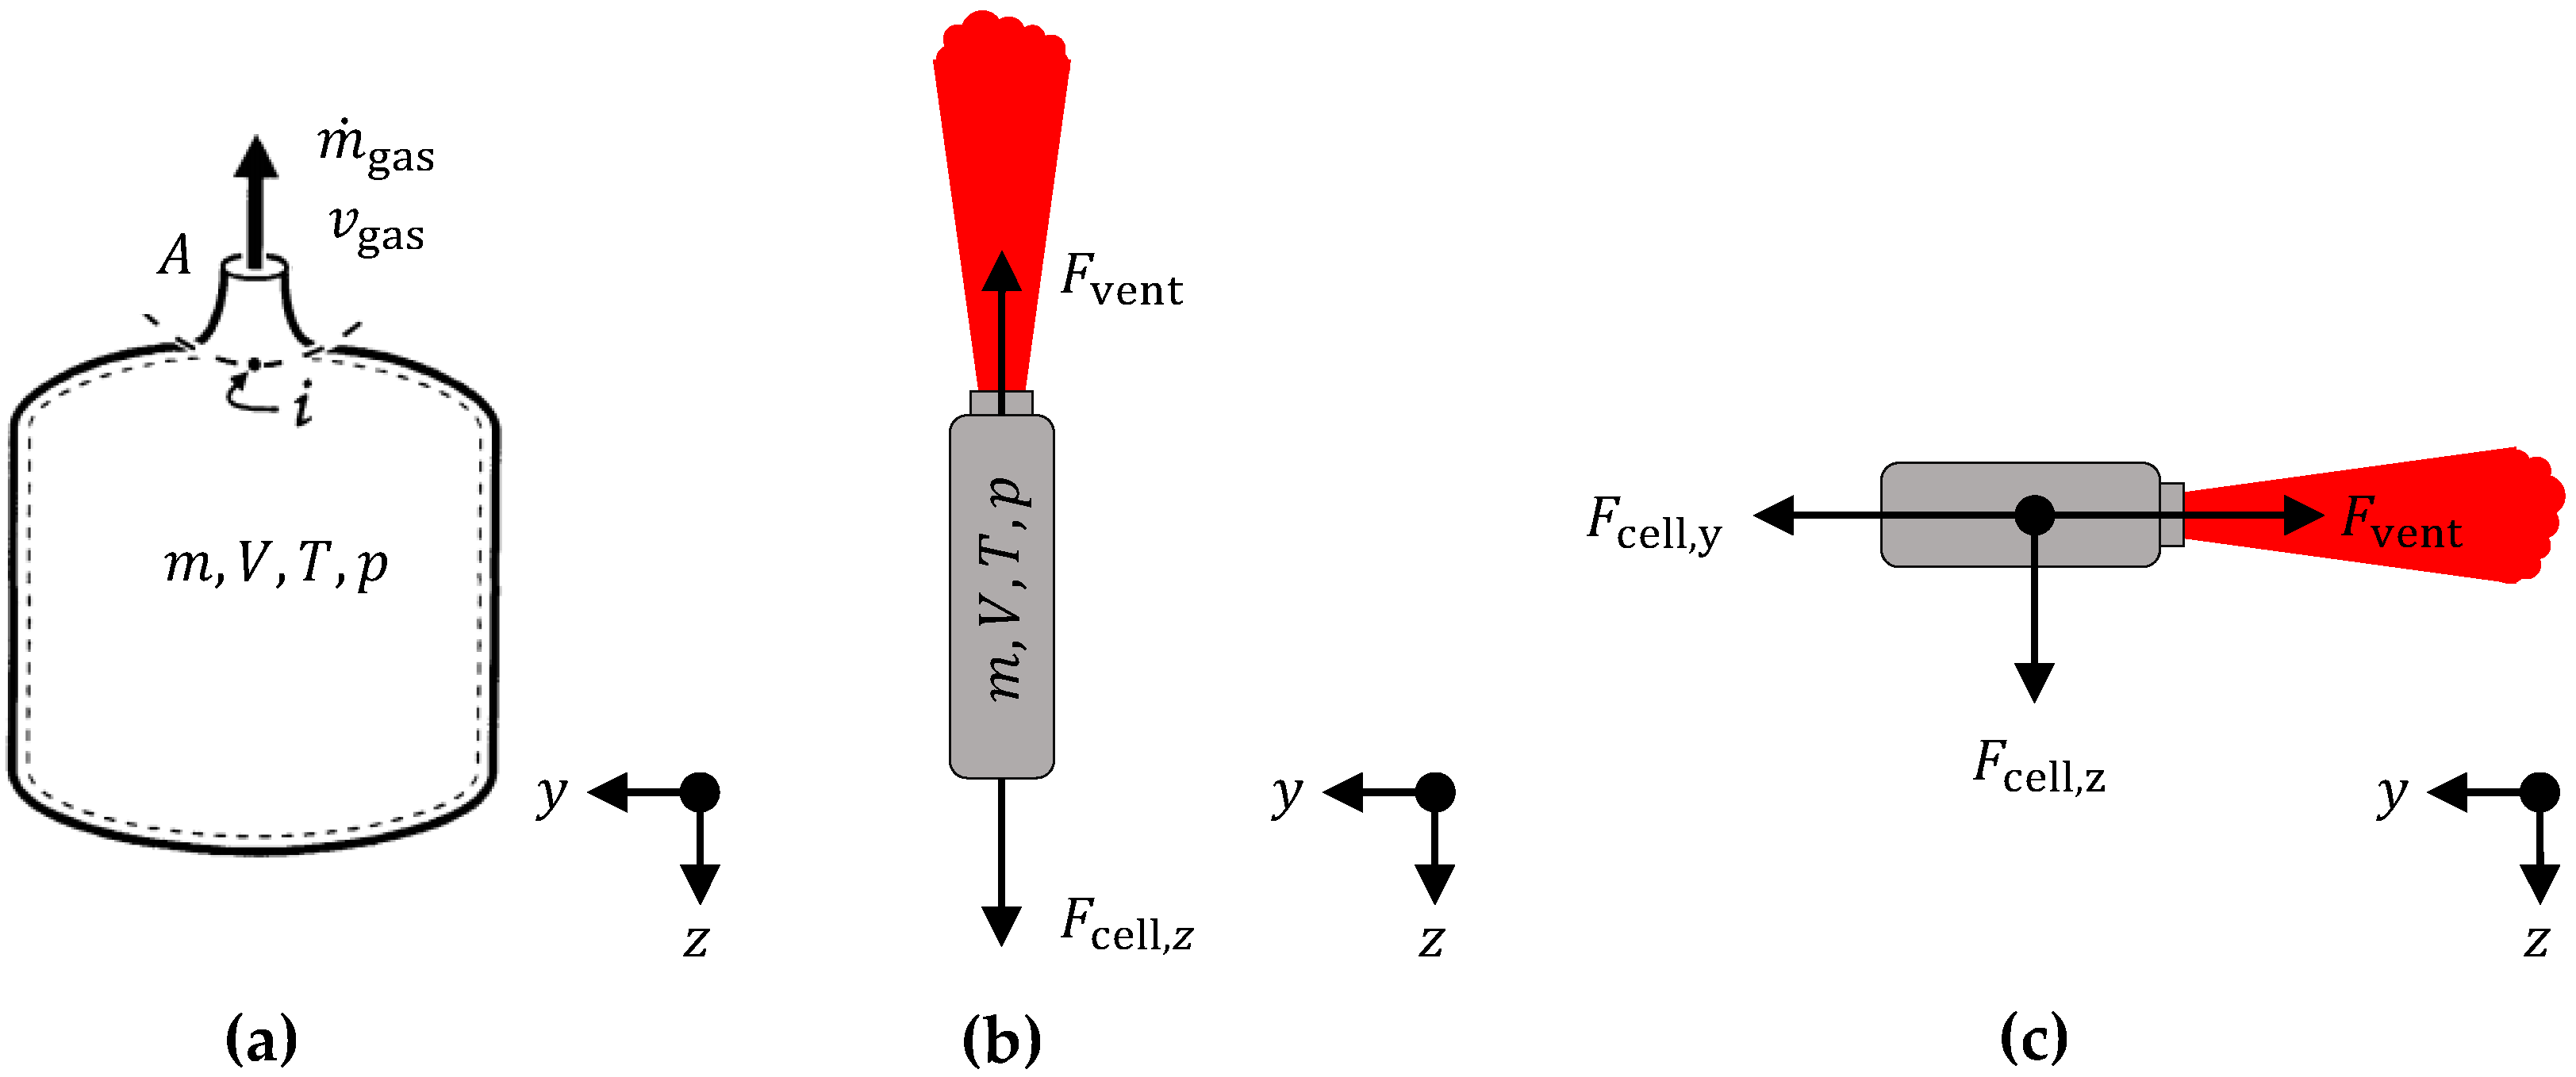
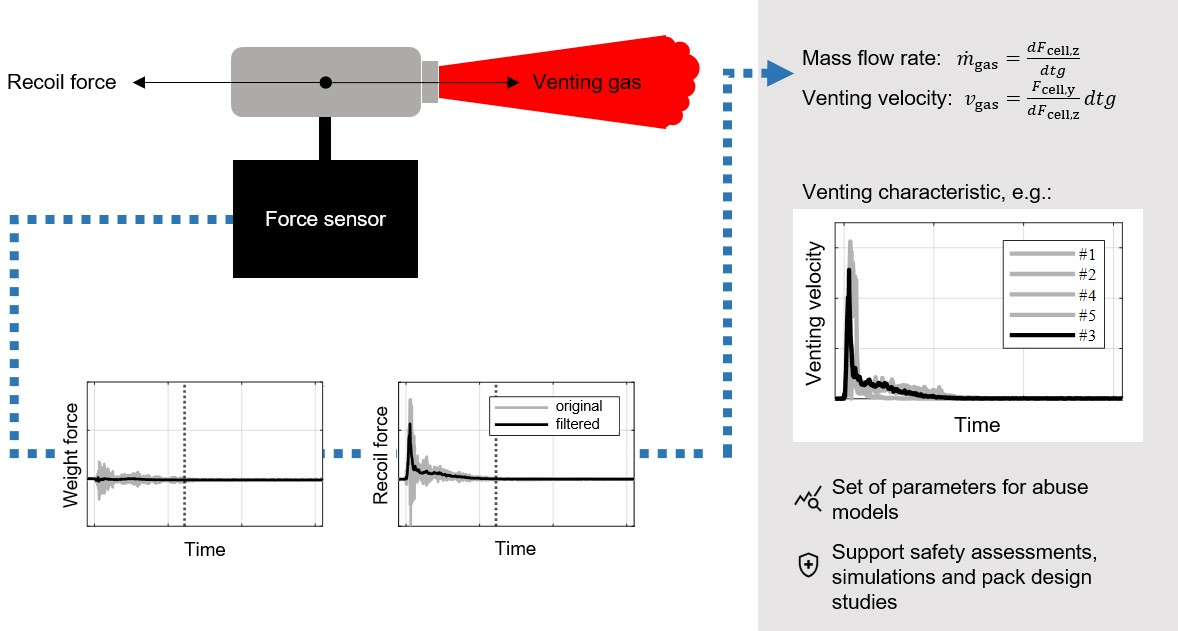
2. Theoretical Approach
3. Experimental
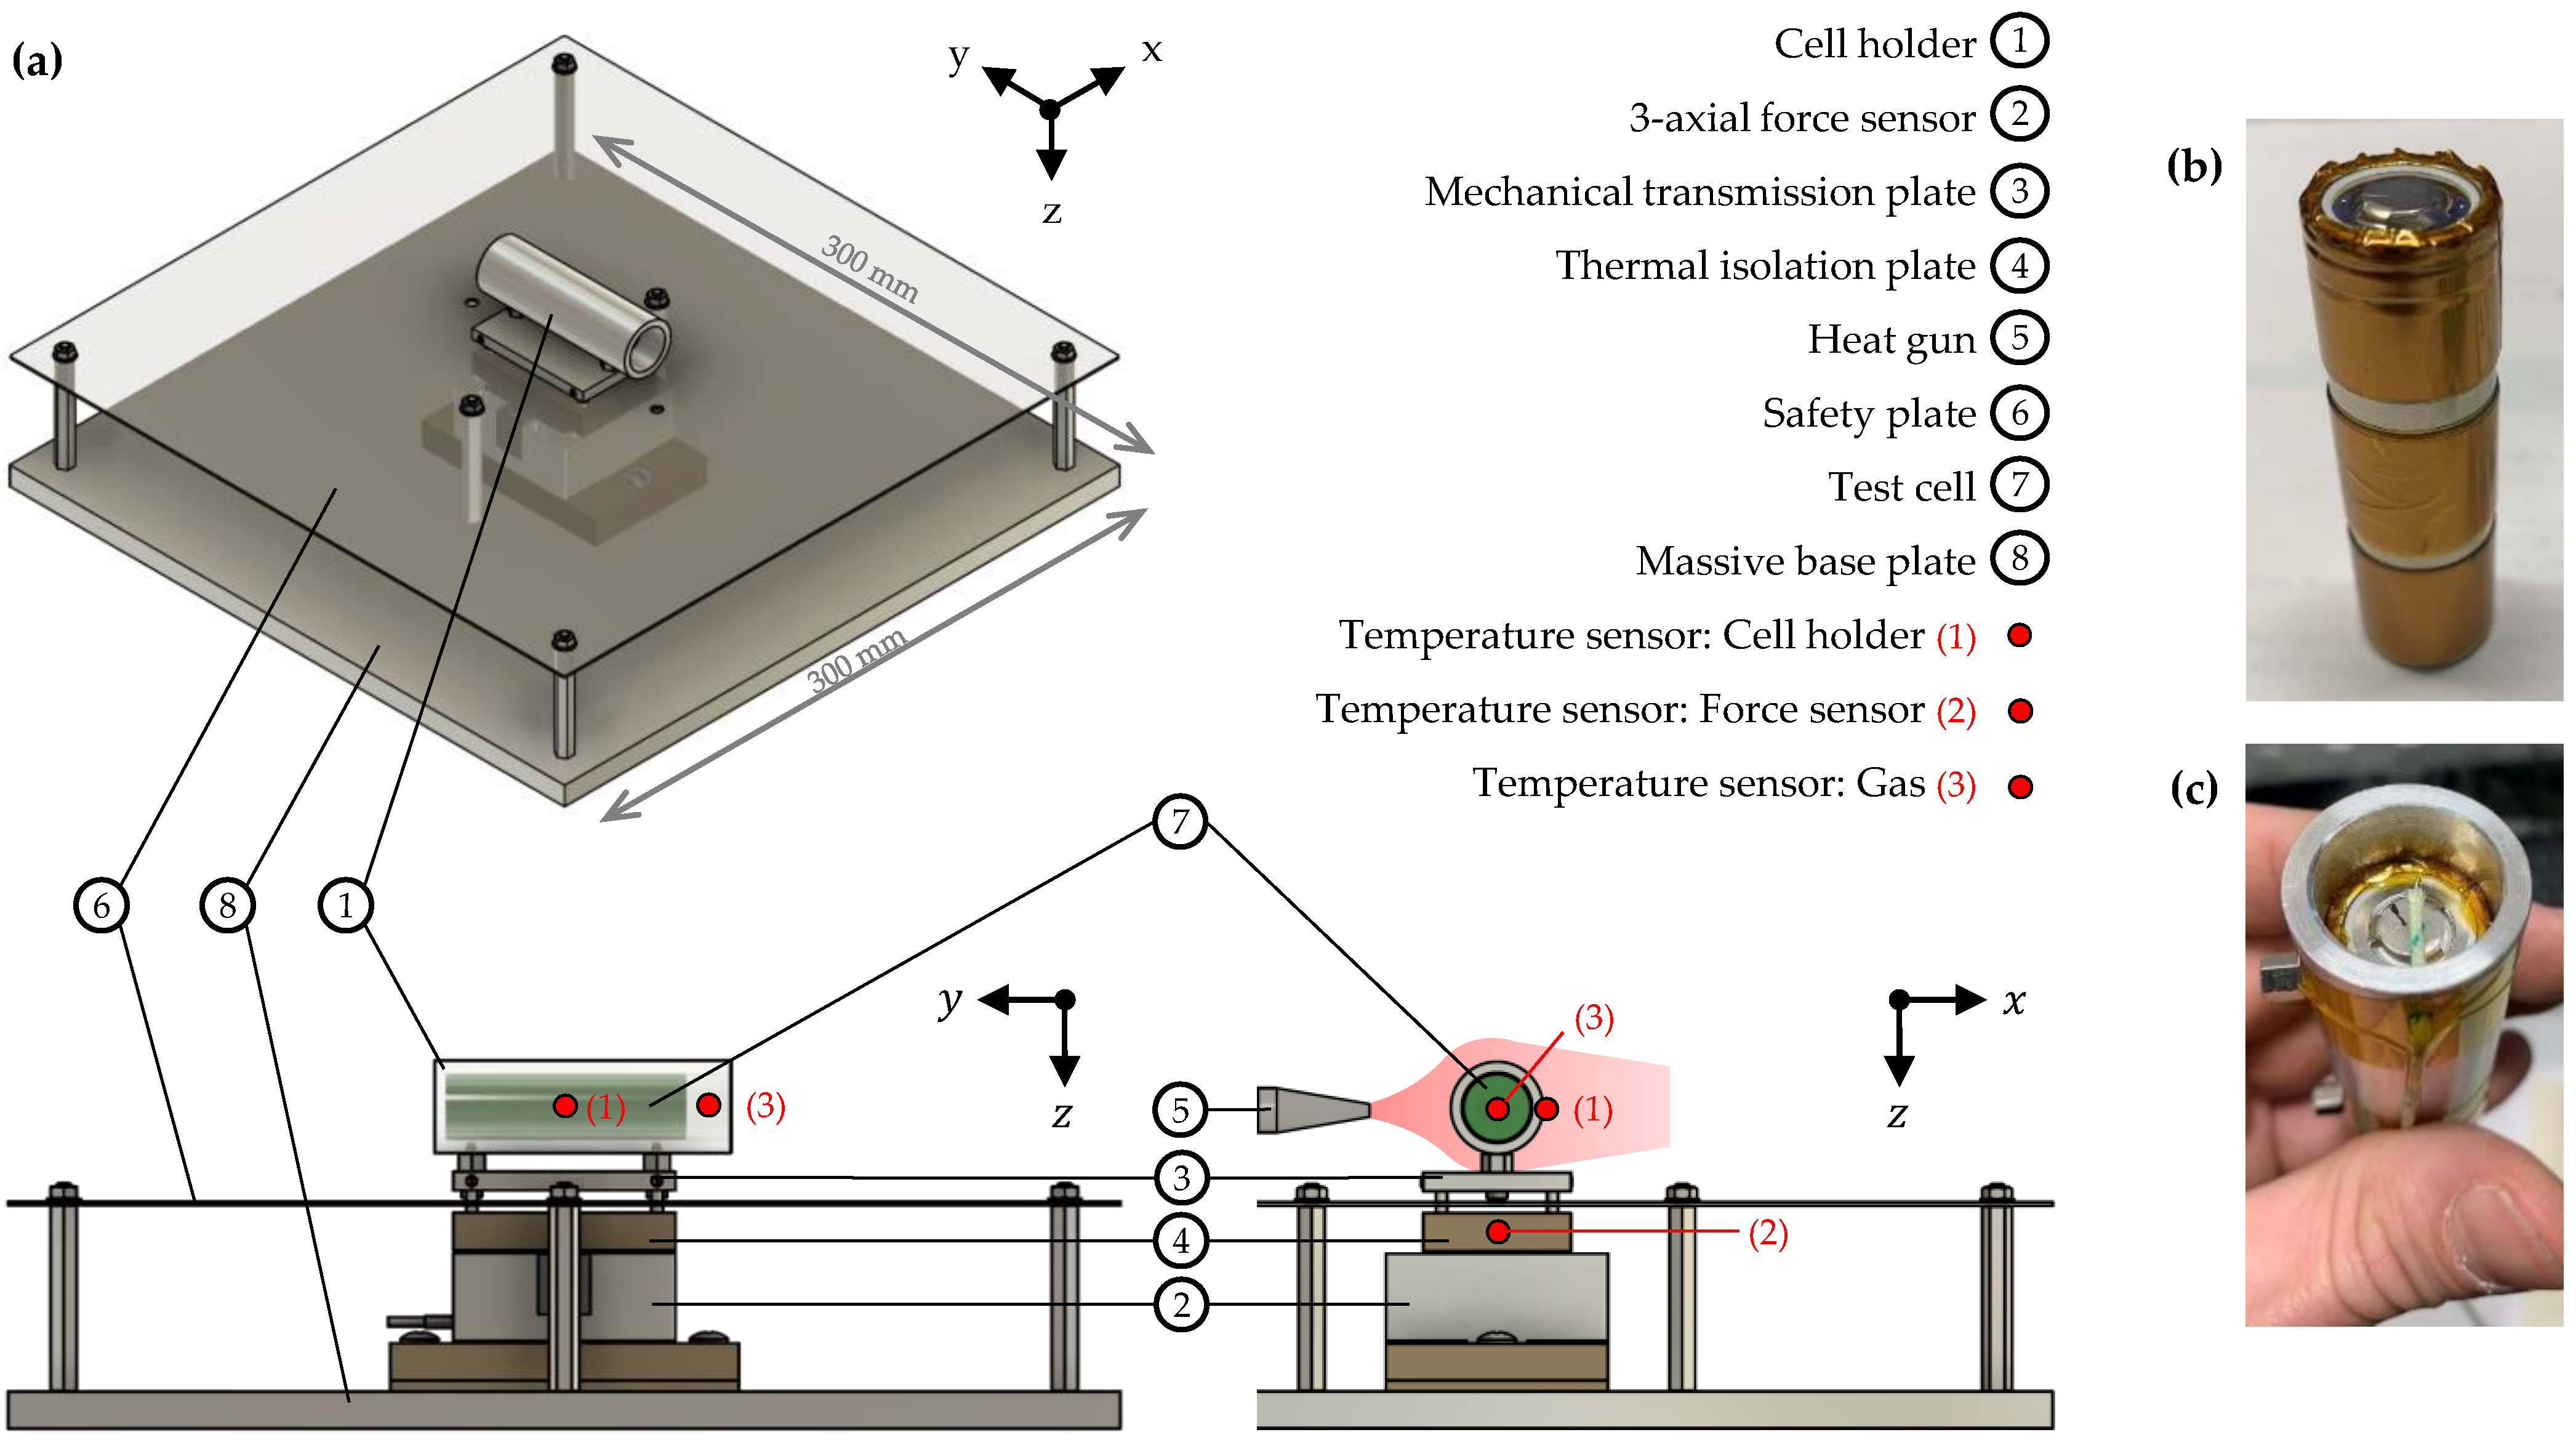
3.1. Test Bench
3.2. Test Cells and Test Procedure
4. Results
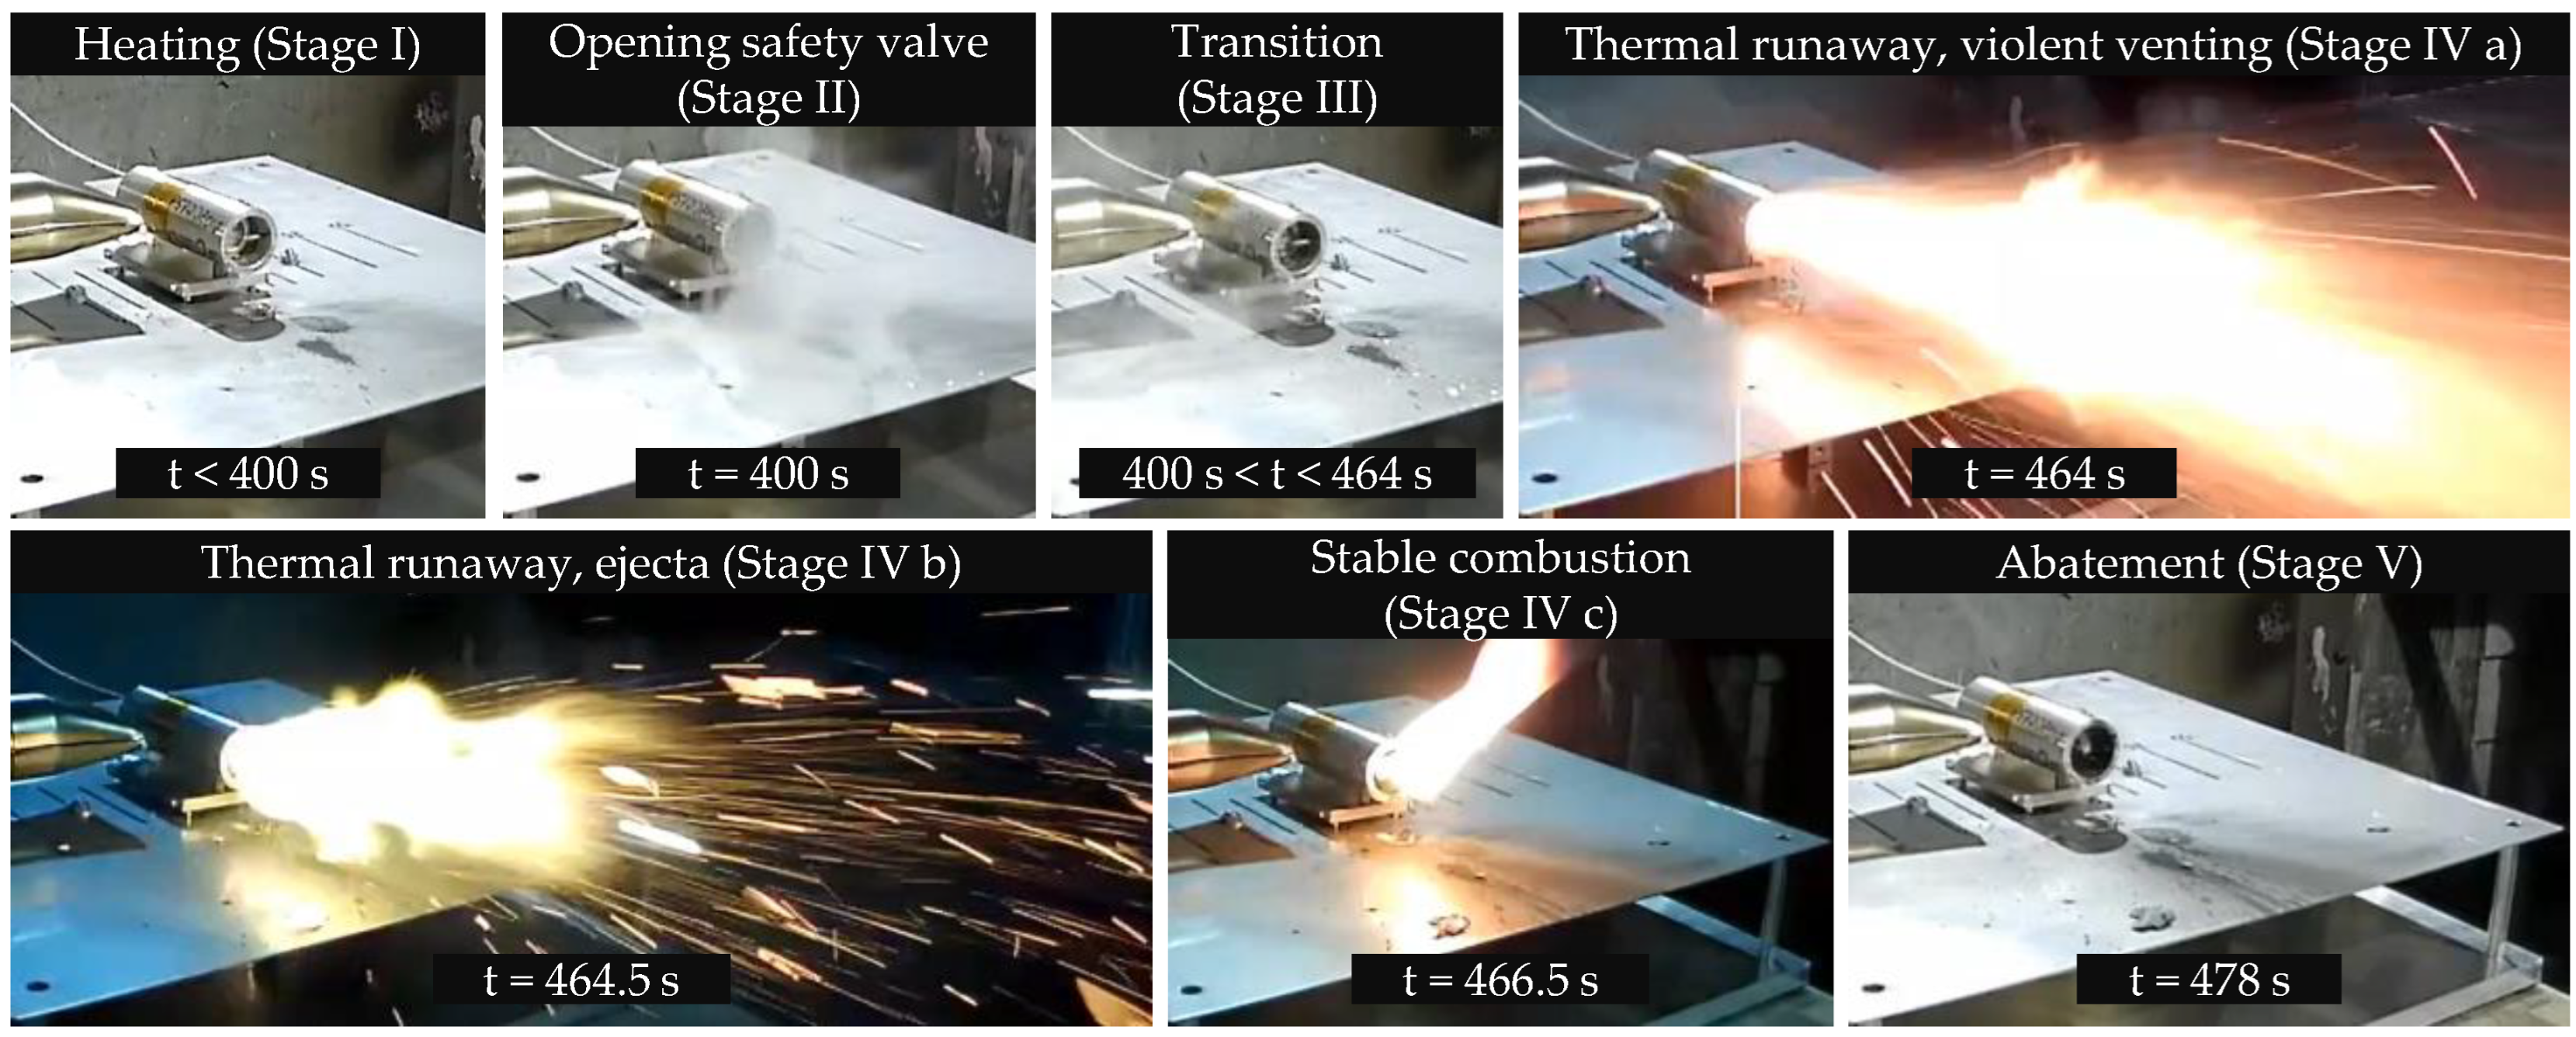
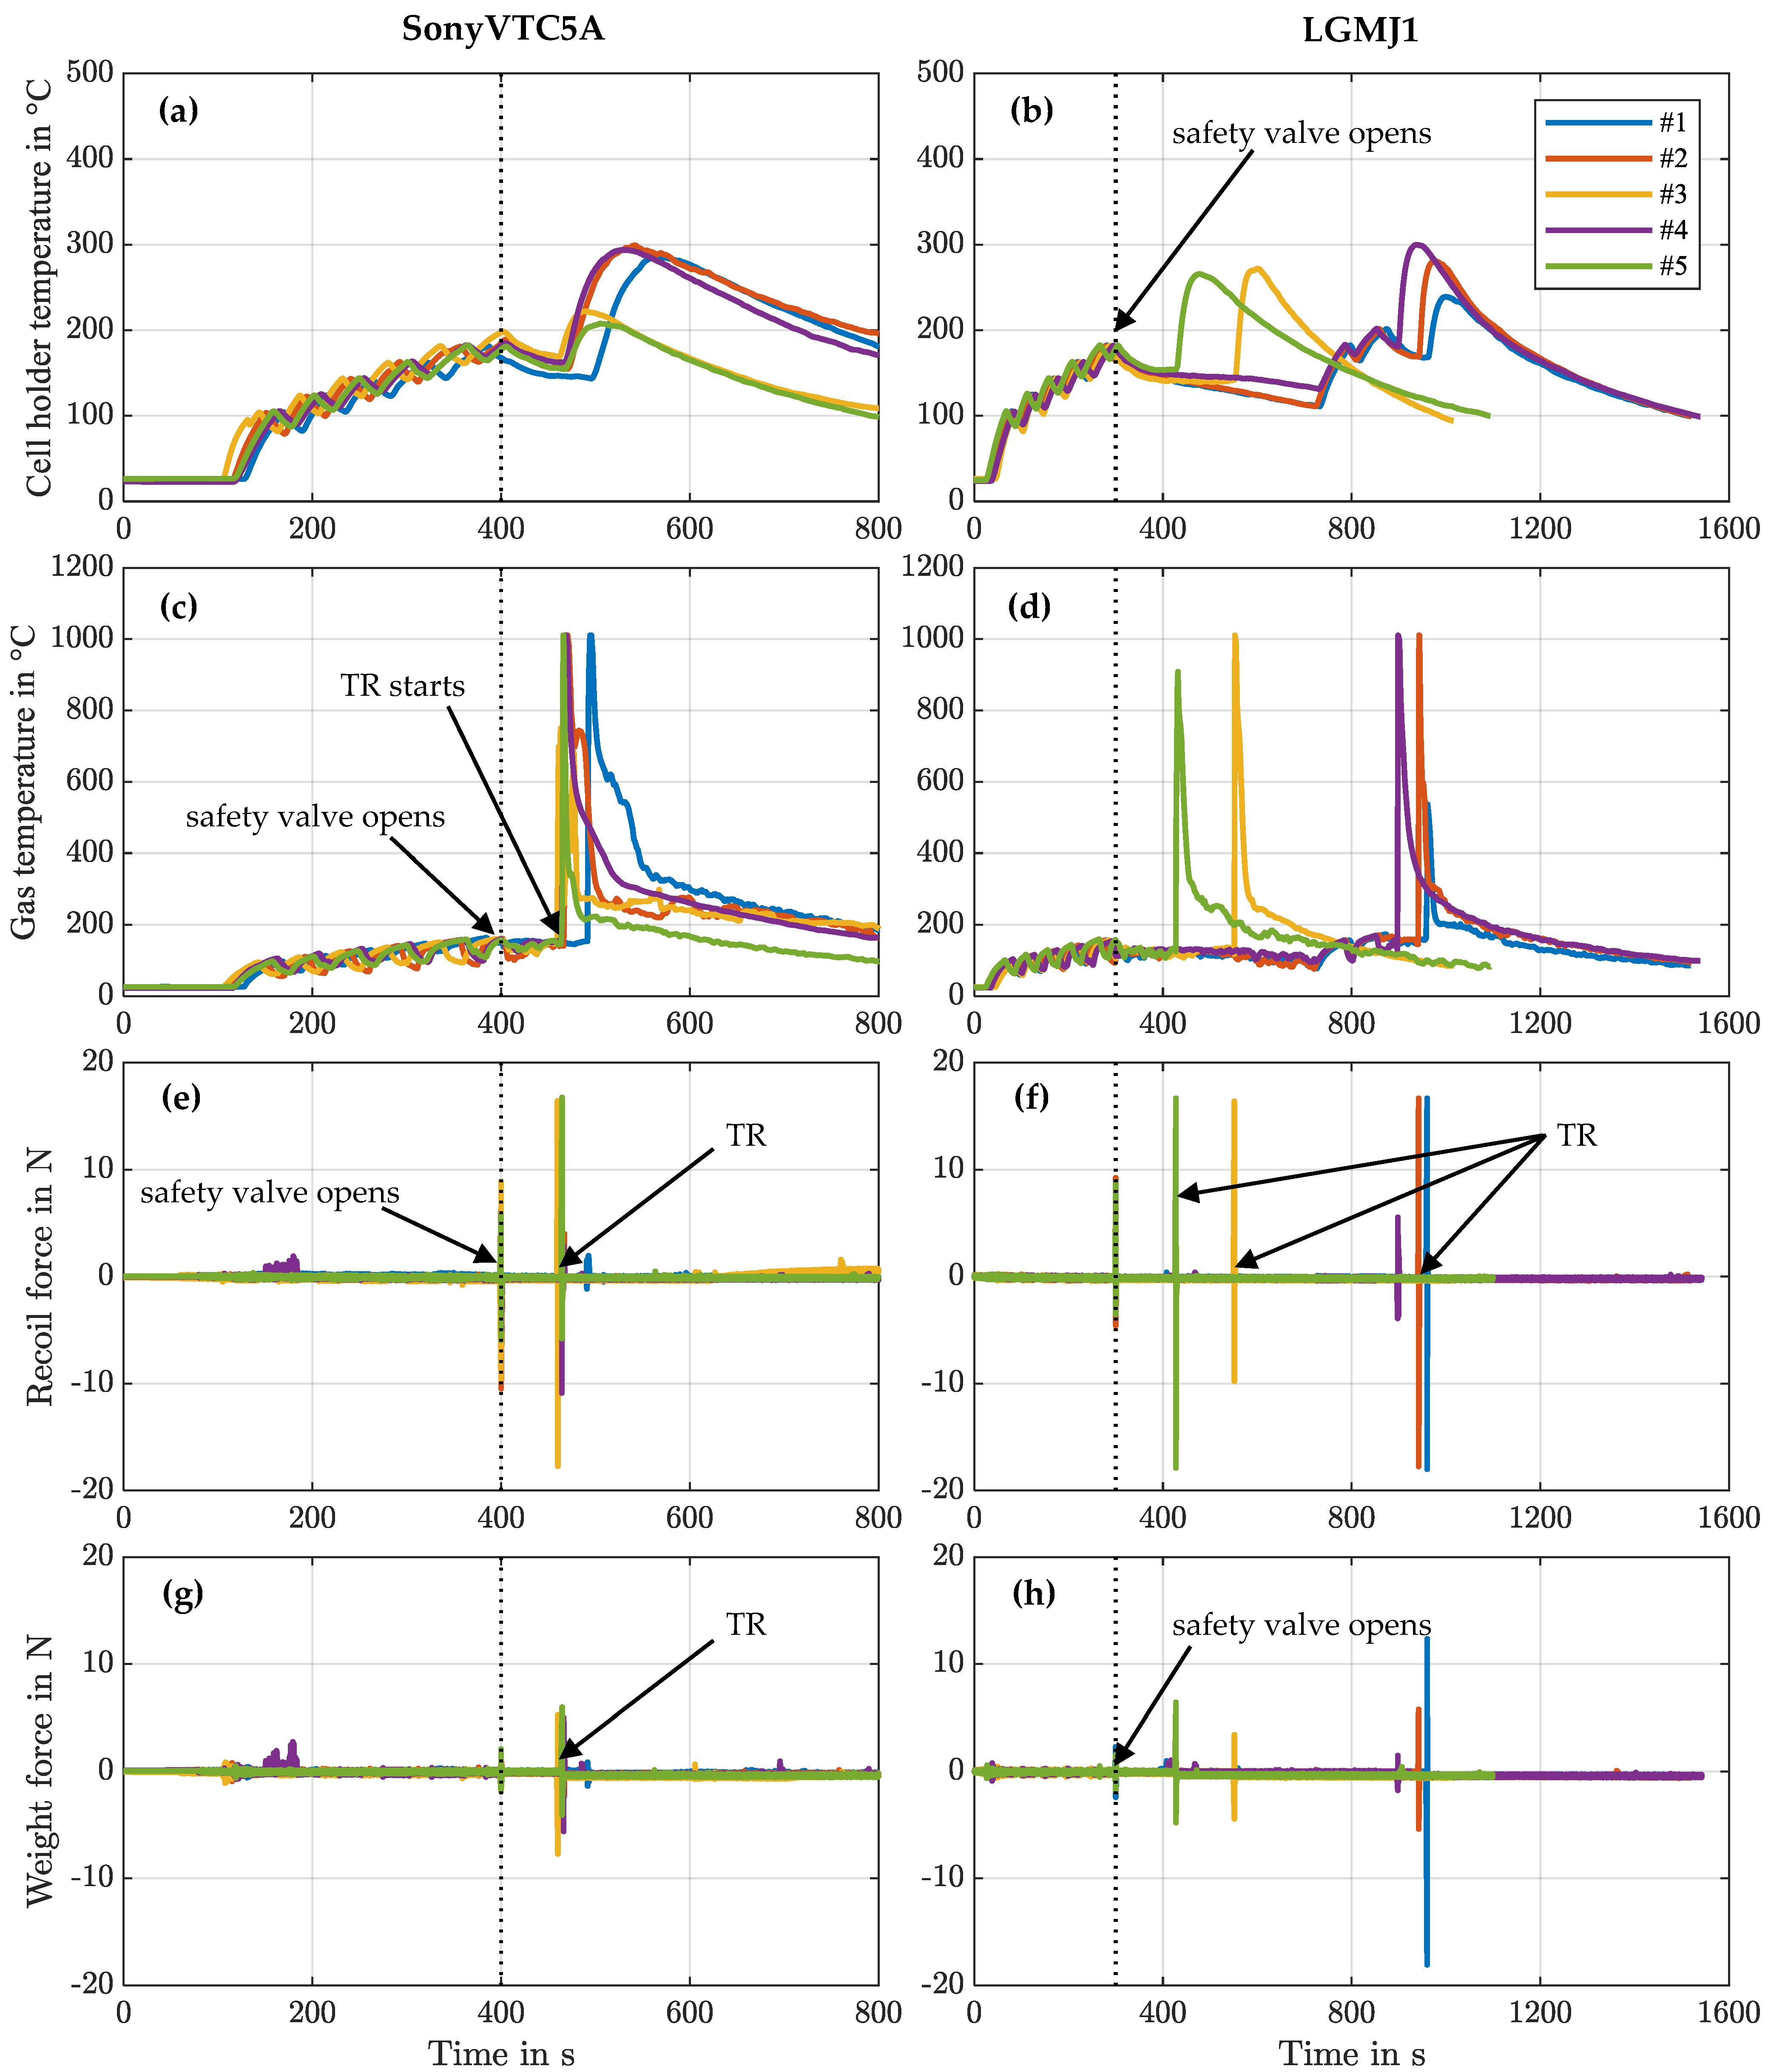
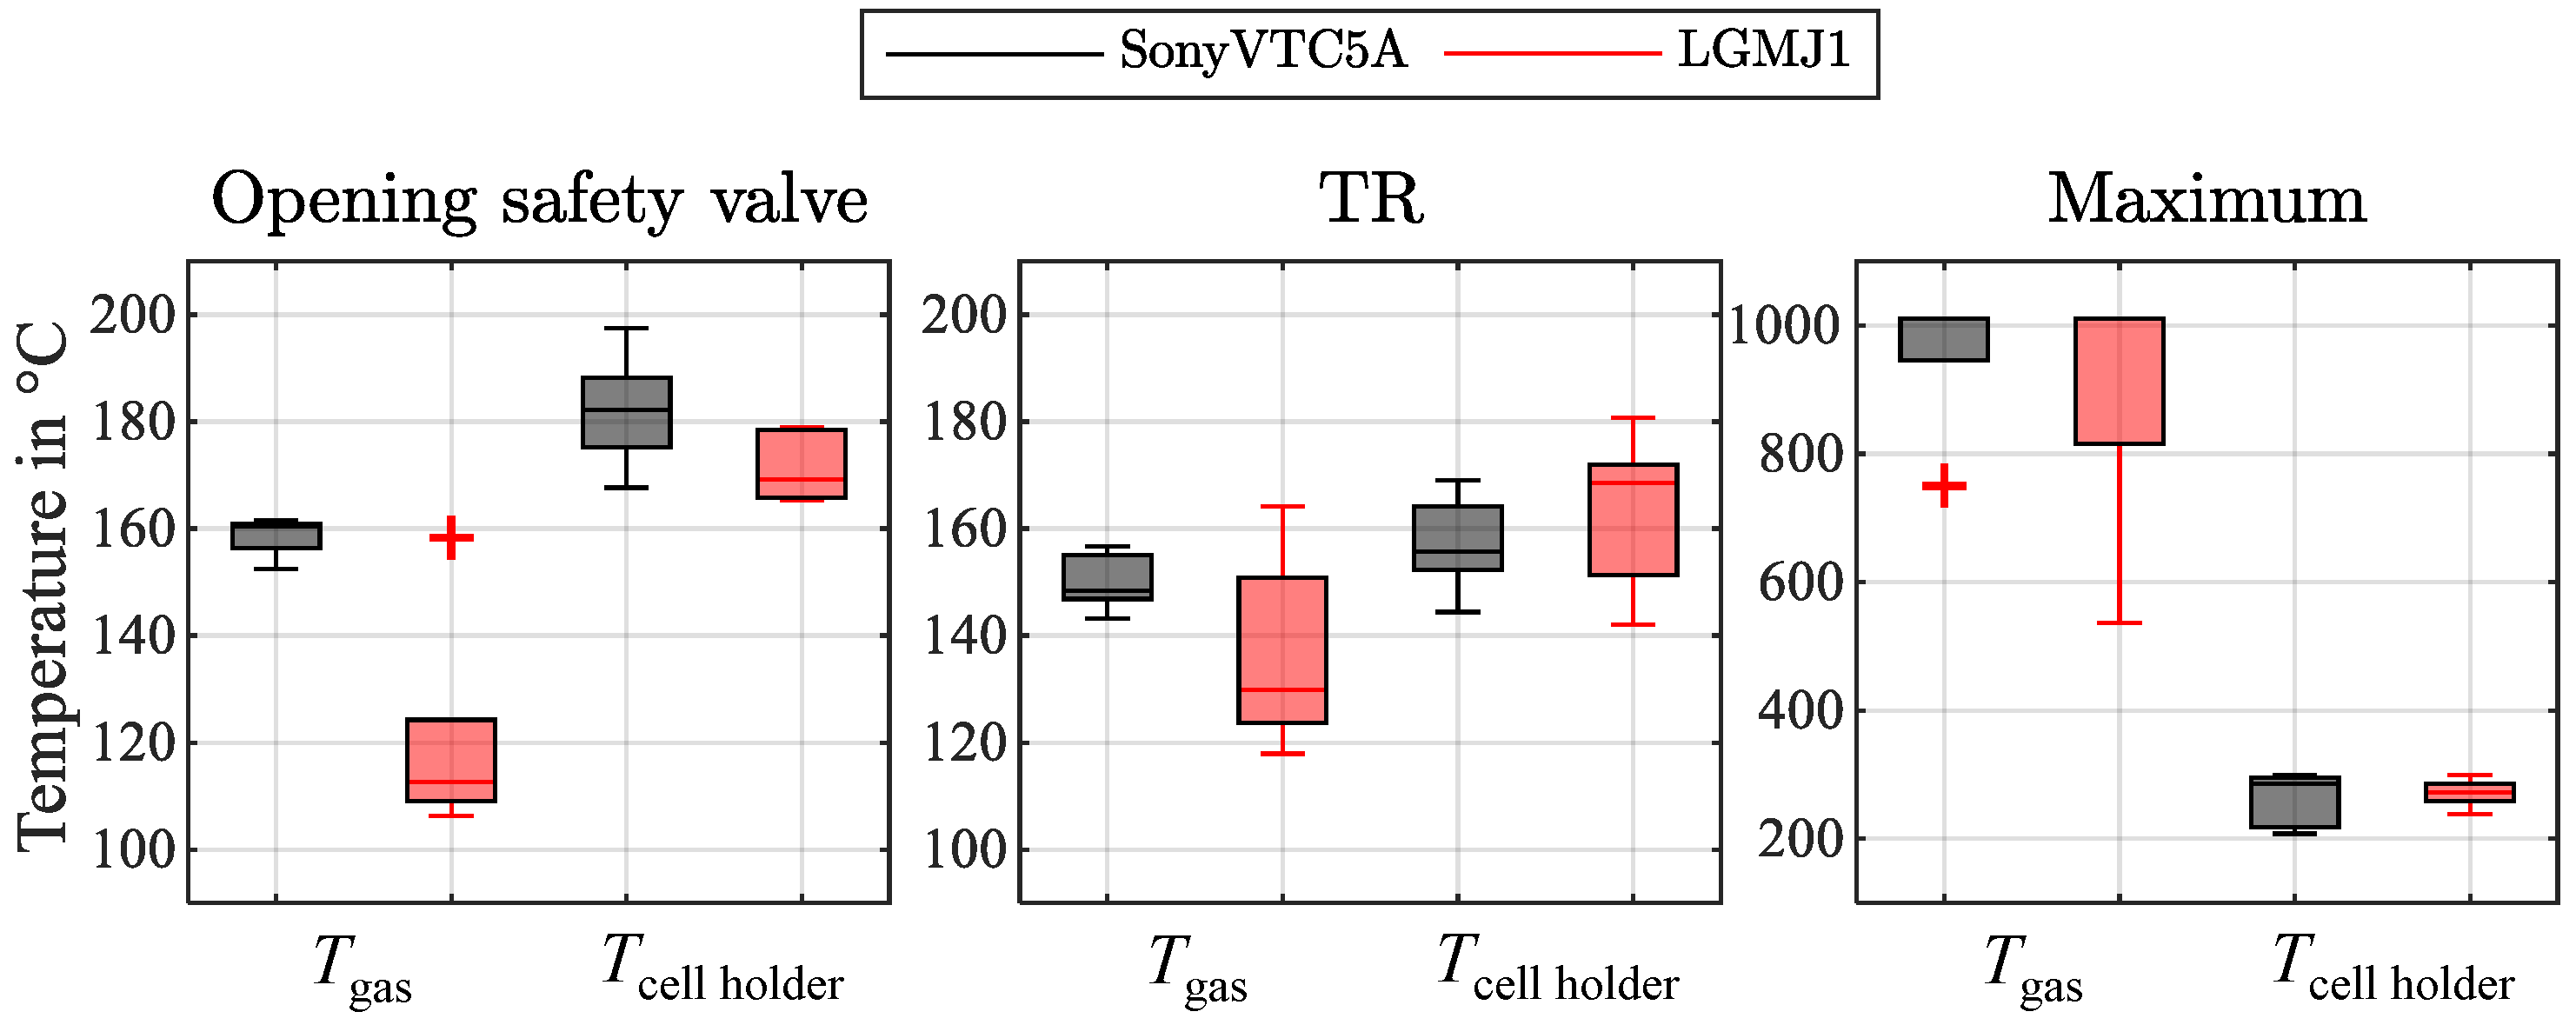
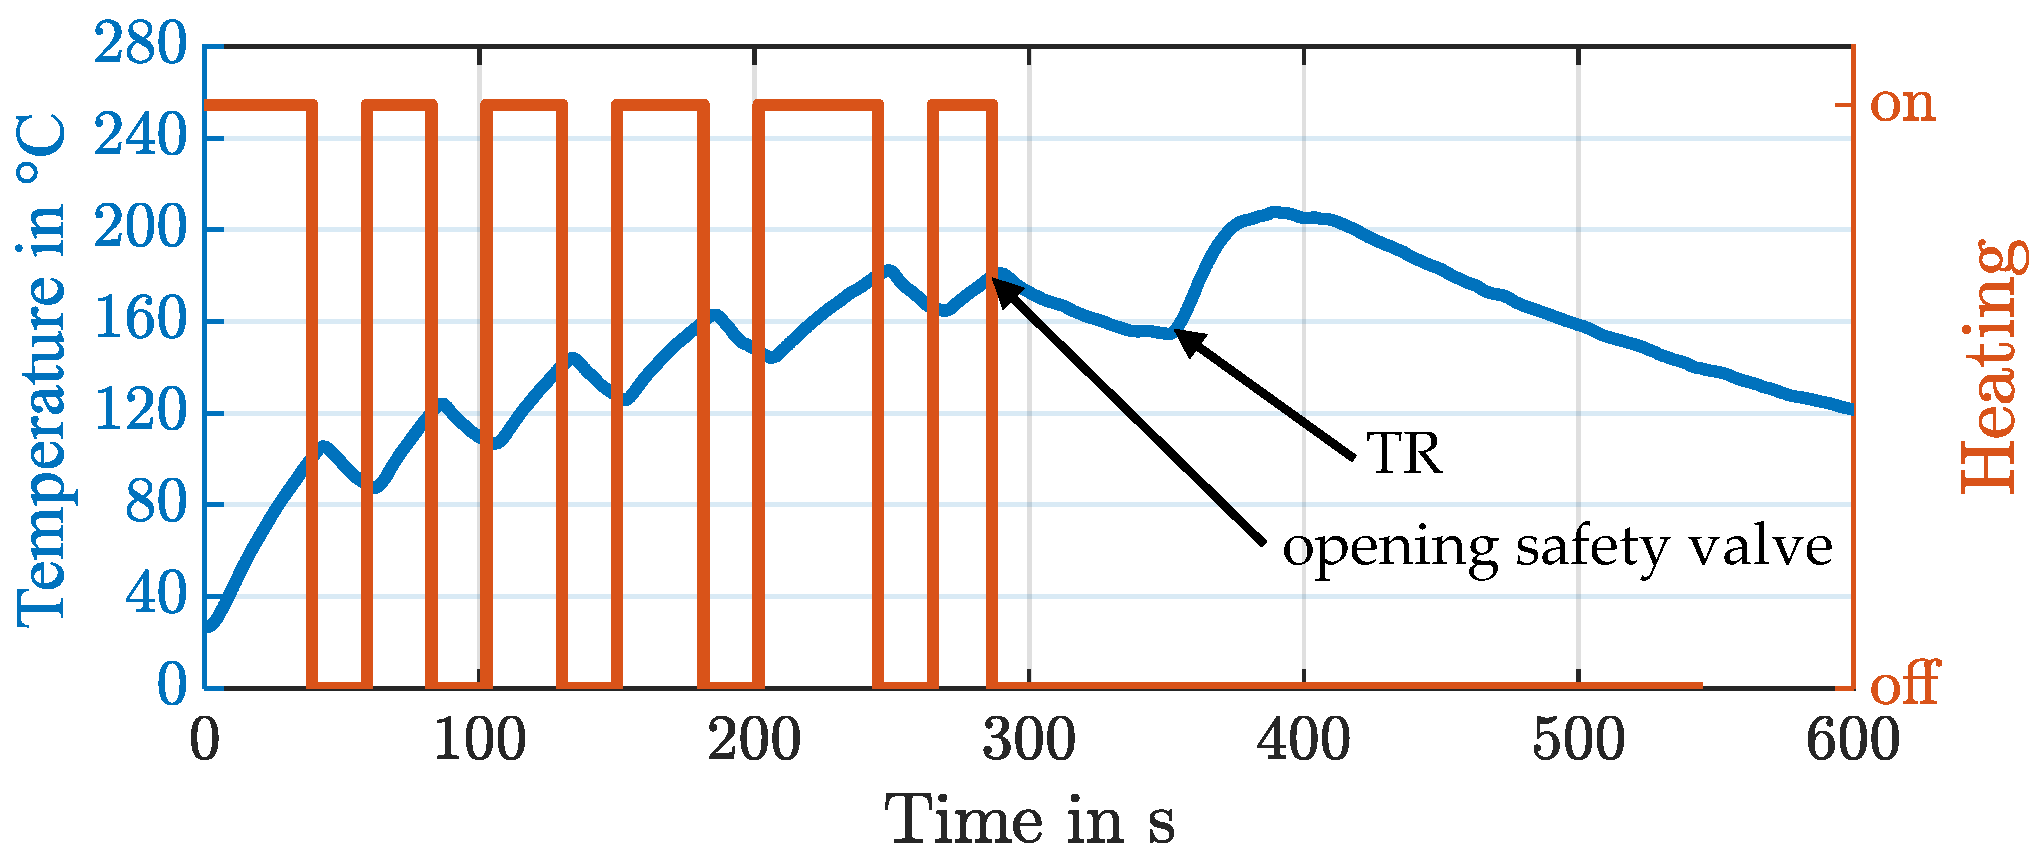
4.1. Overheating and Initiation of Thermal Runaway
4.2. Observed Mass Loss
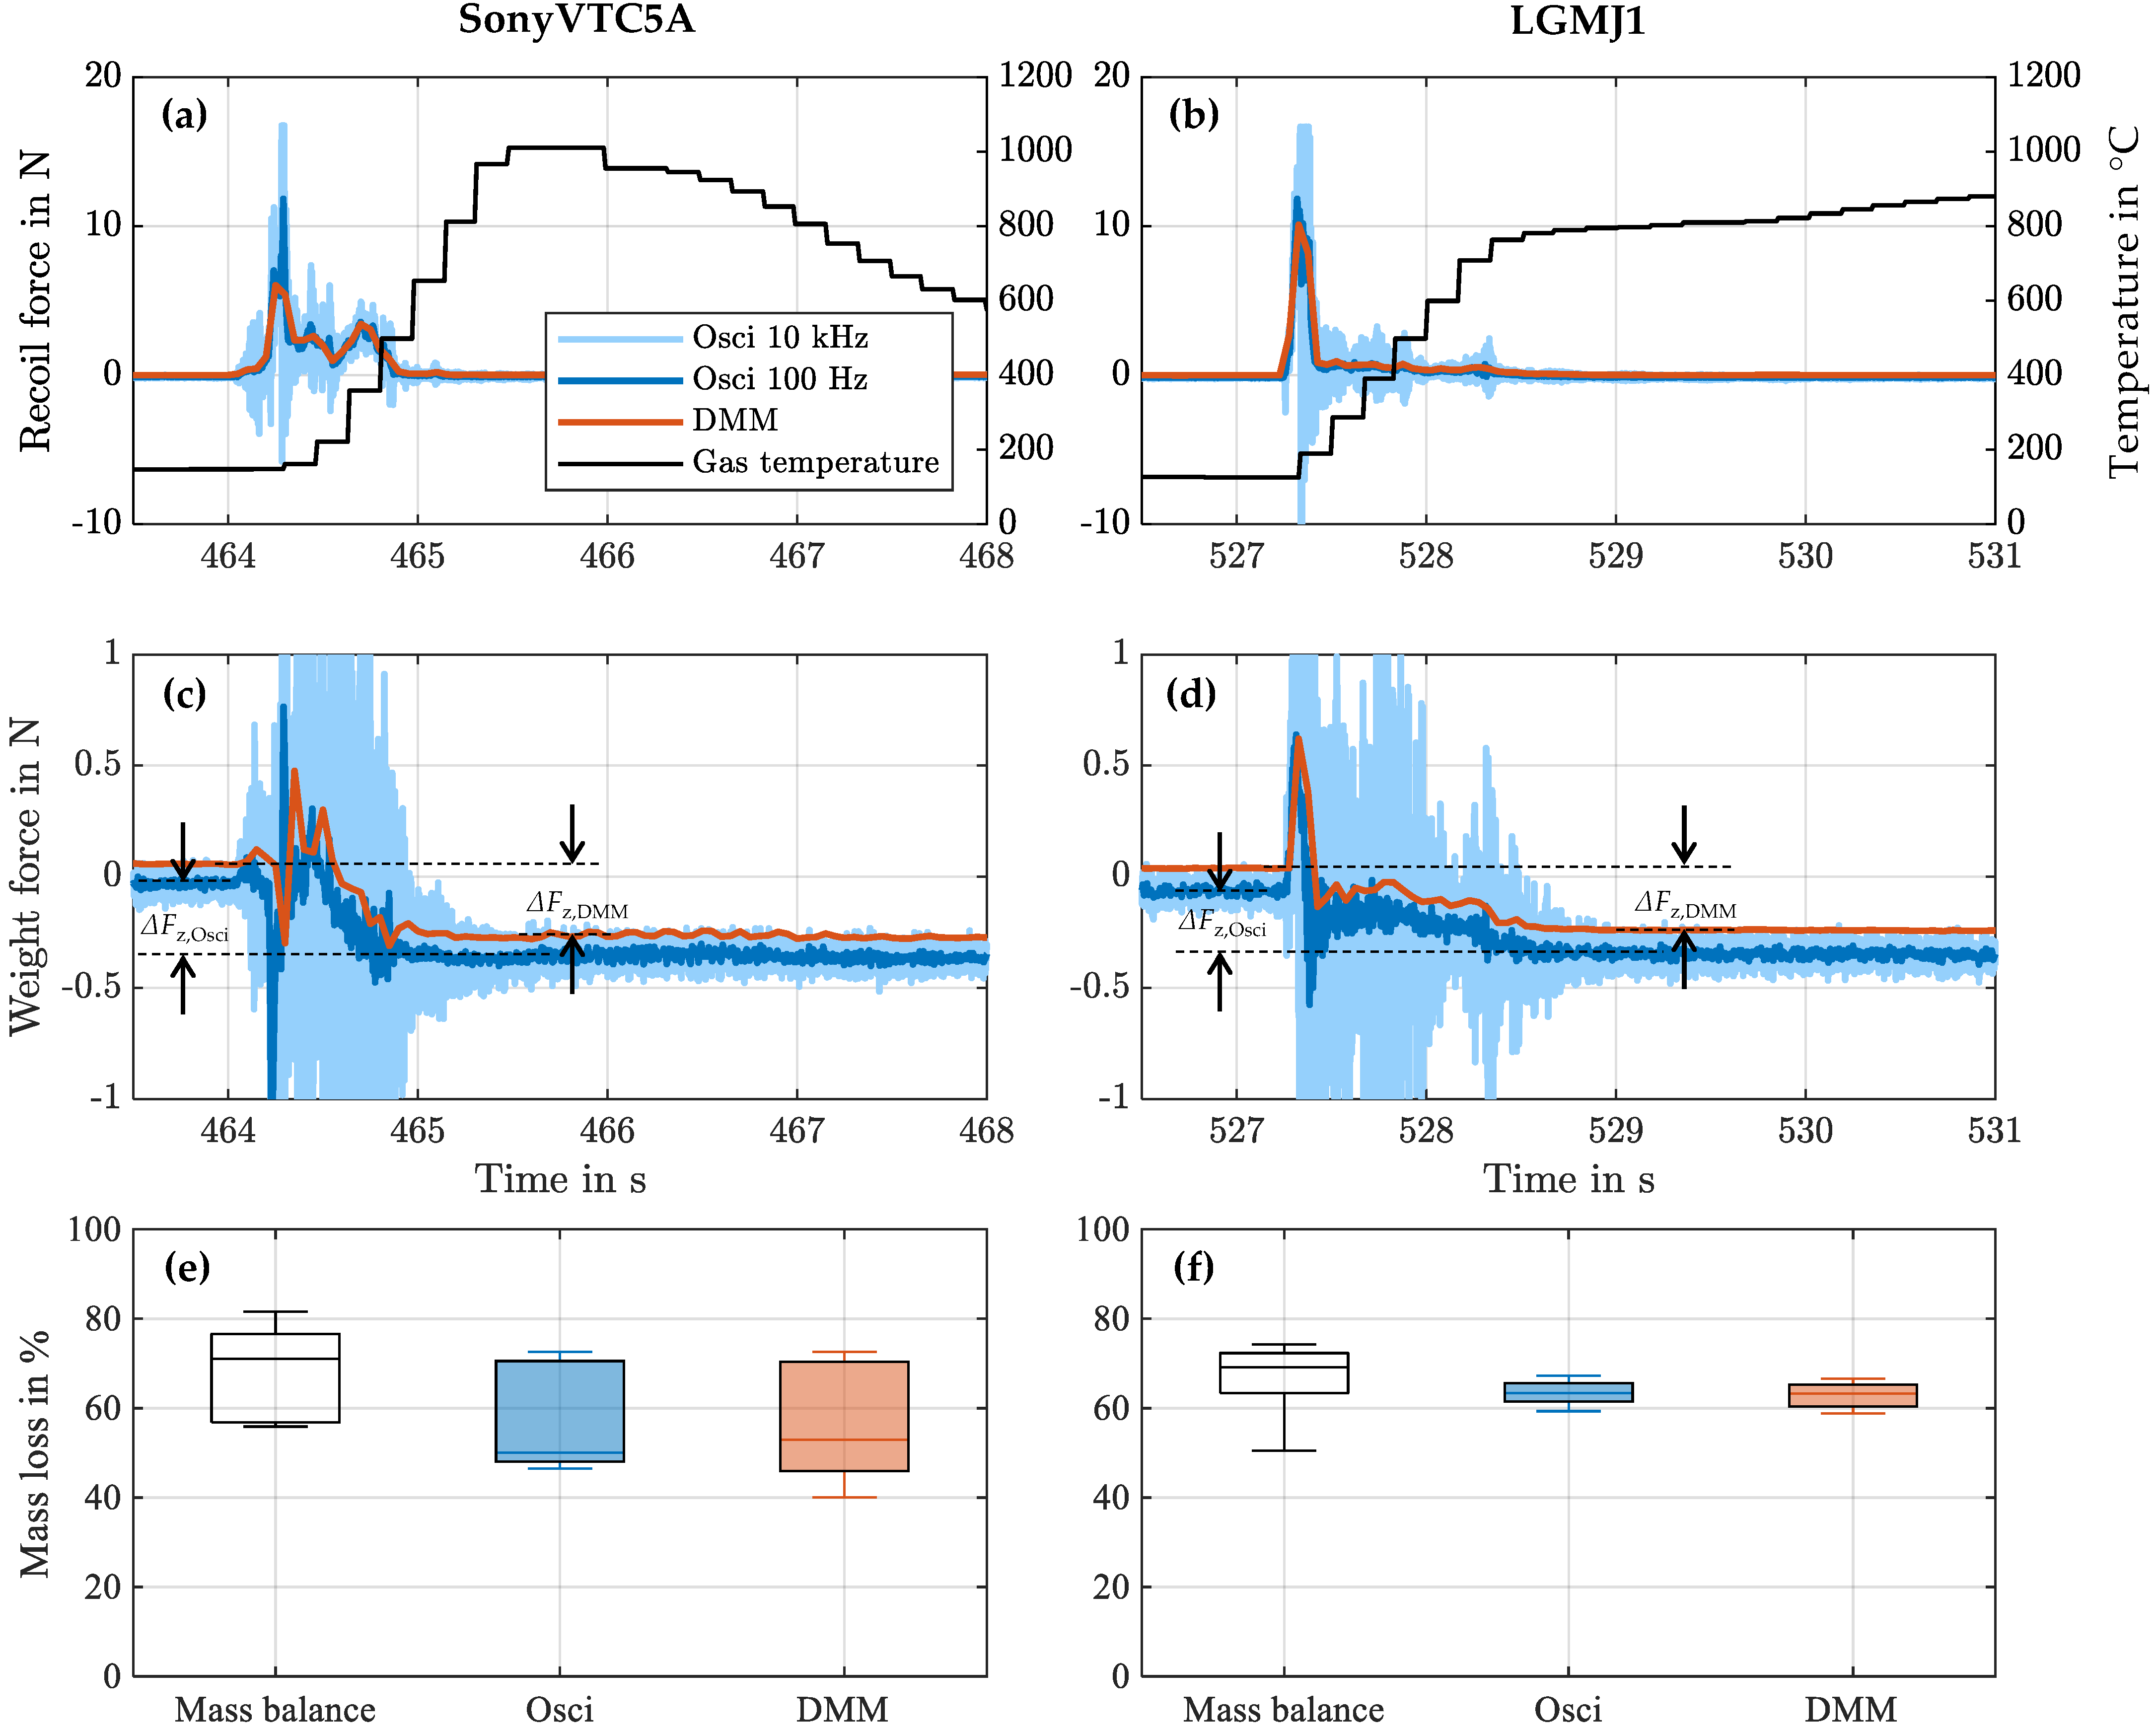
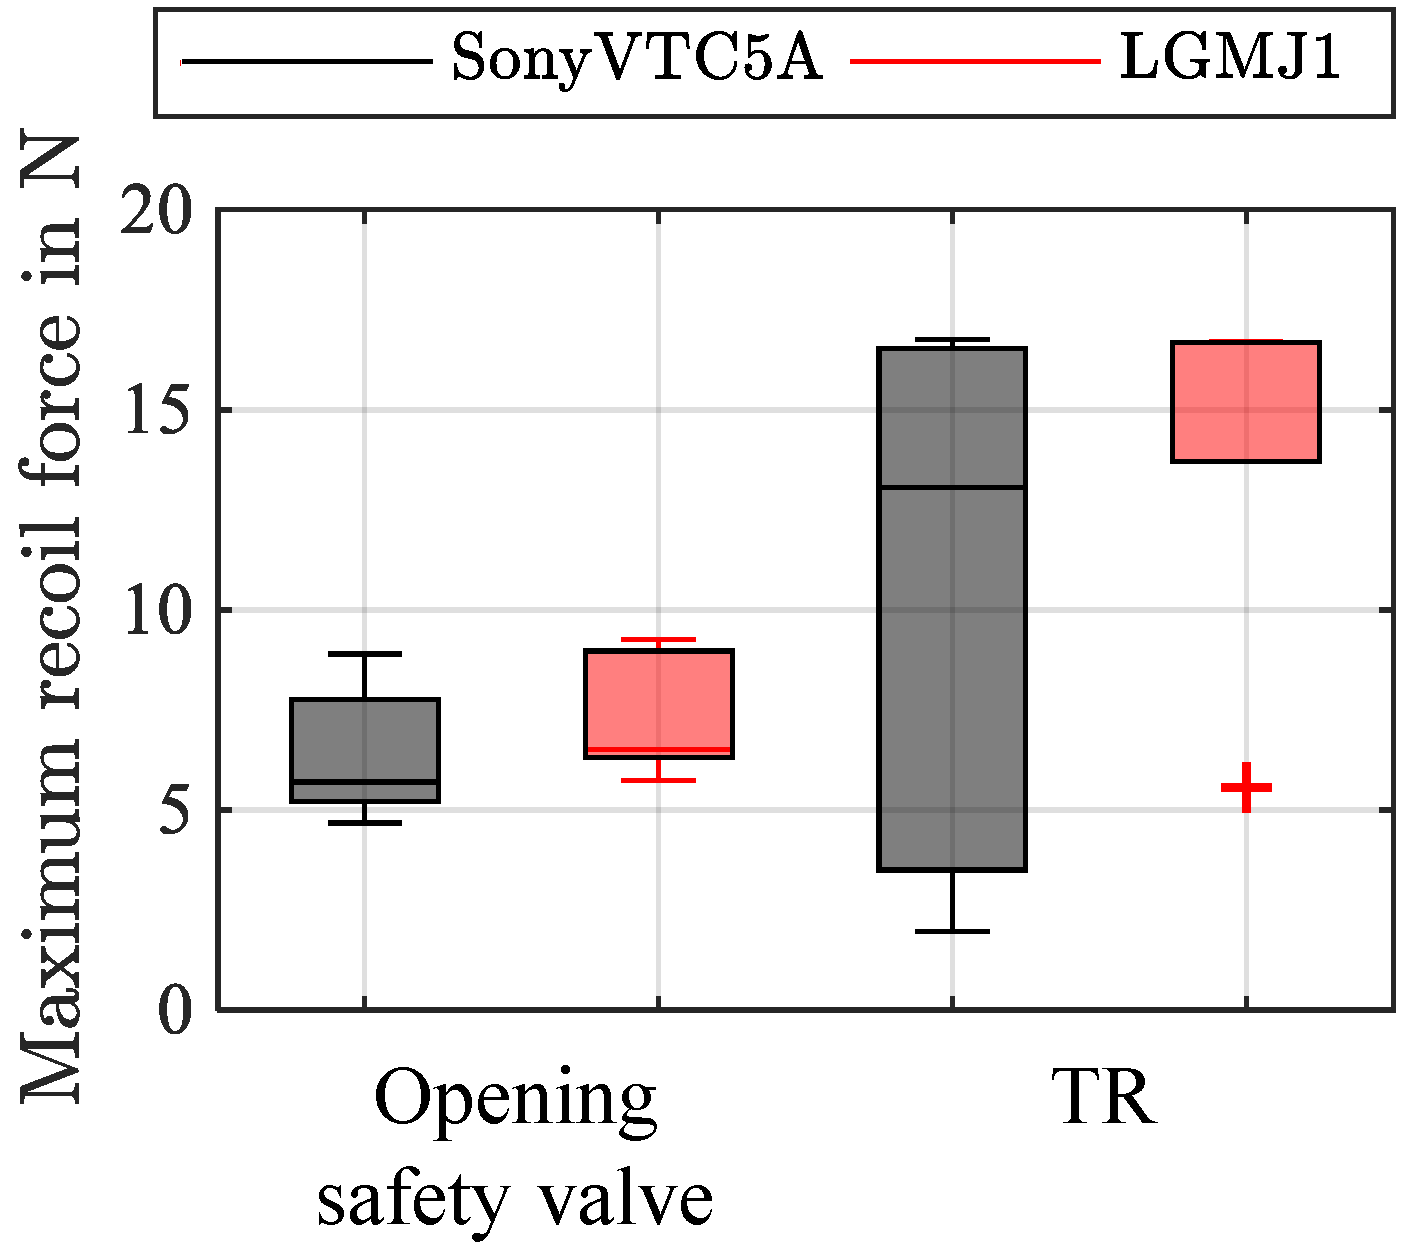
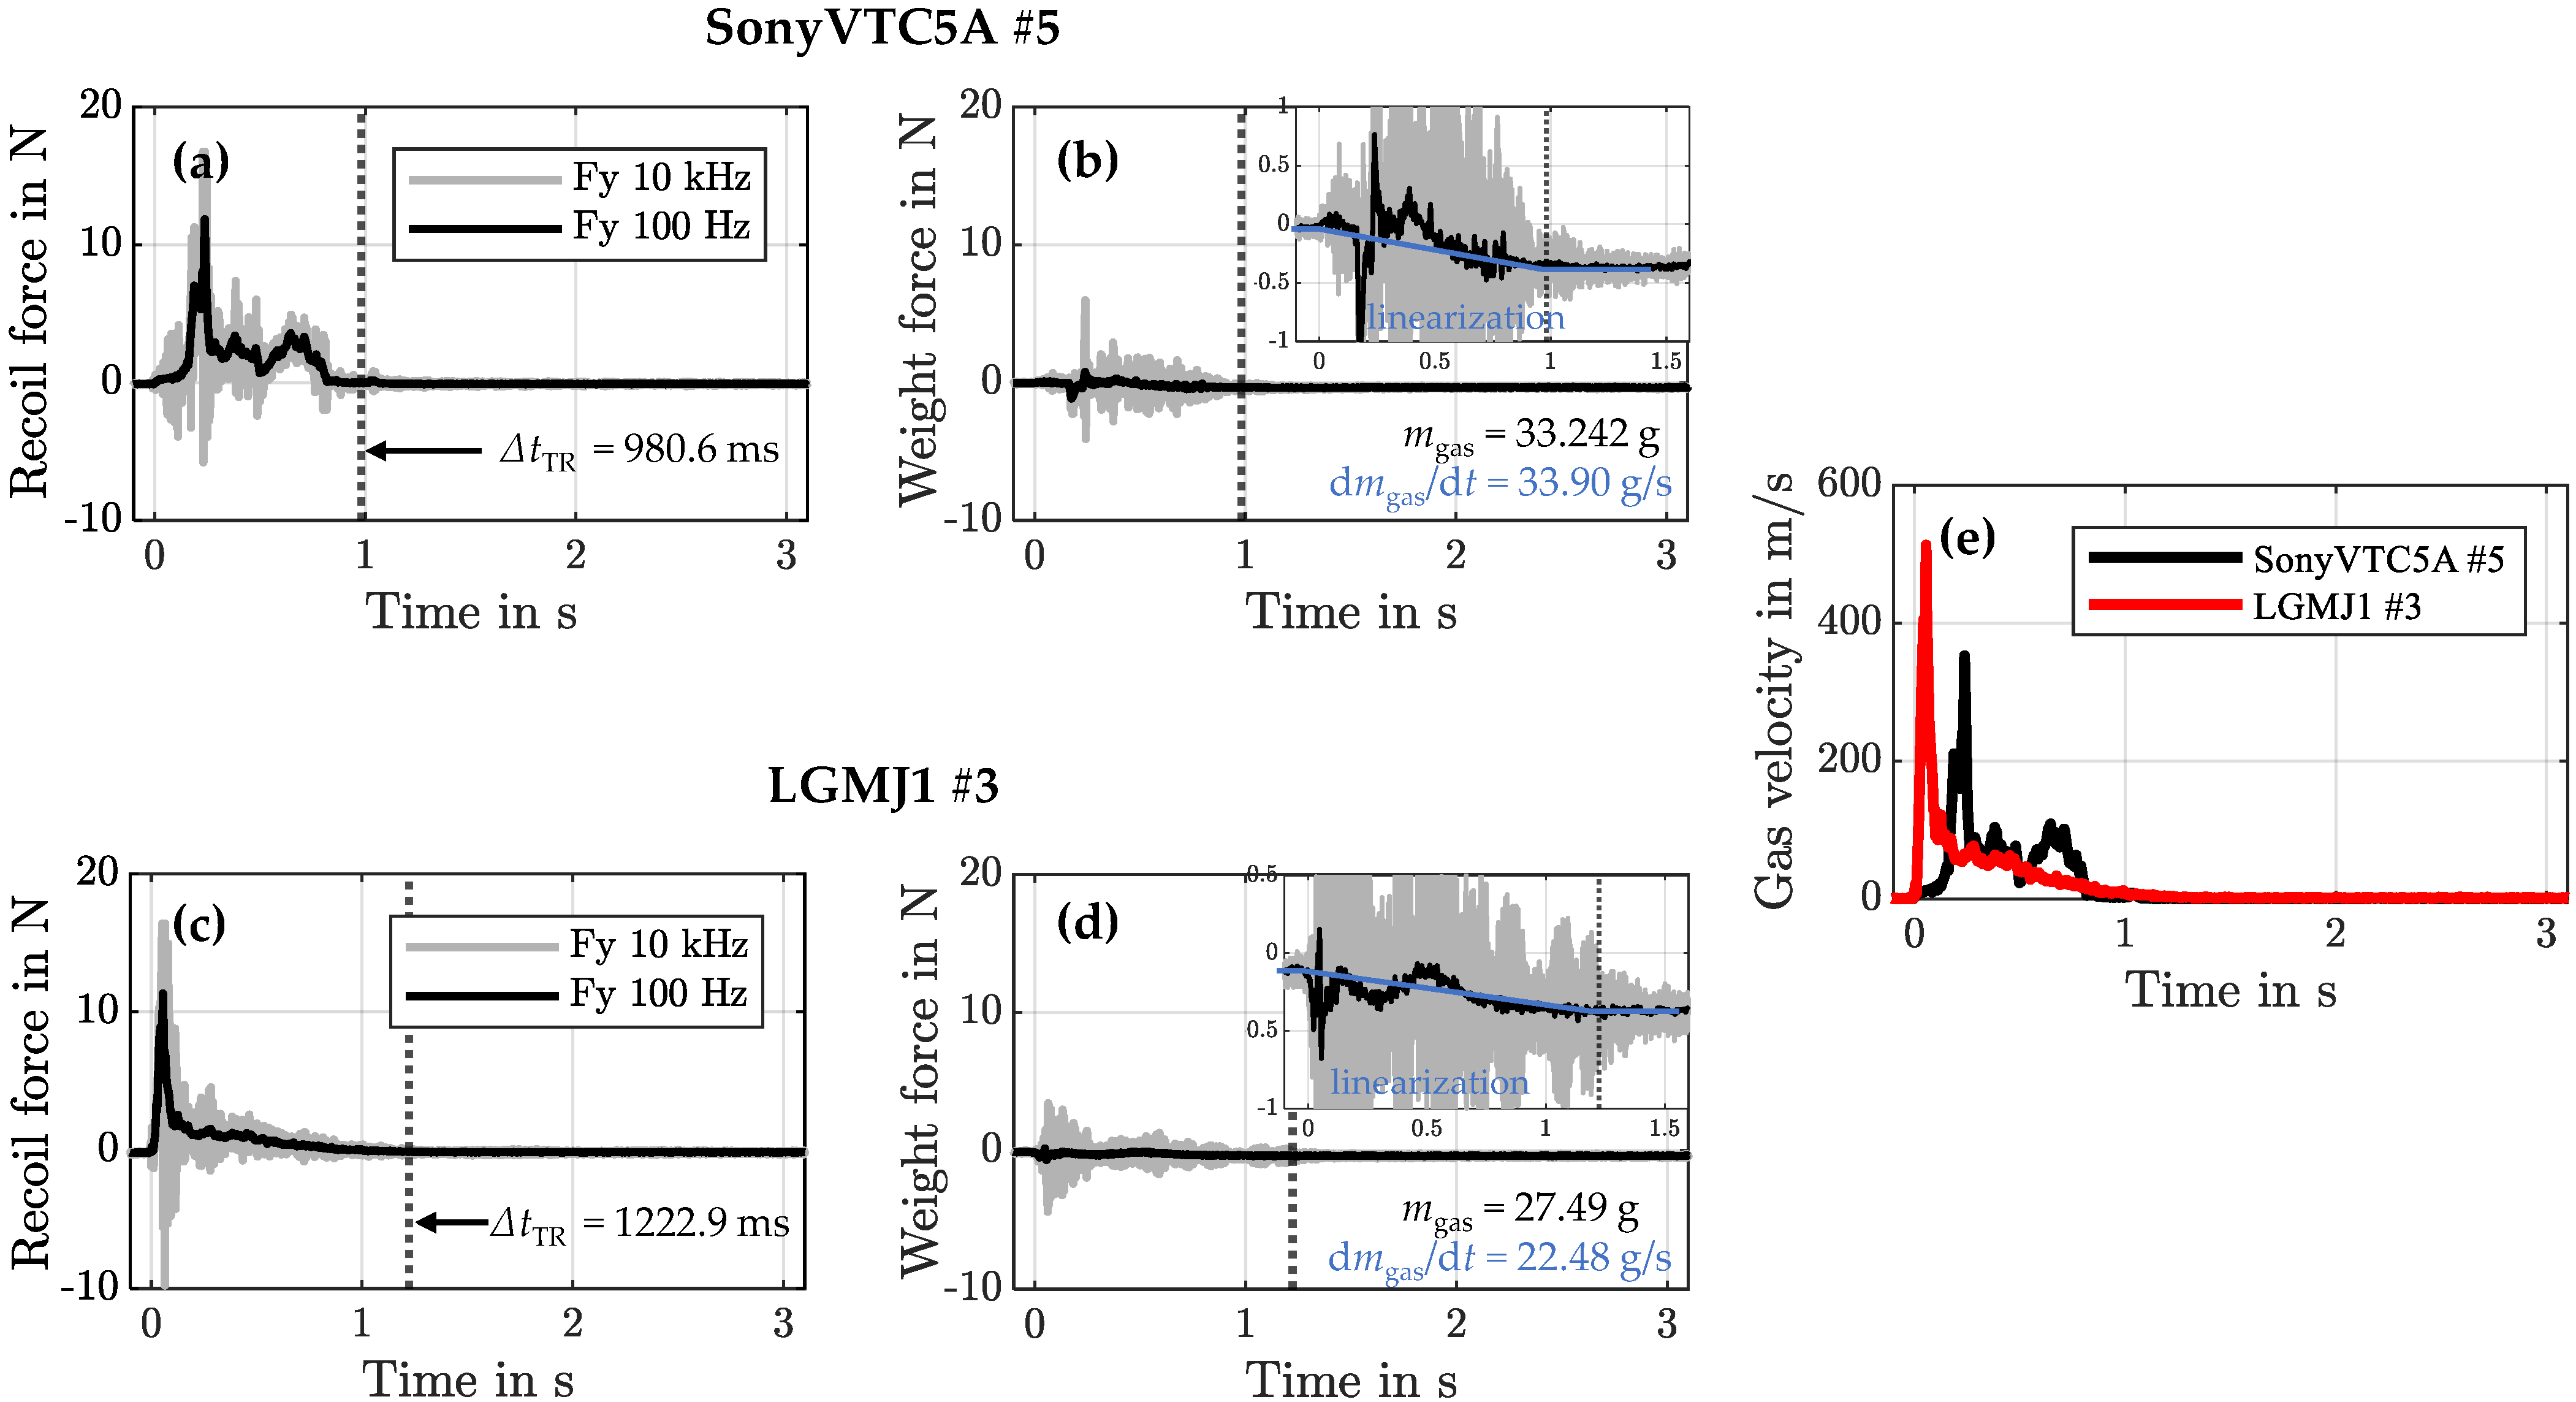
4.3. Fluid Mechanical Parameters of Venting
5. Discussion
6. Conclusions
Author Contributions
Funding
Data Availability Statement
Acknowledgments
Conflicts of Interest
Abbreviations
| Acronyms | |
| BFD | Battery Failure Databank |
| CFD | computational fluid dynamics |
| DMM | digital mulitmeter |
| FTRC | Fractional Thermal Runaway Calorimeter |
| LCO | lithium-cobalt-oxide |
| LFP | lithium-iron-phosphate |
| LIB | lithium-ion battery |
| NASA | National Aeronautics and Space Administration |
| NCA | nickel-cobalt-aluminum-oxide |
| NMC | nickel-cobalt-manganate |
| NREL | National Renewable Energy Laboratory |
| Osci | oscilloscope |
| SEI | solid-electrolyte interphase |
| SoC | state of charge |
| TR | thermal runaway |
| TRP | thermal runaway propagation |
| Symbols | |
| vent area, | |
| error of measurement chain, N | |
| force change with oscilloscope, N | |
| force change with digital multimeter, N | |
| thermal runaway duration, s | |
| recoil force, force in y-direction, N | |
| weight force, force in z-direction, N | |
| threshold force, N | |
| vent force, N | |
| vent force before TR event, N | |
| weight force before TR, N | |
| weight force after TR, N | |
| g | gravitational constant, |
| m | mass, g |
| cell mass, g | |
| cell mass at time , g | |
| venting gas mass, g | |
| mass loss, g | |
| gas flow rate, | |
| p | pressure, |
| gas pressure, | |
| R | universal gas constant, |
| t | time, s |
| cell holder temperature, | |
| gas temperature, | |
| thermal runaway event ends, s | |
| thermal runaway event starts, s | |
| V | volume, |
| gas velocity, | |
| maximum gas velocity, |
References
- Walker, W.Q.; Darst, J.J.; Finegan, D.P.; Bayles, G.A.; Johnson, K.L.; Darcy, E.C.; Rickman, S.L. Decoupling of heat generated from ejected and non-ejected contents of 18650-format lithium-ion cells using statistical methods. J. Power Sources 2019, 415, 207–218. [Google Scholar] [CrossRef]
- Doughty, D.H.; Roth, E.P. A General Discussion of Li Ion Battery Safety. Electrochem. Soc. Interface 2012, 21, 37. [Google Scholar] [CrossRef]
- Pegel, H.; Schaeffler, S.; Jossen, A.; Sauer, D.U. Extensive Experimental Thermal Runaway and Thermal Propagation Characterization of Large-Format Tabless Cylindrical Lithium-Ion Cells with Aluminum Housing and Laser Welded Endcaps. J. Electrochem. Soc. 2023, 170, 120512. [Google Scholar] [CrossRef]
- Lammer, M.; Königseder, A.; Hacker, V. Holistic methodology for characterisation of the thermally induced failure of commercially available 18650 lithium ion cells. RSC Adv. 2017, 7, 24425–24429. [Google Scholar] [CrossRef]
- Finegan, D.P.; Darst, J.; Walker, W.; Li, Q.; Yang, C.; Jervis, R.; Heenan, T.M.; Hack, J.; Thomas, J.C.; Rack, A.; et al. Modelling and experiments to identify high-risk failure scenarios for testing the safety of lithium-ion cells. J. Power Sources 2019, 417, 29–41. [Google Scholar] [CrossRef]
- Hou, J.; Feng, X.; Wang, L.; Liu, X.; Ohma, A.; Lu, L.; Ren, D.; Huang, W.; Li, Y.; Yi, M.; et al. Unlocking the self-supported thermal runaway of high-energy lithium-ion batteries. Energy Storage Mater. 2021, 39, 395–402. [Google Scholar] [CrossRef]
- Liu, X.; Stoliarov, S.I.; Denlinger, M.; Masias, A.; Snyder, K. Comprehensive calorimetry of the thermally-induced failure of a lithium ion battery. J. Power Sources 2015, 280, 516–525. [Google Scholar] [CrossRef]
- Wang, Z.; Ning, X.; Zhu, K.; Hu, J.; Yang, H.; Wang, J. Evaluating the thermal failure risk of large-format lithium-ion batteries using a cone calorimeter. J. Fire Sci. 2019, 37, 81–95. [Google Scholar] [CrossRef]
- Zhong, G.; Mao, B.; Wang, C.; Jiang, L.; Xu, K.; Sun, J.; Wang, Q. Thermal runaway and fire behavior investigation of lithium ion batteries using modified cone calorimeter. J. Therm. Anal. Calorim. 2019, 135, 2879–2889. [Google Scholar] [CrossRef]
- Wang, S.; Rafiz, K.; Liu, J.; Jin, Y.; Lin, J.Y.S. Effects of lithium dendrites on thermal runaway and gassing of LiFePO4 batteries. Sustain. Energy Fuels 2020, 4, 2342–2351. [Google Scholar] [CrossRef]
- Ren, D.; Hsu, H.; Li, R.; Feng, X.; Guo, D.; Han, X.; Lu, L.; He, X.; Gao, S.; Hou, J.; et al. A comparative investigation of aging effects on thermal runaway behavior of lithium-ion batteries. eTransportation 2019, 2, 100034. [Google Scholar] [CrossRef]
- Finegan, D.P.; Scheel, M.; Robinson, J.B.; Tjaden, B.; Hunt, I.; Mason, T.J.; Millichamp, J.; Di Michiel, M.; Offer, G.J.; Hinds, G.; et al. In-operando high-speed tomography of lithium-ion batteries during thermal runaway. Nat. Commun. 2015, 6, 6924. [Google Scholar] [CrossRef] [PubMed]
- Finegan, D.P.; Darcy, E.; Keyser, M.; Tjaden, B.; Heenan, T.M.M.; Jervis, R.; Bailey, J.J.; Malik, R.; Vo, N.T.; Magdysyuk, O.V.; et al. Characterising thermal runaway within lithium-ion cells by inducing and monitoring internal short circuits. Energy Environ. Sci. 2017, 10, 1377–1388. [Google Scholar] [CrossRef]
- Finegan, D.P.; Darcy, E.; Keyser, M.; Tjaden, B.; Heenan, T.M.M.; Jervis, R.; Bailey, J.J.; Vo, N.T.; Magdysyuk, O.V.; Drakopoulos, M.; et al. Identifying the Cause of Rupture of Li-Ion Batteries during Thermal Runaway. Adv. Sci. 2018, 5, 1700369. [Google Scholar] [CrossRef]
- Kong, L.; Hu, X.; Gui, G.; Su, Y.; Pecht, M. Computed Tomography Analysis of Li-Ion Battery Case Ruptures. Fire Technol. 2020, 56, 2565–2578. [Google Scholar] [CrossRef]
- Yao, X.Y.; Kong, L.; Pecht, M.G. Reliability of Cylindrical Li-ion Battery Safety Vents. IEEE Access 2020, 8, 101859–101866. [Google Scholar] [CrossRef]
- Golubkov, A.W.; Fuchs, D.; Wagner, J.; Wiltsche, H.; Stangl, C.; Fauler, G.; Voitic, G.; Thaler, A.; Hacker, V. Thermal-runaway experiments on consumer Li-ion batteries with metal-oxide and olivin-type cathodes. RSC Adv. 2014, 4, 3633–3642. [Google Scholar] [CrossRef]
- Sturk, D.; Rosell, L.; Blomqvist, P.; Ahlberg Tidblad, A. Analysis of Li-Ion Battery Gases Vented in an Inert Atmosphere Thermal Test Chamber. Batteries 2019, 5, 61. [Google Scholar] [CrossRef]
- Essl, C.; Seifert, L.; Rabe, M.; Fuchs, A. Early Detection of Failing Automotive Batteries Using Gas Sensors. Batteries 2021, 7, 25. [Google Scholar] [CrossRef]
- Cai, T.; Mohtat, P.; Stefanopoulou, A.G.; Siegel, J.B. Li-ion Battery Fault Detection in Large Packs Using Force and Gas Sensors. IFAC-PapersOnLine 2020, 53, 12491–12496. [Google Scholar] [CrossRef]
- Mier, F.A.; Morales, R.; Coultas-McKenney, C.A.; Hargather, M.J.; Ostanek, J. Overcharge and thermal destructive testing of lithium metal oxide and lithium metal phosphate batteries incorporating optical diagnostics. J. Energy Storage 2017, 13, 378–386. [Google Scholar] [CrossRef]
- Mier, F.A.; Hargather, M.J.; Ferreira, S.R. Experimental Quantification of Vent Mechanism Flow Parameters in 18650 Format Lithium Ion Batteries. J. Fluids Eng. 2019, 141, 061403. [Google Scholar] [CrossRef]
- Hatchard, T.D.; MacNeil, D.D.; Basu, A.; Dahn, J.R. Thermal Model of Cylindrical and Prismatic Lithium-Ion Cells. J. Electrochem. Soc. 2001, 148, A755. [Google Scholar] [CrossRef]
- Kim, G.H.; Pesaran, A.; Spotnitz, R. A three-dimensional thermal abuse model for lithium-ion cells. J. Power Sources 2007, 170, 476–489. [Google Scholar] [CrossRef]
- Hoelle, S.; Dengler, F.; Zimmermann, S.; Hinrichsen, O. 3D Thermal Simulation of Lithium-Ion Battery Thermal Runaway in Autoclave Calorimetry: Development and Comparison of Modeling Approaches. J. Electrochem. Soc. 2023, 170, 010509. [Google Scholar] [CrossRef]
- Coman, P.T.; Rayman, S.; White, R.E. A lumped model of venting during thermal runaway in a cylindrical Lithium Cobalt Oxide lithium-ion cell. J. Power Sources 2016, 307, 56–62. [Google Scholar] [CrossRef]
- Coman, P.T.; Mátéfi-Tempfli, S.; Veje, C.T.; White, R.E. Modeling Vaporization, Gas Generation and Venting in Li-Ion Battery Cells with a Dimethyl Carbonate Electrolyte. J. Electrochem. Soc. 2017, 164, A1858–A1865. [Google Scholar] [CrossRef]
- Huang, W.; Feng, X.; Pan, Y.; Jin, C.; Sun, J.; Yao, J.; Wang, H.; Xu, C.; Jiang, F.; Ouyang, M. Early warning of battery failure based on venting signal. J. Energy Storage 2023, 59, 106536. [Google Scholar] [CrossRef]
- Ostanek, J.K.; Li, W.; Mukherjee, P.P.; Crompton, K.R.; Hacker, C. Simulating onset and evolution of thermal runaway in Li-ion cells using a coupled thermal and venting model. Appl. Energy 2020, 268, 114972. [Google Scholar] [CrossRef]
- Wang, G.; Kong, D.; Ping, P.; He, X.; Lv, H.; Zhao, H.; Hong, W. Modeling venting behavior of lithium-ion batteries during thermal runaway propagation by coupling CFD and thermal resistance network. Appl. Energy 2023, 334, 120660. [Google Scholar] [CrossRef]
- Kim, J.; Mallarapu, A.; Finegan, D.P.; Santhanagopalan, S. Modeling cell venting and gas-phase reactions in 18650 lithium ion batteries during thermal runaway. J. Power Sources 2021, 489, 229496. [Google Scholar] [CrossRef]
- Kong, D.; Wang, G.; Ping, P.; Wen, J. A coupled conjugate heat transfer and CFD model for the thermal runaway evolution and jet fire of 18650 lithium-ion battery under thermal abuse. eTransportation 2022, 12, 100157. [Google Scholar] [CrossRef]
- Mao, B.; Zhao, C.; Chen, H.; Wang, Q.; Sun, J. Experimental and modeling analysis of jet flow and fire dynamics of 18650-type lithium-ion battery. Appl. Energy 2021, 281, 116054. [Google Scholar] [CrossRef]
- Wang, G.; Kong, D.; Ping, P.; Wen, J.; He, X.; Zhao, H.; He, X.; Peng, R.; Zhang, Y.; Dai, X. Revealing particle venting of lithium-ion batteries during thermal runaway: A multi-scale model toward multiphase process. eTransportation 2023, 16, 100237. [Google Scholar] [CrossRef]
- Wang, J.h.; Jiang, Z.; Mei, M.; Qiu, H.; Wang, Y. Numerical simulation study on two-phase flow of thermal runaway evolution and jet fire of 18650 lithium-ion battery under thermal abuse. Case Stud. Therm. Eng. 2024, 53, 103726. [Google Scholar] [CrossRef]
- Mishra, D.; Shah, K.; Jain, A. Investigation of the Impact of Flow of Vented Gas on Propagation of Thermal Runaway in a Li-Ion Battery Pack. J. Electrochem. Soc. 2021, 168, 060555. [Google Scholar] [CrossRef]
- Ping, P.; Wang, Q.; Huang, P.; Li, K.; Sun, J.; Kong, D.; Chen, C. Study of the fire behavior of high-energy lithium-ion batteries with full-scale burning test. J. Power Sources 2015, 285, 80–89. [Google Scholar] [CrossRef]
- Zou, K.; Chen, X.; Ding, Z.; Gu, J.; Lu, S. Jet behavior of prismatic lithium-ion batteries during thermal runaway. Appl. Therm. Eng. 2020, 179, 115745. [Google Scholar] [CrossRef]
- Golubkov, A.W.; Scheikl, S.; Planteu, R.; Voitic, G.; Wiltsche, H.; Stangl, C.; Fauler, G.; Thaler, A.; Hacker, V. Thermal runaway of commercial 18650 Li-ion batteries with LFP and NCA cathodes – impact of state of charge and overcharge. RSC Adv. 2015, 5, 57171–57186. [Google Scholar] [CrossRef]
- Golubkov, A.W.; Planteu, R.; Krohn, P.; Rasch, B.; Brunnsteiner, B.; Thaler, A.; Hacker, V. Thermal runaway of large automotive Li-ion batteries. RSC Adv. 2018, 8, 40172–40186. [Google Scholar] [CrossRef]
- Zhou, Z.; Zhou, X.; Wang, D.; Li, M.; Wang, B.; Yang, L.; Cao, B. Experimental analysis of lengthwise/transversal thermal characteristics and jet flow of large-format prismatic lithium-ion battery. Appl. Therm. Eng. 2021, 195, 117244. [Google Scholar] [CrossRef]
- Jia, Z.; Wang, S.; Qin, P.; Li, C.; Song, L.; Cheng, Z.; Jin, K.; Sun, J.; Wang, Q. Comparative investigation of the thermal runaway and gas venting behaviors of large-format LiFePO4 batteries caused by overcharging and overheating. J. Energy Storage 2023, 61, 106791. [Google Scholar] [CrossRef]
- Jia, Z.; Min, Y.; Qin, P.; Mei, W.; Meng, X.; Jin, K.; Sun, J.; Wang, Q. Effect of safety valve types on the gas venting behavior and thermal runaway hazard severity of large-format prismatic lithium iron phosphate batteries. J. Energy Chem. 2024, 89, 195–207. [Google Scholar] [CrossRef]
- Liu, P.; Sun, H.; Qiao, Y.; Sun, S.; Wang, C.; Jin, K.; Mao, B.; Wang, Q. Experimental study on the thermal runaway and fire behavior of LiNi0.8Co0.1Mn0.1O2 battery in open and confined spaces. Process. Saf. Environ. Prot. 2022, 158, 711–726. [Google Scholar] [CrossRef]
- Qin, P.; Jia, Z.; Wu, J.; Jin, K.; Duan, Q.; Jiang, L.; Sun, J.; Ding, J.; Shi, C.; Wang, Q. The thermal runaway analysis on LiFePO4 electrical energy storage packs with different venting areas and void volumes. Appl. Energy 2022, 313, 118767. [Google Scholar] [CrossRef]
- Wang, S.; Song, L.; Li, C.; Tian, J.; Jin, K.; Duan, Q.; Wang, Q. Experimental study of gas production and flame behavior induced by the thermal runaway of 280 Ah lithium iron phosphate battery. J. Energy Storage 2023, 74, 109368. [Google Scholar] [CrossRef]
- Li, J.; Tong, B.; Gao, P.; Cheng, Z.; Cao, M.; Mei, W.; Qin, P.; Sun, J.; Wang, Q. A novel method to determine the multi-phase ejection parameters of high-density battery thermal runaway. J. Power Sources 2024, 592, 233905. [Google Scholar] [CrossRef]
- Wang, Y.; Song, Z.; Li, Y.; Li, C.; Ren, D.; Feng, X.; Wang, H.; Lu, L. Experimental investigation of the thermal propagation, emission identification, and venting-flow characteristics of a Li(Ni0.8Co0.1Mn0.1)O2 battery module. Case Stud. Therm. Eng. 2023, 49, 103360. [Google Scholar] [CrossRef]
- García, A.; Zhao, P.; Monsalve-Serrano, J.; Villalta, D.; Martinez-Boggio, S. Optical diagnostics of the venting spray and combustion behaviour during Li-ion battery thermal runaway induced by ramp heating. Appl. Therm. Eng. 2023, 218, 119308. [Google Scholar] [CrossRef]
- García, A.; Monsalve-Serrano, J.; Sari, R.L.; Martinez-Boggio, S. Influence of environmental conditions in the battery thermal runaway process of different chemistries: Thermodynamic and optical assessment. Int. J. Heat Mass Transf. 2022, 184, 122381. [Google Scholar] [CrossRef]
- García, A.; Monsalve-Serrano, J.; Lago Sari, R.; Martinez-Boggio, S. An optical investigation of thermal runaway phenomenon under thermal abuse conditions. Energy Convers. Manag. 2021, 246, 114663. [Google Scholar] [CrossRef]
- Leung, J.C. Venting of runaway reactions with gas generation. AIChE J. 1992, 38, 723–732. [Google Scholar] [CrossRef]
- Finegan, D.P.; Billman, J.; Darst, J.; Hughes, P.; Trillo, J.; Sharp, M.; Benson, A.; Pham, M.; Kesuma, I.; Buckwell, M.; et al. The battery failure databank: Insights from an open-access database of thermal runaway behaviors of Li-ion cells and a resource for benchmarking risks. J. Power Sources 2024, 597, 234106. [Google Scholar] [CrossRef]
- Mao, B.; Fear, C.; Chen, H.; Zhou, H.; Zhao, C.; Mukherjee, P.P.; Sun, J.; Wang, Q. Experimental and modeling investigation on the gas generation dynamics of lithium-ion batteries during thermal runaway. eTransportation 2023, 15, 100212. [Google Scholar] [CrossRef]
- Zhao, C.; Sun, J.; Wang, Q. Thermal runaway hazards investigation on 18650 lithium-ion battery using extended volume accelerating rate calorimeter. J. Energy Storage 2020, 28, 101232. [Google Scholar] [CrossRef]
- Sharp, M.; Darst, J.J.; Hughes, P.; Billman, J.; Pham, M.; Petrushenko, D.; Heenan, T.M.M.; Jervis, R.; Owen, R.; Patel, D.; et al. Thermal Runaway of Li-Ion Cells: How Internal Dynamics, Mass Ejection, and Heat Vary with Cell Geometry and Abuse Type. J. Electrochem. Soc. 2022, 169, 020526. [Google Scholar] [CrossRef]
- Essl, C.; Golubkov, A.W.; Fuchs, A. Comparing Different Thermal Runaway Triggers for Two Automotive Lithium-Ion Battery Cell Types. J. Electrochem. Soc. 2020, 167, 130542. [Google Scholar] [CrossRef]
- Essl, C.; Golubkov, A.W.; Fuchs, A. Influence of Aging on the Failing Behavior of Automotive Lithium-Ion Batteries. Batteries 2021, 7, 23. [Google Scholar] [CrossRef]
- Sturm, J.; Rheinfeld, A.; Zilberman, I.; Spingler, F.B.; Kosch, S.; Frie, F.; Jossen, A. Modeling and simulation of inhomogeneities in a 18650 nickel-rich, silicon-graphite lithium-ion cell during fast charging. J. Power Sources 2019, 412, 204–223. [Google Scholar] [CrossRef]
- Lain, M.J.; Brandon, J.; Kendrick, E. Design Strategies for High Power vs. High Energy Lithium Ion Cells. Batteries 2019, 5, 64. [Google Scholar] [CrossRef]
- Feng, X.; Ren, D.; He, X.; Ouyang, M. Mitigating Thermal Runaway of Lithium-Ion Batteries. Joule 2020, 4, 743–770. [Google Scholar] [CrossRef]
- Ohneseit, S.; Finster, P.; Floras, C.; Lubenau, N.; Uhlmann, N.; Seifert, H.J.; Ziebert, C. Thermal and Mechanical Safety Assessment of Type 21700 Lithium-Ion Batteries with NMC, NCA and LFP Cathodes–Investigation of Cell Abuse by Means of Accelerating Rate Calorimetry (ARC). Batteries 2023, 9, 237. [Google Scholar] [CrossRef]
- National Renewable Energy Laboratory, Battery Failure Databank. Available online: https://www.nrel.gov/transportation/battery-failure.html (accessed on 11 March 2024).


| Ref. | Methodology | Cell Format | Cathode Chemistry and Nominal Capacity | Mass Flow Rate | Vent Flow Velocity | Comment |
|---|---|---|---|---|---|---|
| [41] | weight sensor | prismatic | LFP: 27 Ah | ✓ | ✓ | Assuming ideal gas flow and a given gas compositon |
| [42] | weight sensor | prismatic | LFP: 86 Ah | ✓ | ||
| [46] | weight sensor | prismatic | LFP: 280 Ah | ✓ | ||
| [38] | weight sensor, optical | prismatic | : 38 Ah | ✓ | High-speed camera | |
| [34] | weight sensor, pitot tube | prismatic | LFP: 27 Ah | ✓ | ✓ | |
| [43,45] | weight sensor, pitot tube | prismatic | LFP: 32 ×
86 Ah (pack) LFP: 100 Ah | ✓ | ✓ | Assuming ideal gas flow and a given gas compositon |
| [28] | weight sensor, pressure sensor | 21700 | NCA | ✓ | Only data during opening of safety valve available | |
| [48] | weight sensor, pressure sensor | pouch | : 124 Ah (pack) | ✓ | ✓ | Assuming isotropic and ideal gas flow |
| [49,50,51] | optical | 18650 | : 2.0 Ah LFP: 1.8 Ah LCO: 2.6 Ah | ✓ | Schlieren technique and Natural Luminosity, in [51] additionally OH*-chemiluminescence | |
| [47] | momentum and mass conservation | prismatic | : 52 Ah | ✓ | ✓ | 6-axis mechanical sensor, measuring frequency 40 Hz, evaluated frequency 1 Hz |
| This work | momentum and mass conservation | 18650 | : 3.5 Ah NCA: 2.5 Ah | ✓ | ✓ | 3-axis force sensor, measuring frequency 10 kHz, evaluated frequency 100 Hz |
| US18650VTC5A (Sony) | INR18650 MJ1 (LG) | ||
|---|---|---|---|
| Dimensions | |||
| Cathode chemistry | NCA [60] | [59] | |
| Anode chemistry | Graphite + Silicon [60] | Graphite + Silicon [59] | |
| Nominal voltage | 3.6 | 3.64 | |
| Nominal capacity | 2.5 | 3.5 | |
| Vent cap holes | 3 | 4 | |
| Number of cells | 5 | 5 | |
| Mass | 47.937 | 46.880 | |
| Mass without isolation | 47.483 | 46.417 | |
| Mass without isolation with Kapton tape | 48.881 | 47.565 |
| SonyVTC5A | LGMJ1 | |
|---|---|---|
| Mass loss at TR | ||
| TR duration | ms | ms |
| Gas flow rate | ||
| Maximum gas velocity | ||
| Velocity curve shape | bumpy pattern with two to three bumps | single peak asymmetrical pattern |
Disclaimer/Publisher’s Note: The statements, opinions and data contained in all publications are solely those of the individual author(s) and contributor(s) and not of MDPI and/or the editor(s). MDPI and/or the editor(s) disclaim responsibility for any injury to people or property resulting from any ideas, methods, instructions or products referred to in the content. |
© 2024 by the authors. Licensee MDPI, Basel, Switzerland. This article is an open access article distributed under the terms and conditions of the Creative Commons Attribution (CC BY) license (https://creativecommons.org/licenses/by/4.0/).
Share and Cite
Gillich, E.I.; Steinhardt, M.; Fedoryshyna, Y.; Jossen, A. Mechanical Measurement Approach to Characterize Venting Behavior during Thermal Runaway of 18650 Format Lithium-Ion Batteries. Batteries 2024, 10, 142. https://doi.org/10.3390/batteries10040142
Gillich EI, Steinhardt M, Fedoryshyna Y, Jossen A. Mechanical Measurement Approach to Characterize Venting Behavior during Thermal Runaway of 18650 Format Lithium-Ion Batteries. Batteries. 2024; 10(4):142. https://doi.org/10.3390/batteries10040142
Chicago/Turabian StyleGillich, Elisabeth Irene, Marco Steinhardt, Yaroslava Fedoryshyna, and Andreas Jossen. 2024. "Mechanical Measurement Approach to Characterize Venting Behavior during Thermal Runaway of 18650 Format Lithium-Ion Batteries" Batteries 10, no. 4: 142. https://doi.org/10.3390/batteries10040142