1. Introduction
The Hearing Aid Compatibility Act of 1988 (HAC Act) generally requires the Federal Communications Commission (FCC) to ensure mobile phone service providers achieve compliance with the new hearing aid requirements (ANSI-C63.19-2011) [
1]. The FCC Mandate applies to phones sold in the US and its territories. Two types of compatibility are required:
- (A)
“M-HAC” (Microphone Hearing Aid Compatibility) to ensure that acoustic coupling from a mobile phone does not interfere with the hearing aid’s audio quality.
- (B)
“T-HAC” (Telecoil Hearing Aid Compatibility) to ensure that inductive (magnetic) coupling from a mobile phone does not interfere with the hearing aid’s audio quality. The phone needs to be “M” compatible before it can be considered for “T” rating. The “M” requirements are not covered in this article.
“T-HAC” requirements include three areas:
- (A)
Signal level.
- (B)
Frequency response.
- (C)
Signal quality (signal-to-noise ratio).
ANSI C63.19 defines testing procedures. Per the HAC Act, mobile phone service providers (carriers) and manufacturers must ensure that a defined percentage of their product portfolio meets the requirements for “T-HAC” compatibility.
Present cell phone technology uses Li-ion batteries consisting of Li-ion cells and control electronics. Li-ion cells consist of cathode, separator and anode layers, either “cut-stacked” or “wound” in a circular/oval shape (jelly-roll) structure-enclosed in a metallic can (“Li-ion prismatic”) or a laminated aluminum/polymer pouch (“Li-ion polymer (LIP)”). The cathode and anode are electrically insulated by a polymer based membrane (separator). An organic electrolyte provides ionic conducting medium for Li-ions to shuttle between anode and cathode during charging and discharging. Electrical currents in such cell/battery assemblies generate electromagnetic field (EMF) emissions during their operation that increase with increasing load current, in particular under high current pulse applications. For example, cellular networks use a variety of transmission protocols. Two common traditional protocols are known as global system for mobile communications (GSM) and code division multiple access (CDMA). The EMF emission levels of a battery under GSM pulse operation are higher than in the same battery operated under CDMA. Batteries’ EMF emission levels and patterns depend on cell design parameters, in particular, cathode (+) and anode (−) tab locations in the jelly-roll or in the cut-stacked electrode layers. However, by properly arranging positive/negative current carrying structures within the cell and battery, EMF can be substantially “cancelled”, reducing the interference associated with T-HAC compliance.
Li-ion prismatic cells generally are built with internal +/− tabs placed on opposite ends of the cathode and anode before winding into a jelly-roll.
Figure 1a shows an assembled prismatic cell with its associated internal +/− tabs and external +/− connectors. LIP cells are packaged using laminated aluminum foil with polymer materials (pouch). LIP cells are built using either of jelly-roll, or cut-stacked electrode layers (
Figure 1b).
This article focuses on design parameters required to build Li-ion cells with reduced EMF emission for T-HAC friendly batteries by changing the cell’s internal tab locations and lengths on cathode and anode layers. For proof of concept, studies were first based on bare copper (Cu) foils simulating cathode and anode layers to form a “model jelly-roll”. Tests were then conducted on actual Li-ion prismatic or LIP cells from four manufacturers. Note, here the “EMF emission” is considered as “magnetic noise (MN)” because of its undesirable impact on audio quality of the phone speaker and/or hearing aids.
2. Experiments
2.1. Cathode and Anode Tab Positions
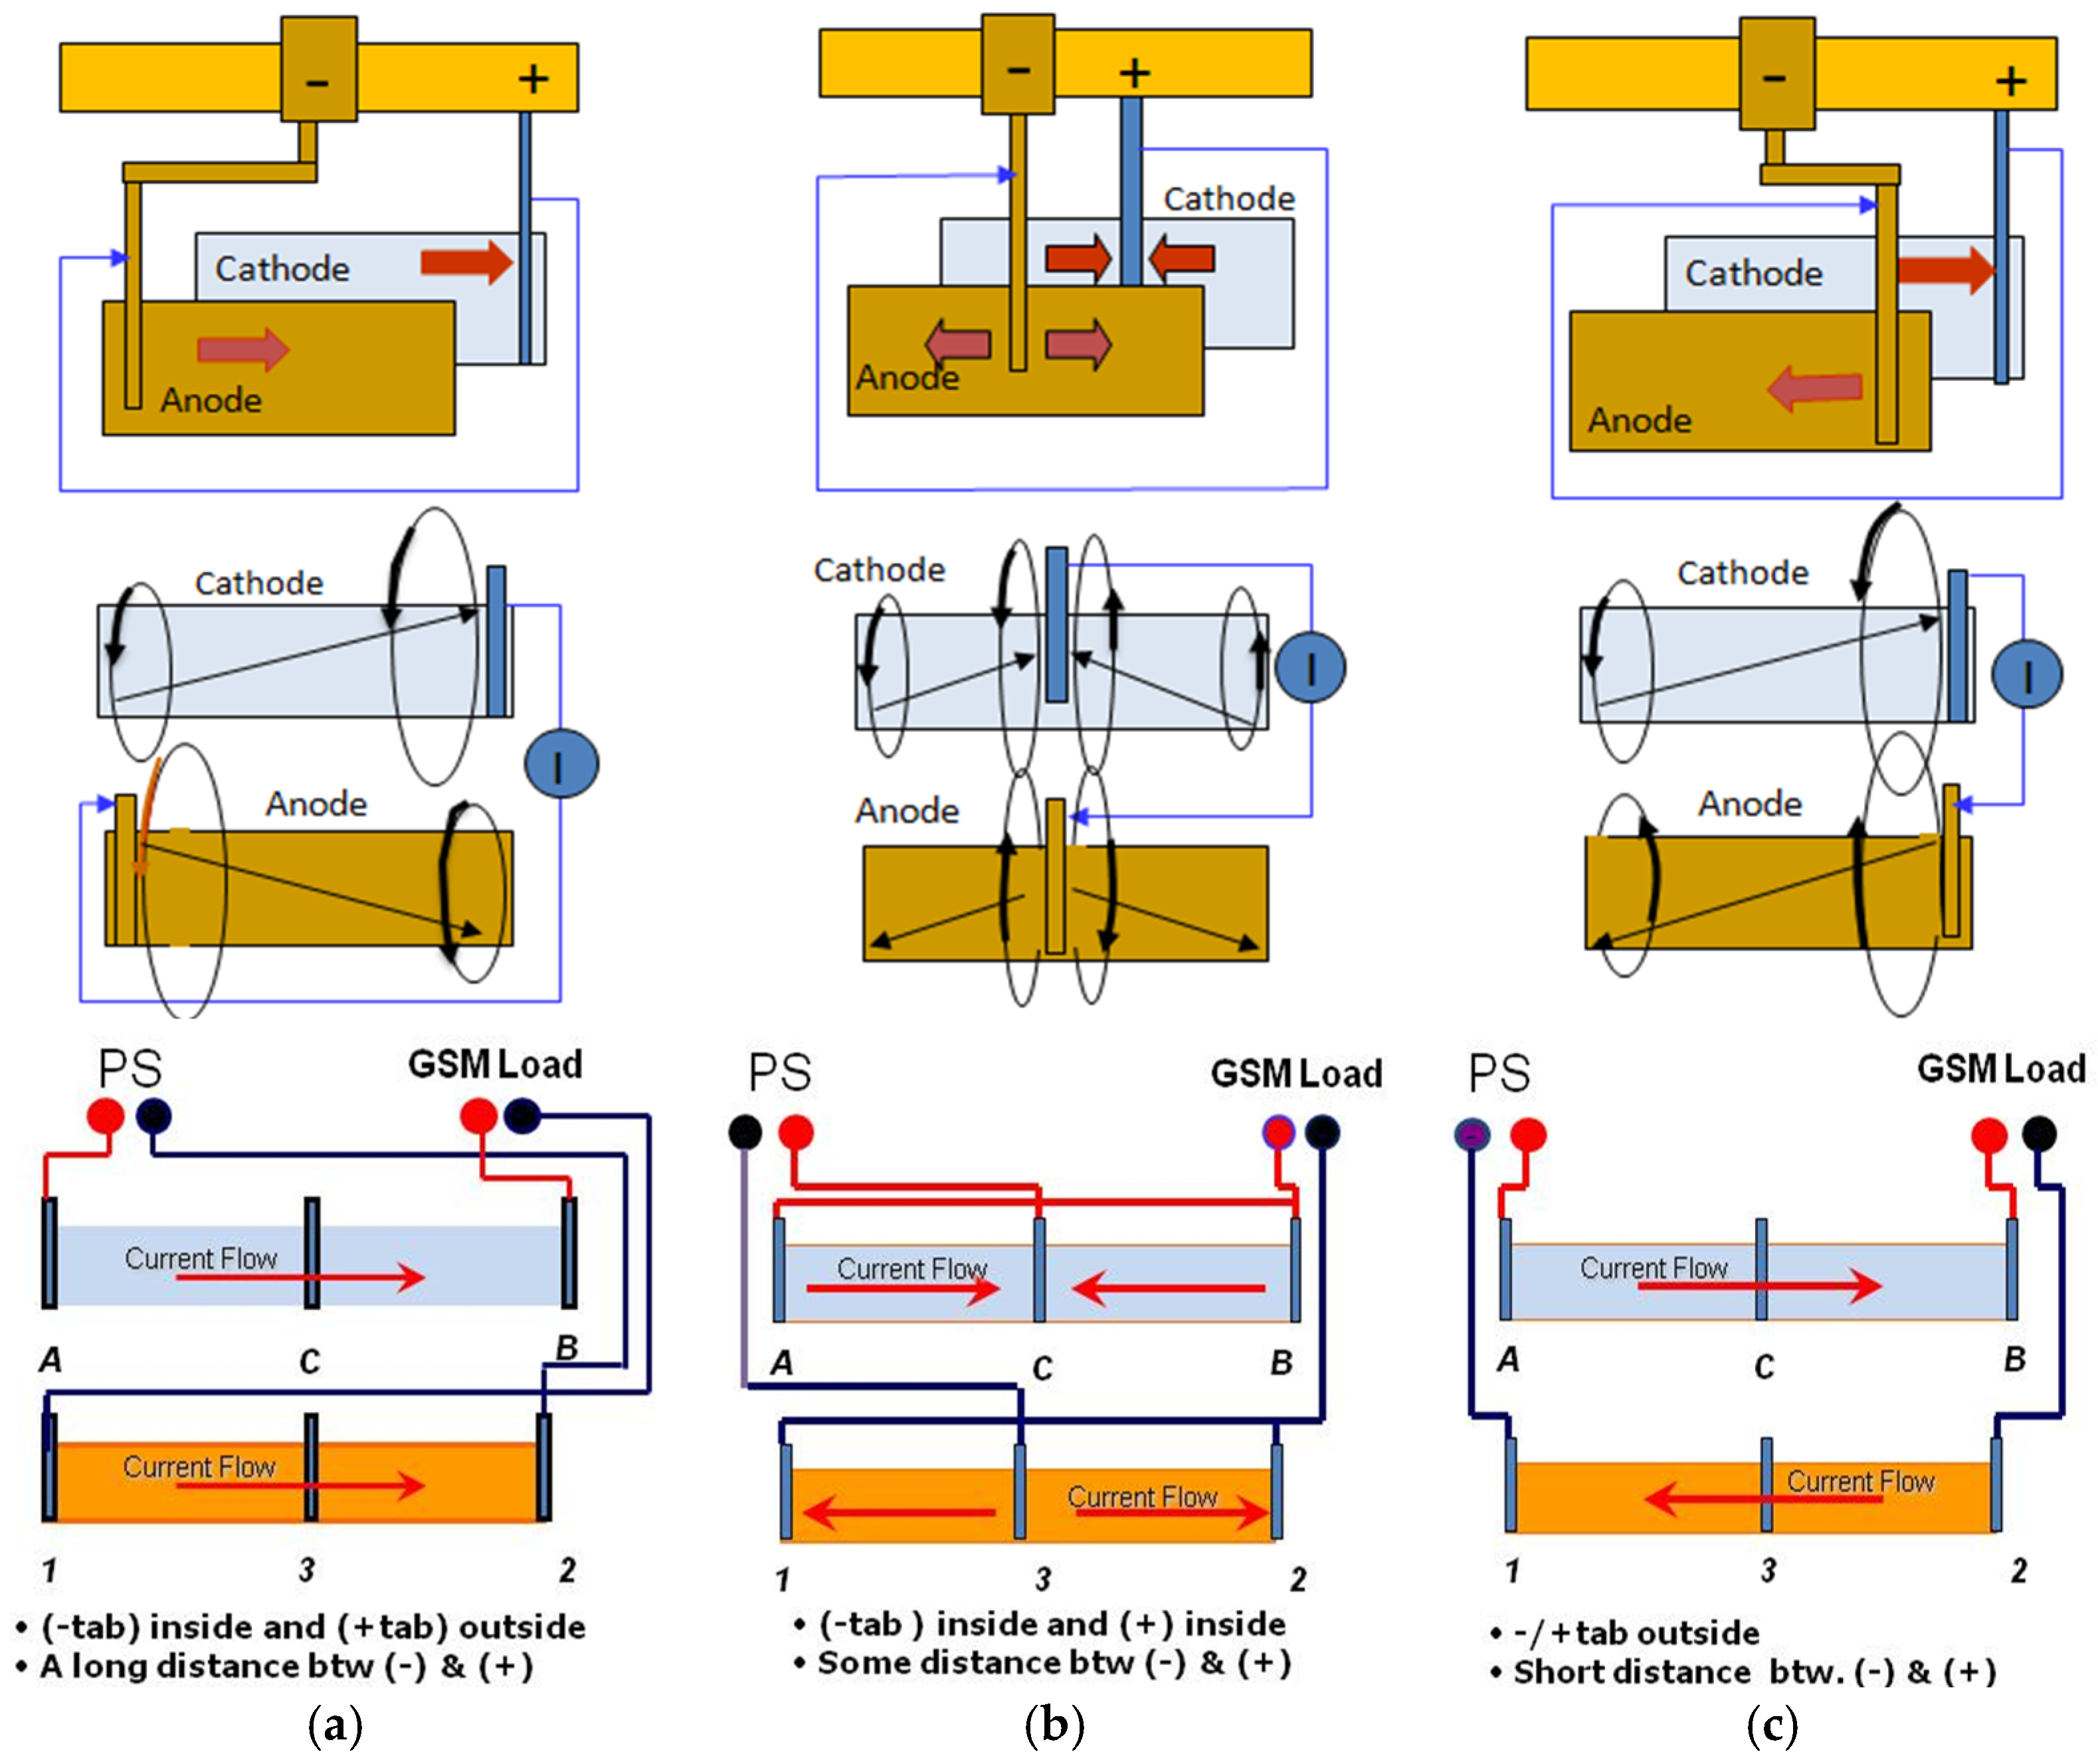
Figure 2 are schematics for three cases (A, B and C) mimicking +/− tab positions and changes on cathode and anode, with their associated electrical connection, in a jelly-roll based cell design. Thin layers (16 μm) of Cu-foils were used to build jelly-roll models with different combinations of +/− tab positioning:
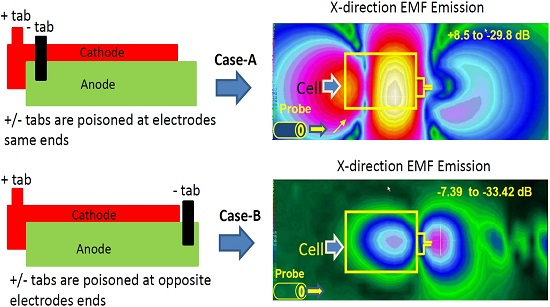
A-design (typical), +/− tabs positioned on opposite ends of the Cu-foils. After clockwise winding, the (−) tab stays in the center (initiation) while the (+) tab falls on the outer end (termination) of the jelly-roll. In this case, both Cu-foils’ current paths are in the same direction while peak MN levels are near opposite ends of the foils.
B-design (T-HAC), +/− tabs positioned near center of Cu-foils. After clockwise winding, both tabs fall close to each other within the jelly-roll wall. In this case, the Cu-foils’ current paths are in opposite directions, with peak MN levels much closer to each other than in the A-design.
C-design (T-HAC), +/− tabs positioned on the same ends of the Cu-foils. After clockwise winding, both +/− tabs fall on the jelly-roll termination end. In this case, the Cu-foils’ current paths are in opposite directions with their peak MN levels on the same end of both foils. Note that close proximity of current paths in opposite directions leads to higher levels of MN cancellation.
2.2. Tab Lengths/Overlap and Material Changes
Figure 3 shows a schematic of Cu-foils representative of cathode and anode and their associated tab connectors of different lengths. In the figure tabs are noted as “R”, “B”, “Y”, “G”, with “R” and “G” being longer than “Y” and “B”. In these cases, +/− tabs are positioned on the same electrode ends, such that after clockwise winding, they fall on either the initiation or termination end of the jelly-roll. In Cases 1–3, Cu-tabs were used on the cathode foil and NiFe tabs on the anode foil. In Case 4, Cu-tabs were used for both Cu-foils to see if a change in the tab material affects the MN-emission of the test samples.
3. Sample Preparation
NiFe and Cu tabs were welded on 16 μm thick Cu-foils to represent cathode (53 mm × 570 mm) and anode (55 mm × 580 mm). Tab lengths varied depending of their position; all tabs were positioned slightly off of the Cu-foil edges. The representative assemblies (+/− tabs & Cu-foils) were insulated by a separator (0.019 mm × 57 mm × 1200 mm polyethylene) and then wound into a jelly-roll format. A photo of the model wound jell-roll is shown in the middle section of
Figure 3. The assembly was tightly pressed using a folded hard plastic sheet wrapped with Kapton tape. This was to eliminate gaps among the layers to insure consistent results. Presence of any gaps could distort the emitted EMF contour shapes.
4. Test Equipment Parts
EMC-Scanner (Detectus-AB/V2.7, HR-1 Series, Eindhoven, The Netherlands) capable of scanning over cell area (XY) in small steps (5 mm) with the Z-direction (height) adjusted according to test requirements.
An HP35670A frequency analyzer (Hewlett-Packard, Fremont, CA, USA) and KIKUSUI Model PLZ164W electronic load (Santa Clara, CA, USA) to provide the GSM pulse profile.
Communication Certification Laboratory (CCL) radial probe (Model HAC-R100) for measuring EMF emission surrounding the sample while applying GSM pulse.
Aprel (Kanata, ON, Canada) telephone magnetic field simulator (TMFS) as magnetic field emission source for test setup calibration. This process needs a signal generator that can produce a 1.0 kHz sine wave, and an audio amplifier that can provide sine wave at −6 dBV. Detailed explanation on T-HAC test setup calibration is covered in
Section 5 of the Aprel’s document for the TMFS.
Software capable of reading each frequency band value in decibels and converting it to a power sum (this is a 10 × log function).
Figure 4 shows schematics of the experimental setup used for measuring MN-emissions from the model jelly-roll. Measurements were made under GSM pulse current created using an electronic load and a frequency range of 12 Hz–20 kHz. The T-HAC probe (R100), frequency analyzer, electronics load and scanner were used for data collection in
X,
Y and/or
Z direction while the probe coil center was positioned 13 mm above the sample top surface. This is considered as a typical distance between the center of the phone speaker and a hearing aid’s coil.
5. Test Procedure
- (1)
Connected twisted wire pair (TWP) to +/− connectors. TWP is to cancel EMF due to current flow through the wires.
- (2)
Place the test cell on the center of the 180 mm × 130 mm stage, such that its TWP connection is positioned to the right-hand-side toward the electronic load.
- (3)
Connect the TWP to +/− connectors of the programmable load.
- (4)
Program the scanner to scan the XY area of 180 mm × 130 mm using 5.0 mm steps in both X & Y directions.
- (5)
Set the “center” of the T-HAC radial probe at the XY 0:0 location (bottom left corner of the stage) with 13 mm spacing between the top surface of the cell and the center of the probe’s coil.
- (6)
MN-emissions, in X, Y and/or Z direction, are measured while the power supply (PS) is held near 4.2 V across the Cu-foils.
- (7)
In the case of actual Li-ion/LIP cells, cells are initially fully discharged and charged three times and then tested when almost fully charged.
Note that the test system used for the plots contained in this paper was designed to produce a current draw similar to that which a GSM phone would produce when attached to the battery in question. The battery was attached to a programmable load that produced a 1/8 duty cycle load with a frequency of 217 Hz. This signal will have broad-band components at the multiples of 217 Hz, but with decreasing amplitude. The audio capture and processing that was applied to the data was per the ANSI C63.19 hearing aid compatibility (HAC) standard. The HAC standard requires an A-weight filter (ANSI S1.4-1983) on the output of the probe coil to emulate human perceived annoyance. The test apparatus that we have available to perform these scans has this filter in place which attenuates the signal 9.3 dB at 20 kHz, 34.7 dB at 100 kHz, and 12 dB/octave after that. The equipment used is incapable of making measurements above this band. In addition, the standard probe that is used for this measurement is designed for low frequency audio-band use only. It is not deigned to be used, nor is it calibrated outside the human hearing range (less than 20 kHz). Unfortunately, with the resources available to us we cannot characterize the effect of the battery above 20 kHz.
Note concerning cell/battery EMF contours and figures:
Black, blue or yellow area blocks in EMF emission (or, MN-emission) contour are test samples footprints.
Plots represent test sample (cells or batteries) footprints.
Li-ion cells and batteries were tested with their electrical connection positioned to the right. Connector side is noted at “CS” and non-connector side as “NCS”.
Cell or battery label-side (LS) and non-label-side (NLS) refer to the face of the cell or battery with and without printed information, respectively.
Cell/battery NLS MN-emission contour plots are inverted (180° rotation around the X-axis). These allow viewing the cell/battery NLS MN-emission from the same direction as LS (both facing the phone speaker).
6. Results
6.1. +/− Tab Position Effects
Figure 5 shows MN-emission profiles for the model jelly-roll in X and Y directions with +/− tabs positioned on opposite ends (Case-A), center (Case-B), and the same ends (Case-C) of the Cu-foils. In Case-B, +/− tabs remain in-between the walls of the model jelly-roll. In Case-C, +/− tabs are positioned on the termination end of the model jelly-roll. The progression of colors, bright yellow-red-blue-green, is representative of high-to-low MN-emission levels.
Table 1 gives maximum and minimum MN-emission values for the three cases. Note that Cases B and C MN-emissions values are lower and more compressed than Case-A. Of the three cases, obviously, Case-B is the best cell design option to reduce battery MN-emission. However, this may not be a preferred choice from a cell manufacturing perspective. Most manufacturers prefer to position cell internal +/− tabs on either the initiation or termination ends of the electrodes, rather than in the middle.
6.2. +/− Tab Lengths and Position Effects
MN-emissions of the model jelly-roll top and bottom faces (TF & BF) were measured through four different combinations: (1) R:Y; (2) B:G; (3) R:G; and (4) B:Y. For both faces, the MN-emission in cases where +/− tabs are nearly overlapped (R:Y and B:G) were clearly lower than others having distance between the +/− tabs. Most importantly, positioning of +/− tabs closer to the jelly-roll center (B:G) has led to much lower MN-emission than all other cases.
Figure 6 shows a comparison of model jelly-rolls with the lowest (B:G) and the highest (B:Y) MN-emissions with +/− tabs of different lengths placed on the jelly-roll initiation or termination. Numbers in the contours are maximum and minimum MN-emission values.
7. Design Validation
Results of studies above obligated Li-ion cell manufacturers to consider cell design changes for batteries with mitigated MN-emissions. Of these, collections of prismatic Li-ion cells from four major suppliers were tested.
7.1. Manufacturer 1
MN-emission of conventional and several T-HAC cells (6.4 mm × 34 mm × 43 mm) with cathode tab and anode tabs of various lengths (32 mm or 40 mm) positioned at jelly-roll termination were measured. Cell +/− tab inner edge distances were 3.0, 5.0 or 6.0 mm.
Figure 7 shows
X-direction MN-emission contours for a conventional
versus a T-HAC Li-ion prismatic cell (blue squares). Note that the conventional cell MN-emission contour line (e.g., −28 dB·A/m) is extended beyond the range of experimental limits (0.0 <
X ≤ 130 mm) on both the contact side (CS) and non-contact side (NCS) of the cell. For the T-HAC cell, the same MN-emission line remains closer to the cell on both CS and NCS sides.
Table 2 shows −28 dB·A/m MN-emission line distances from the cells’ CS and NCS edges for both label and non-label sides.
7.2. Manufacturer 2
MN-emissions were measured in
X &
Y directions for conventional (A) and T-HAC (B and C) Li-ion prismatic cells (5.3 mm × 34 mm × 50 mm) with internal tabs of 27 mm long. Cell tab inner edge distances were 5.0 mm or 10.0 mm:
- (A)
Anode tab and cathode tab positioned on jelly-roll initiation and termination, respectively, with both tabs connected to the cell header. External +/− connectors were connected to the cell header.
- (B)
Anode tab and cathode tab positioned on the jelly-roll initiation with both tabs connected to the cell header. External +/− connectors were connected to the cell header.
- (C)
Anode tab and cathode tab positioned on the jelly-roll initiation with both tabs connected to the cell header. External − connector connected on the cell header and external + connector to the cell bottom. This is a preferred design for most prismatic Li-ion cell manufacturers.
Table 3 shows MN-emission contours lines at 15 mm and 30 mm off the cells CS and NCS edges. Again, MN-emission of the T-HAC cells with internal +/− tabs at the same electrode ends (jelly-roll initiation) are lower than those for conventional cells.
7.3. Manufacturer 3
For a more detailed understanding of T-HAC performance of Li-ion cell technology, MN-emission levels of the T-HAC friendly cells from a third major manufacturer were tested (prismatic, 5.6 mm × 45 mm× 46 mm). Cell internal +/− tabs were positioned on jelly-roll initiation: +/− tab lengths were 39 mm and 20 mm long, respectively, with inner edge distances of 4.5 mm. Here we focused on impacts of jelly roll insulated
versus jelly roll in electrical contact with the internal walls of the cell-can. MN-emissions of cells with design conditions noted below were tested:
Type-1 Jelly-roll is fully insulated from the cell-can internal walls, using an excess separator layer wrapped around the jelly-roll. This allows minimal current distribution on the cell-can and therefore current flows directly into the load during discharge.
Type-2 Jelly-roll is partially insulated with the upper portion of the cathode current collector contacting internal walls of the cell-can. In this case, a portion of the cathode current is distributed over the cell-can while current flows into the load during discharge.
To assess variability of Type-2 design impact on the MN-emission, two types (A & B) of prototypes prismatic cells (5.6 mm × 45 mm × 46 mm) were tested:
- (A)
Cell with cathode layer terminated toward the side of the jelly-roll outer face.
- (B)
Cell with cathode layer terminated on the middle of the jelly-roll outer face (manufacturer’s preferred design).
Results show that these design changes have some impact on Y-direction MN-emission and yet no real impact on MN-emission in the
X or
Z directions.
Table 4 shows MN-emission (−32 dB·A/m and −28 dB·A/m) contour line distances from the cells’ NCS edge. Values less than 0.0 dB·A/m indicate that contours lines do not extend beyond the cell area.
7.4. Manufacturer 4
One conventional (mass production) and two prototype T-HAC (manually built) Li-ion prismatic cells (5.5 mm× 34 mm × 50 mm) from the fourth manufacturer were tested. Again, the conventional cell’s internal cathode and anode tabs were positioned on the jelly-roll termination and initiation, respectively. The T-HAC cell’ internal +/− tabs, with 10 mm inner edge distance, were positioned on the jelly-roll termination.
Figure 8 shows MN-emission contours in
X,
Y and
Z directions for the label side of the conventional cell
versus the Prototype-1 T-HAC cell. Comparison of results clearly shows that MN-emission levels for the conventional cells, for any given distance off the cell CS or NCS, are higher than those for the Prototype-1 T-HAC cell. Although the cell designs were nominally identical, the Prototype-2 T-HAC cell showed different results (contours not shown) than the Prototype-1 T-HAC cell.
Table 5 gives distances for MN-emissions contour lines (−20, −23, −28 and −32 dB·A/m) off the cell NCS on the cell label and non-label sides. The difference in MN-emission of the prototype T-HAC cells demonstrates the importance of consistent cell design and assembly. We could not identify the reason for the difference in MN-emissions between these two prototype T-HAC cells other than attributing it to the fact that cells were built using manual process. Therefore, having cells of the same size and capacity does not guarantee similar MN-emission contours.
8. Electrode Cut-Stacked Cells versus Wound Cells
As noted earlier, Li-ion cells are built using electrode winding (jelly-roll) or cut-stack technology. In the latter case, cathode, separator and anode layers are cut into the desired footprints and then stacked on top of each other. The final cell thickness depends on the number of electrode/separator layers and packaging material thicknesses. In this case, tabs from each cathode layer are joined together, and then an additional tab is connected and extended through the cell casing (typically a laminated pouch material). The anode tabs are treated similarly. Unlike wound electrode cells, the cut-stacked cells internal and external +/− tabs distances remain the same. This tends to create EMF emissions with more symmetric patterns than for cells with jelly-roll assembly. To understand the impact of +/− tab separation in Li-ion cells with cut-stacked electrodes, LIP cells (3.3 mm × 40 mm × 88 mm) with +/− tabs distances of 10.8 mm or 7.8 mm were built and tested.
Analysis results show that the Y-direction NM contours lines (−32 dB·A/m and −28 dB·A/m) for the cell with 7.8 mm +/− tab distance remain 5.0 mm closer to the cell CS edge (more compressed) than those for the cell with 10.8 mm +/− tab distance. In the Z-direction, MN contour separation off the cell CS edge, due to difference in the +/− tab distances, increased even more (~10 mm) than in the Y-direction.
9. Battery Testing
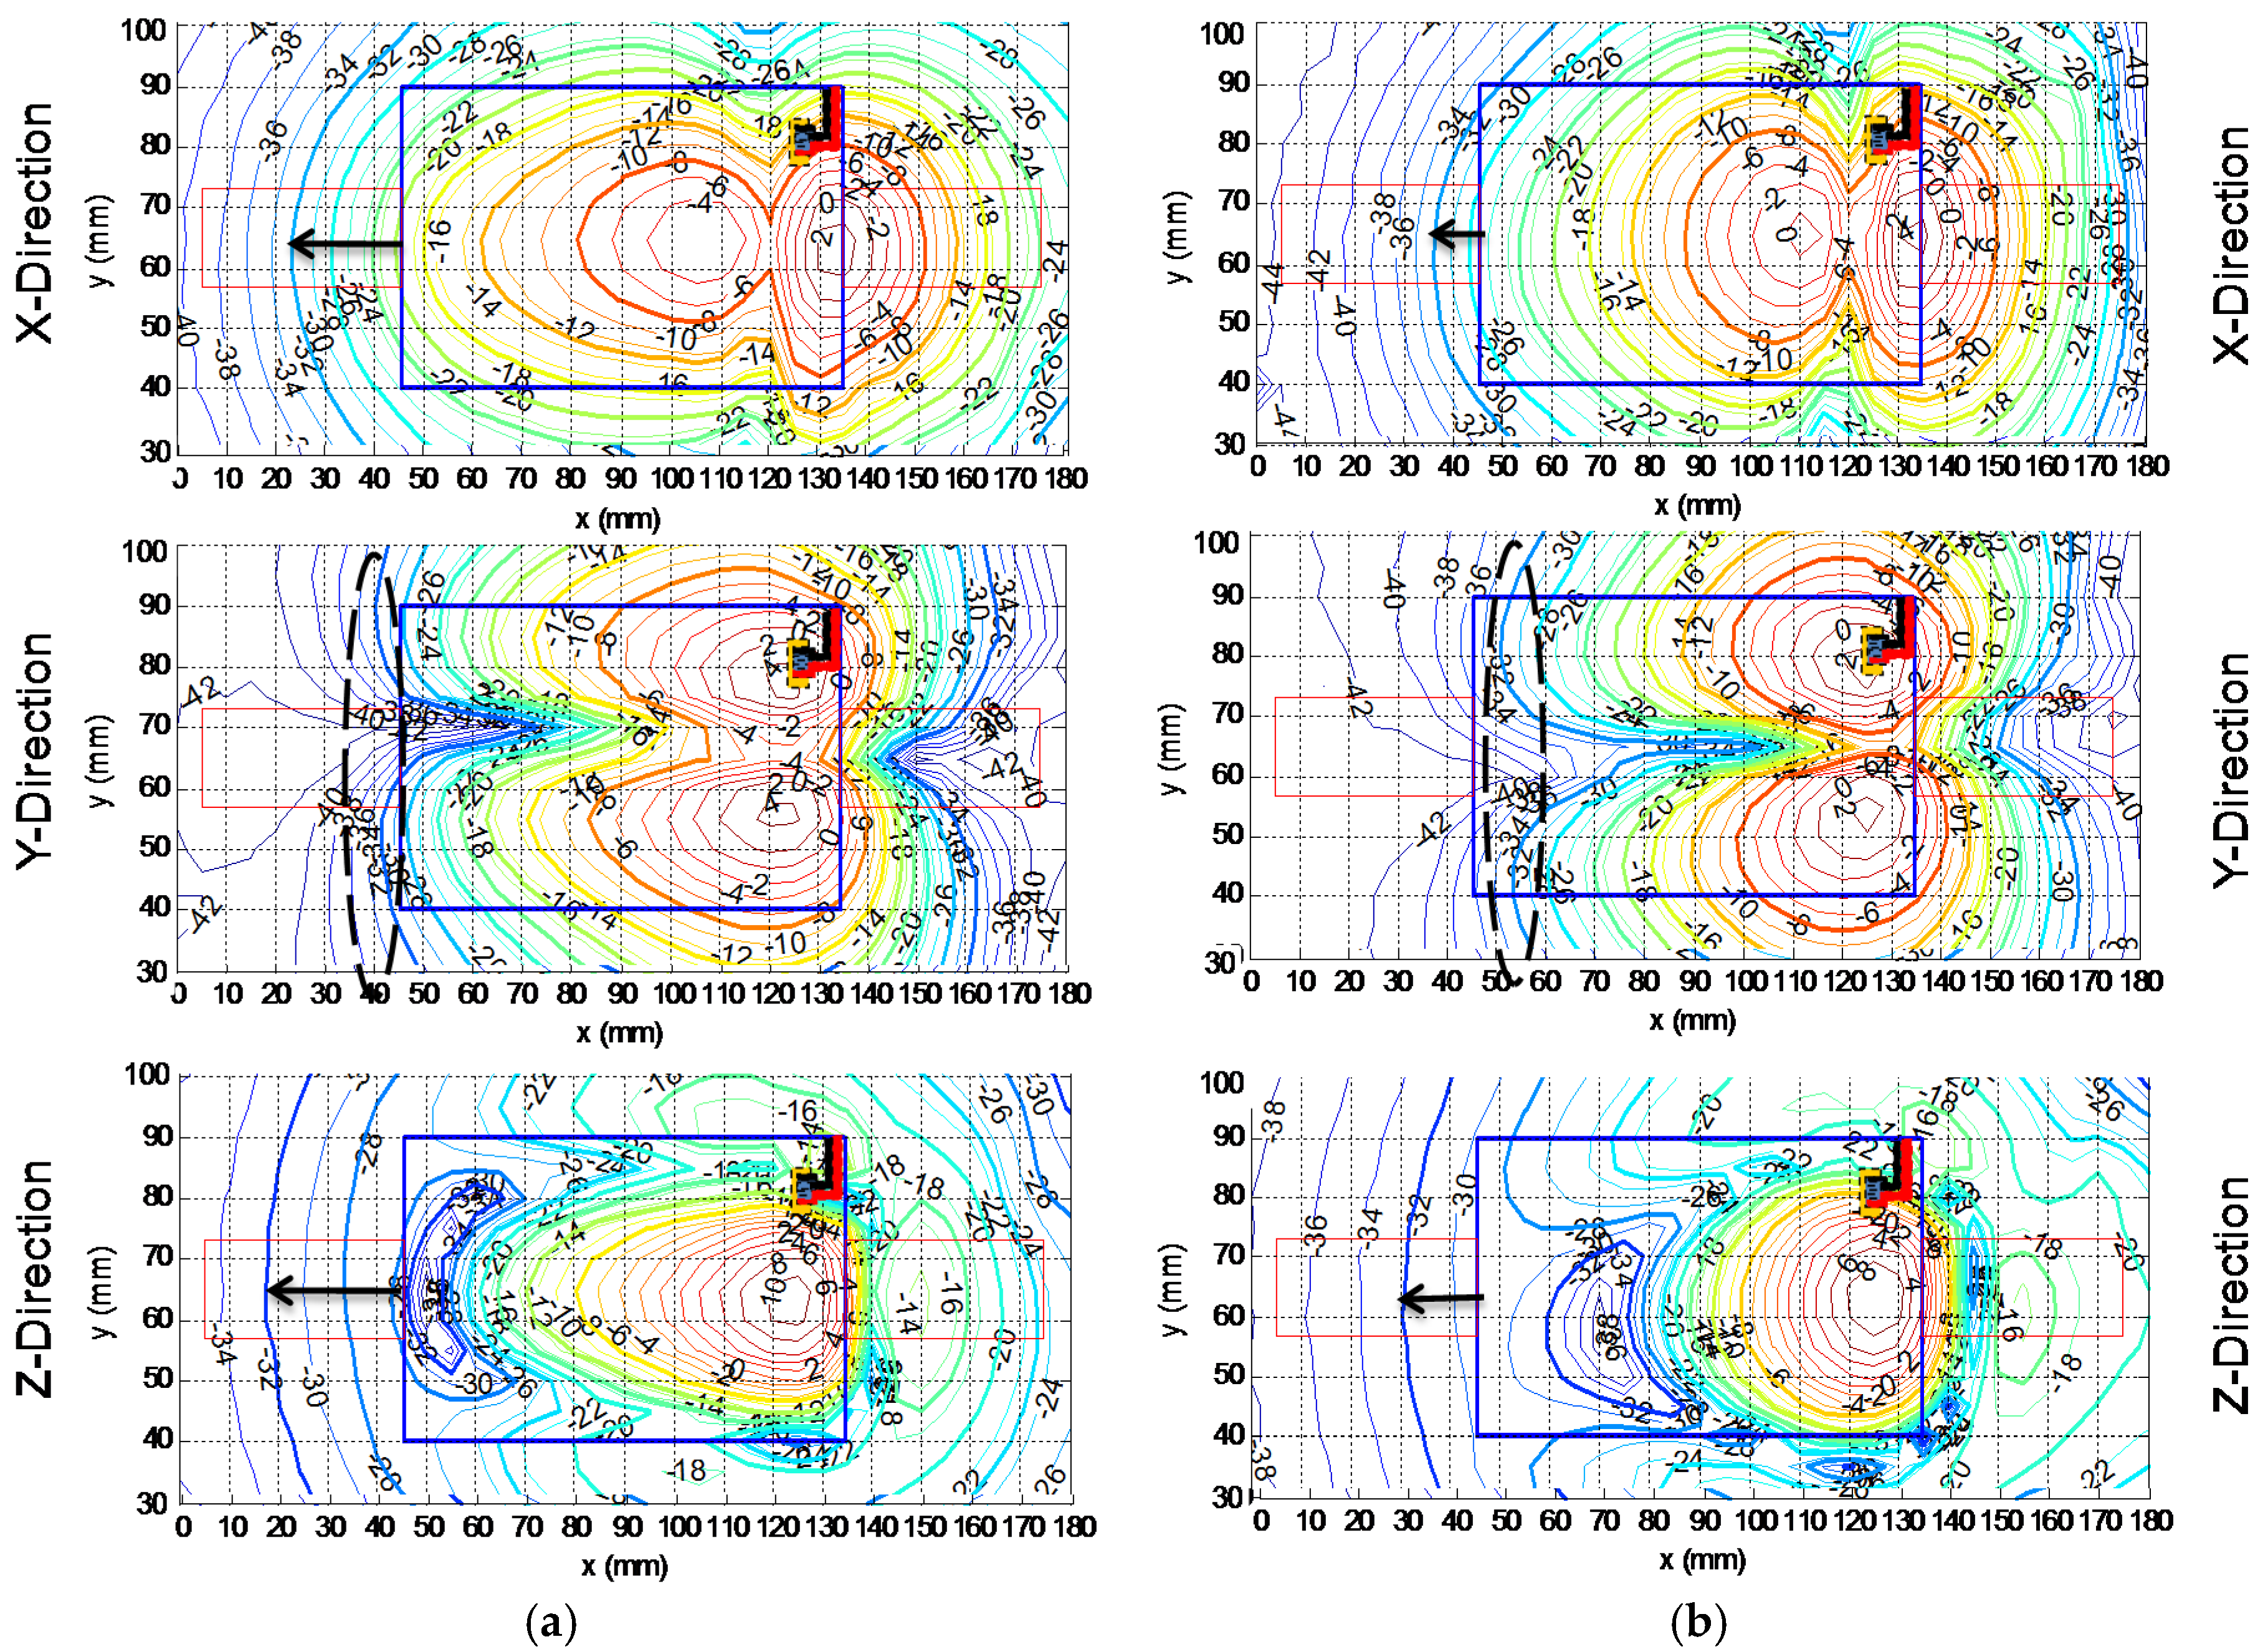
Recent emergence of thin and large footprint smart phones requires matching battery pack designs and sizes. This translates to application of LIP batteries with relatively thinner and larger footprints than batteries using prismatic Li-ion cells. Therefore, we investigated LIP battery MN-emission of similar sizes (3.35 mm × 49.5 mm × 89.5 mm) and capacities from two major manufacturers: (A) a battery using a cell with wound electrodes (jelly-roll); and (B) a battery with a cell using electrodes with cut-stacked technology. Battery
X,
Y and
Z MN-emissions over the label side, facing the phone speaker, were measured (
Figure 9). Comparison of results shows that the battery using cells with cut-stacked electrodes generates less MN-emission than the battery using the cell with the wound electrodes. For clarity, the −32 dB·A/m MN-emission contour distances from the battery NCS edge are noted (arrowed black lines). The MN-emissions difference in the
X and
Z directions are larger than that in the
Y-direction. On the CS, again,
X and
Z MN-emissions for the battery with cut-stacked electrodes are lower than that for the battery with a cell using wound electrodes. In the
Y-direction, MN-emission of the battery using the wound electrode cell is slightly closer to the battery CS than that for battery using the cell with cut-stacked electrodes.
10. Discussion
As demonstrated, Li-ion batteries emit EMF (MN-emission) that could impact phone audio design quality for users with hearing aids. Through this study, we learned that battery MN-emission levels and contour shapes
versus cell design require actual experimentations. Modeling is theoretically possible, but requires accurate cell/battery design parameters including:
Cell internal +/− tab position on the cathode and anode.
Electrode lengths and number of winding/turns in jelly-roll based cell designs.
Number of stacked electrodes in cut/stacked cell designs.
Cell internal +/− tab and external +/− connector distances.
Anode and cathode +/− current paths.
Cell/battery sides facing the phone speaker.
Battery control electronics, printed circuit board (PCB) and connector position on phone.
Battery position versus phone speaker position.
In most cases obtaining required data for modeling cell/battery EMF emission is not feasible because of the propriety nature of manufacturers’ design parameters.
Today’s smart phones, due to their high functionality, are tightly packed with control electronics and the battery occupies about 25% of the phone total volume. Hence, isolating the phone speaker at a sufficient distance from a “noisy” battery may not be practical. Therefore it is necessary to manage allowable MN-emissions from cell/battery structures to enable deployment of T-HAC friendly phones that meet FCC requirements.
Cell/battery MN-emission changes depend on their designs. Batteries with longer lengths are a better match for T-HAC friendly phones, if the phone speaker is placed on battery non-contact side, because of the lower MN-emission than on the contact side. This approach is more effective for batteries using cells with: (1) cut-stack electrodes or (2) cells with internal +/− tabs positioned at jelly-roll initiation than (3) cells with internal +/− tabs positioned at jelly-roll termination. Our overall studies show that Types 1 and 2 cells effective MN-emissions can be lower, more symmetric and reproducible than Type 3 cells. Type 3 cells, however, could provide limited flexibility by positioning the MN-emission contour sweet spots to align with the phone speaker position. This approach is more effective for wider and thicker cells where the cell internal +/− tabs and external connectors have wider area for adjustment. Thickness helps the battery MN-emission source to sit further away from the phone speaker, assuming the opposite sides of jelly-roll termination of the cell is facing the phone speaker. Proper battery to phone connection positioning could provide limited suppression or deflection on MN-emission contours over the specific areas of interest. Additional studies on these subjects are covered in patented information [
2,
3].
11. Authors’ Notes
Additional test results (to be published later) show that battery circuit design and its connection position with the phone could also impact the effective MN-emission. For example, traces in the PCB may have +/− current paths in close proximity (leading to noise cancellation) or current paths traced from opposite ends of the board (leading to noise enhancement). This may result in trade-offs between efficient PCB design, and minimal MN-emissions. For multi-cell batteries (follow up publication), positioning of cells with careful consideration of external +/− current traces canceling each other’s MN-emission is critical. An example of two cells connected in parallel (2P) battery showed arranging the cells in a stacked orientation produced less MN-emission than a side-by-side arrangement.
The intent of this article is to raise industry awareness on Li-ion battery EMF emission that could impact audio quality of hearing aids. This subject has not been openly discussed or widely studied. For confidentiality reasons, cells’ manufacturer names and some test cell and battery capacity values are not disclosed. Li-ion batteries MN-emission values/patterns vary based on battery size, design, manufacturing, and operating conditions; Li-ion cell/batteries of similar size/capacity from different manufacturers could show different MN-emission levels/patterns.
12. Conclusions
The HAC Act of 1988 requires the FCC to ensure mobile phone service providers (US and its territories) comply with the new hearing aid requirements. This in part requires T-HAC with inductive (magnetic) coupling from cell phones not to interfere with the hearing aid’s audio quality. Here, we investigated EMF emissions of conventional Li-ion cell designs followed by design changes leading to reduction of the emitted EMF. In this case, the EMF is considered MN because of its impact on audio quality of hearting aides.
For cells with wound electrodes (jelly-roll), the design changes included positioning of the cathode (+) and anode (−) electrical connectors (tabs) on the same ends or in the middle of the jelly-roll, as opposed to placing the tabs on opposite ends of the jelly-roll as frequently encountered in commercially available Li-ion cells. Placing +/− tabs in the middle of the jelly-roll shows lower levels of MN-emissions than placing tabs on the jelly-roll ends. This design approach, however, is not practical because of difficulties in mass production. Minimizing distance between cell external +/− connectors tends to reduce MN-emission, but this is not nearly as effective as minimizing the distance between the internal electrodes +/− tabs. Other design changes, such as jelly-roll electrical insulation or contact to internal walls of the cell-can, have no major impact on MN-emission reduction. MN-emission patterns of cells with internal +/− tabs on jelly-roll initiation are generally more symmetric and reproducible than patterns for cells with internal +/− tabs positioned on the jelly-roll end, especially adjacent to the cell connector side.
Extensive tests on cells of different sizes from additional manufacturers (data not shown here) showed, by and large, more variability in the MN-emissions from prismatic cells than from LIP cells. This most likely is related to a wider range of design variability among prismatic cells, including cathode tab connected to cell header or cell-can wall, and variable space between internal +/− tabs and/or external +/− connectors.
For LIP cells with cut-stacked or wound electrodes, the internal electrode tabs are aligned with the external electrical connectors. (Tabs are extended through the seal in the LIP pouch). Similar internal and external +/− electrical contact distance leads to more consistent MN-emissions patterns. LIP batteries using cells with cut/stacked electrodes produce less MN-emission than similar LIP batteries using cells with wound electrodes (jelly-roll), as shown in
Figure 9.


