Article

Clean Grain Boundary Found in C14/Body-Center-Cubic Multi-Phase Metal Hydride Alloys

1
Material Measurement Laboratory, National Institute of Standards and Technology, Gaithersburg, MD 20899, USA
2
BASF/Battery Materials-Ovonic, 2983 Waterview Drive, Rochester Hills, MI 48309, USA
3
Department of Chemical Engineering and Materials Science, Wayne State University, Detroit, MI 48202, USA
*
Author to whom correspondence should be addressed.
Batteries 2016, 2(3), 22; https://doi.org/10.3390/batteries2030022
Submission received: 31 March 2016 / Revised: 22 June 2016 / Accepted: 23 June 2016 / Published: 30 June 2016
(This article belongs to the Special Issue Nickel Metal Hydride Batteries)

Abstract

:
The grain boundaries of three Laves phase-related body-center-cubic (bcc) solid-solution, metal hydride (MH) alloys with different phase abundances were closely examined by scanning electron microscopy (SEM), transmission electron microscopy (TEM), and more importantly, electron backscatter diffraction (EBSD) techniques. By using EBSD, we were able to identify the alignment of the crystallographic orientations of the three major phases in the alloys (C14, bcc, and B2 structures). This finding confirms the presence of crystallographically sharp interfaces between neighboring phases, which is a basic assumption for synergetic effects in a multi-phase MH system.

Graphical Abstract

1. Introduction

Metal hydride (MH) alloys are often used as the negative electrode active material in nickel/metal hydride (Ni/MH) batteries, which are currently dominating the hybrid electric vehicle application. To compete with Li-ion batteries in the battery-powered electric vehicles, the gravimetric energy density of Ni/MH batteries needs to be enhanced. Through an Advanced Research Projects Agency-Energy sponsored robust affordable next generation electric vehicles (RANGE) storage-BASF program, the capacities of both the positive and negative electrode active materials were improved [1]. The former was accomplished by using core-shell-structured β-/α-Ni(OH)2, and the latter was developed from a Laves phase–related body-center-cubic (bcc) solid-solution alloy that demonstrated a 30% increase in storage capacity over conventional misch-metal-based AB5 MH alloys. This group of materials is mainly composed of two interlaced three-dimensional frameworks consisting of both Laves and bcc phases (Figure 4 in [2]). The bcc phase can store a large amount of hydrogen [3,4], while the Laves phase acts as both a catalytic agent for electrochemical reactions [5,6] and a hydride activation facilitator due to its brittleness [7,8,9]. In these alloys, at some compositions and annealing conditions, TiNi-, Ti2Ni-, and VNi-based secondary phases can also be observed [10]. The bcc phase, which has a higher V content, also has a higher melting temperature and solidifies before the Laves phase (C14, for example) does. According to previous transmission electron microscopy (TEM) studies on C14-predominant MH alloys, the C14 phase solidified before the C15 phase, and the Ti(Zr)-Ni phase was the last to precipitate and it underwent a series of solid-state phase transformations [11,12,13]. Combining the high-capacity bcc storage phase with catalytic phases (C14, TiNi, Ti2Ni, and/or VNi), the electrochemical performance of the multi-phase MH alloys can be dramatically improved through synergetic effects-beneficial effects observed in the presence of micro-segregated secondary phases that occurred in the multi-phase MH alloys [14,15]. The bcc storage phase has limited hydrogen absorption/desorption kinetics, though its capacity is high. When it comes in contact with the catalytic phases, hydrogen can move in and out of the bcc phase more freely through the catalytic phases functioning as a funnel. In this way, both the hydrogen storage capacity and the absorption/desorption kinetics can be maximized. For the synergetic effects to occur, it is critical to have a clean interface between the bcc storage phase and the catalytic phase, where the electron and proton transfers are not hindered and a strong bonding is maintained to allow plastic deformation during hydride formation from one side with the lower equilibrium pressure [16,17]. Although the microstructure in each phase has been previously well studied, there has been no definitive study on the microstructure at the interface/grain boundary in these multi-phase MH alloys. Therefore, we present a structural study of such interfaces using scanning electron microscopy (SEM), TEM, and electron backscatter diffraction (EBSD) techniques.
In this work, we focus on the interface of a relatively simple multi-phase alloy system which comprises mainly bcc and C14 phases. Alloys P1, P3 and P7 were selected from a group of Laves phase–related bcc solid-solution alloys with varying bcc/C14 contents [2] for the interface microstructure study. The x values in Equation (1) are 0.7, 1.3 and 2.4 for Alloys P1, P3 and P7, respectively. The compositions in at% and the inductively coupled plasma (ICP) results are summarized in Table 1.
Ti0.4+x/6Zr0.6−x/6Mn0.44Ni1.0Al0.02Co0.09(VCr0.3Fe0.063)x
With increasing x values, the bcc phase abundance increases in the following manner according to the X-ray diffraction (XRD) analysis: 8.4 wt% (P1), 27.9 wt% (P3), to 54.2 wt% (P7) [2]. In the pressure-concentration-temperature (PCT) measurement after a 2 h thermal cycle between 300 °C and room temperature at 2.5 MPa H2 pressure, the maximum hydrogen storage capacities in Alloys P1, P3 and P7 increase from 0.61 wt%, 1.00 wt% to 1.12 wt% (Figure 1) [2]. Due to the high plateau pressures, the electrochemical discharge capacities measured in the open-air half-cell configuration at the second cycle are only 162.0 (P1), 160.7 (P3), and 170.0 (P7) mAh·g−1 [2]. Further cycling did not improve the discharge capacities significantly. Details of the electrochemical properties of the alloys can be found in [2]. Refinements in composition, fabrication, and activation methods, achieved through a series of studies conducted at BASF-Ovonic [10,18,19,20,21], increased the capacity of this family of alloys to 414 mAh·g−1 (P37) [1]. However, Alloy P37 is more disordered in phase structure and there are more catalytic phases (C14, TiNi, Ti2Ni) involved. PCT curves in Figure 1 show that Alloy P7 exhibits absorption/desorption plateaus like P37 that are not observed in P1 and P3. Thus, comparison of the interfacial micro-structure of the relatively simple bcc/C14 alloys is of great significance in helping us understand part of the performance improvement of the more disordered P37 and shed light on the design of the MH alloy with better performance.
EBSD, also known as backscatter Kikuchi diffraction (BKD) and orientation imaging microscopy (OIM), is a microstructural crystallographic technique that reveals the crystal orientation of the constituent phases in a polycrystal structure using SEM. With an incident electron beam on a point of the sample, an EBSD pattern is collected and the crystal orientation can be obtained from the Kikuchi band positions. Based on the stereographic projections (Figure 2), a simulated pattern is generated and overlaid on the original diffraction pattern to verify if the grain orientation and crystal structure are the best matches. For example, three EBSD patterns collected from various grains in Alloy P3, as shown in Figure 3, are in good agreement with the simulated patterns and have been identified to originate from the same bcc structure but with different orientations. Together with X-ray energy dispersive spectroscopy (EDS), EBSD can provide insight into the microstructure of grains with mixed compositions and orientations [22]. In the research field of MH alloys, the combination of these techniques has been used to study Zr7Ni10-based [23] and C14-based MH alloys [13]. In this paper, we present results achieved by using EBSD to determine the crystallographic orientation relationship among bcc, C14, and B2 phases in Laves phase–related bcc solid solution alloys. Judging from the alignment of orientations observed among various phases, the cleanliness (being free from amorphous, highly defective, and other disruptive regions) of the interface is verified to provide the synergetic effect in the electrochemical environment.

2. Experimental Setup

Arc melting under argon flow with tungsten electrode and water cooling was performed to prepare the ingot samples. Before each run, several heating-cooling cycles were performed with sacrificial titanium in the chamber to reduce the residual oxygen concentration. Next, 12 g ingots were re-melted and turned over several times to ensure uniformity with regard to chemical composition. The chemical composition of the ingot was analyzed using a Varian Liberty 100 ICP optical emission spectrometer (ICP-OES, Agilent Technologies, Santa Clara, CA, USA). The gaseous phase PCT analysis was performed with a Suzuki-Shokan Multi-Channel PCT (Tokyo, Japan) system. A JEOL JSM7100 field emission SEM with EDS capability (Tokyo, Japan) was used to study the microstructure of the samples. EDS mapping from the surfaces of polished samples was used to collect compositional distribution information. An FEI Titan 80–300 (scanning) transmission electron microscope (TEM/STEM, Hillsboro, OR, USA) was employed to study the microstructure of the alloy samples. For TEM sample preparation, mechanical polishing was used to thin samples and followed by ion milling.

3. Results and Discussion

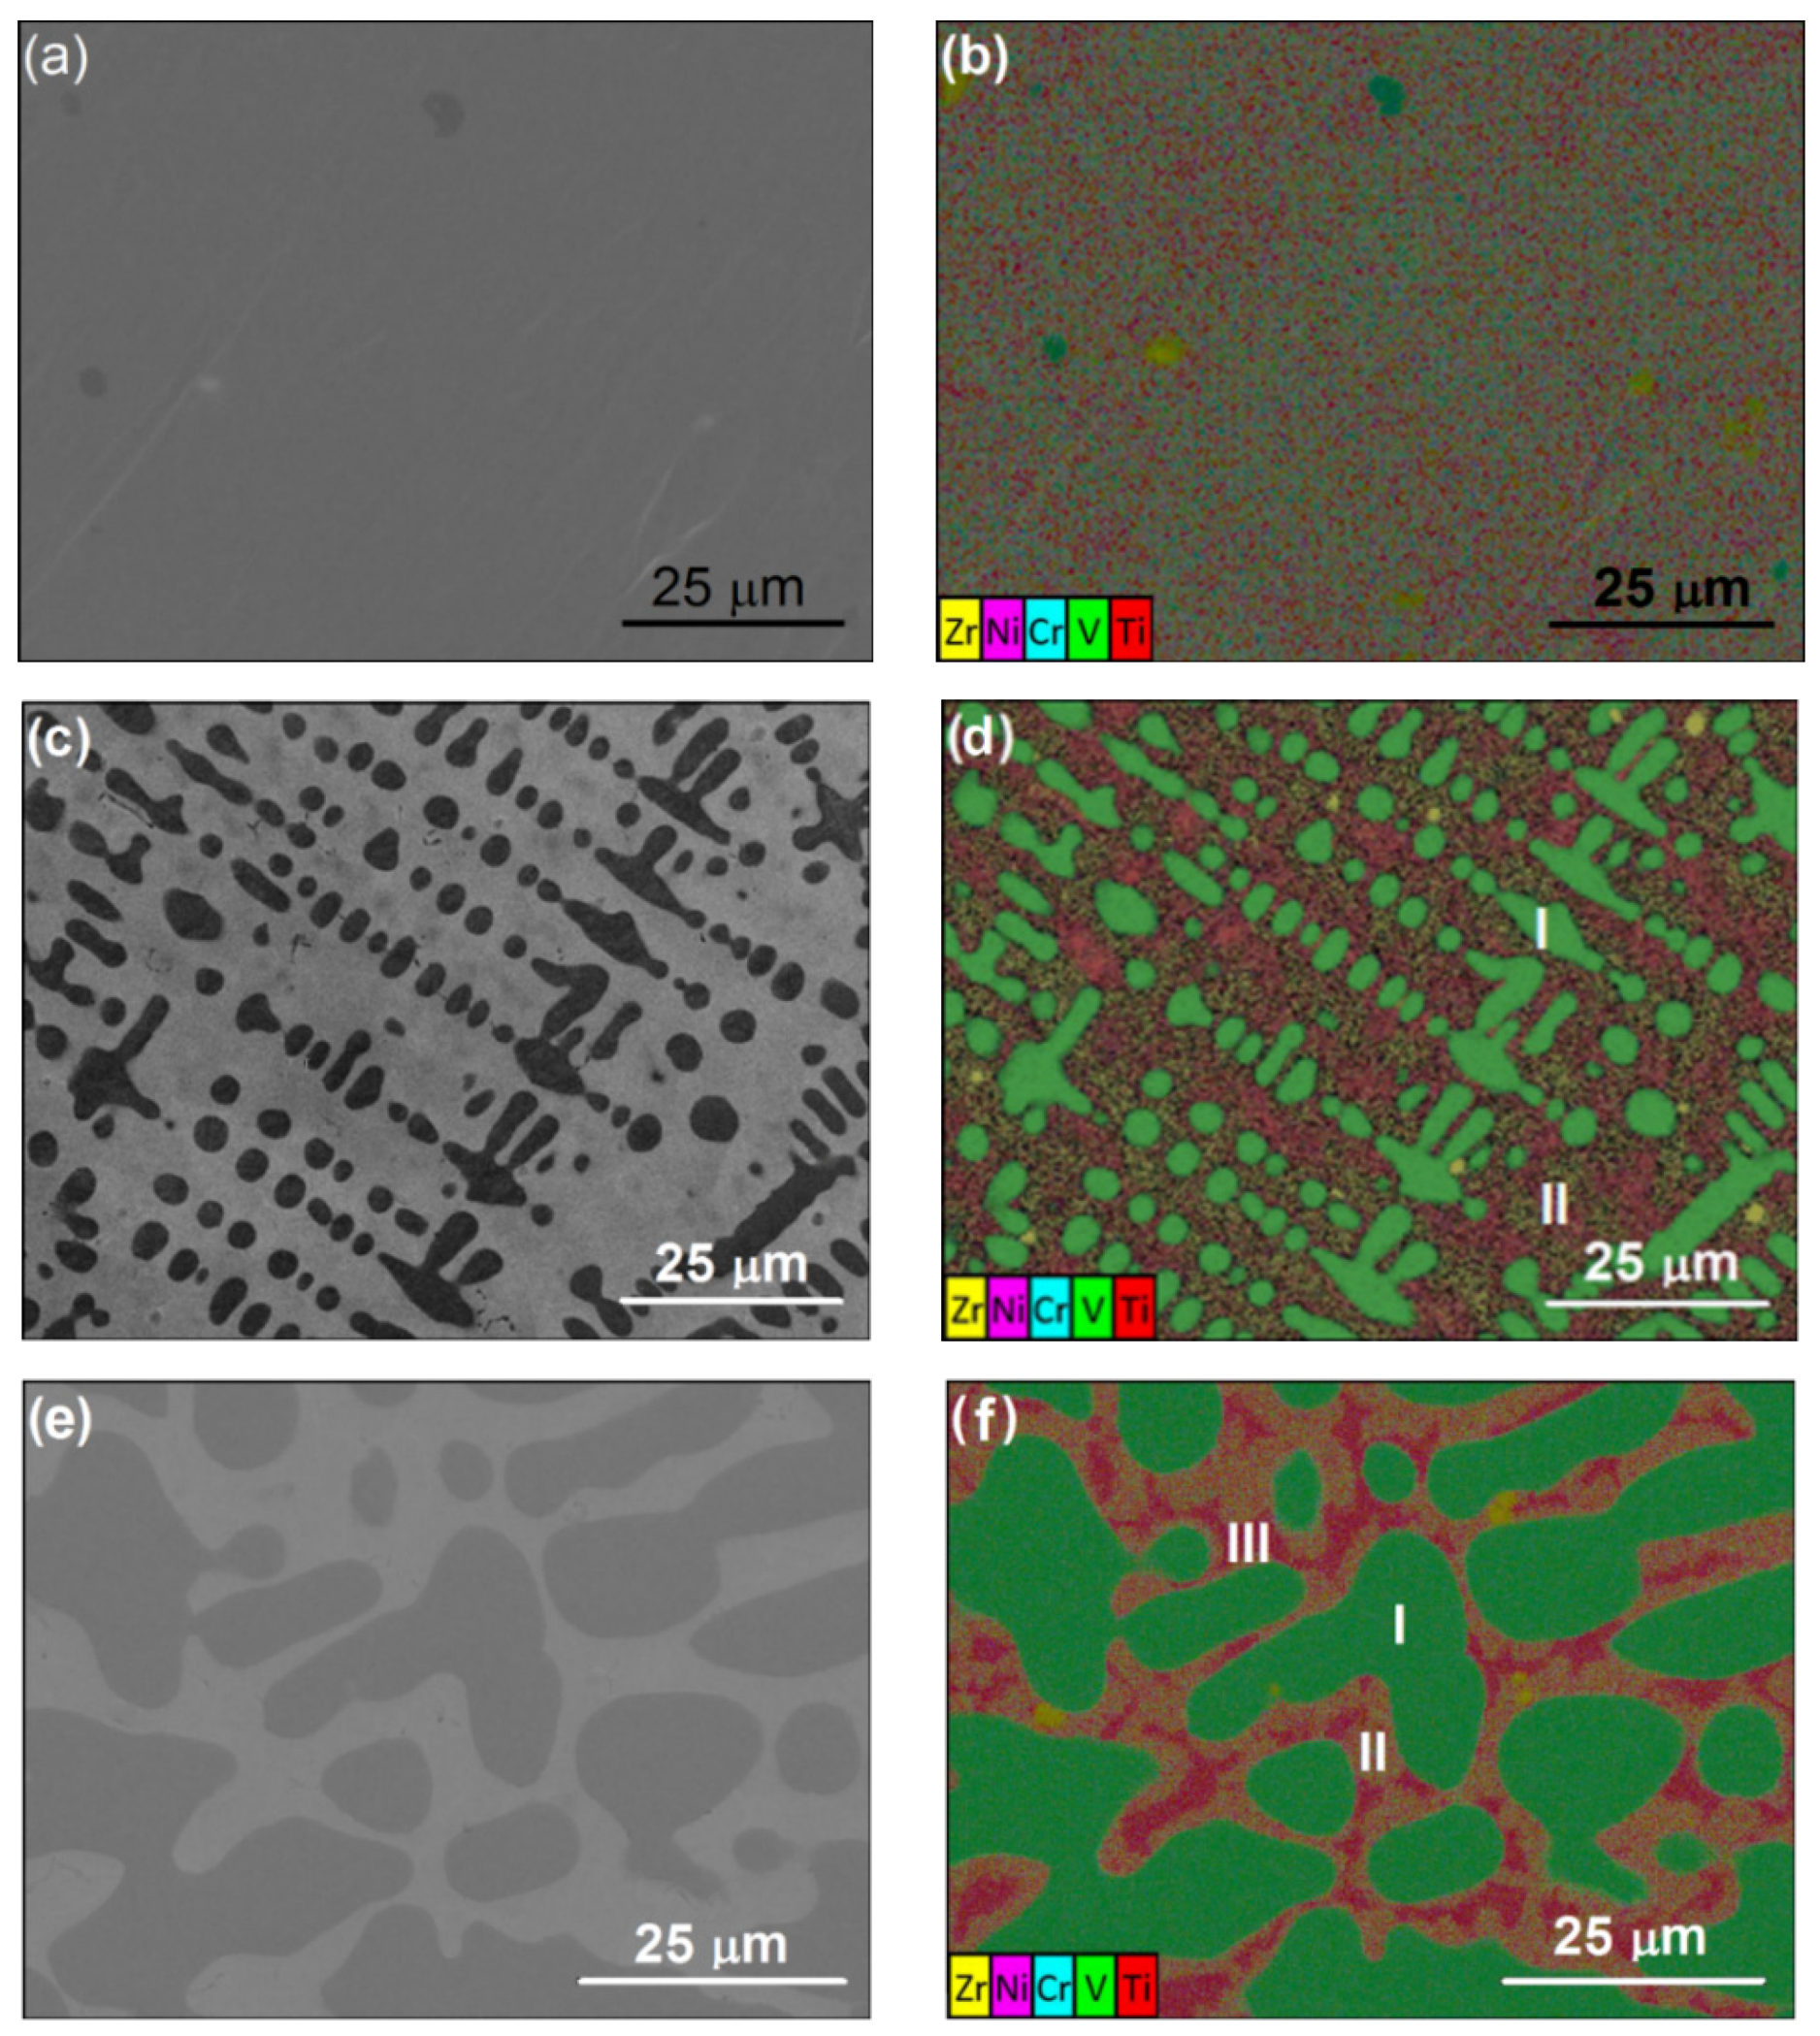
3.1. Scanning Electron Microscopy and Energy Dispersive Spectroscopy Results

First, the microstructures and phase profiles of Alloys P1, P3 and P7 were identified using SEM and EDS mapping. The alloy samples are from the arc-melted alloy ingots and did not undergo any annealing process. The backscattered electron (BSE) image of Alloy P1 shows only one predominant phase (Figure 4a), and the EDS mapping shows that the elemental distribution is uniform in most regions, except occasional V and Zr inclusions (Figure 4b). In accordance with the ICP, EDS, and XRD results, this major phase is believed to be a hexagonal C14 (one of the AB2 Laves phases) [2]. In Alloy P3, the V content increases to approximately 30 at% and the dark regions of Phase I are present in a significant amount and form a fishbone-like network, as shown in Figure 4c. The EDS results (Table 2 and Figure 4d) reveal that this fishbone-like phase is V-rich. The composition of the light regions (Phase II) in Alloy P3 is, on average, close to that of the C14 phase in Alloy P1, although the Ti and Ni contents slightly increase and the Zr and Mn contents slightly decrease, which can be attributed to the phase equilibrium for the V-rich phase (Phase I) in this multi-component alloy. The SEM image in a 100 × 100 µm2 area also shows oriented alignments in the fishbone-like network in Alloy P3. The size of the regions where the frames are aligned is typically 50–100 µm. For Alloy P7, with the V content reaching 40 at%, the V-rich bcc phase volume fraction expands and, thus, the bcc becomes the major phase, as shown in Figure 4e. As revealed by the EDS mapping shown in Figure 4f, three phases with different elemental compositions are present in Alloy P7. The results of quantitative EDS analysis are listed in Table 2. Compared to Alloy P3, we notice that the compositions of Phase I and Phase II in Alloy P7 are similar to Phase I (green in Figure 4f) and Phase II (between green and red region in Figure 4f) in Alloy P2, which are expected to be bcc and C14 structures, respectively, based on their compositions. Phase III (red in Figure 4f) in Alloy P7 mainly consists of Ni and Ti (Figure 4b and Table 2), a composition commonly seen in the secondary phase of C14-predominating alloys [24,25] exhibiting a B2 crystal structure. This B2 phase is the precursor for the solid phase transformations to Zr7Ni10, Zr9Ni11, ZrNi, and TiNi in the C14-predominated MH alloys [11].

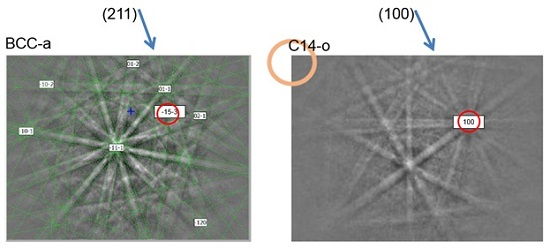
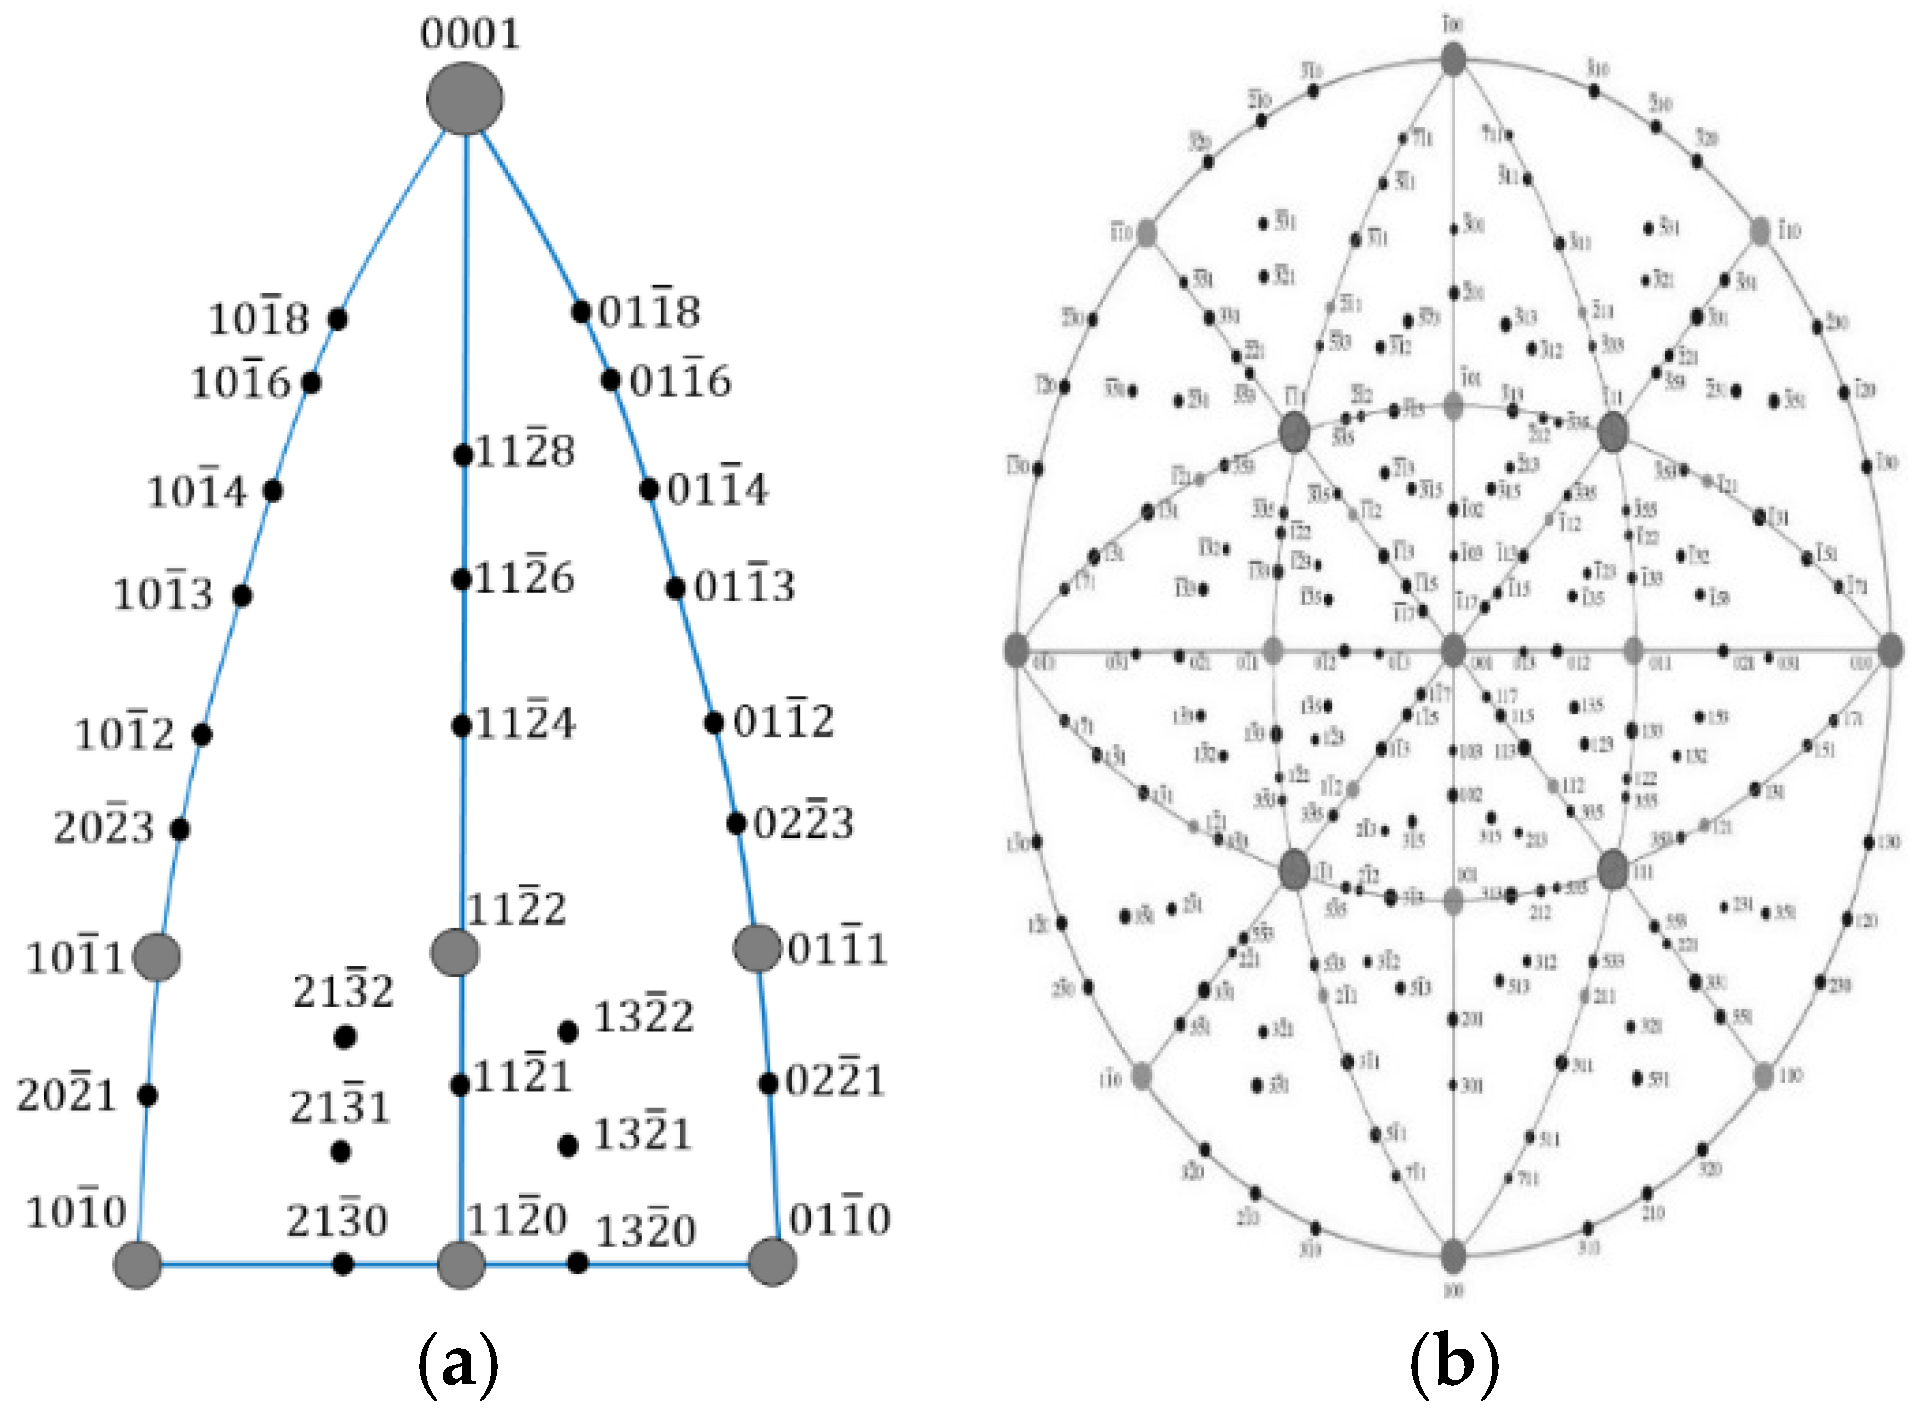
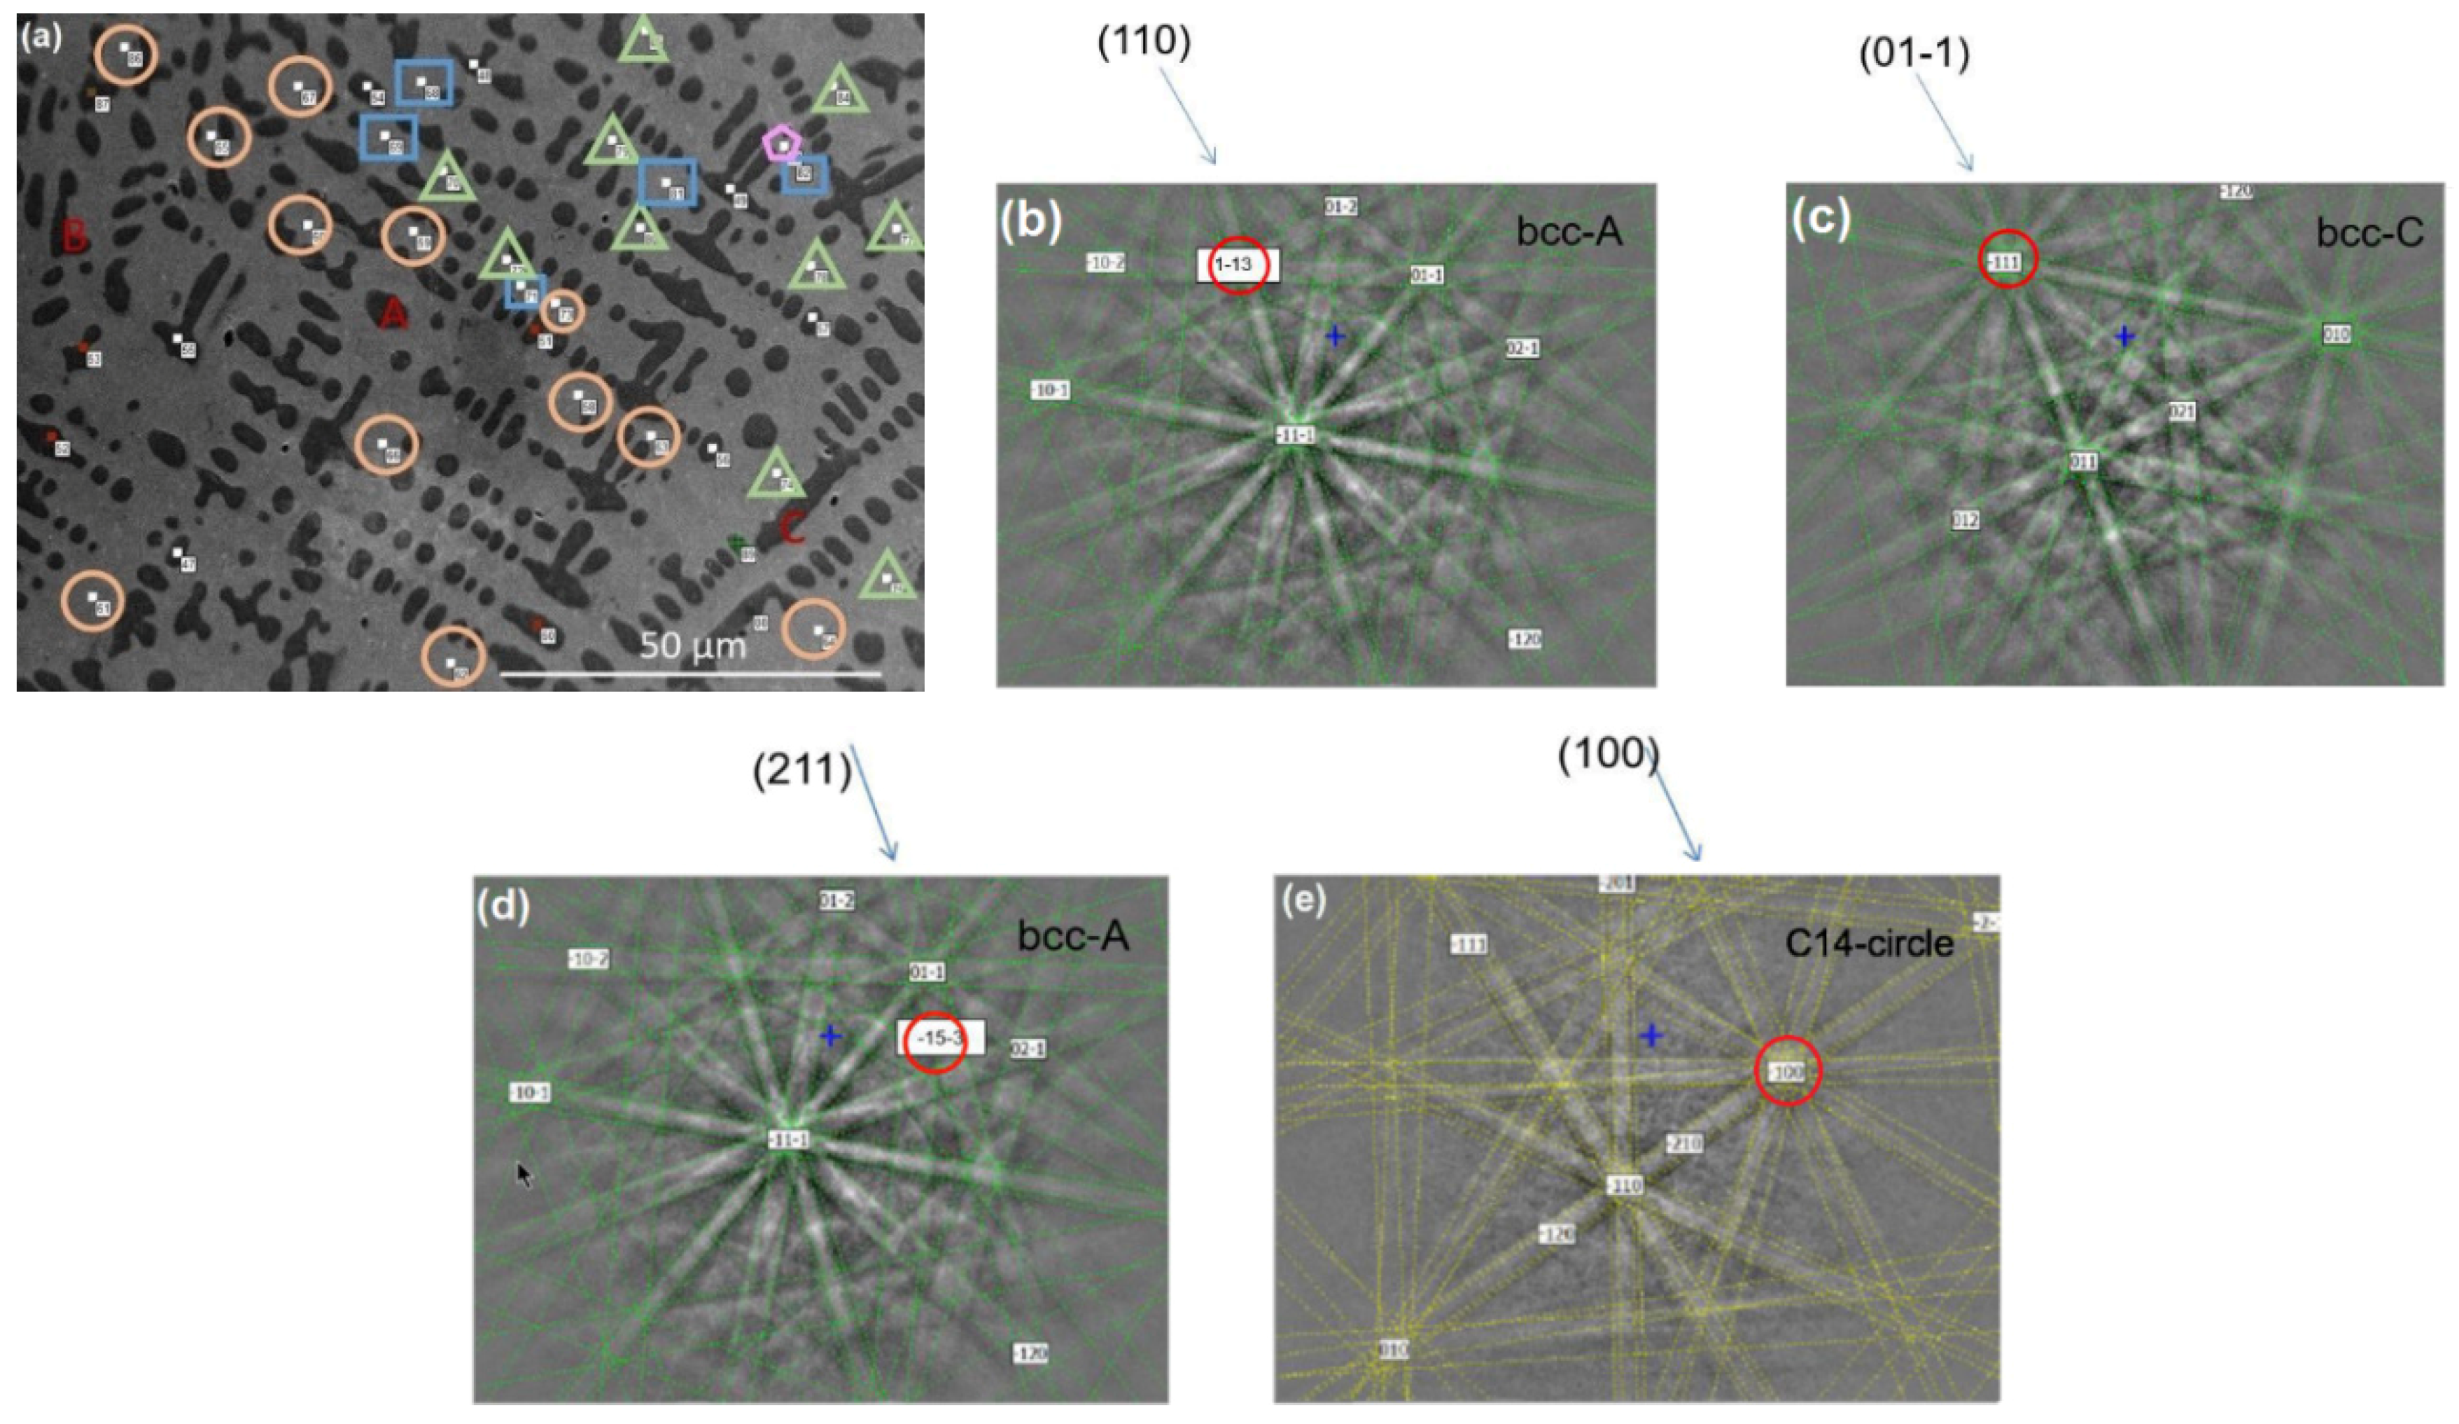
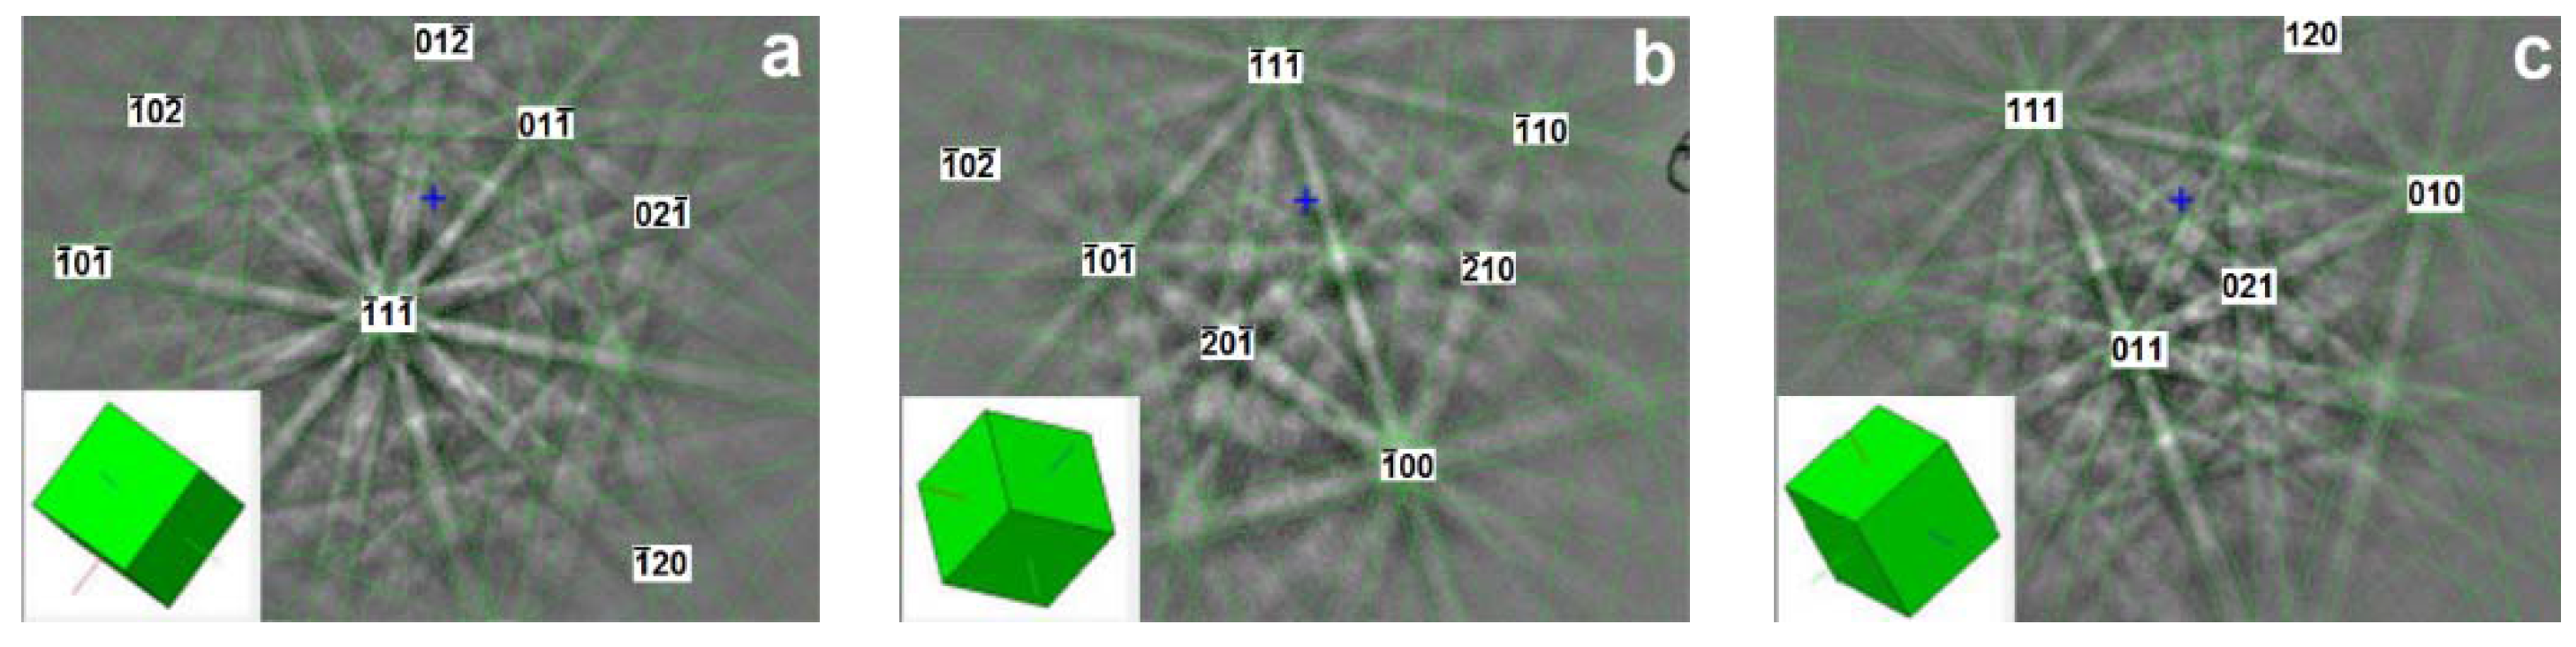
3.2. Electron Backscatter Diffraction Results

To verify the presence of different crystal structures, EBSD was performed at multiple spots in Alloy P3 (indicated by various symbols in Figure 5a). For the dark regions (Phase I), the analysis shows that the EBSD patterns are the same within each zone (Figure 3a–c corresponding to EBSD patterns from Zones A–C) and the patterns from different zones belong to the same structure and are oriented in different directions. Thus, this alignment of EBSD patterns within the same zone suggests that the dark grains belong to branches of the same dendritic tree that formed the primary phase during solidification. The observed lattice distortion can be explained by non-uniform stress. Analysis of the EBSD patterns from the regions shown in Figure 5a demonstrated that the dark region (Phase I) is consistent with the simulated EBSD of a bcc phase with a lattice constant of approximately 3 Å. Meanwhile, the light regions (Phase II) surrounding the bcc dendrites are believed to solidify later and originate from a liquid of modified composition after the network of bcc dendrites is established. The numerous diffraction patterns obtained by EBSD from these light regions (see Figure 5a and representative EBSD pattern in Figure 5e) show that the crystal structure is consistent with a C14 phase with lattice constants a = 4.9 Å and c = 8 Å. The EBSD data also reveals that, in certain regions (typically on the order of 100 µm), the Phase II structure has the same apparent orientation, similar to the Phase I structure.
It is also worth noting that the crystal orientation of neighboring grains is related. For example, for the EBSD pattern from Alloy P3 (Figure 5a), the (110) bcc crystal plane in bcc Zone A is aligned with the ( 0 1 ¯ 1 ) bcc plane in bcc Zone C, as demonstrated in Figure 5b,c. Such an orientation relationship is not only found between Phase I grains that share the same structure, but also between Phases I and II grains with very different crystal structures (bcc and C14). As shown in Figure 5d,e, the (211) bcc plane in bcc Zone A is found to be aligned with the (100) C14 plane in the C14 phase with a circled EBSD pattern (Figure 5a).

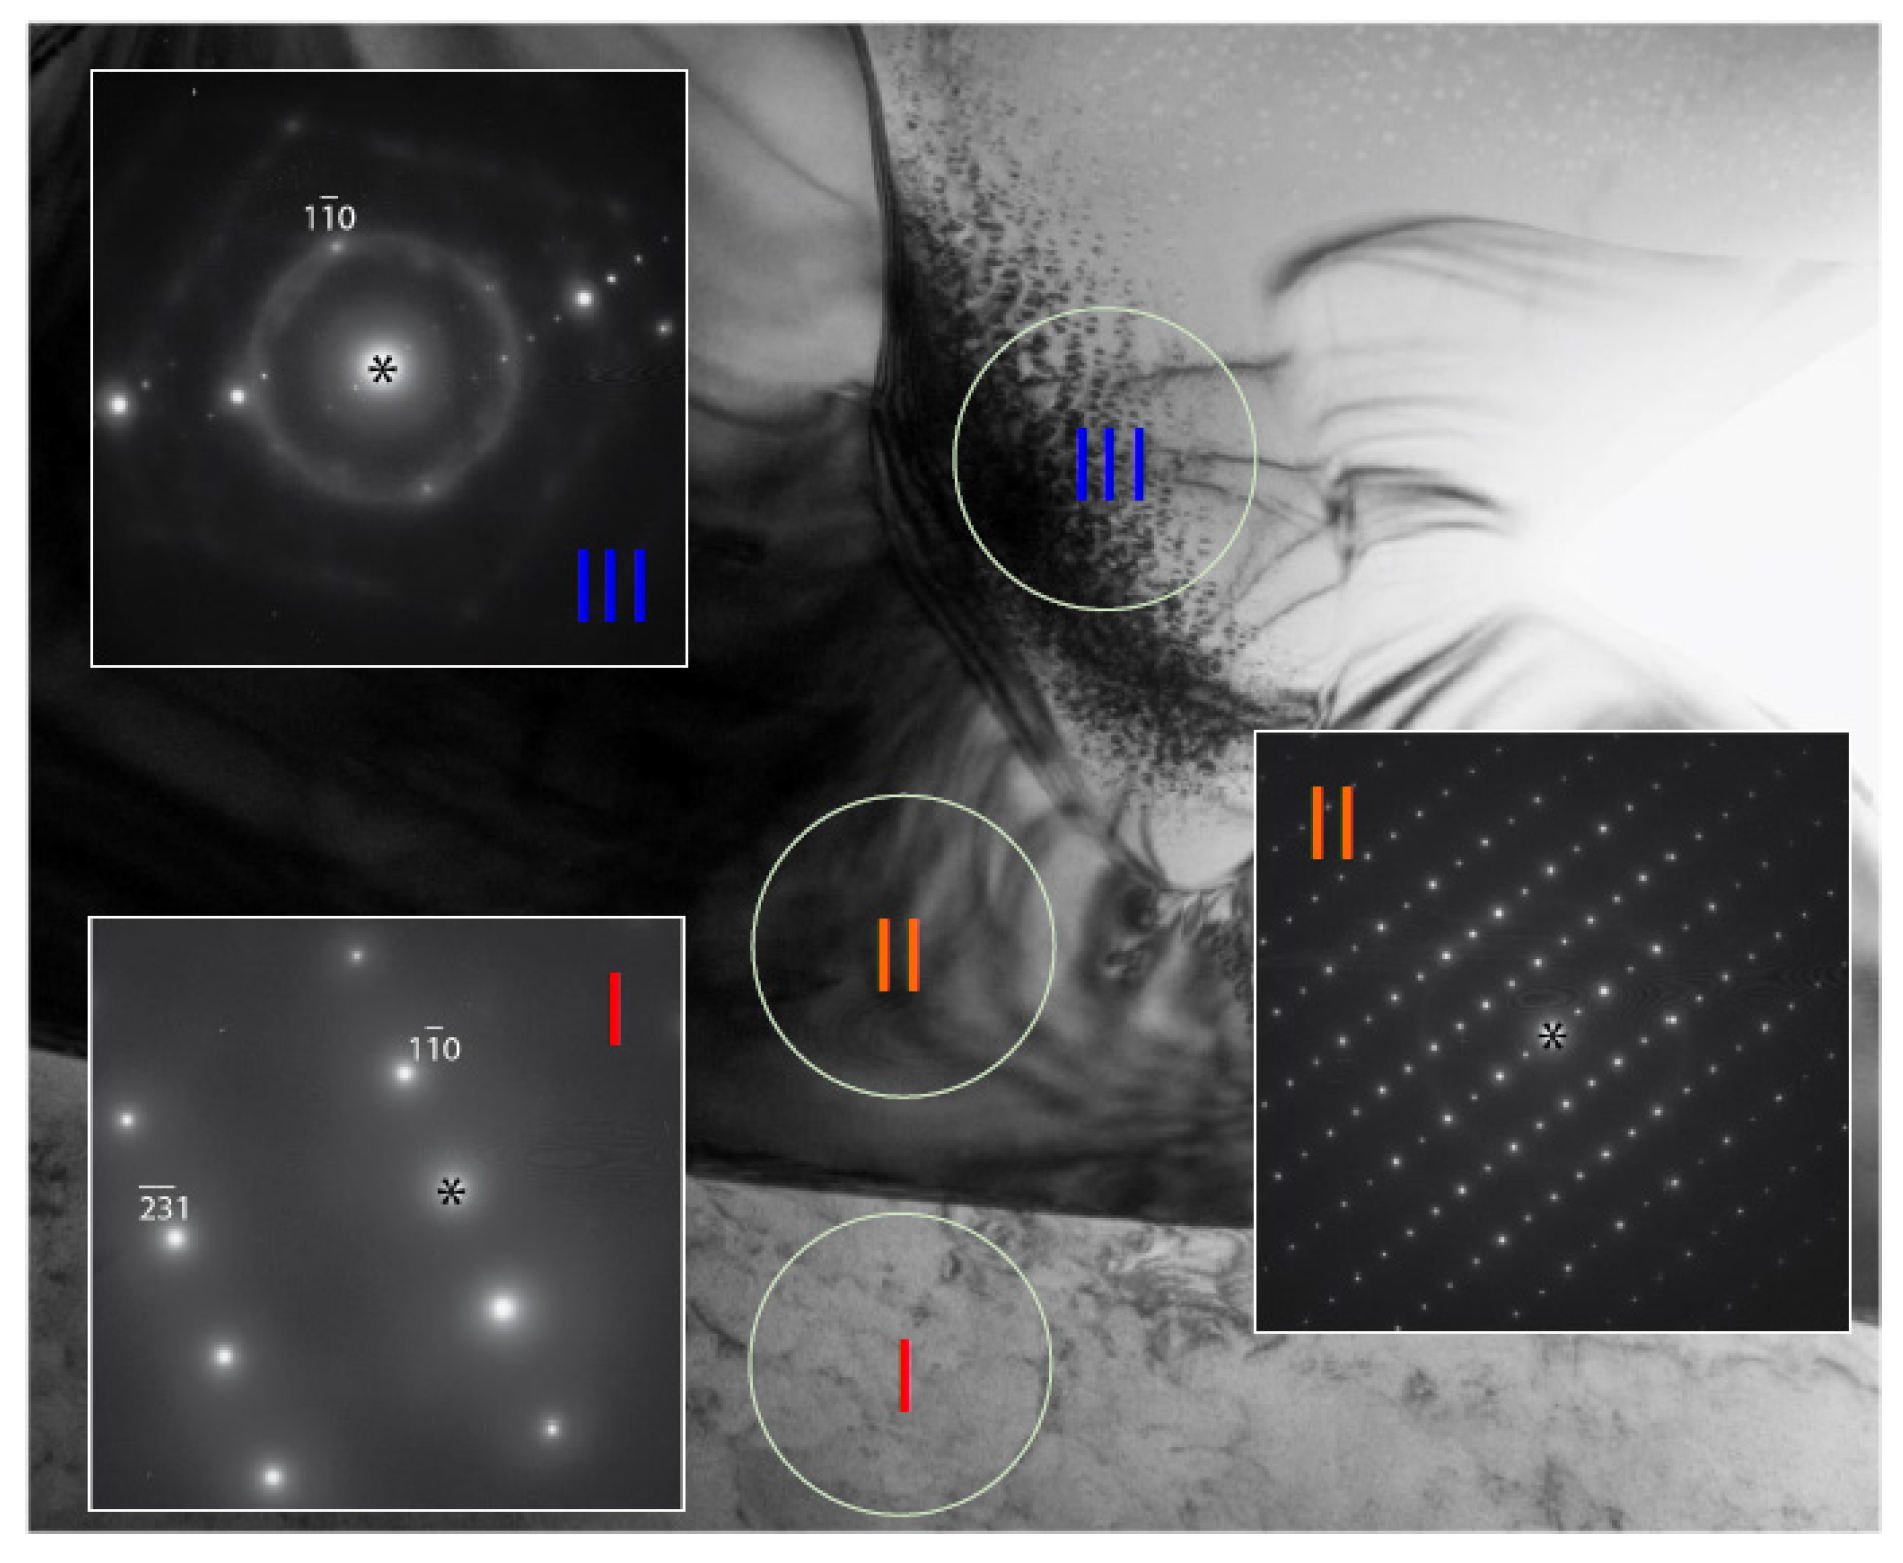
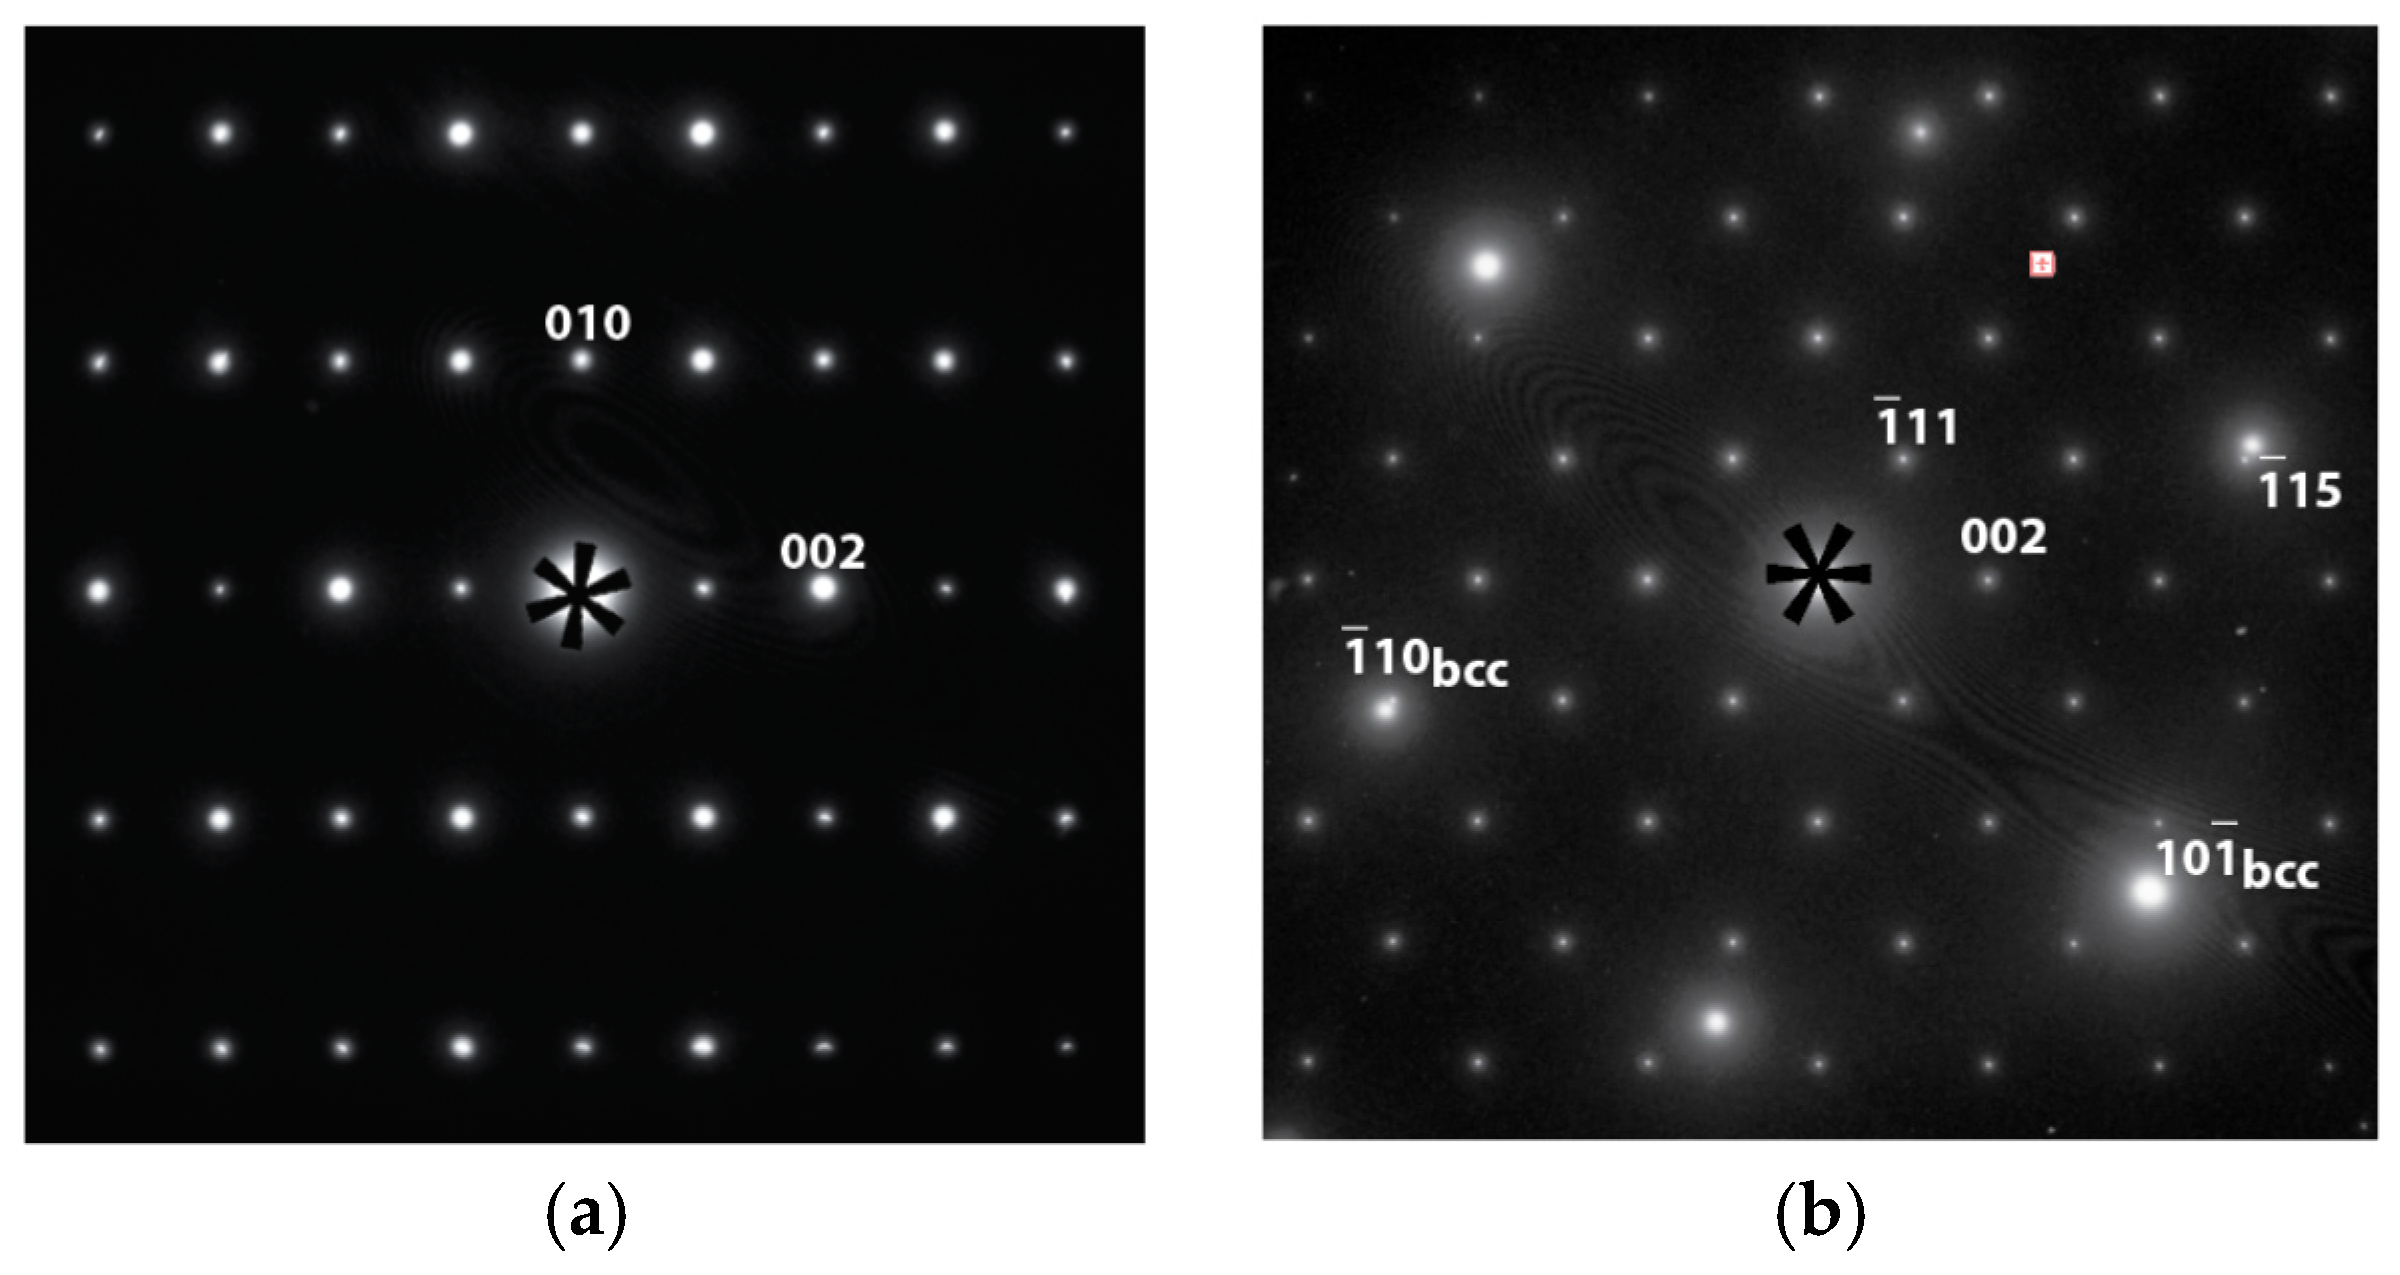
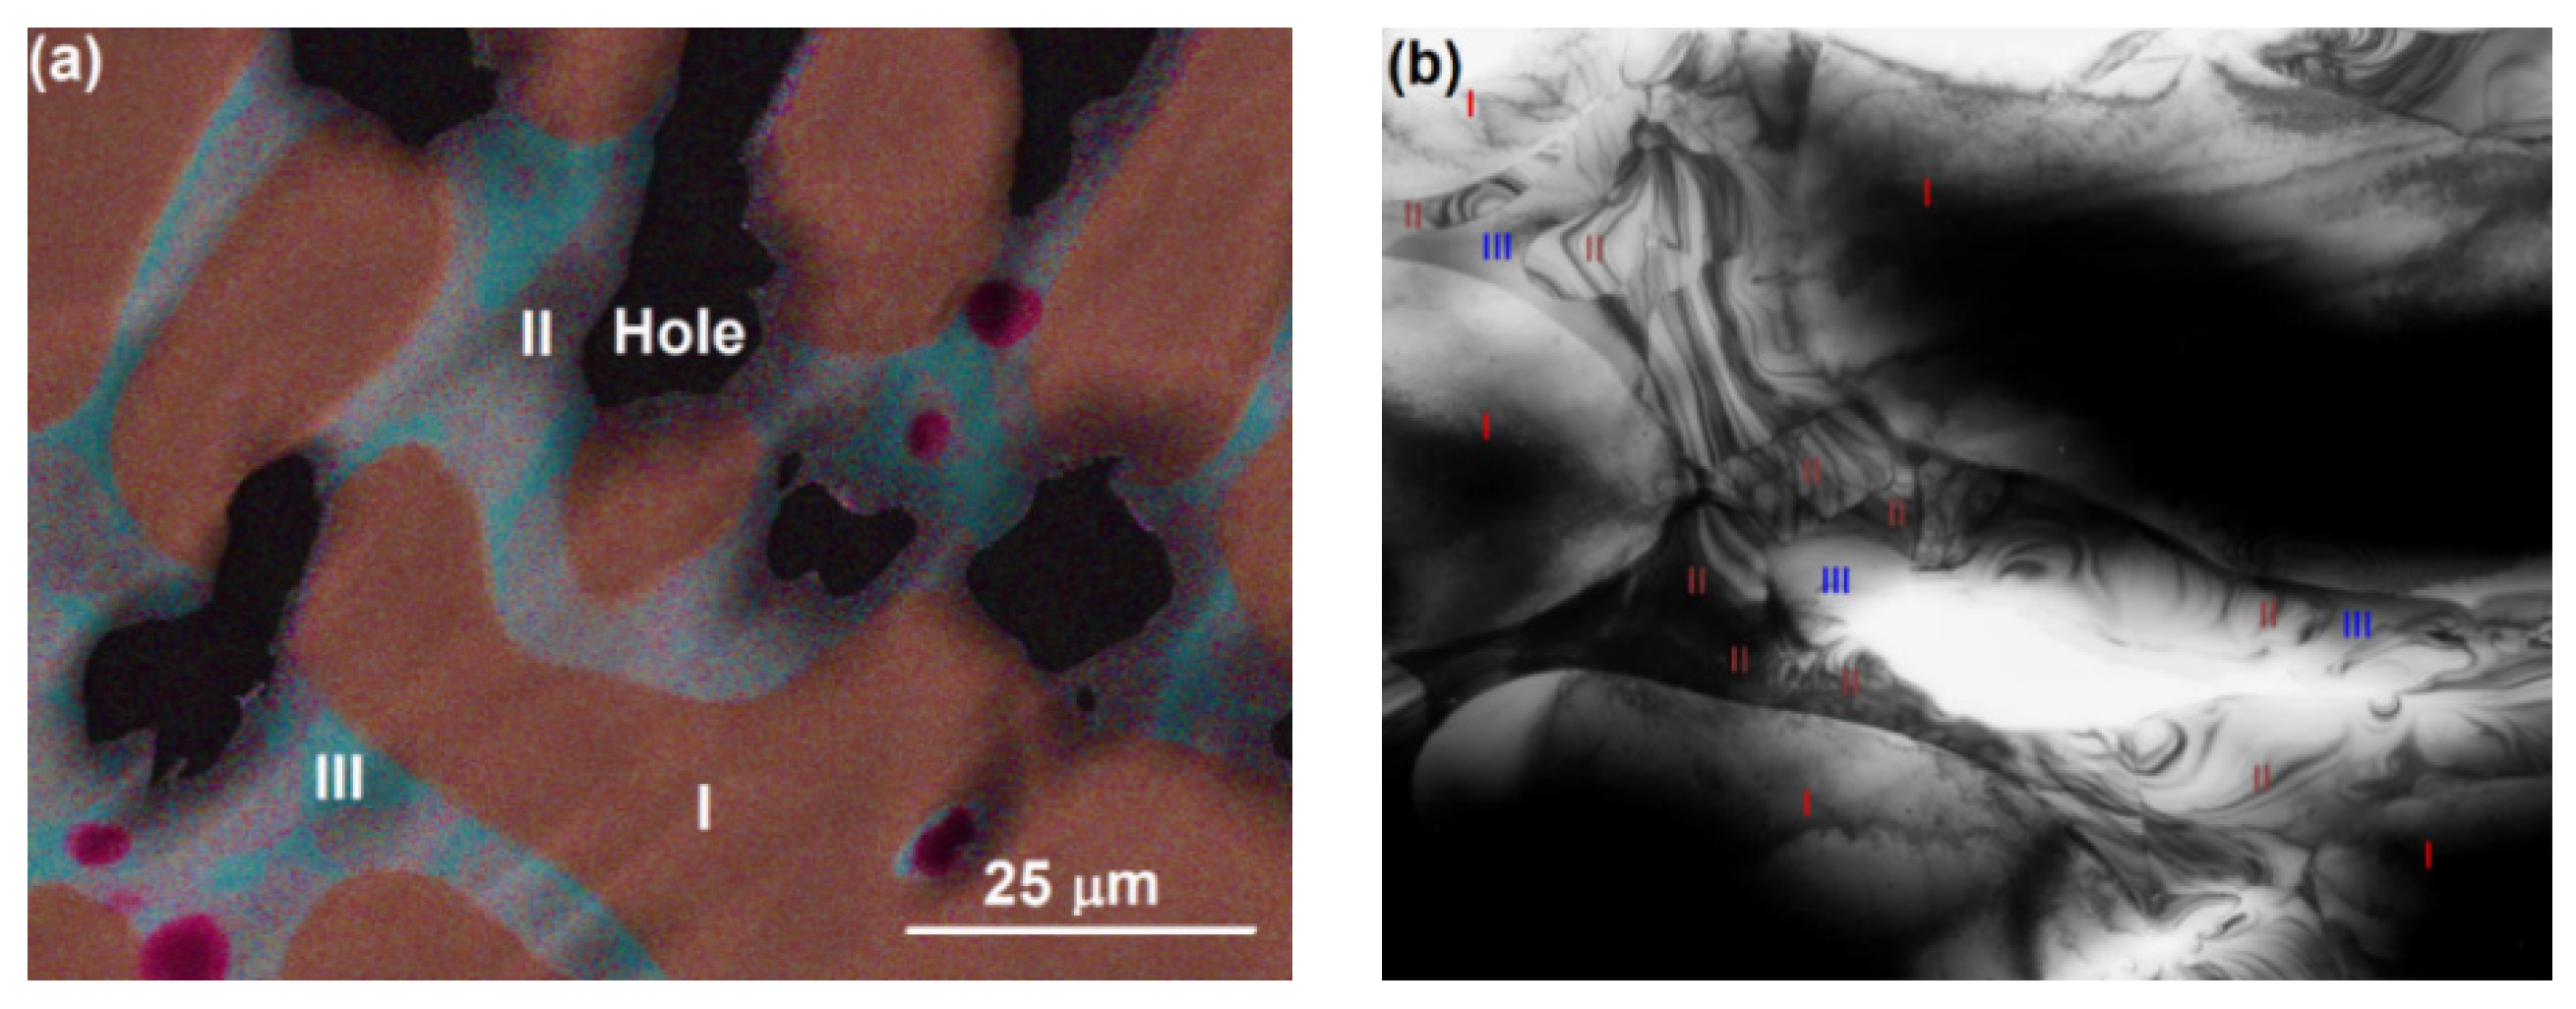
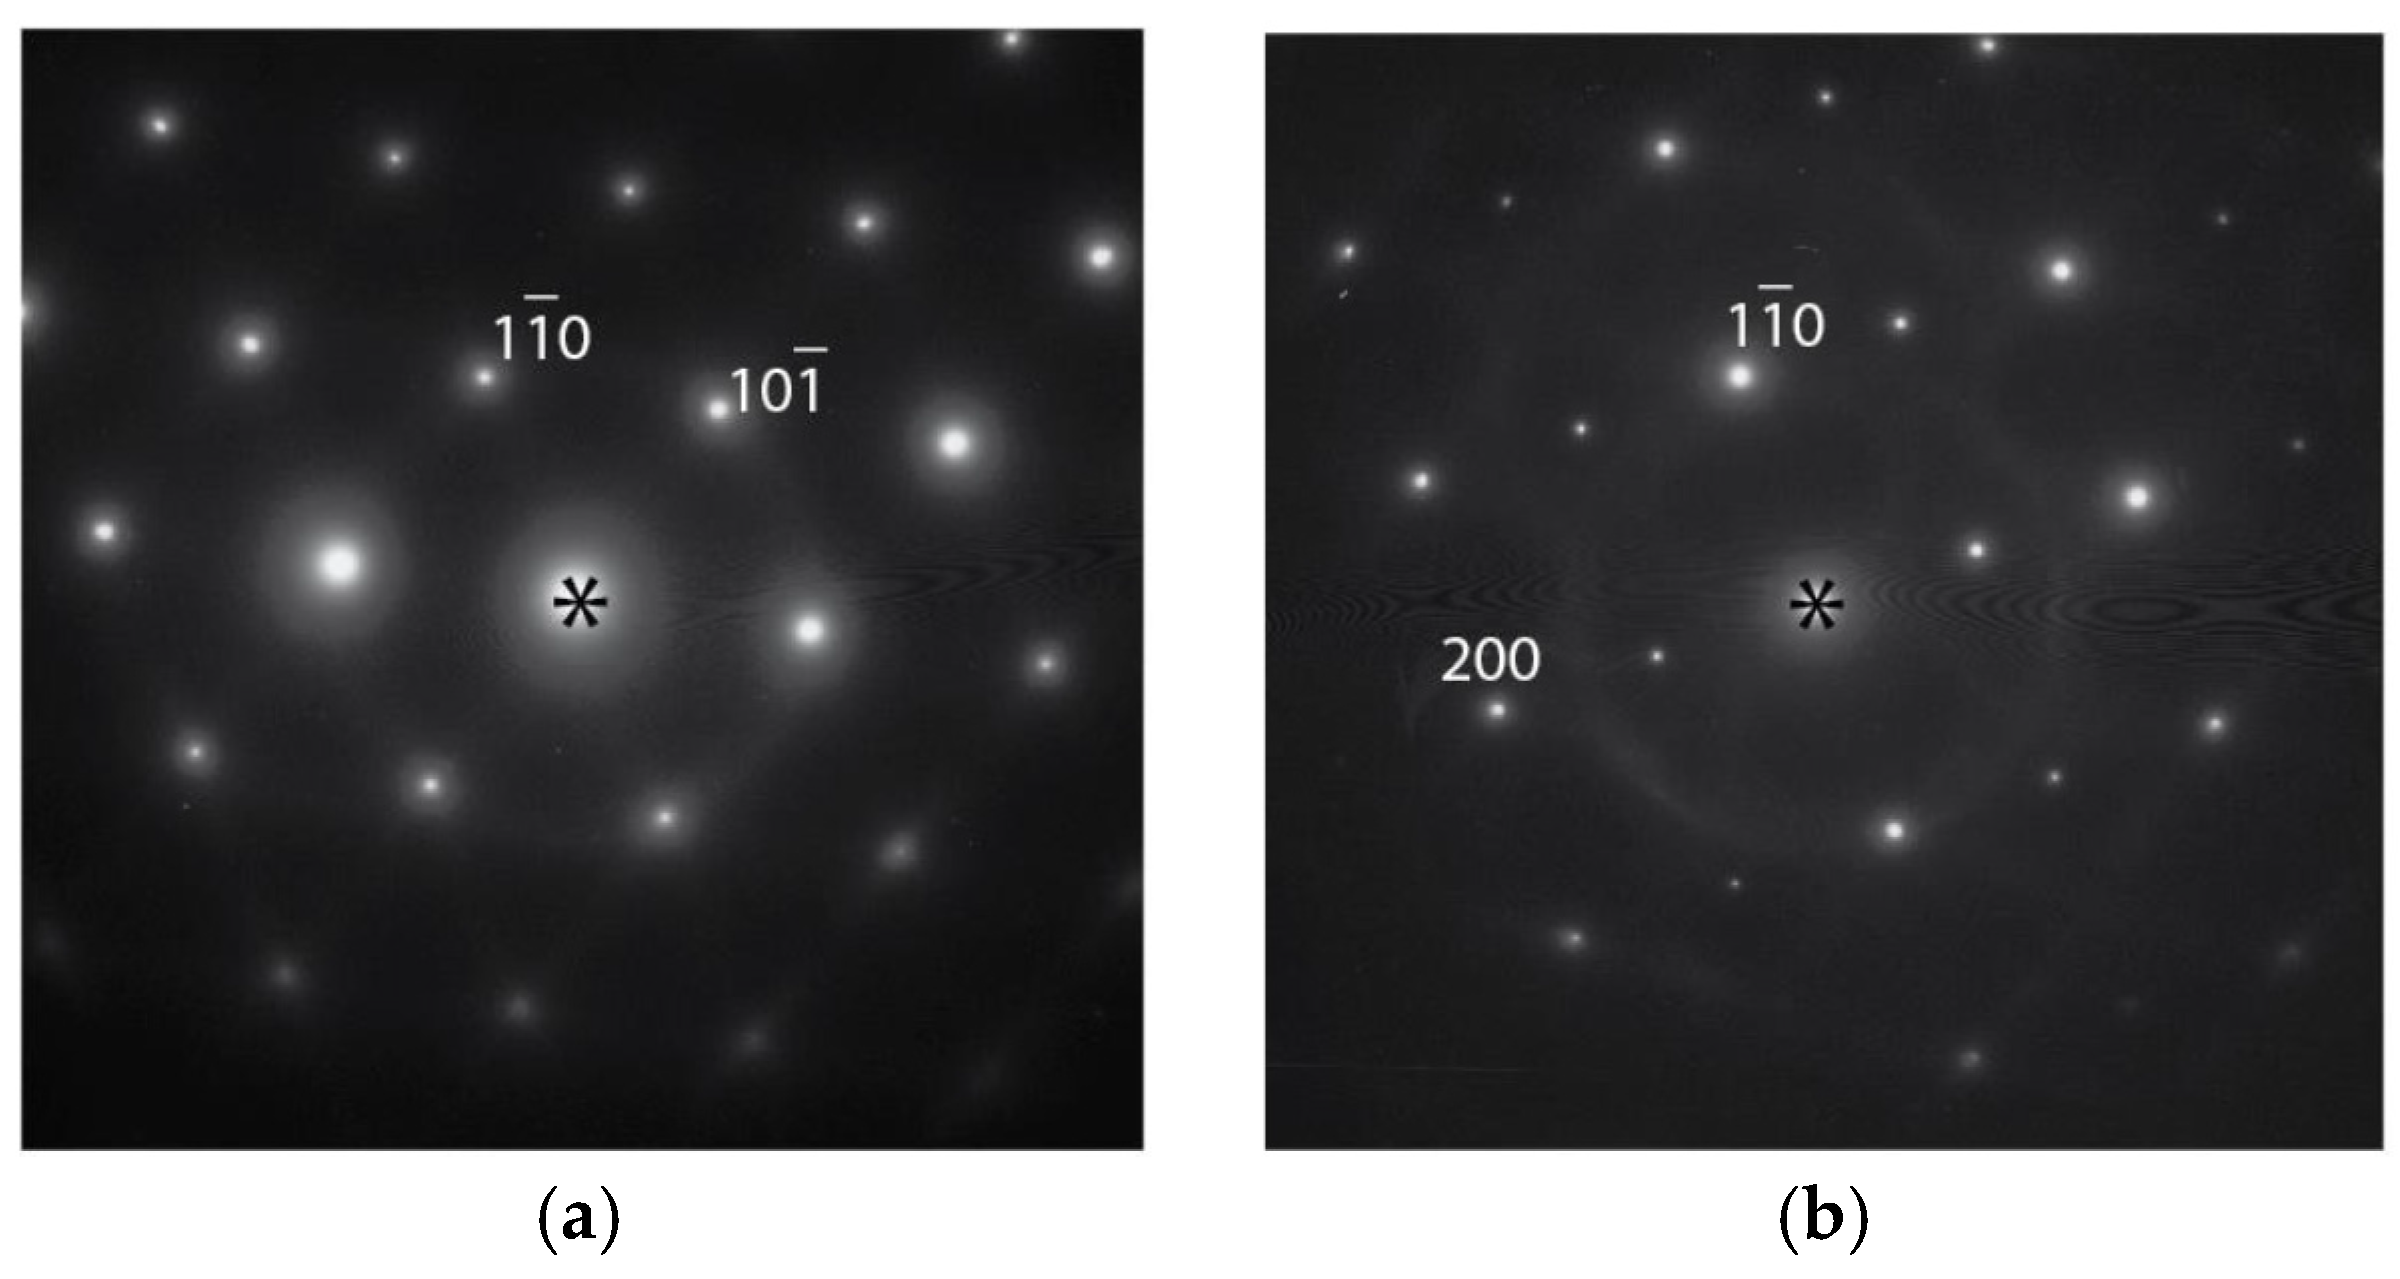
3.3. Transmission Electron Microscopy Results

It is challenging to analyze the crystal orientation of the grains and their relationships in Alloy P7 using only EBSD for the following reasons: (1) operation in the EBSD characterization mode requires the SEM system to be in the secondary electron imaging mode, during which the contrast between Phases II and III is weak; (2) the size of the Phase III grains approaches the rather limited space resolution of EBSD (a few microns), and causes difficulty in determining the point of interest. Thus, TEM was employed as an additional method for studying the crystal structures. Samples of Alloy P7 for the TEM study were prepared by mechanical polishing and followed by ion milling. Before loading the thinned samples for TEM study, compositional mapping, which serves as a guide map during TEM observation, was obtained from the sample using SEM/EDS, as shown in Figure 6a. While Phase I (bcc) is mainly composed of V, Cr, and Mn, Phase III (B2) is predominately Ti and Ni.
On the bright field image at lower magnification (Figure 6b), the dendritic phase (Phase I) can be recognized by the presence of interfaces with positive curvature. Accordingly, the dendritic phase is marked as “I” in Figure 6b, and a bcc phase with a lattice constant of about 3 Å is identified, according to selected area electron diffraction (SAED). Bright field images at higher magnification and SAED patterns from different phases (according to the compositional map) are shown in Figure 7. The interdendritic region with a small volume fraction was targeted to locate the interfaces that separate two (or more) phases. The two phases can be distinguished by the nature of the bright field contrasts. The phase marked as II shows dense diffraction bend contours. The contours presumably result from the TEM film bending to release internal stress during sample thinning. Such behavior is typical for large unit cell intermetallic phases with high elastic modules and no plastic accommodations. The phase marked as III shows a more uniform contrast, which also demonstrates the presence of fine precipitates. Although Phases I and III seem to have similar bcc structures with different compositions, tilting of the TEM samples proved that Phase III had a B2 (ordered bcc) structure. Figure 8 shows SAED taken from Phase III in two orientations, one with a [111] bcc zone axis and another obtained by tilting around the (1 1 ¯ 0)* to [110] bcc zone axis, which clearly reveals (100) order reflections, and thus the B2 structural ordering is confirmed. Dark field imaging with the (100) reflection did not show antiphase boundaries, which suggests that the phase directly crystallized as B2. The B2 structure is also consistent with the composition, which consists mainly of Ti and Ni in an atomic ratio of approximately 1:1 (Table 3) [26]. The fine coherent precipitates observed in the phase (and not contributing additionally to the B2 reflections) suggest that the B2 → B2’ + bcc transformation, which occurs during cooling, forms into a two-phase field to adjust the composition of the B2 phase at lower temperatures. SAED patterns were also obtained from the Phase II intermetallic phase. The SAED pattern in Figure 9a is indexed and it belongs to the C14 structure in the [100] zone axis with lattice constants a = 5 Å and c = 8 Å. However, in Figure 9b, the pattern shows a face-centered cubic (fcc) structure in the [110] zone axis, which is neither a hexagonal C14 (a = 4.9Å, c = 7.98Å for suggested C14 of Alloy P7) nor a fcc C15 (e.g., a = 7.45Å for ZrV2). This pattern indicates the presence of another intermetallic phase in the interdendritic region that can be indexed as an fcc with a ≈ 11 Å in the [110] zone axis. According to the EBSD and TEM observations, the fcc phase is minor compared to the C14 phase. A similar (or the same) fcc phase (Fd-3m, a = 11.319 Å) has been observed in a number of V-Ti-Ni alloys [27].
Based on the SAED patterns, Phase I (bcc) and Phase III (B2) were very close in orientation. Such alignments were present in more than one region, demonstrating a clear relationship in the crystal orientations between Phase I and Phase III. Based on the morphology of phases in Alloy P7, formation of the phases can be understood. Initially there is the dendritic growth of Phase I (bcc) and at the end of this growth, Phase I is surrounded with a liquid of modified composition. The composition of the liquid allows both Phase II (C14) and Phase III (B2) (and occasionally the fcc phase) to solidify from the liquid. In the case of the Phase III formation, it can be expected that the phase will grow coherently into similar structures, though they are slightly different in lattice parameters. However, if Phase II (C14) is formed first on Phase I (bcc), with a certain orientation determined by their structural relationship, it is expected that the formation of Phase III on Phase II will maintain the same structural relationship and orientation as Phase I/Phase II. Thus, Phase I and III will have very similar orientations. Further study is required to identify which mechanism or both play a role. However, in either case, the boundaries between the contacting phases are crystallographically clean and free of amorphous regions, which are easy to target during the initial formation in alkaline electrolyte, due to preferential etching in the grain boundary [28]. This type of clean interface can certainly facilitate the transportation of protons in the bulk of the alloy, which can be inferred from the relatively high diffusion coefficient (D) of Alloys P1–P8 (1.0–1.5 × 10⁻¹⁰ cm2·s−1) compared to a typical AB2 multi-phase MH alloy (<1 × 10⁻¹⁰ cm2·s−1) [29]. The D value can be further increased to 2.13 × 10⁻¹⁰ cm2·s−1 with an annealing at 900 °C for 5 h [10]. As elaborated in a recent paper devoted to the discussion of the synergetic effect in electrochemistry [17], a clean interface is necessary not only to transport protons freely, but also to have excellent electron conductivity. At the end of discharge, there is still some MH phase left on the side with a larger work function (M1 in Figure 14b in [17]), which will act as a nucleation center for the next hydrogenation process. With an elastically connected grain boundary, the stress from MH on the M1 side will enlarge the lattice constant of the M2 side (hydrogenated) and pave the road to the hydrogenation of the M2 phase (M1 in Figure 14b in [17]). In this case, M2 can be hydrogenated before the end of hydrogenation in M1 (Figure 14b in [17]). This elastic binding between M1 and M2 at the interface is a prerequisite for such synergetic effects, more specifically to lower the “equivalent” plateau pressure as in the case of Zr2Ni7 [30] and ZrNi4.5 [31] multi-phase MH systems.

4. Conclusions

The microstructure of a group of Laves phase–related bcc solid-solution MH alloys with varying bcc/C14 content was studied using SEM/EBSD and TEM/SAED techniques. With the increase of V content in the alloy, the MH alloys develop from a C14-predominated phase for P1 to a bcc/C14 and bcc/C14/B2 multi-phase structure for P3 and P7, respectively. For the multi-phase P3 and P7, a high degree of alignment was found among the bcc grains, between bcc and C14, and bcc and B2 (P7), which suggests a very clean interface at the grain boundaries. These clean interfaces can facilitate the transport of protons between the bcc main storage phase and the catalytic phases (C14, B2) and ensure good electron conductivity, which supports the proposed synergetic effects found in the electrochemical testing of multi-phase MH alloys. Based on the works of P1–P7, a more complicated alloy, P37, with a higher V content, no Fe and additional Ti2Ni catalytic phase shows further improvement in the electrochemical performance.

Acknowledgments

This work is financially supported by ARPA-E under the RANGE program (DE-AR0000386). The authors would like to thank the following for technical assistance from BASF-Ovonic: Jean Nei, Baoquan Huang, Taihei Ouchi, and Su Cronogue.

Author Contributions

Hao-Ting Shen designed the experiments and performed the SEM and TEM analysis. Kwo-Hsiung Young, Tiejun Meng and Leonid A. Bendersky analyzed and interpreted the data.

Conflicts of Interest

The authors declare no conflict of interest.

Abbreviations

bccBody-centered-cubic
EBSDElectron backscattering diffraction
MHMetal hydride
Ni/MHNickel/metal hydride
RANGERobust affordable next generation electric vehicles
TEMTransmission electron microscopy
SEMScanning electron microscopy
ICPInductively coupled plasma
PCTPressure-concentration-temperature
BKDBackscatter Kikuchi diffraction
OIMOrientation imaging microscopy
EDSEnergy dispersive spectroscopy
OESOptical emission spectrometer
BSEBackscattering electron
XRDX-ray diffraction
SAEDSelected area electron diffraction
fccFace-centered cubic
DDiffusion constant

References

  1. Young, K.; Ng, K.Y.S.; Bendersky, L. A Technical Report of the Robust Affordable Next Generation Energy Storage System-BASF Program. Batteries 2016, 2. [Google Scholar] [CrossRef]
  2. Young, K.; Nei, J.; Wong, D.F.; Wang, L. Structural, hydrogen storage, and electrochemical properties of Laves phase-related body-centered-cubic solid solution metal hydride alloys. Int. J. Hydrog. Energy 2014, 39, 21489–21499. [Google Scholar] [CrossRef]
  3. Inoue, H.; Arai, S.; Iwakura, C. Crystallographic and electrochemical characterization of TiV4−xNix alloys for nickel-metal hydride batteries. Electrochim. Acta 1996, 41, 937–939. [Google Scholar] [CrossRef]
  4. Yu, X.B.; Wu, Z.; Xia, B.J.; Xu, N.X. A Ti-V-based bcc phase alloy for use as metal hydride electrode with high discharge capacity. J. Chem. Phys. 2004, 121, 987–990. [Google Scholar] [CrossRef] [PubMed]
  5. Chen, N.; Li, R.; Zhu, Y.; Liu, Y.; Pan, H. Electrochemical hydrogenation and dehydrogenation mechanisms of the Ti-V base multiphase hydrogen storage electrode alloy. Acta Metal. Sin. 2004, 40, 1200–1204. [Google Scholar]
  6. Qiu, S.; Chu, H.; Zhang, Y.; Sun, D.; Song, X.; Sun, L. Electrochemical kinetics and its temperature dependence behaviors of Ti0.17Zr0.08V0.35Cr0.10Ni0.30 alloy electrode. J. Alloy. Compd. 2009, 471, 453–456. [Google Scholar] [CrossRef]
  7. Iba, H.; Akiba, E. The relation between microstructure and hydrogen absorbing property in Laves phase-solid solution multiphase alloys. J. Alloy. Compd. 1995, 231, 508–512. [Google Scholar] [CrossRef]
  8. Rönnebro, E.; Noréus, D.; Sakai, T.; Tsukahara, M. Structural studies of a new Laves phase alloy (Hf,Ti)(Ni,V)2 and its very stable hydride. J. Alloy. Compd. 1995, 231, 90–94. [Google Scholar] [CrossRef]
  9. Tsukahara, M.; Takahashi, K.; Mishima, T.; Isomura, A.; Sakai, T. V-based solid solution alloys with Laves phase network: Hydrogen absorption properties and microstructure. J. Alloy. Compd. 1996, 236, 151–155. [Google Scholar] [CrossRef]
  10. Young, K.; Ouchi, T.; Nei, J.; Wang, L. Annealing effects on Laves phase-related body-centered-cubic solid solution metal hydride alloys. J. Alloy. Compd. 2016, 654, 216–225. [Google Scholar] [CrossRef]
  11. Boettinger, W.J.; Newbury, D.E.; Wang, K.; Bendersky, L.A.; Chiu, C.; Kattner, U.R.; Young, K.; Chao, B. Examination of multiphase (Zr, Ti)(V, Cr, Mn, Ni)2 Ni-MH electrode alloys: Part I. Dendritic solidification structure. Metall. Mater. Trans. 2010, 41A, 2033–2047. [Google Scholar] [CrossRef]
  12. Bendersky, L.A.; Wang, K.; Boettinger, W.J.; Newbury, D.E.; Young, K.; Chao, B. Examination of multiphase (Zr, Ti)(V, Cr, Mn, Ni)2 Ni-MH electrode alloys: Part II. Solid-state transformation of the interdendric B2 phase. Metall. Mater. Trans. 2010, 41A, 1891–1906. [Google Scholar] [CrossRef]
  13. Liu, Y.; Young, K. Microstructure investigation on metal hydride alloys by electron backscatter diffraction technique. Batteries 2016, 2. [Google Scholar] [CrossRef]
  14. Visintin, A.; Peretti, H.A.; Fruiz, F.; Corso, H.L.; Triaca, W.E. Effect of additional catalytic phases imposed by sintering on the hydrogen absorption behavior of AB2 type Zr-based alloys. J. Alloy. Compd. 2007, 428, 244–251. [Google Scholar] [CrossRef]
  15. Wong, D.F.; Young, K.; Nei, J.; Wang, L.; Ng, K.Y.S. Effects of Nd-addition on the structural, hydrogen storage, and electrochemical properties of C14 metal hydride alloys. J. Alloy. Compd. 2015, 647, 507–518. [Google Scholar] [CrossRef]
  16. Mosavati, N.; Young, K.; Meng, T.; Ng, K.Y.S. Electrochemical open-circuit voltage and pressure-concentration-temperature isotherm comparison for metal hydride alloys. Batteries 2016, 2. [Google Scholar] [CrossRef]
  17. Young, K.; Ouchi, T.; Meng, T.; Wong, D.F. Studies on the synergetic effects in multi-phase metal hydride alloys. Batteries 2016, 2. [Google Scholar] [CrossRef]
  18. Young, K.; Wong, D.F.; Wang, L. Effect of Ti/Cr content on the microstructures and hydrogen storage properties of Laves phase-related body-centered-cubic solid solution metal hydride alloys. J. Alloys Compd. 2015, 622, 885–893. [Google Scholar] [CrossRef]
  19. Young, K.; Ouchi, T.; Huang, B.; Nei, J. Structure, hydrogen storage, and electrochemical properties of body-centered-cubic Ti40V30Cr15Mn13X2 alloys (X = B, Si, Mn, Ni, Zr, Nb, Mo, and La). Battereis 2005, 1, 74–90. [Google Scholar] [CrossRef]
  20. Young, K.; Ouchi, T.; Huang, B.; Nei, J. Effects of Cr, Zr, V, Mn, Fe, and Co to the hydride properties of Laves phase-related body-centered-cubic solid solution alloys. J. Power Sources 2015, 281, 165–172. [Google Scholar] [CrossRef]
  21. Young, K.; Wong, D.F.; Nei, J. Effects of vanadium/nickel contents in Laves phase-related body-centered-cubic solid solution metal hydride alloys. Batteries 2005, 1, 34–53. [Google Scholar] [CrossRef]
  22. Liu, S.; Chu, H.; Zhang, J.; Zhang, Y.; Sun, L.; Xu, F. Effect of La partial substitution for Zr on the structural and electrochemical properties of Ti0.17Zr0.08−xLaxV0.35Cr0.1Ni0.3 (x = 0–0.04) electrode alloys. Int. J. Hydrog. Energy 2009, 34, 7246–7252. [Google Scholar]
  23. Young, K.; Ouchi, T.; Liu, Y.; Reichman, B.; Mays, W.; Fetcenko, M.A. Structural and electrochemical properties of TixZr7−xNi10. J. Alloy. Compd. 2009, 480, 521–528. [Google Scholar] [CrossRef]
  24. Young, K.; Nei, J.; Ouchi, T.; Fetcenko, M.A. Phase abundances in AB2 metal hydride alloys and their correlations to various properties. J. Alloy. Compd. 2011, 509, 2277–2284. [Google Scholar] [CrossRef]
  25. Young, K.; Ouchi, T.; Huang, B.; Chao, B.; Fetcenko, M.A.; Bendersky, L.A.; Wang, K.; Chiu, C. The correlation of C14/C15 phase abundance and electrochemical properties in the AB2 alloys. J. Alloy. Compd. 2010, 506, 841–848. [Google Scholar] [CrossRef]
  26. Michal, G.M.; Singlair, R. The structure of TiNi martensite. Acta Crystallogr. 1981, B37, 1803–1807. [Google Scholar] [CrossRef]
  27. Song, G.; Dolan, M.D.; Kellam, M.E.; Liang, D.; Zambelli, S. V-Ni-Ti multi-phase alloy membranes for hydrogen purification. J. Alloy. Compd. 2011, 509, 9322–9328. [Google Scholar] [CrossRef]
  28. Young, K.; Chao, B.; Nei, J. Microstructures of the activated Si-containing ab2 metal hydride alloy surface by transmission electron microscope. Batteries 2016, 2. [Google Scholar] [CrossRef]
  29. Young, K.; Huang, B.; Regmi, R.K.; Lawes, G.; Liu, Y. Comparisons of metallic clusters imbedded in the surface oxide of AB2, AB5, and A2B7 alloys. J. Alloy. Compd. 2010, 506, 831–840. [Google Scholar] [CrossRef]
  30. Young, M.; Chang, S.; Young, K.; Nei, J. Hydrogen storage properties of ZrVxNi3.5−x (x = 0.0–0.9) metal hydride alloys. J. Alloy. Compd. 2013, 580, S171–S174. [Google Scholar] [CrossRef]
  31. Young, K.; Young, M.; Chang, S.; Huang, B. Synergetic effects in electrochemical properties of ZrVxNi4.5−x (x = 0.0, 0.1, 0.2, 0.3, 0.4, and 0.5) metal hydride alloys. J. Alloy. Compd. 2013, 560, 33–41. [Google Scholar] [CrossRef]
Figure 1. Pressure-concentration-temperature (PCT) isotherms measured at 30 °C for Alloys P1, P3, P7 and P37.
Batteries 02 00022 g001
Figure 2. Stereographic projection crystallography for (a) hexagonal and (b) cubic systems.
Batteries 02 00022 g002
Figure 3. (ac) Electron backscatter diffraction (EBSD) patterns at three different locations of Alloy P3 overlaid with simulated patterns (green lines). All three points are identified to have the same body-center-cubic (bcc) phase structures but different crystal orientations.
Batteries 02 00022 g003
Figure 4. (a,c,e) Scanning electron microscopy (SEM) backscattered electron (BSE) images and (b,d,f) energy dispersive spectroscopy (EDS) mapping of Alloys (a,b) P1, (c,d) P3, and (e,f) P7, respectively. Phases I–III for P3 and P7 are shown in Table 2.
Batteries 02 00022 g004
Figure 5. (a) The dark region, denoted as Phase I in the text, can be divided to Zones A–C (indicated by the red letters) based on the EBSD diffraction patterns. The light region, Phase II in the text, can be divided into four grains labeled by circles, triangles, rectangles, and pentagons (the numbers here are spot numbers in the measurement). Comparison between EBSD from (b) A and (c) C zones of the bcc phase indicates the following crystallographic orientation alignment: (110)A//(110)C and <311>A//<111>C. Comparison between EBSDs from (d) Zone A of the bcc phase and (e) the circle grain of the C14 phase indicates the following crystallographic orientation alignment: (211)A//(100)o and <153>A//<100>o. The circles in (be) highlight the aligned orientations.
Batteries 02 00022 g005
Figure 6. (a) SEM image for TEM touring and (b) low-magnification bright field TEM image from Alloy P7, with the phases labeled. Phases I–III are bcc, C14, and B2, respectively.
Batteries 02 00022 g006
Figure 7. Selected area electron diffraction (SAED) patterns from Phases I–III in Alloy P7.
Batteries 02 00022 g007
Figure 8. SAED taken from Phase III of Alloy P7 in two orientations: (a) with the [111] bcc zone axis; and (b) obtained by tilting around the (1 1 ¯ 0)* to the [110] bcc zone axis.
Batteries 02 00022 g008
Figure 9. SAED patterns from Phase II of Alloy P7 that fit (a) a C14 structure in the [100] zone axis and (b) a face-centered cubic (fcc) structure with a ≈ 11 Å in the [110] zone.
Batteries 02 00022 g009
Table 1. Design composition and inductively coupled plasma (ICP) results for Alloys P1, P3 and P7 in at%.
AlloyTiZrVCrMnFeCoNiAl
P1 (design)14.713.820.06.012.61.22.628.50.6
P1 (ICP)15.113.920.23.812.81.32.729.50.7
P3 (design)14.38.930.19.010.21.92.123.10.5
P3 (ICP)14.78.831.07.59.81.92.123.70.5
P7 (design)13.73.142.012.67.42.61.516.80.3
P7 (ICP)14.23.041.312.17.02.71.617.60.5
P37 (design)14.51.746.611.96.5-1.516.90.4
Table 2. EDS results (in at%) from Alloys P3 and P7 showing phase segregation.
PhaseStructureTiZrVCrMnNi
P3 Phase Ibcc4<15816114
P3 Phase IIC1419121941031
P7 Phase Ibcc6<1601986
P7 Phase IIC14228205632
P7 Phase IIIB23738<1343
Table 3. EDS results (in at%) from selective spots in Figure 6a. B/A is the ratio between the sum of at% from other elements vs. Ti and Zr (bcc and C14) and Ti, Zr, and V (B2).
AreaTiZrVCrMnFeCoNiAlB/APhase
I5.80.059.418.37.42.81.15.00.516bcc
II23.18.320.04.37.33.62.830.00.92.2C14
III35.53.39.01.23.21.82.842.30.71.1B2

