Article

First-Principles Point Defect Models for Zr7Ni10 and Zr2Ni7 Phases

1
Department of Chemical Engineering and Materials Science, Wayne State University, Detroit, MI 48202, USA
2
BASF/Battery Materials-Ovonic, 2983 Waterview Drive, Rochester Hills, MI 48309, USA
*
Author to whom correspondence should be addressed.
Batteries 2016, 2(3), 23; https://doi.org/10.3390/batteries2030023
Submission received: 24 April 2016 / Revised: 23 June 2016 / Accepted: 28 June 2016 / Published: 30 June 2016
(This article belongs to the Special Issue Nickel Metal Hydride Batteries)

Abstract

:
Synergetic effects in multi-phased AB2 Laves-phase-based metal hydride (MH) alloys enable the access of high hydrogen storage secondary phases, despite the lower absorption/desorption kinetics found in nickel/metal hydride (Ni/MH) batteries. Alloy design strategies to further tune the electrochemical properties of these secondary phases include the use of additives and processing techniques to manipulate the chemical nature and the microstructure of these materials. It is also of particular interest to observe the engineering of constitutional point defects and how they may affect electrochemical properties and performance. The Zr7Ni10 phase appears particularly prone to point defects, and we use density functional theory (DFT) calculations coupled with a statistical mechanics model to study the theoretical point defects. The Zr2Ni7 phase appears less prone to point defects, and we use the Zr2Ni7 point defect model, as well as experimental lattice parameters, with Zr7Ni10 phases from X-ray diffraction (XRD) as points of comparison. The point defect models indicate that anti-site defects tend to form in the Zr7Ni10 phase, and that these defects form more easily in the Zr7Ni10 phase than the Zr2Ni7 phase, as expected.

Graphical Abstract

1. Introduction

Nickel/metal hydride (Ni/MH) batteries utilizing multi-phased AB2 Laves-phase-based metal hydride (MH) alloy active materials leverage the synergetic effects between secondary phases and the main Laves phases to allow access to the high hydrogen storage of the secondary phases, such as Zr7Ni10, despite their lower absorption/desorption kinetics [1,2,3,4,5]. The Zr2Ni7 phase, on the other hand, has excellent absorption/desorption kinetics, but poor hydrogen storage capacity [4,6]. Modifiers to the Zr-Ni alloys, including Ti in TixZr7−xNi10, have shown improvements in diffusion to help the kinetics [5], and V in ZrVxNi3.5−x has shown improvements in capacity [6]. In addition to modifiers, constitutional defect structures in the alloys may also affect mechanical and electrochemical properties. Defects, including vacancies, can act to trap hydrogen and inhibit the transport of hydrogen through the alloy [7]. In addition, other defects, such as anti-sites, can promote lower atomic packing ratios, which can improve the cycling capability due to a higher propensity to deform rather than to crack [8,9]. The ability to tune the ratio between hydride formers, such as Zr, and hydride modifiers, such as Ni, as well as to add other modifiers while maintaining the structure of the alloys is an important feature for designing battery materials targeting a specific application, and can strongly affect battery performance properties [10,11,12,13]. We have constructed point defect models for the Zr7Ni10 and Zr2Ni7 phases from first-principle calculations to lay the groundwork for examining how structure and defects can affect properties that can be linked to Ni/MH battery performance, adding another dimension to consider in the design of negative active materials. Some comparison to experimental lattice parameters show a consistency with predicted defected structures and c/b lattice ratio trends.

2. Computational Details

Point defect models for intermetallics have been constructed and studied in the literature for binary compounds, such as ZrNi [14], FeAl [15,16], NiAl [17], and NiAl3 [18]. We apply similar techniques and assumptions to construct the point defect models for the Zr7Ni10 and Zr2Ni7 phases (each with Zr-rich, stoichiometric, and Ni-rich cases); statistical mechanics use defect formation energies and the formation of defect combinations while preserving the targeted phase composition to provide defect compositions that minimize the potential energy of the system, and density functional theory (DFT) calculations supply the defect formation energies needed in the statistical mechanics model. The details in constructing the point defect models are described in Appendix. The fsolve function from the SciPy library for Python was used to solve the equations generated for vacancies and anti-site defects for each sublattice, defined by the equivalent atom sites in Zr7Ni10 and Zr2Ni7 phases (e.g., 4a sites comprise a single sublattice). We neglected dumbbell and interstitial defects, due to the limited space available near each of the sites. LaNi5 is known to form dumbbell interstitials due to the hexagon-shaped holes above and below La on the z = 0 plane [19]. Ni–Ni distances across the hexagon vertices measure ~5.1 Å across with Ni–Ni bond lengths of ~2.5 Å. Holes or spaces near the Zr local environment in Zr7Ni10 and Zr2Ni7 phases are typically pentagon- or square-shaped, with vertices measuring 3.8–4.7 Å and Ni-Ni bond lengths measuring ~2.6–2.8 Å. Defect concentrations and effective formation energies were calculated at a reference temperature of 1000 °C, a temperature near the melting points for the Zr7Ni10 and Zr2Ni7 systems [20]. When precision limitations were encountered in Python (typically at low temperature, which results in extremely low defect concentrations), the logarithmic terms containing defect concentration variables were analyzed and dropped when low concentration assumptions were valid.
Electronic structure calculations were performed using the plane-wave-based DFT code implemented in Quantum ESPRESSO (Version 5.1.0, Quantum ESPRESSO Foundation, London, UK) [21] and ultra-soft pseudopotentials from the Garrity–Bennett–Rabe–Vanderbilt (GBRV) Pseudopotential Library (Piscataway, NJ, USA) [22]. The exchange–correlation potential applied the Perdew–Burke–Ernzerhof (PBE) version of the generalized gradient approximation [23]. The recommended plane-wave cutoff energy of 40 Ry and charge-density cutoff energy of 120 Ry allowed convergence within 1 × 10⁻⁵ Ry/atom of the energy. A Methfessel–Paxton smearing width of 0.02 Ry with a Monkhorst–Pack k-point grid that yields 100–200 k-points also met convergence criteria with reasonable speed [24,25]. Spin-polarization was not included in the calculations, as differences in energies and stresses were low (<0.5 kbar) when included in the base equilibrium structures.
Cell structural optimizations for a given composition and structure were conducted by a variable cell relaxation calculation that minimizes forces and stresses within the cell. Symmetry of the cell was conserved during the structural optimizations based on a starting input structure. Non-defected structures preserved the symmetry based on starting experimental values. Using the optimized non-defected structure as a base, we removed or substituted atoms to create starting input values for the defected structures. The cell is considered optimized when forces were below 1 × 10⁻³ Ry/Å, the minimum energy converged at below 1 × 10⁻⁵ Ry/atom, and stresses converged within 0.5 kbar.
The Zr7Ni10 phase has an orthorhombic structure and can sometimes occur as a metastable tetragonal phase [5,26,27]. It was originally reported to have space group symmetry Aba2 [28,29] and has since been revised to have space group symmetry Cmca [30]. Its crystal structure is shown in Figure 1a, rendered using VESTA Graphical Software (Version 3.2.1, Momma and Izumi, Tsukuba, Japan) [31]. It contains 68 atoms per unit cell (Z = 4 formula units) with experimental parameters a = 12.381 Å, b = 9.185 Å, and c = 9.221 Å [30]. The unit cell contains four equivalent Zr atoms in the 4a, 8d, 8e, and 8f1 positions and three equivalent Ni atoms in the 8f2, 16g1, and 16g2 positions. A supercell was not constructed due to the inherent large size of the cell. The structure with the space group Aba2 was evaluated for the calculation and allowed to relax, yielding the energy of the non-defected structure. Point defects involving all equivalent sites of the optimized non-defected structure were also evaluated, obtaining the energy of each defected structure after relaxation.
The Zr2Ni7 phase is monoclinic, and its crystal structure is shown in Figure 1b. It contains 36 atoms per unit cell (Z = 4) with experimental parameters a = 4.698 Å, b = 8.235 Å, c = 12.193 Å and β = 95.83° [32]. It contains two equivalent Zr atoms in the 4i1 and 4i2 positions and four equivalent Ni atoms in the 4i3, 8j1, 8j2, and 8j3 positions. A 2 × 1 × 1 supercell containing 72 atoms was constructed to reduce interactions for the defects in adjacent cells. Point defects involving all equivalent sites were evaluated to obtain the energy of each defected structure after relaxation. The structures for ZrNi5 (cubic AuBe5 structure [33]), Zr8Ni21 (triclinic Hf8Ni21 structure [34]), and ZrNi (orthorhombic CrB structure [35]) were also optimized to calculate the energies that define the tie lines for the formation energy diagrams.
The point defect model is developed for stoichiometric and near stoichiometric compositions in which assumptions for low defect concentrations are valid and interactions between defects are considered negligible. Defect concentrations beyond ~1% concentration would require a new model that considers defect interactions and the dependence of defect formation energy parameters on defect concentration.

3. Experimental Setup

Lattice parameters shrink with vacancy-predominant defects, and grow with certain anti-site defects (e.g., Zr → Ni anti-site defects). Experimental lattice parameters offer some evidence of the consistency of the Zr7Ni10 point defect model. An arc melting process under continuous argon flow with a non-consumable tungsten electrode and water-cooled copper tray was used to prepare Zr-rich and Ni-rich Zr7Ni10 ingot samples. Before each arc melt, a piece of sacrificial titanium was repeatedly melted and cooled for several cycles to reduce the residual oxygen concentration in the system. Similarly, each 5 g ingot was turned over, melted, and cooled several times to ensure uniformity in the chemical composition. A Rigaku Miniflex X-ray diffractometer (XRD, Rigaku, Tokyo, Japan) was used to study the phase component. JEOL-JSM32C and JEOL-JSM6400 scanning electron microscopes (SEM, JEOL, Tokyo, Japan) with energy dispersive spectroscopy (EDS) were applied to investigating the phase distribution and composition.

4. Results and Discussion

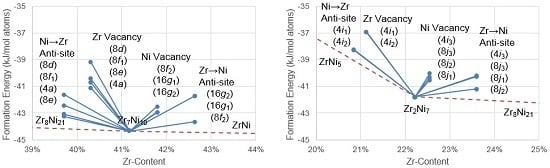
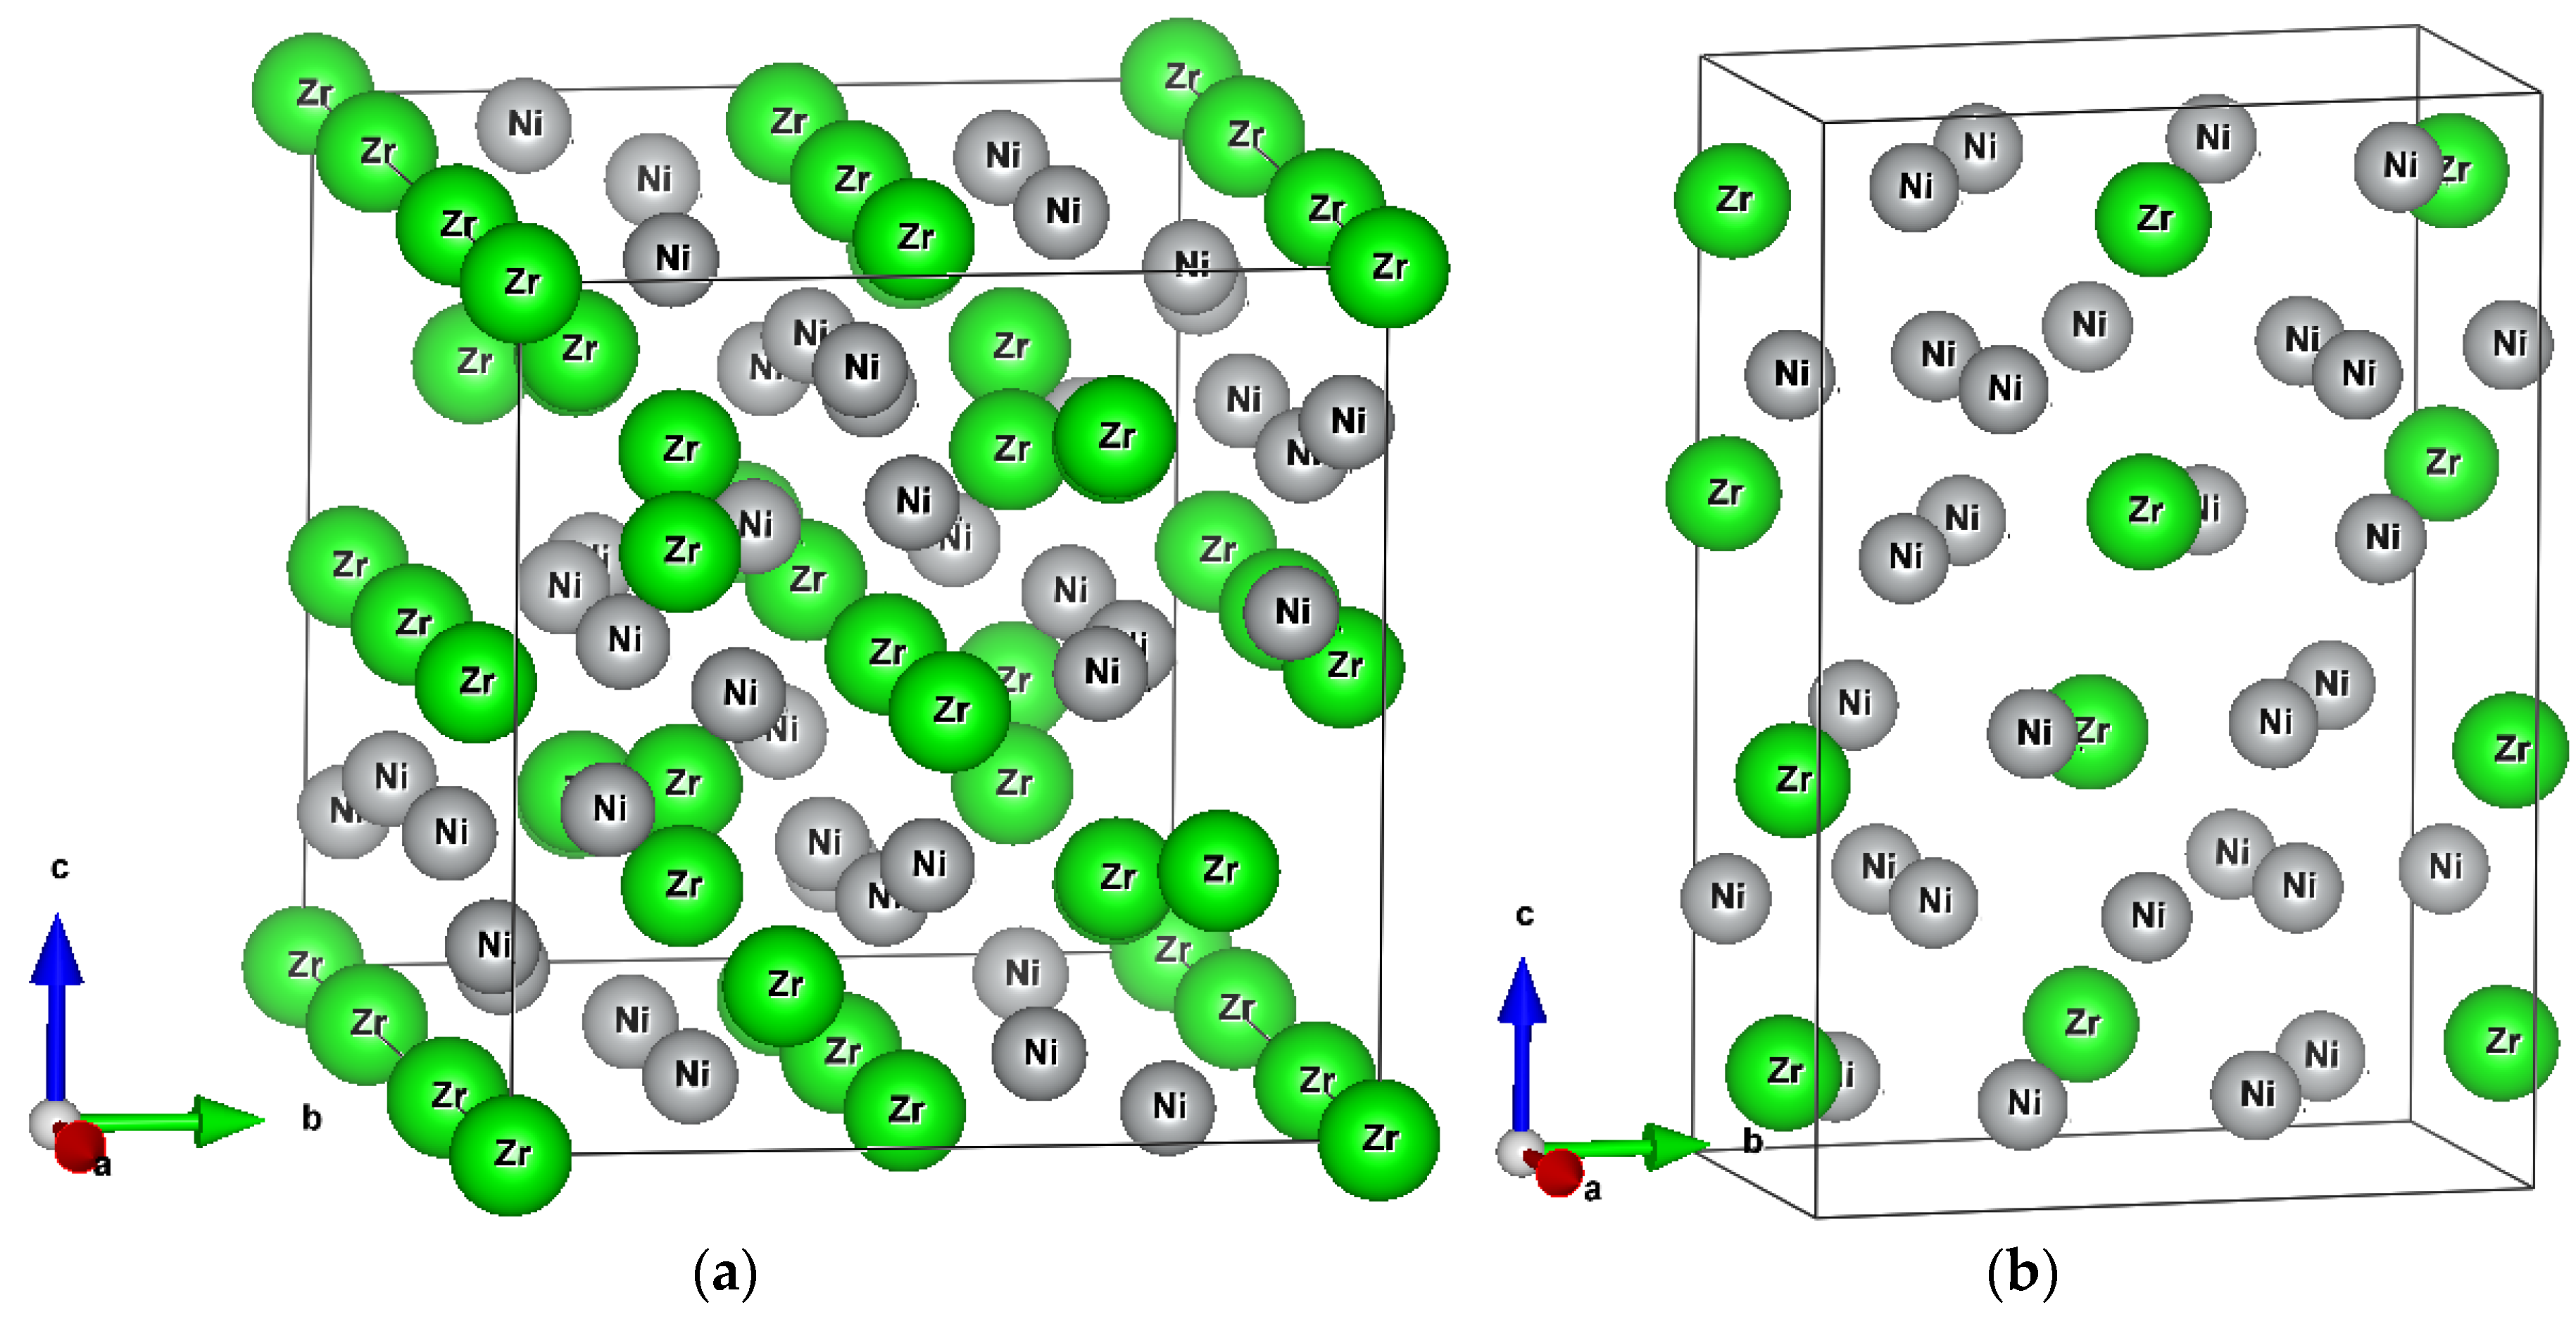
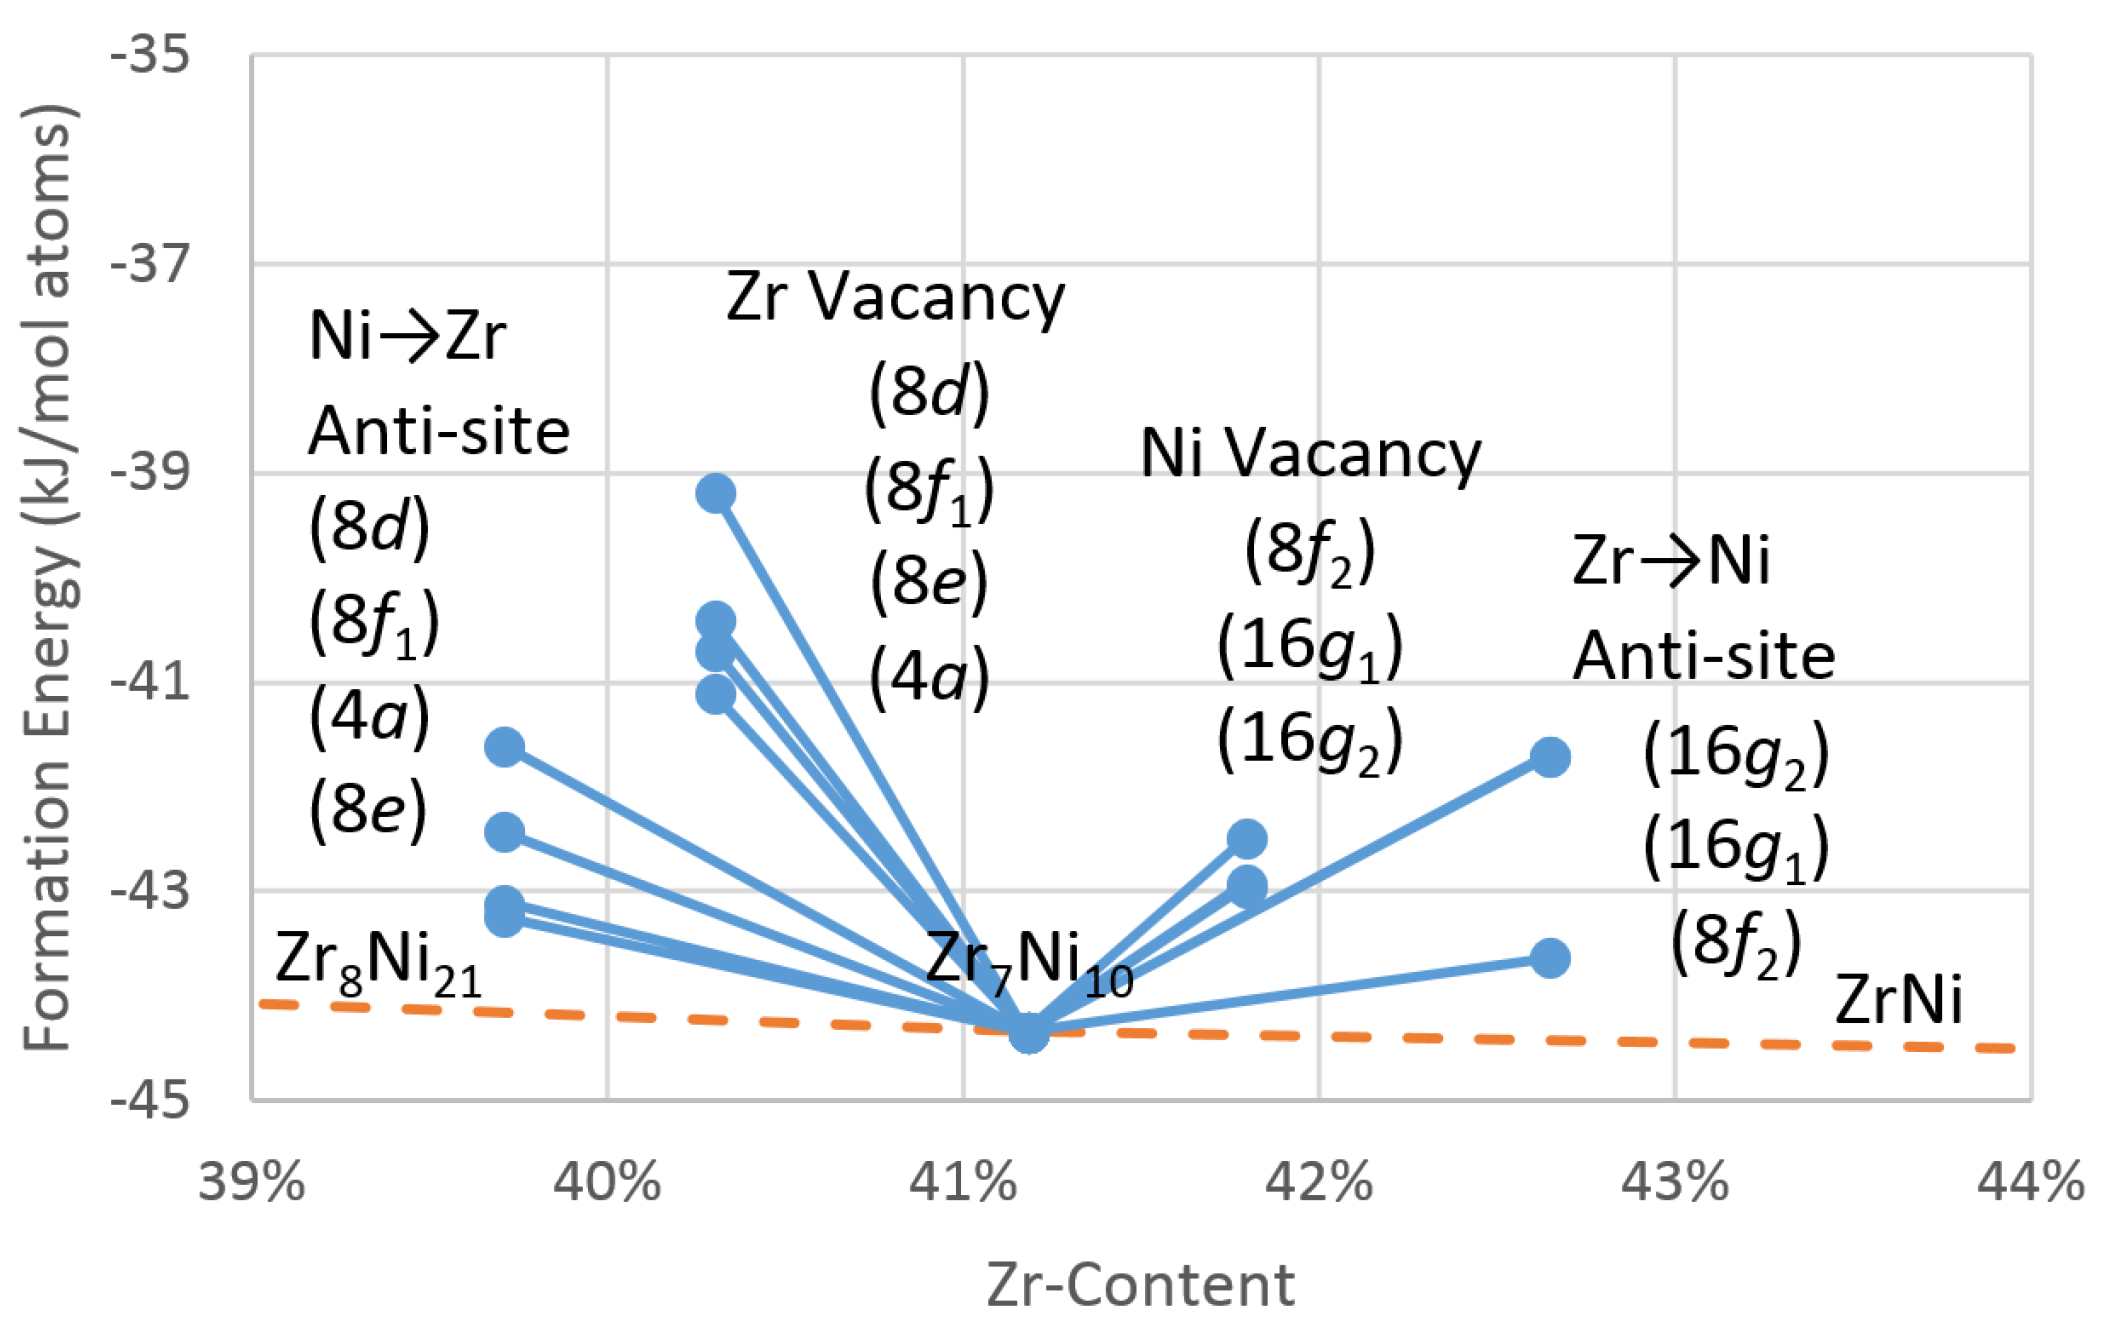
4.1. Theoretical Point Defects in Zr7Ni10

DFT calculation of the Zr7Ni10 phase in the space group Aba2 results in a relaxed structure with a space group Cmca symmetry. The calculated lattice parameters are shown in Table 1, with comparative experimental lattice parameters. The lattice parameters show reasonable agreement with the experiment results, although the calculated structure appears to converge to a near tetragonal unit cell. This near tetragonal structure differs from the tetragonal meta-stable phase observed experimentally after hydrogenation–dehydrogenation of Zr7Ni10 alloys; the dehydrogenated Zr7Ni10 alloy has a smaller lattice parameter (a = b = 6.496 Å) with different symmetry [5,26,27]. Constitutional point defects may play a role in the different structures that were observed and calculated for the Zr7Ni10 phase, for example, by introducing distortion to the lattice that favors the orthorhombic unit cell. Defects and distortion to the crystal lattice may promote diffusion kinetics for improved rate performance and access to hydrogen storage capacity if energy barriers between hydrogen sites are lowered with the defects/distortion. We examine the relative ease with which defects can form by first calculating the DFT defect formation energies for the Zr7Ni10 phase.

4.1.1. Density Functional Theory Defect Formation Energies

Ground state DFT formation energies (at T = 0 K) for Zr7Ni10 phase and the theoretical Ni → Zr anti-site, Zr vacancy, Ni vacancy, and Zr → Ni anti-site defects are plotted in Figure 2 with the tie lines to the neighboring compounds Zr8Ni21 and ZrNi. The formation energies were calculated using following the equation:
Δ H f = E ( Zr n Ni m ) n 2 E ( Zr 2 ) m 4 E ( Ni 4 ) n + m
where E(ZrnNim) is the energy of the Zr-Ni compound in the structure of interest, E(Zr2) is the energy of Zr in hexagonal close-packed structure, and E(Ni4) is the energy of Ni in a face-centered-cubic structure. Tie lines connect the ground state DFT formation energies of neighboring equilibrium structures (e.g., Zr7Ni10 and Zr8Ni21 phases), and represent the ground state energies of phase mixtures based on the overall Zr content (as opposed to a single phase with the same Zr content containing vacancy/anti-site defects). All of the defect energies at 0 K lie above the stoichiometric compound, as well as above the tie lines, indicating energy is required for the defects to form, and that the defects are in competition with formation of phases or mixtures of phases. There can be a large difference in formation energies between the investigated sublattice sites, and each type of defect appears to prefer different sites. Out of the Zr sublattices, the Ni → Zr anti-site defect appears to preferentially form on the 8e sublattice, while the Zr vacancy defect appears to prefer the 4a sublattice. For the Ni sublattices, the Ni vacancy defect appears to preferentially form on one of the 16g sublattices, while the Zr → Ni anti-site defect appears to preferentially form on the 8f2 sublattice. Note that defect formation energies on the 16g1 and 16g2 sublattices are similar and appear indistinguishable in Figure 2.
The model considers the effects of the heat of mixing, entropy, vibrational energy, and defect interaction on the free energy of each of the possible phases to be negligible, and a more comprehensive study of the point defect models could consider the effect of defect interactions. However, the DFT formation energies indicate that, out of the defects considered, the 8e Ni → Zr anti-site and the 8f2 Zr→Ni anti-site defects are the most stable of the point defects for the Zr7Ni10 phase. However, since the Zr7Ni10 phase is an ordered, binary compound, a mixture of all point defects is necessarily generated in order to maintain bulk homogeneity and required stoichiometry, and this is addressed by the statistical mechanics model (see Appendix).

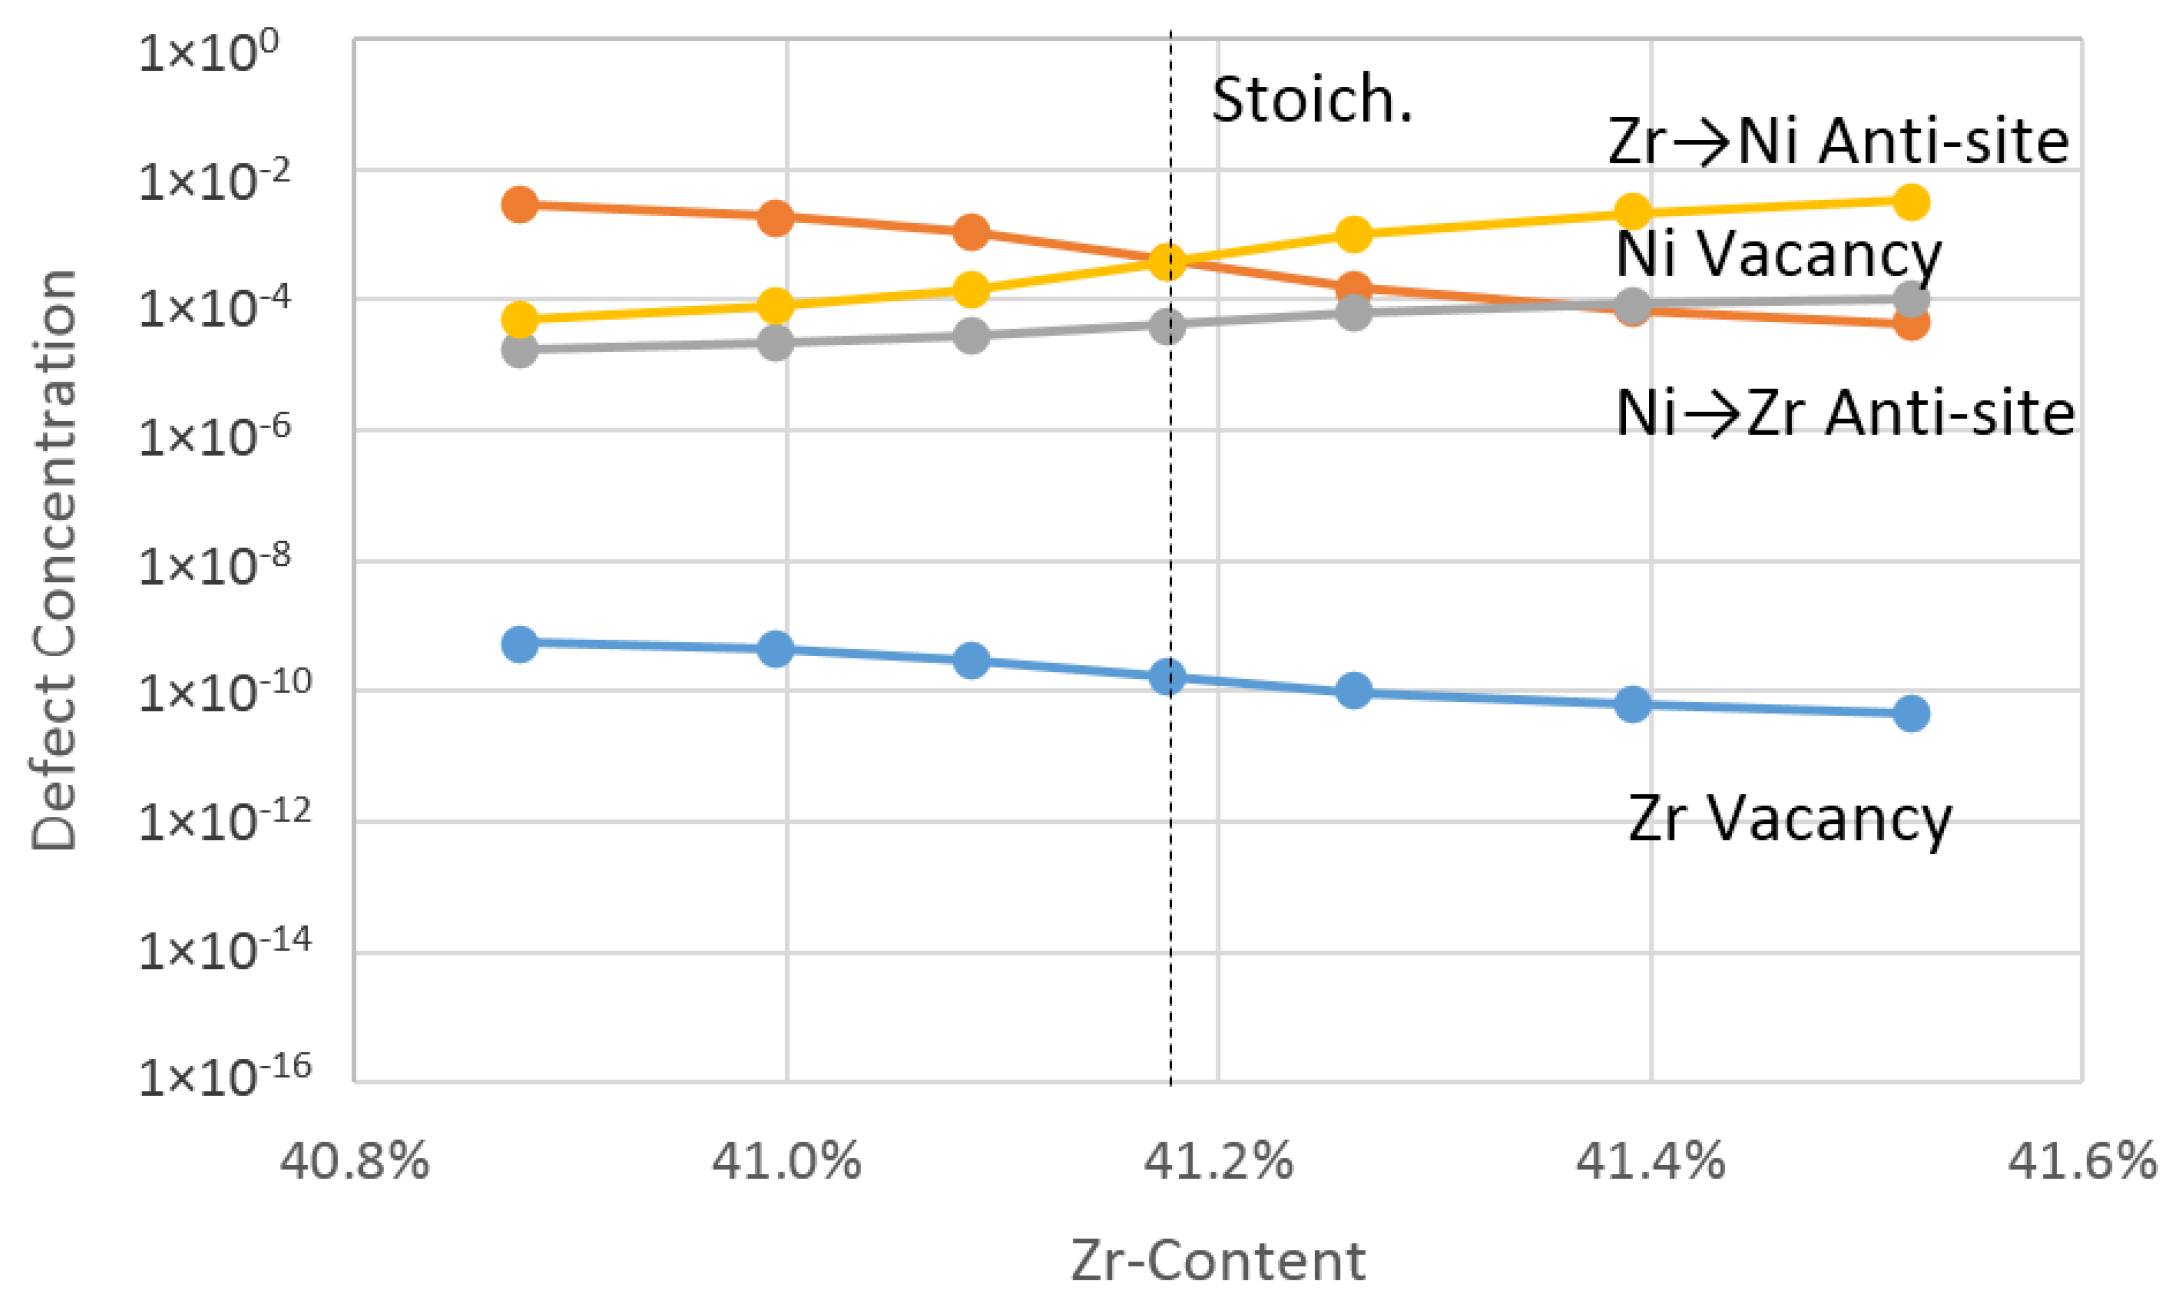
4.1.2. Theoretical Effective Defect Formation Model

The theoretical defect concentrations for Zr7Ni10 phase at 1000 °C calculated from the statistical mechanics model using defect energy parameters derived from DFT calculations are plotted as functions of Zr-content for stoichiometric and theoretical off-stoichiometric compositions in Figure 3. Concentrations of defects for each of the different site sublattices were generated and combined to give a total concentration for a defect on the atomic sublattice. The A atoms represent Zr and the B atoms represent Ni in the binary statistical mechanics model, where c v Zr is the concentration of vacancies of the Zr sublattices, c v Ni is the concentration of vacancies of the Ni sublattices, c Ni Zr is the concentration of total Ni → Zr anti-site defects, and c Zr Ni is the concentration of total Zr → Ni anti-site defects.
The stoichiometric Zr7Ni10 phase at 1000 °C is dominated by Ni → Zr and Zr → Ni anti-site defects in an approximately 1:1 ratio. Zr-rich compositions promote more defects of the Ni sublattices, particularly Zr → Ni anti-site defects. Ni → Zr anti-site defects dominate the analysis for Ni-rich compositions, and while the concentration of Zr vacancies increases, it does not approach the concentrations of the other defects. Each of the defects in the sublattices generated an effective formation energy, and the weighted average by concentration of sublattice sites was used to calculate the theoretical effective formation energies of the atomic point defects. The theoretical effective formation energies for the respective point defects at 1000 °C are tabulated in Table 2 and show the relative ease at which the defects can form. The effective formation energies for the defects are consistent with the defect concentration trends observed in Figure 3, with Zr → Ni anti-site defects showing the lowest effective formation energy at stoichiometry and in the Zr-rich state.
The non-defected and defected unit-cell lattice parameters based on the structure that yielded the lowest DFT formation energy are tabulated in Table 3. Comparison of these calculated parameters to experimental lattice parameters, as measured by XRD, may offer some insight into the point defect structures that may occur in the Zr7Ni10 phase.
We have noted that the calculated crystal structure for the stoichiometric Zr7Ni10 phase based on parameters given in literature appears to converge towards a tetragonal unit cell. Experimental lattice parameters, however, show c/b lattice parameter ratios of 1.004–1.006 (~0.5% difference from the calculated value). Calculated anti-site defected lattice parameters also show c/b ratios >1, while vacancy defected lattice parameters show ratios <1. The point defect model for the Zr7Ni10 phase presented here predicts higher concentrations of anti-site defects for stoichiometric and off-stoichiometric compositions. Curiously, the anti-site defected unit-cell aspect ratio trends appear more consistent to the experimental literature results than for the perfect crystal case (0.2% difference vs. 0.5% difference, respectively). This is despite experimental conditions that include an annealing treatment at a high temperature for a long period of time (one month) to obtain equilibrium phases [30]. We also note that the equilibrium phase diagram for the Ni-Zr system has been revised to correct the solubility window for the Zr7Ni10 phase, originally reporting a Zr-content range of 41.1 at% to 43.5 at%, to a maximum threshold of 41.5 at% [20,27,36]. The relative difficulty in removing defects (or conversely, the relative ease of forming defects) in the Zr7Ni10 phase could have led to the construction of the larger solubility window, which supports the case for the presence of anti-site defects at stoichiometric compositions, but does not reconcile the observation that the defects do not appear to be the most thermodynamically favorable structures, based on the assumptions made in these calculations. Possible future work can re-examine the assumptions involved in calculating the free energies of the non-defected and defected Zr7Ni10 phase, taking into account effects of temperature on vibrational and entropic contributions. Supercells with both Zr → Ni and Ni → Zr anti-site defects for stoichiometric compositions can be examined for possible interactive configurations and optimized for comparison.
In considering the types of point defects for the Zr7Ni10 phase that may promote better electrochemical performance in Ni/MH batteries, the Zr → Ni anti-site defects that are prevalent in Zr-rich phases offer a slightly larger unit-cell volume for hydrogen storage, lowering the plateau pressure and stabilizing the hydride and hydrogen storage sites. Conversely, the Ni → Zr anti-site defects that are prevalent in Ni-rich phases slightly reduce the unit-cell volume, destabilizing the hydride and hydrogen storage sites. Zr → Ni anti-site defects may also further locally trap hydrogen, with Zr strongly binding to hydrogen (heats of hydride formation are −163 kJ·mol−1 for metallic Zr [37] and −50 kJ·mol−1 for Zr7Ni10 [5]). However, the effects of these defects on hydrogen storage capacity and reversibility appear incremental compared to the direct effects of structure and the hydrogen binding energy related to the ratio of hydride formers (Zr) and modifiers (Ni) in the alloy composition, which would need to be considered for comparing properties across different phases, such as the Zr7Ni10 and Zr2Ni7 phases. For example, the effect of hydrogen binding with higher Zr content can be seen in the reversibility performance (Zr7Ni10 phase has a Zr/Ni ratio of 0.70 with 77% reversible capacity and an initial capacity of 1.01 hydrogen to metal (H/M), while Zr2Ni7 phase has a Zr/Ni ratio of 0.29 with 100% reversible capacity and an initial capacity of 0.29 H/M [4]; the point defect models predict defect concentrations of 10−5–10−3 at stoichiometry for local site effects). Within a single phase, however, insights may be gleaned for future alloy design, particularly since synergetic effect studies show that Zr7Ni10 is a good catalytic phase, and improving its thermodynamic properties can further improve the performance of multi-phase negative electrode active materials [1]. One such strategy is to try to maintain the Zr7Ni10 crystal structure, while substituting elements that have less of an affinity for hydrogen (Ti has a heat of hydrogen formation of −124 kJ·mol−1 [37]) while balancing lattice shrinkage with combination of anti-site defects and other additives. The point defect models offer a first step towards laying the groundwork for understanding the role of constitutional defects as it relates to alloy design and optimization of electrochemical properties for Ni/MH batteries. Investigation of absorption–desorption or diffusion kinetics, through the calculation of the activation energy by methods such as nudged elastic band, can be of interest. Future work involving additives can also offer further tuning of the defect structures; addition of Ti has experimentally improved hydrogen reversibility, as well as the kinetics needed for high-rate discharge [5].

4.2. Theoretical Point Defects in Zr2Ni7

The Zr2Ni7 phase was studied to provide a comparison to the Zr7Ni10 phase in terms of the types of defects formed and the ease of defect formation. The DFT structure optimization calculation for the Zr2Ni7 phase is consistent with the monoclinic C2/m symmetry and structure reported in literature. The calculated lattice parameters are shown in Table 4 with experimental comparative lattice parameters. The lattice parameters show reasonable agreement with the experimental results. The DFT defect formation energies for the Zr2Ni7 phase are calculated based on this optimized calculated structure.

4.2.1. Density Functional Theory Formation Energies

Ground state DFT formation energies for the Zr2Ni7 phase and its theoretical Ni → Zr anti-site, Zr vacancy, Ni vacancy, and Zr → Ni anti-site defects are plotted in Figure 4, with tie lines to neighboring compounds ZrNi5 and Zr8Ni21. All defect energies at 0 K lie above that of the stoichiometric compounds, as well as the tie lines. However, the Ni → Zr anti-site defect energy lies considerably higher than the stoichiometric compound and the ZrNi5-Zr2Ni7 mixture tie line, indicating a possible shift in the dominating defects found in a Ni-rich compound. The Zr → Ni anti-site defect energy is the lowest of the defects for the Zr2Ni7 phase, followed by the Ni vacancy defect energy. There is a small difference in defect energy between the 4i and 8j sites for the Ni vacancy defect, but there is a larger difference between the sites of the Zr → Ni anti-site defect. In general, point defects appear to form preferentially in the 8j sublattices. Note that defect formation energies for several sets of sublattices are similar and appear indistinguishable in Figure 4 (i.e., 4i1 and 4i2, 4i3 and 8j3, and 8j1 and 8j2).

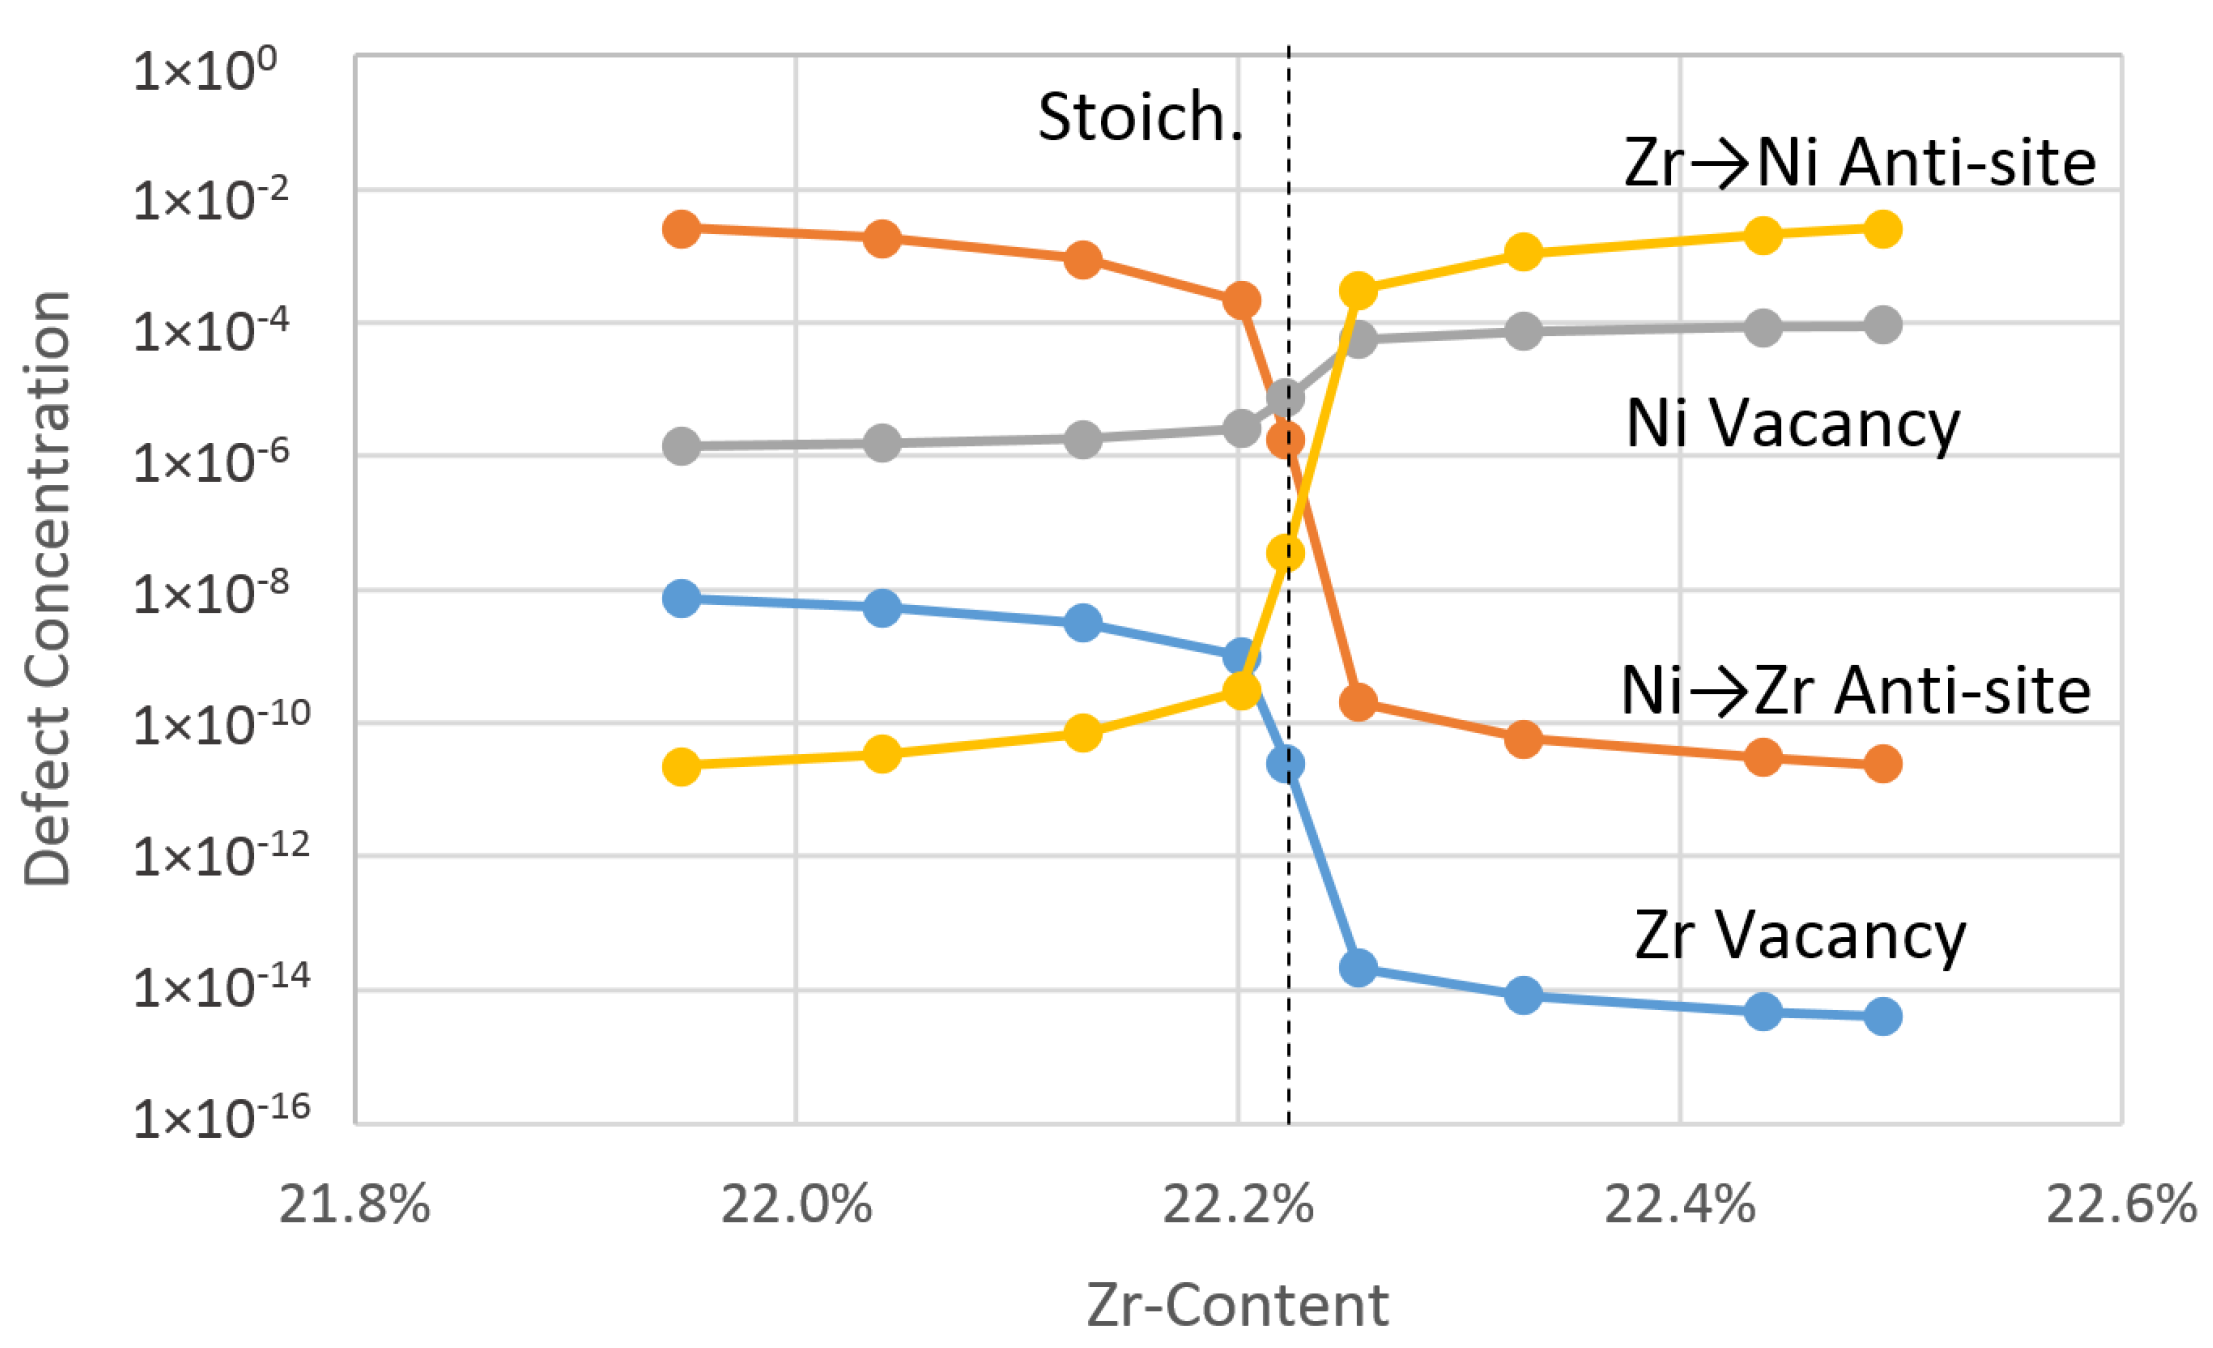
4.2.2. Theoretical Effective Defect Formation Model

The theoretical defect concentrations for the Zr2Ni7 phase at 1000 °C are plotted as functions of Zr-content in Figure 5. Stoichiometric Zr2Ni7 phase at 1000 °C is dominated by Ni vacancy defects. Zr → Ni anti-site defects overtake the formation of Ni vacancy defects in Zr-rich compositions, making Ni → Zr anti-site defects the predominant defect for Ni-rich compositions. Zr vacancy defects also increase on the Ni-rich side, but again, the concentration is overall relatively low.
The weighted theoretical effective formation energies for the respective point defects at 1000 °C are tabulated in Table 5 and define the relative ease for which a particular defect can form. The effective formation energies for the defects are consistent with the defect concentration trends observed in Figure 5, with Ni vacancies showing the lowest effective formation energy at stoichiometric ratios. By comparing the point defect models between the Zr7Ni10 and Zr2Ni7 phases, the data suggests that it is easier to form defects in the Zr7Ni10 phase than the Zr2Ni7 phase, which is consistent with our hypothesis.
In considering the types of point defects within the Zr2Ni7 phase that may promote better electrochemical performance in Ni/MH batteries, we again express caution for comparing different phases, but within the Zr2Ni7 phase, Zr → Ni anti-site defects that are prevalent in Zr-rich phases offer a slightly larger unit-cell volume for hydrogen storage at the expense of possible hydrogen trapping, due to local Zr concentrations. Conversely, Ni → Zr anti-site defects that are prevalent in Ni-rich phases slightly reduce the unit-cell volume and, thereby, offer less space to accommodate hydrogen storage.

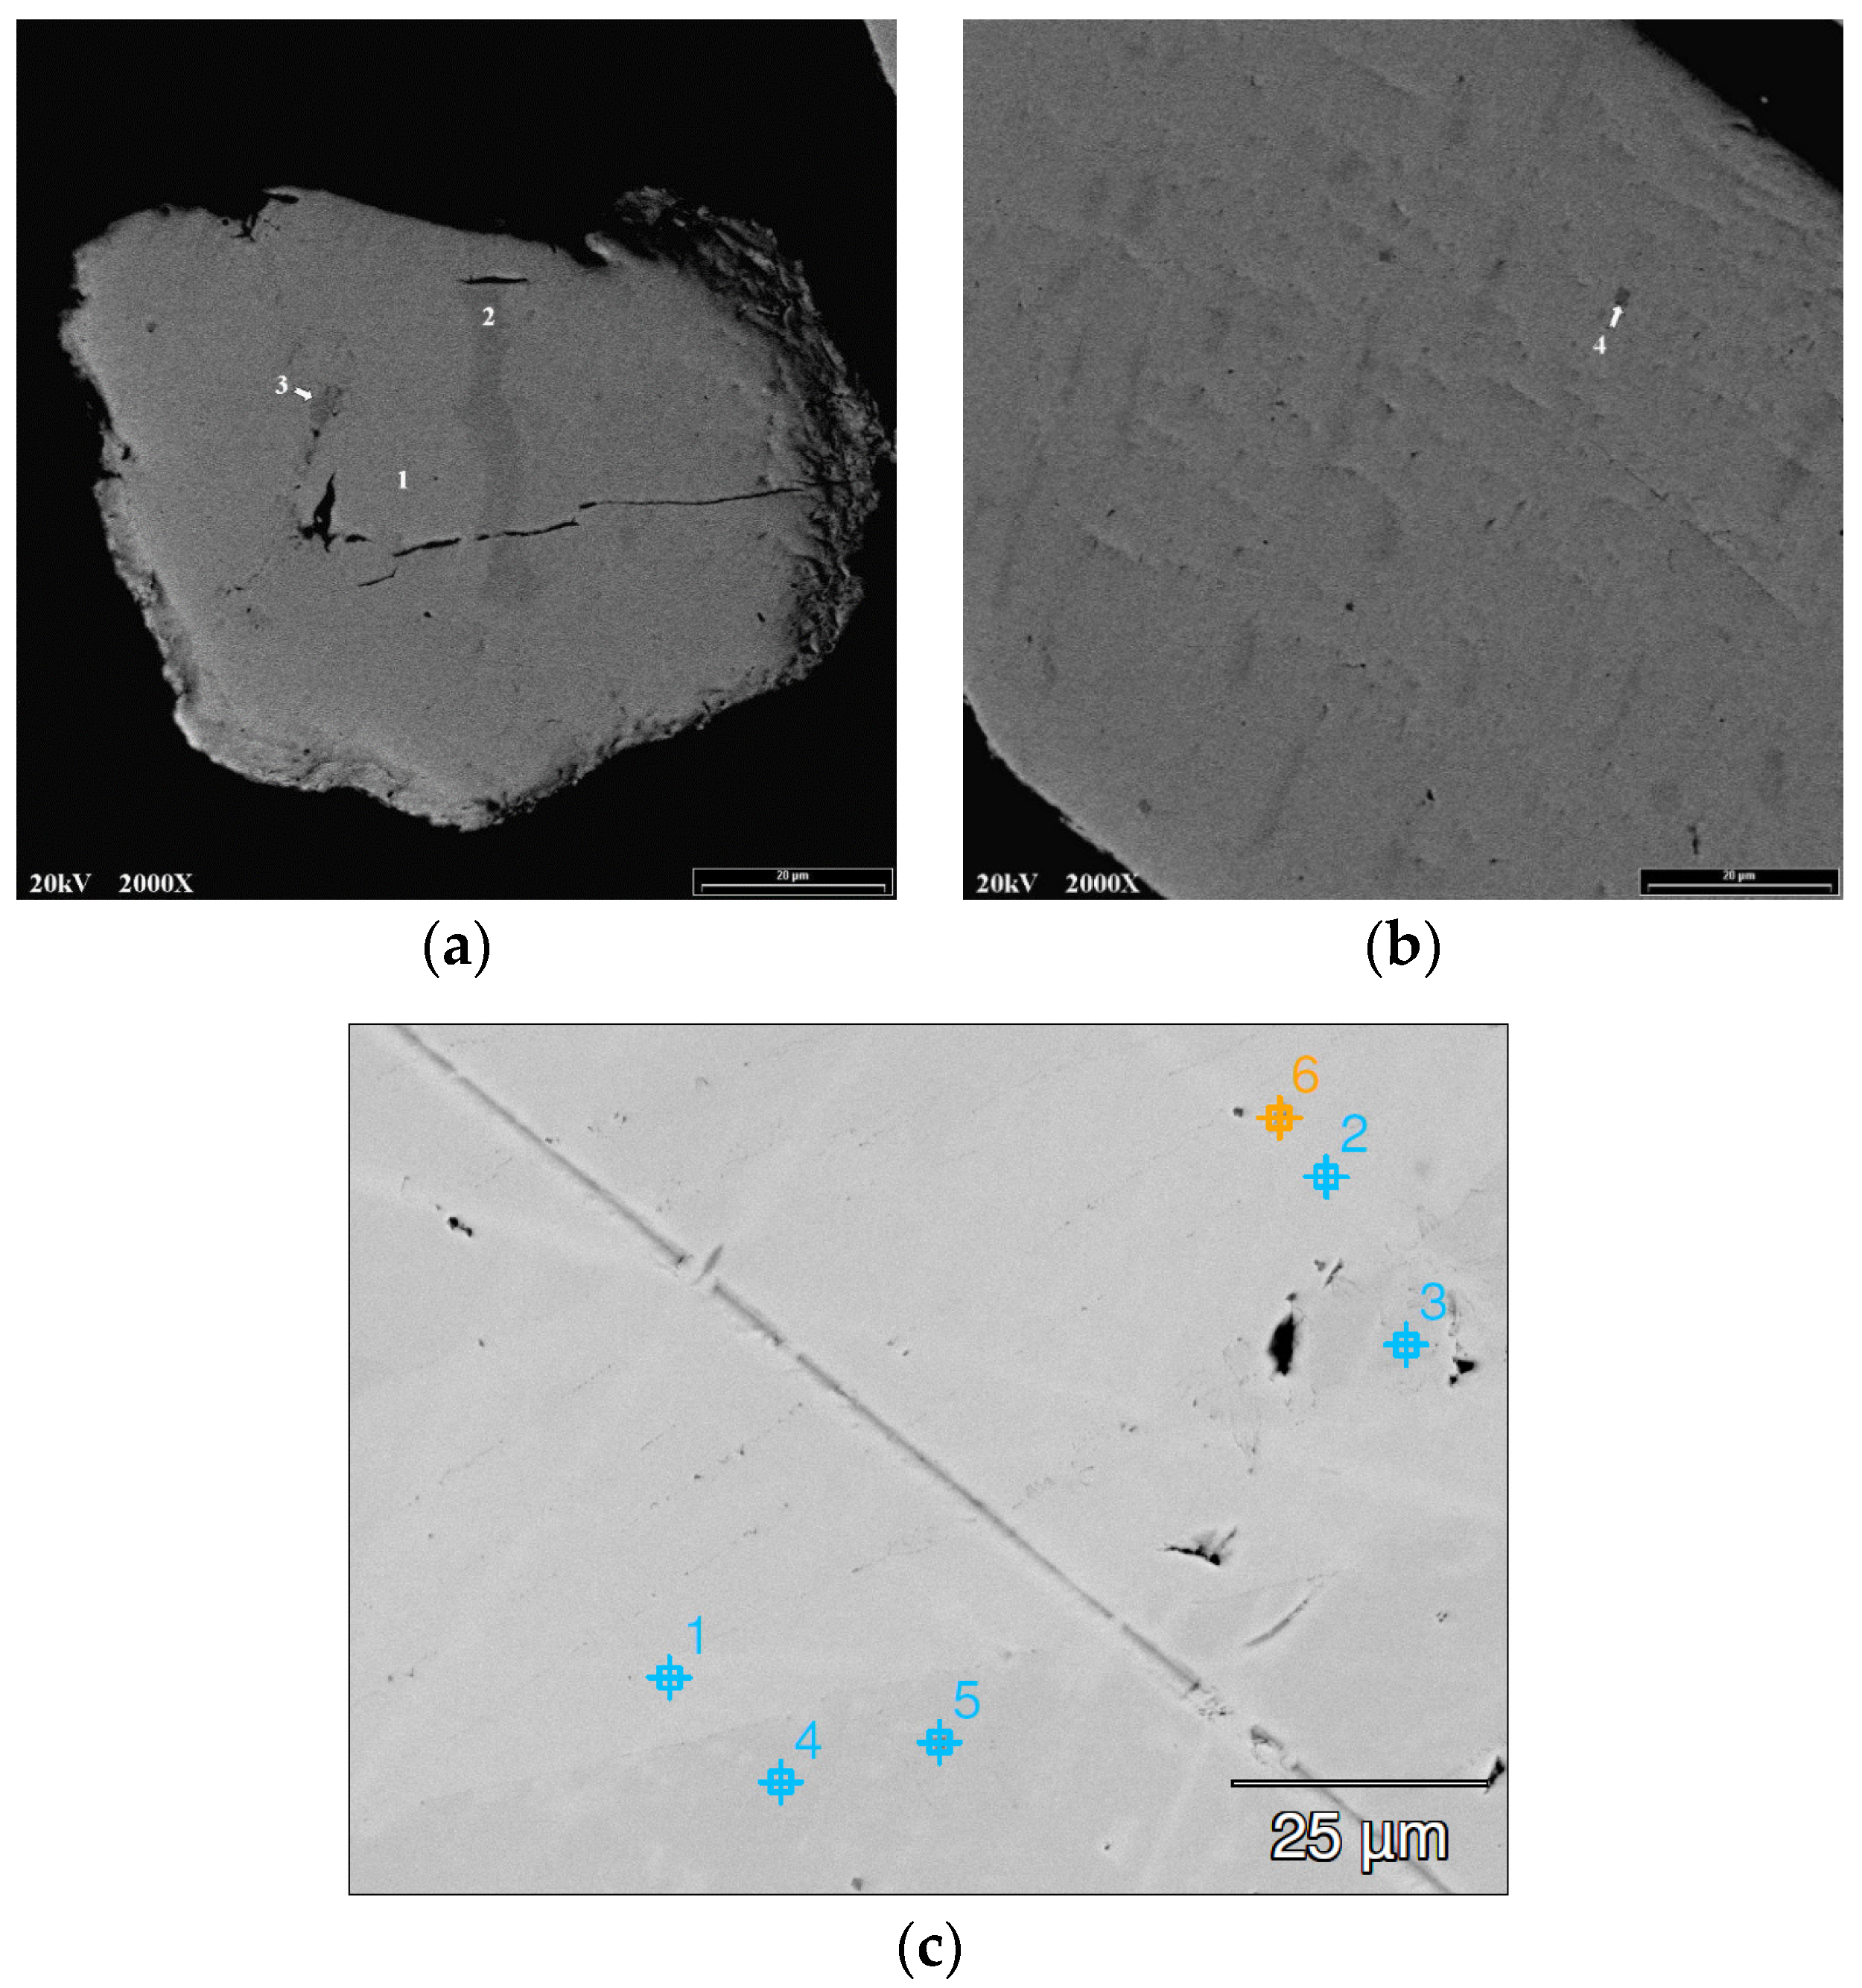
4.3. Experimental Zr-Rich and Ni-Rich Zr7Ni10 Phase Analysis

The Zr-rich and Ni-rich Zr7Ni10 alloy samples were used to compare their experimental lattice parameters to defected lattice parameters, as predicted by the model and calculated from DFT. No annealing treatment was applied to the samples to preserve meta-stable, off-stoichiometric phases. Representative SEM images of the Zr-rich sample are shown in Figure 6a,b, and their phase compositions, represented by differing contrasts in the images, are analyzed by EDS and listed in Table 6. The stoichiometric Zr7Ni10 phase has a B/A ratio of 1.43 (where B = Ni, Al, and Mn and A = Zr), and the SEM-EDS analysis shows that the sample is mainly composed of a Zr-rich phase and smaller distributions of a Ni-rich phase, with a small presence of the Zr2Ni phase. There is a small amount of Mn contamination in this sample, which may affect the interpretation of the results. However, previous first-principle calculations investigating substitutions in LaNi5 and TiMn2 alloys suggest that Mn and Ni substitutions do not alter the alloys’ hydrogen stability sites, which offers an indication that the small amount of observed contamination may also have little effect [38]. A representative SEM image of the Ni-rich sample is shown in Figure 6c, with the phase composition listed similarly in Table 6. The analysis shows that the second sample is composed mainly of Ni-rich phases with the minor presence of the Zr2Ni phase. Contamination was not detected in this particular sample.
Experimental lattice parameters for the Zr-rich and Ni-rich Zr7Ni10 samples were obtained from XRD measurement, and are listed in Table 7. In comparison to the theoretical and experimental lattice parameters for the stoichiometric Zr7Ni10 phase, both off-stoichiometric samples show unit cells that are smaller than expected. However, the Zr-rich sample shows a larger unit cell than the Ni-rich samples, which is consistent with expectations. The c/b ratios are also >1, which is consistent with the anti-site defected structures predicted by the point defect model.

5. Conclusions

Defect models for the Zr7Ni10 and Zr2Ni7 intermetallic phases were calculated from first-principles using DFT and statistical mechanics. Zr-Ni based active negative electrode materials in Ni/MH batteries offer performance benefits such as improved capacity through synergetic phase effects, and the understanding and engineering of point defects can contribute to further improvement in these materials through the framework that is laid by the defect models. DFT calculations confirmed that the Zr7Ni10 phase structure has space group Cmca symmetry in the ground state. The point defect model indicates that at stoichiometry, the Zr7Ni10 phase tends to form Zr → Ni and Ni → Zr anti-site defects in a 1:1 ratio, while Zr2Ni7 tends to form Ni vacancy defects. Zr vacancies appear almost negligible in both Zr7Ni10 and Zr2Ni7 compounds. Zr → Ni anti-site defects are the most prevalent defects in Zr-rich compositions in both compounds, and Ni → Zr anti-site defects are the most prevalent defects in Ni-rich compositions. In general, it is easier to form defects in the Zr7Ni10 phase than the Zr2Ni7 phase. Comparison to experimental lattice parameters for the Zr7Ni10 phase from XRD measurements show some discrepancy (~0.5% difference in c/b ratios) with regard to the orthorhombic versus tetragonal unit cells predicted by first principle calculations, which warrants further re-examination of the typical assumptions, as well as supercells that consider the distribution and interaction of defects in the calculations. Despite this discrepancy, the experimental lattice trends for off-stoichiometric phases (c/b ratios > 1) appear to be consistent with the anti-site defects and the c/b ratios predicted by the model. The point defect models can be used to further investigate absorption–desorption or diffusion kinetics through nudged elastic band DFT calculations, offering further tuning of alloy design and the optimization of electrochemical properties for Ni/MH batteries.

Acknowledgments

The authors would like to thank the following individuals from BASF-Ovonic for their help: Jean Nei, David Pawlik, Alan Chan, Ryan J. Blankenship, and Su Cronogue.

Author Contributions

Kwo-Hsiung Young and Diana F. Wong conceived and designed the experiments; Diana F. Wong and Taihei Ouchi performed the experiments; Kwo-Hsiung Young, Diana F. Wong, Taihei Ouchi, and K. Y. Simon Ng analyzed the data; Diana F. Wong prepared the manuscript.

Conflicts of Interest

The authors declare no conflict of interest.

Appendix

Defect models for Zr7Ni10 and Zr2Ni7 intermetallic phases are developed using statistical mechanics within the generalized grand canonical µPT formalism for an ordered, binary system AnBm, where Zr is an A-site atom and Ni is a B-site atom. The model is similar to the ones developed for NiAl [17] and NiAl3 [18] systems, but is extended to account for a variable number of sublattices for each type of atom. These statistical mechanics-based models address the issue of non-homogeneity that can occur if we apply a monatomic crystal defect model wherein the formation energy of a vacancy defect is described by removing an atom and inserting it at a surface site; hypothetically by analogy in a binary system, A-site vacancies in an A0.5B0.5 crystal would generate a surface of strictly A atoms, introducing non-homogeneity into the system [16,39]. To maintain homogeneity and composition of the bulk, such A-site vacancies are then necessarily accompanied by B-site vacancies, A → B anti-site defects, or a mixture of the defects. The statistical mechanics model considers the different possible local defect configurations possible, minimizing the system potential to obtain equilibrium concentrations of each type of defect.
The system is described on a unit cell basis, so that n = 28 and m = 40 for Zr7Ni10 phase and n = 8 and m = 28 for Zr2Ni7 phase. The generalized grand canonical formalism prescribes the independent variable temperature T, pressure P, and chemical potential µA and µB. The generalized grand canonical potential J’ is defined as:
J = U + P V T S μ A N A μ B N B
where U is the internal energy of the system, V is the volume, S is the entropy, NA is the number of A atoms in the system, and NB is the number of B atoms in the system. The equilibrium concentrations of each type of point defect are found by minimizing the potential with respect to the concentration c i ν or particle number N i ν of each type of defect i (vacancy or anti-site) on the sublattice ν. Each system contains M total possible lattice sites, which may be divided into sublattices α for A-site atoms and β for B-site atoms. The sublattices can be further subdivided into α1, α2, …, αk, and β1, β2, …, βl, for k equivalent A atoms and l equivalent B atoms. For example in the Zr7Ni10 phase, we assign 4a, 8d, 8e, and 8f1 sites for the Zr atoms to sublattices α1, α2, α3, and α4, respectively, and 8f2, 16g1, and 16g2 sites for the Ni atoms to sublattices β1, β2, and β3, respectively. M is then also the sum of the lattice sites for each of the sublattices:
M = k M α k + l M β l
where M α k is the total number of lattice sites for the αk sublattice and M β l is the total number of lattice sites for the βl sublattice. The number of A and B atoms NA and NB in the system that can occupy the lattice sites is described by the accounting of the lattice sites and the number of defects:
N A = k M α k k N v α k k N B α k + l N A β l
N B = l M β l l N v β l l N A β l + k N B α k
where N v α k is the number of vacancy defects on the αk sublattice, N B α k is the number of B → A antisite defects on the αk sublattice, N v β l is the number of vacancy defects on the βl sublattice, and N A β l is the number of A→B antisite defects on the βl sublattice.
The internal energy U can be described as a sum of the ground state energy of the non-defected system and the defect formation energies:
U = M ε 0 + k N v α k ε v α k + N B α k ε B α k + l N v β l ε v β l + N A β l ε A β l
The ground state energy per atom ε 0 and the defect formation energy parameters ε i ν are calculated from DFT using a supercell of N total lattice sites, such that
ε 0 = 1 N E ( N , 0 )
ε v α k , β l = E ( N 1 , 1 α k , β l ) E ( N , 0 )
ε A β l = E ( N , A β l ) E ( N , 0 )
ε B α k = E ( N , B α k ) E ( N , 0 )
where E ( N , 0 ) is the ground state energy of the supercell of size N with zero defects, E ( N 1 , 1 α k , β l ) is the ground state energy of the supercell of size N − 1 with one vacancy on the respective sublattice, E ( N , A β l ) is the ground state energy of the supercell of size N with one A atom on the βl sublattice, and E ( N , B α k ) is the ground state energy of the supercell of size N with one B atom on the αk sublattice. For low defect concentrations and cases near stoichiometry, the defects are assumed to be non-interacting so that ε i ν does not change with concentration.
The volume of the system can also be written as a sum of its equilibrium volume in the non-defected state and the changes in the volume due to its defects:
V = M v 0 + k N v α k v v α k + N B α k v B α k + l N v β l v v β l + N A β l v A β l
where v 0 is the unit-cell volume per atom and v i ν is the defect volume formation parameter for defect i on sublattice ν, defined similarly as in Equations (A6)–(A9).
The entropy S is the sum of the equilibrium entropy in the non-defected state, the defect formation entropies, and the configurational entropy:
S = M s 0 + k N v α k s v α k + N B α k s B α k + l N v β l s v β l + N A β l s A β l S = M s 0 + k + k B ln ( k M α k ! N v α k ! N B α k ! ( M α k N v α k N B α k ) ! S = M s 0 + k · l M β l ! N v β l ! N A β l ! ( M β l N v β l N B β l ) ! )
where s 0 is the entropy per atom in the non-defected structure and s i ν is the defect entropy formation parameter for defect i on sublattice ν, defined similarly as in Equations (A6)–(A9). Concentrations for each type of defect c i ν can be derived by substituting Equations (A3)–(A5), (A10) and (A11) into Equation (A1) and minimizing the potential with respect to N i ν , such that:
c v α k = N v α k M = M α k M e s v α k / k B e ( ε v α k + μ A + P v v α k ) / k B T 1 + e s v α k / k B e ( ε v α k + μ A + P v v α k ) / k B T + e s B α k / k B e ( ε B α k + μ A μ B + P v B α k ) / k B T
c B α k = N B α k M = M α k M e s B α k / k B e ( ε B α k + μ A μ B + P v B α k ) / k B T 1 + e s v α k / k B e ( ε v α k + μ A + P v v α k ) / k B T + e s B α k / k B e ( ε B α k + μ A μ B + P v B α k ) / k B T
Similar expressions are derived for c v β l and c A β l .
The chemical potentials μA and μB are Lagrangian parameters that can be determined from the thermodynamic relation J’ = 0 for the generalized grand canonical potential [16]. From this relation, we combine Equations (A1), (A5) and (A10)–(A13) and their analogous expressions to obtain:
ε 0 + P v 0 T s 0 = k M α k M μ A + l M β l M μ B k M α k M k B T ln ( 1 M M α k c v α k M M α k c B α k ) l M β l M k B T ln ( 1 M M β l c v β l M M β l c A β l )
A final expression describing the composition of the compound preserves the composition of the compound of the system of interest:
N A N B = k M α k k N B α k k N v α k + l N A β l l M β l l N A β l l N v β l + k N B α k = x 1 x  
where x is the atomic fraction of A atoms of the system AxB1−x.
The effective formation energy of the atomic defects is defined as:
Δ H i ν = k B c i ν ( 1 T )  
which simplifies to
Δ H v α k =   ε v α k + μ A
Δ H B α k = ε B α k + μ A μ B
and similarly for Δ H v β l and Δ H A β l .
Within this statistical mechanics model for a binary intermetallic compound, the contributions from PV and entropy are much smaller than the contributions from the internal energy, and, therefore, P v 0 , v i ν , s 0 and s i ν are typically considered negligible for room temperature and pressure.

Abbreviations

c i ν Concentration of defect i on the sublattice ν
c v Ni Concentration of vacancies on the Ni sublattices
c v Zr Concentration of vacancies on the Zr sublattices
c Zr Ni Concentration of Zr anti-site atoms in the Ni sublattices
c Ni Zr Concentration of Ni anti-site atoms in the Zr sublattices
DFTDensity functional theory
EDSEnergy dispersive spectroscopy
JGeneralized grand canonical potential
kBBoltzmann constant
MNumber of lattice sites
NANumber of A atoms
NBNumber of B atoms
N i ν Number of defect i on the sublattice ν
MHMetal hydride
Ni/MHNickel/metal hydride
PPressure
s 0 Entropy per atom for non-defected structure
s i ν Defect entropy formation parameter for defect i on sublattice ν
SEMScanning electron microscopy
TTemperature
UInternal energy
v 0 Unit-cell volume per atom for non-defected structure
v i ν Defect volume formation parameter for defect i on sublattice ν
XRDX-ray diffraction
ZNumber of formula units
αkkth sublattice for A-site atoms
βllth sublattice for B-site atoms
ΔHfEnergy of formation
ΔHvNiEffective defect formation energy for vacancies in the Ni sublattices
ΔHvZrEffective defect formation energy for vacancies in the Zr sublattices
ΔHZrNiEffective defect formation energy for Zr anti-site atoms in the Ni sublattices
ΔHNiZrEffective defect formation energy for Ni anti-site atoms in the Zr sublattices
ε 0 Energy per atom for non-defected structure
ε i ν Defect energy formation parameter for defect i on sublattice ν
µAChemical potential for A atom
µBChemical potential for B atom

References

  1. Joubert, J.M.; Latroche, M.; Percheron-Guégan, A.; Bouet, J. Improvement of the electrochemical activity of Zr–Ni–Cr laves phase hydride electrodes by secondary phase precipitation. J. Alloy. Compd. 1996, 240, 219–228. [Google Scholar] [CrossRef]
  2. Young, K.; Nei, J.; Ouchi, T.; Fetcenko, M. Phase abundances in AB2 metal hydride alloys and their correlations to various properties. J. Alloy. Compd. 2011, 509, 2277–2284. [Google Scholar] [CrossRef]
  3. Young, K.; Ouchi, T.; Fetcenko, M.A.; Mays, W.; Reichman, B. Structural and electrochemical properties of Ti1.5Zr5.5VxNi10−x. Int. J. Hydrog. Energy 2009, 34, 8695–8706. [Google Scholar] [CrossRef]
  4. Joubert, J.M.; Latroche, M.; Percheron-Guégan, A. Hydrogen absorption properties of several intermetallic compounds of the Zr Ni system. J. Alloy. Compd. 1995, 231, 494–497. [Google Scholar] [CrossRef]
  5. Young, K.; Ouchi, T.; Liu, Y.; Reichman, B.; Mays, W.; Fetcenko, M. Structural and electrochemical properties of TixZr7−xNi10. J. Alloy. Compd. 2009, 480, 521–528. [Google Scholar] [CrossRef]
  6. Young, M.; Chang, S.; Young, K.; Nei, J. Hydrogen storage properties of ZrVxNi3.5−x (x = 0.0–0.9) metal hydride alloys. J. Alloy. Compd. 2013, 580, S171–S174. [Google Scholar] [CrossRef]
  7. Myers, S.M.; Baskes, M.I.; Birnbaum, H.K.; Corbett, J.W.; DeLeo, G.G.; Estreicher, S.K.; Haller, E.E.; Jena, P.; Johnson, N.M.; Kirchheim, R.; et al. Hydrogen interactions with defects in crystalline solids. Rev. Mod. Phys. 1992, 64, 559–617. [Google Scholar] [CrossRef]
  8. Chen, K.C.; Peterson, E.J.; Thoma, D.J. HfCo2 laves phase intermetallics—Part I: Solubility limits and defect mechanisms. Intermetallics 2001, 9, 771–783. [Google Scholar] [CrossRef]
  9. Chen, K.C.; Chu, F.; Kotula, P.G.; Thoma, D. HfCo2 laves phase intermetallics—Part II: Elastic and mechanical properties as a function of composition. Intermetallics 2001, 9, 785–798. [Google Scholar] [CrossRef]
  10. Ovshinsky, S.R.; Fetcenko, M.A.; Ross, J. A nickel metal hydride battery for electric vehicles. Science 1993, 260, 176–181. [Google Scholar] [CrossRef] [PubMed]
  11. Züttel, A. Materials for hydrogen storage. Mater. Today 2003, 6, 24–33. [Google Scholar] [CrossRef]
  12. Young, K. Stoichiometry in inter-Metallic Compounds for Hydrogen Storage Applications. In Stoichiometry and Materials Science—When Numbers Matter; Innocenti, A., Kamarulzaman, N., Eds.; InTech: Rijeka, Croatia, 2012; pp. 147–172. [Google Scholar]
  13. Stein, F.; Palm, M.; Sauthoff, G. Structure and stability of Laves phases. Part I. Critical assessment of factors controlling Laves phase stability. Intermetallics 2004, 12, 713–720. [Google Scholar] [CrossRef]
  14. Moura, C.S.; Motta, A.T.; Lam, N.Q.; Amaral, L. Atomistic simulations of point defects in zrni intermetallic compounds. Nucl. Instrum. Methods Phys. Res. Sect. B Beam Interact. Mater. At. 2001, 180, 257–264. [Google Scholar] [CrossRef]
  15. Mayer, J.; Elsasser, C.; Fahnle, M. Concentrations of atomic defects in B2-FexAl1−x—An ab-initio study. Phys. Status Solidi B Basic Res. 1995, 191, 283–298. [Google Scholar] [CrossRef]
  16. Mayer, J.; Fahnle, M. On the meaning of effective formation energies, entropies and volumes for atomic defects in ordered compounds. Acta Mater. 1997, 45, 2207–2211. [Google Scholar] [CrossRef]
  17. Meyer, B.; Fähnle, M. Atomic defects in the ordered compound B2-NiAl: A combination of ab initio electron theory and statistical mechanics. Phys. Rev. B 1999, 59, 6072–6082. [Google Scholar] [CrossRef]
  18. Rasamny, M.; Weinert, M.; Fernando, G.; Watson, R. Electronic structure and thermodynamics of defects in NiAl3. Phys. Rev. B 2001, 64. [Google Scholar] [CrossRef]
  19. Notten, P.; Latroche, M.; Percheron-Guégan, A. The influence of Mn on the crystallography and electrochemistry of nonstoichiometric AB5-type hydride-forming compounds. J. Electrochem. Soc. 1999, 146, 3181–3189. [Google Scholar] [CrossRef]
  20. Okamoto, H. Ni-Zr (nickel-zirconium). J. Phase Equilibria Diffus. 2007, 28, 409–409. [Google Scholar] [CrossRef]
  21. Giannozzi, P.; Baroni, S.; Bonini, N.; Calandra, M.; Car, R.; Cavazzoni, C.; Ceresoli, D.; Chiarotti, G.L.; Cococcioni, M.; Dabo, I. Quantum Espresso: A modular and open-source software project for quantum simulations of materials. J. Phys. Condens. Matter 2009, 21, 395–502. [Google Scholar] [CrossRef] [PubMed]
  22. Garrity, K.F.; Bennett, J.W.; Rabe, K.M.; Vanderbilt, D. Pseudopotentials for high-throughput DFT calculations. Comput. Mater. Sci. 2014, 81, 446–452. [Google Scholar] [CrossRef]
  23. Perdew, J.P.; Burke, K.; Ernzerhof, M. Generalized gradient approximation made simple. Phys. Rev. Lett. 1996, 77, 3865–3868. [Google Scholar] [CrossRef] [PubMed]
  24. Methfessel, M.; Paxton, A.T. High-precision sampling for brillouin-zone integration in metals. Phys. Rev. B 1989, 40, 3616–3621. [Google Scholar] [CrossRef]
  25. Monkhorst, H.J.; Pack, J.D. Special points for brillouin-zone integrations. Phys. Rev. B 1976, 13, 5188–5192. [Google Scholar] [CrossRef]
  26. Takeshita, H.T.; Fujiwara, N.; Oishi, T.; Noréus, D.; Takeichi, N.; Kuriyama, N. Another unusual phenomenon for Zr7Ni10: Structural change in hydrogen solid solution and its conditions. J. Alloy. Compd. 2003, 360, 250–255. [Google Scholar] [CrossRef]
  27. Takeshita, H.; Kondo, S.; Miyamura, H.; Takeichi, N.; Kuriyama, N.; Oishi, T. Re-examination of Zr7Ni10 single-phase region. J. Alloy. Compd. 2004, 376, 268–274. [Google Scholar] [CrossRef]
  28. Kirkpatrick, M.; Smith, J.; Larsen, W. Structures of the intermediate phases Ni10Zr7 and Ni10Hf7. Acta Crystallogr. 1962, 15, 894–903. [Google Scholar] [CrossRef]
  29. Glimois, J.L.; Forey, P.; Feron, J.; Becle, C. Structural investigations of the pseudo-binary compounds Ni10−x CuxZr7. J. Less Common Met. 1981, 78, 45–50. [Google Scholar] [CrossRef]
  30. Joubert, J.M.; Cerný, R.; Yvon, K.; Latroche, M.; Percheron-Guégan, A. Zirconium–nickel, Zr7Ni10: Space group revision for the stoichiometric phase. Acta Crystallogr. Sect. C Cryst. Struct. Commun. 1997, 53, 1536–1538. [Google Scholar] [CrossRef]
  31. Momma, K.; Izumi, F. VESTA 3 for three-dimensional visualization of crystal, volumetric and morphology data. J. Appl. Crystallogr. 2011, 44, 1272–1276. [Google Scholar] [CrossRef]
  32. Eshelman, F.R.; Smith, J.F. The structure of Zr2Ni7. Acta Crystallogr. Sect. B Struct. Crystallogr. Cryst. Chem. 1972, 28, 1594–1600. [Google Scholar] [CrossRef]
  33. Villars, P. Ni5Zr (ZrNi5) Crystal Structure. In Material Phases Data System (MPDS); Springer-Verlag GmbH: Heidelberg, Germany, 2014. [Google Scholar]
  34. Joubert, J.M.; Černý, R.; Yvon, K.; Latroche, M.; Percheron-Guégan, A. Refinement of the crystal structure of zirconium nickel, Zr8Ni21. Z. Kristallogr. New Cryst. Struct. 1998, 213, 227–228. [Google Scholar] [CrossRef]
  35. Villars, P. NiZr (ZrNi) Crystal Structure. In Material Phases Data System (MPDS); Springer-Verlag GmbH: Heidelberg, Germany, 2014. [Google Scholar]
  36. Nash, P.; Jayanth, C.S. The Ni-Zr (nickel-zirconium) system. Bull. Alloy Phase Diagr. 1984, 5, 144–148. [Google Scholar] [CrossRef]
  37. Young, K. Metal Hydrides. In Elsevier Reference Module in Chemistry, Molecular Sciences and Chemical Engineering; Elsevier B.V.: Waltham, MA, USA, 2013. [Google Scholar]
  38. Wong, D.F.; Young, K.; Ng, K.Y.S. First-principles study of structure, initial lattice expansion, and pressure-composition-temperature hysteresis for substituted LaNi5 and TiMn2 alloys. Model. Simul. Mater. Sci. Eng. 2016; submitted for publication. [Google Scholar]
  39. Schott, V.; Fähnle, M. Concentration of atomic defects in ordered compounds: Canonical and grandcanonical formalism. Phys. Status Solidi B 1997, 204, 617–624. [Google Scholar] [CrossRef]
Figure 1. Unit-cell crystal structures for (a) Zr7Ni10 and (b) Zr2Ni7.
Batteries 02 00023 g001
Figure 2. Density functional theory (DFT) formation energies for Zr7Ni10 and its point defects with tie lines.
Batteries 02 00023 g002
Figure 3. Theoretical defect concentrations for Zr7Ni10 at 1000 °C.
Batteries 02 00023 g003
Figure 4. Formation energies for Zr2Ni7 and its point defects with tie lines.
Batteries 02 00023 g004
Figure 5. Theoretical defect concentrations for Zr2Ni7 at 1000 °C.
Batteries 02 00023 g005
Figure 6. Scanning electron microscopy (SEM) images of a Zr-rich Zr7Ni10 alloy sample showing representative phase distributions of (a) mainly Zr-rich phase and a smaller distribution of Ni-rich phases with (b) the presence of some amount of the Zr2Ni phase; and (c) a Ni-rich Zr7Ni10 alloy sample consisting of mainly Ni-rich phase and the presence of some amount of the Zr2Ni phase. The bar on the right lower corner of the Zr-rich samples indicates a length of 20 μm. Chemical compositions associated with the numbered areas are listed in Table 6.
Batteries 02 00023 g006
Table 1. Zr7Ni10 unit-cell lattice parameters.
ParameterThis WorkReferences [28,29]Reference [30]
Space groupCmcaAba2Cmca
a (Å)12.41912.38612.381
b (Å)9.1799.1569.185
c (Å)9.1809.2119.221
Unit-cell volume (Å3)1046.51044.61048.6
Table 2. Theoretical effective formation energies for point defects in Zr7Ni10 at 1000 °C.
DefectsNi-RichStoichiometricZr-Rich
ΔHvZr (eV)2.122.222.33
ΔHvNi (eV)1.101.030.95
ΔHNiZr (eV)0.490.660.86
ΔHZrNi (eV)0.800.630.44
Table 3. Unit-cell lattice parameters for non-defected and defected Zr7Ni10.
ParametersPerfect CrystalZr Vacancy (4a)Ni → Zr Anti-Site (8e)Ni Vacancy (16g2)Zr→Ni Anti-Site (8f2)
a (Å)12.41812.33412.36512.37912.437
b (Å)9.1799.1529.1359.1729.224
c (Å)9.1809.1399.1529.1629.230
Unit-cell volume (Å3)1046.41031.61033.71040.31058.8
Table 4. Zr2Ni7 unit-cell lattice parameters.
Lattice ParameterThis WorkFrom Reference [32]
a (Å)4.6774.698
b (Å)8.2398.235
c (Å)12.17612.193
β (°)95.2095.83
Table 5. Theoretical effective formation energies for point defects in Zr2Ni7 at 1000 °C.
DefectsNi-RichStoichiometricZr-Rich
ΔHvZr (eV)1.892.523.47
ΔHvNi (eV)1.421.240.97
ΔHNiZr (eV)0.481.292.52
ΔHZrNi (eV)2.601.790.56
Table 6. Energy dispersive spectroscopy (EDS) phase compositions of select areas for Zr-rich and Ni-rich Zr7Ni10 alloy samples depicted in Figure 6.
SampleAreaZrNiAlMnB/APhase
Zr-rich Zr7Ni10142.657.30.00.11.35Zr7Ni10
235.664.40.00.11.81Zr7Ni10
338.459.40.02.21.60Zr7Ni10
466.033.90.00.10.52Zr2Ni
Ni-rich Zr7Ni10140.459.60.00.01.48Zr7Ni10
239.960.10.00.01.51Zr7Ni10
340.359.70.00.01.48Zr7Ni10
440.259.80.00.01.49Zr7Ni10
568.032.00.00.00.47Zr2Ni
659.940.10.00.00.67Zr2Ni
Table 7. Experimental lattice parameters for Zr-rich and Ni-rich Zr7Ni10 samples.
ParameterZr-Rich Zr7Ni10Ni-Rich Zr7Ni10
a (Å)12.36512.356
b (Å)9.1729.162
c (Å)9.2089.194
Unit-cell volume (Å3)1044.21040.7

