Article

Fundamentals of Using Battery Energy Storage Systems to Provide Primary Control Reserves in Germany

1
Associate Professorship Power Transmission Systems, Technical University of Munich (TUM), Arcisstr. 21, Munich 80333, Germany
2
Institute for Electrical Energy Storage Technology, Technical University of Munich (TUM), Arcisstr. 21, Munich 80333, Germany
*
Authors to whom correspondence should be addressed.
Batteries 2016, 2(3), 29; https://doi.org/10.3390/batteries2030029
Submission received: 28 April 2016 / Revised: 22 August 2016 / Accepted: 30 August 2016 / Published: 13 September 2016

Abstract

:
The application of stationary battery storage systems to German electrical grids can help with various storage services. This application requires controlling the charge and discharge power of such a system. For example, photovoltaic (PV) home storage, uninterruptible power supply, and storage systems for providing ancillary services such as primary control reserves (PCRs) represent battery applications with positive profitability. Because PCRs are essential for stabilizing grid frequency and maintaining a robust electrical grid, German transmission system operators (TSOs) released strict regulations in August 2015 for providing PCRs with battery storage systems as part of regulating the International Grid Control Cooperation (IGCC) region in Europe. These regulations focused on the permissible state of charge (SoC) of the battery during nominal and extreme conditions. The concomitant increased capacity demand oversizing may result in a significant profitability reduction, which can be attenuated only by using an optimal parameterization of the control algorithm for energy management of the storage systems. In this paper, the sizing optimization is achieved and a recommendation for a control algorithm that includes the appropriate parameters for the requirements in the German market is given. Furthermore, the storage cost is estimated, including battery aging simulations for different aging parameter sets to allow for a realistic profitability calculation.

1. Introduction

Battery energy storage systems (BESS) and their integration into the electricity grid have become increasingly important, especially in the field of renewable energy. Nevertheless, battery storage systems reach market maturity slowly because of the lack of a corresponding legal framework and the high costs of the systems, which come from the expense of lithium-ion cells. Although photovoltaic (PV) home-storage systems have a firm legal framework, high prices prevent them from being more widely adopted [1]. Large-scale community storage systems at the distribution grid level may be more attractive economically because of the possibilities of combining several tasks or business models in one storage system; however, in Germany, such multi-tasking storage systems are faced by an inappropriate legal framework [2,3]. Grid energy storage systems that can reduce high loads and voltages resulting from growing amounts of decentralized renewable energy generation do not constitute an economically viable alternative for grid reinforcement or innovative grid utilities and have not reached market maturity [4]. Within the past few years, large-scale storage systems that provide a primary control reserve (PCR) have represented a growing business model (Figure 1). The growing diffusion of stationary battery storage systems led to an annual price decline of 18% for home storage systems in 2016 [5]. The development costs for larger PCR storage are not well-known but should be similar.
In contrast to PV storage systems, the barrier to PCR storage systems is not the high investment costs but vague regulations and a complicated prequalification process for storage systems providing PCRs. This situation changed in August 2015 when the German transmission system operators (TSOs) published clear regulations for providing a PCR with battery storage systems [7]. Because the PCR system regulates the grid frequency and is essential for a stable electricity grid, these regulations are very strict and require a battery capacity provision. To adhere to these regulations and still achieve an acceptable level of profitability, an optimized control algorithm for the storage system is necessary. Because various parameters can be changed within a permitted range for the optimization and battery operation, this paper recommends a suitable control algorithm that includes the optimized parameterization. Furthermore, a profitability calculation that includes an extensive aging evaluation was performed for lithium-iron cells using lithium iron phosphate (LFP) technology data estimations. LFP is a promising technology for PCRs because of its high cycle stability. The legitimacy of the German regulations given in [7] are being discussed by the EU commission, and this paper also considers the probable changes contained in a news release from the German Energy Storage Association [8]. This work is separated into four sections, starting with an introduction to the PCR market, with a focus on Germany. Second, the legal framework for grid-coupled BESS is given and is followed by an overview of schedule transactions in the electricity markets. Finally, we present a full overview of our methodical approach and finish with our conclusions about the fundamentals of using BESS for PCR.

2. Primary Control Reserve

When disparities between energy generation and consumption occur in the transmission grid control zones, the grid frequency can differ from its nominal value, which is 50 Hz for the Union for the Coordination of the Transmission of Electricity (UCTE) grid. For that reason, the TSOs who are responsible for the various control zones must arrange for immediate procurement of the required control power to restore the power balance to the grid. Control power can be procured through tender auctions and is divided into three different products that differ in the expediency of their delivery. PCRs must be activated within 30 s and are the fastest available control power product traded in the UCTE region. Secondary control reserves (SCR) can be activated within 5 min and can restore the grid frequency to its nominal value. Tertiary control reserves (TCR) can be activated within 15 min and act as relief for SCRs. Because of their low monetary returns, TCRs are not attractive for battery storage systems from a business standpoint [2]. Nevertheless, PCRs and SCRs offer much higher profitability, and PCRs are the most suitable because they offer continuous and autonomous provisions. The calculations and regulations for this are explained below.

2.1. Trading Primary Control Reserves

In Germany, PCRs, together with all other control reserve products, are traded on the online platform, www.regelleistung.net, and they can be offered by every prequalified power system operator. The tender period for PCRs is from Monday to Friday, and the bidding closes on Tuesday the week before. Only a power price can bid for PCRs, which means that the supplied energy is not paid for. The minimum offered power is 1 MW, and this can be increased in 1 MW steps. After the bidding is closed, the offers are sorted according to the merit order system until the estimated PCR demand is covered.

2.2. Provision Characteristics

The activation call is performed automatically and decentralized at every participating facility by a given power-frequency characteristic (P-f characteristic) throughout the entire tendering period of one week (Figure 2).
According to this characteristic, the control power is not supplied within the tolerated frequency deviation band between 49.99 Hz and 50.01 Hz. For deviations between 10 mHz and 200 mHz, the PCR power provided must linearly increase up to 100% of the bid amount and remain there for deviations higher than 200 mHz for both positive and negative control powers.

2.3. Regulations Regarding the Battery State of Charge

The regulations given in [7] make an available energy reserve in the storage system compulsory for the entire tendering period, as long as the grid frequency curve is in the normal range. This energy reserve must be able to provide the entire amount of prequalified reserve power in both the positive and negative directions for at least 30-min, which is referred to as the 30-min criterion. Because this criterion could be rejected in the new European Network Code on Load Frequency Control & Reserves (NC LFCR) in favor of a uniform 15-min criterion, all investigations in this paper are also carried out based on this alternative. In addition, this allows our results to be valid for different regulatory frameworks in countries that have implemented PCR markets and both criterions. The resulting permitted SoC ranges, which must not depart from the normal frequency progression, are shown in Figure 3. The maximum and minimum SoC limits depend on the available energy content, Ebatt, of the battery system (capacity) and the prequalified PCR power, Ppq, as specified by Equations (1) and (2) according to [7]. The values in the parentheses correspond to the 15-min criterion.
S o C max =   E batt 0.5 ( 0.25 ) h · P pq E batt
S o C min =   0.5 ( 0.25 ) h · P pq E batt
According to [7], the frequency departs from the normal progression if at least one of the following deviations δ_f applies:
  • δ_f > ±50 mHz for more than 15 min;
  • δ_f > ±100 mHz for more than 5 min;
  • δ_f > ±200 mHz at any time.
As soon as the normal progression is reached following one of the specified deviations, the battery SoC must be restored to the permitted range (Figure 3) within 2 h.

2.4. Degrees of Freedom

To keep the battery SoC within the permitted range, several degrees of freedom (DoFs), as defined in [9], are allowed by the German TSOs. The DoFs presume that the operators of the PCR plants deviate slightly from the supply characteristics given in Figure 2; they are described in more detail below.

2.4.1. Overfulfillment

The control power demand indicated by the P-f characteristic can be increased up to 20% at any time to modify the SoC.

2.4.2. Dead Band

The control power demand indicated by the P-f characteristic can also be provided within the tolerated deviation range of ±10 mHz if the SoC needs to be adjusted.

2.4.3. Provision Rate

The control power demand indicated by the P-f characteristic must be provided within 30 s or less. Therefore, the gradient of the provided PCR power can be adjusted within certain boundaries in order to influence the charging or discharging speed as appropriate for the current SoC.

2.4.4. Scheduled Transactions

The most important way to reach the desired SoC is by trading energy on the electricity market. By selling or buying energy on the European Energy Exchange (EPEX), the SoC can be decreased or increased as required while simultaneously providing the PCR power, but to ensure proper measurements of both power flows, they must be energetically separated.

3. Legal Framework for Grid-Coupled Energy-Storage Systems

3.1. Electricity Costs

Energy consumers in Germany pay fees for grid use (the grid fee, specified by the German Energy Economy Law (EnWG)) and to fund renewable energies (the Renewable Energy Act (EEG) reallocation fee, specified by the German law EEG 2014), in addition to the price for generating and marketing the power. Such fees also apply to buying energy on the EPEX. Approximately 2% of the overall electricity price goes directly to the grid fee in the form of various taxes and fees. The grid fee alone amounts to approximately 20% of the overall price, while the EEG reallocation fee, electricity tax, and concession levy, which amount to approximately 20%, 8%, and 5%, respectively, are separate line items on the electricity bill. With the German value-added tax (VAT) of 19%, the remaining 26% of the overall electricity price covers generating and marketing energy.

3.2. Operating Costs for Primary Control Reserve Storage Systems

According to §118 of the EnWG, energy storage systems installed prior to August 2026 are free of the grid fee, which includes all pegged taxes and fees. Furthermore, when feeding energy that has already been paid for back into the grid, storage systems are free from the EEG reallocation fee according to §60 of the EEG in Germany. Because both of these exceptions apply to PCR storage systems, this reduces the amount that must be paid when buying energy on the EPEX (Table 1).
In general, charging the storage to maintain adequate SoC and provide PCRs alone is free from any of the fees or taxes named in Table 1.

4. Scheduled Transactions on the Electricity Market

The EPEX offers products on the Power Spot Market and the Power Derivatives Market. The Spot Market provides opportunities for short-term transactions suitable for PCR storage systems in accordance with Section 2.3. In particular, the continuous Intraday Market, which is part of the Spot Market, is required to adjust the SoC of PCR storage systems, and quarter-hour, full-hour, or block contracts can be traded up to 30 min prior to delivery. The minimum volume increment is 100 kW and can be increased in 100 kW steps. Trades can be made only for the full quarter hour or hour. For the setup of the methodical approach, we neglected market entry barriers such as entrance and operation fees; however, we did include taxes and regulatory costs.

5. Methodical Approach

5.1. Battery Storage-System Model

The PCR BESS is assumed to be based on lithium ion technology, and the aging behavior of the technology is further investigated in Section 7.2. The efficiency of the entire BESS is set at 90% for charging and discharging processes, mainly because of the power electronics and auxiliary systems measured in the Energy Neighbor, a BESS built by the research project, EEBatt. Because of constant operation with negligible idle times, the overall self-discharge of the BESS is ignored for the following investigations.
Because the SoC is always changing when PCRs are provided, and there is no need to store energy for a certain amount of time, self-discharging is ignored in the following investigations.

5.2. Frequency Data

The grid frequency data from 2012, 2013 and 2014 form the simulation basis for the investigations in this paper. The datasets from 2013 and 2014 were provided by the German TSO 50 Hertz website and were partially inconsistent, and the data from 2012 were based on redundant measurements and were accurate. All inconsistent values in the datasets of 2013 (1,085,550 s worth of values) and 2014 (105,675 s worth of values) were replaced using the nominal frequency of 50 Hz. All three datasets were compared for their deviations from the nominal frequency to determine the worst-case dataset that was suitable for parameterizing the PCR storage. With a relative root-mean-square error (rRMSE) of 0.044%, the 2012 data set showed the highest deviations. Because of its high deviations and accuracy, it was used for parameterization.

5.3. P-f Characteristic

A proportional controller with a maximum and minimum output was the core element of the control algorithm described in this paper. As shown in Figure 2, we implemented a dead band for frequency deviations below 10 mHz. Considering a reasonable storage size, compliance with the permitted SoC area shown in Figure 3 is not possible when the controller’s function is strictly followed. For this reason, the DoFs mentioned in Section 2.4 must be implemented to slightly modify the proportional controller.

5.4. Implementation of the Degrees of Freedom

To correctly control every DoF, the PCR storage condition was divided into eight different states, which resulted in four cases that are explained in Table 2. Based on the present case, every DoF is either activated or deactivated to return the SoC to the value of SoCdes. The explicit strategy is to increase the PCR power provided by activating the DoFs overfulfillment and dead band. This strategy advanced the approach to the desired SoC (Cases 1 and 2) and/or delayed the demand progression of the PCR power by activating the DoF provision rate to keep the provided PCR power at the high level required to approach the SoCdes (Case 1) and to delay a further increase in the PCR power when this would result in a divergence from the SoCdes. A summary is given in Table 3. For a simple and efficient DoF implementation, every DoF provides its full potential when activated. The precise functionality of the DoFs is given in the sections below. The scheduled transactions that are part of the DoFs are controlled separately and explained further in Section 5.5.

5.4.1. Overfulfillment

When PCRs are activated, this DoF multiplies the output PPCR,c of the P-f controller shown in Figure 2 by the maximum factor permitted in [9], which results in a modified controller output, PPCR,o, given in Equation (3):
P PCR , o =   P PCR , c · 1.2

5.4.2. Dead Band

The PCR power that results from the P-f controller modified by all active DoFs is also provided in the permitted dead band within a frequency tolerance band of −10 mHz to +10 mHz when this DoF is activated.

5.4.3. Provision Rate

This DoF serves as a rate limiter for the output power of the P-f controller, and, when activated, it limits the provision gradient, PPCR, to a maximum value that depends on the prequalified PCR power, Ppq, and is given in [9] in accordance with Equation (4):
max   ( P PCR ) =   P pq 30   s

5.5. Implementation of State of Charge Regulations

To satisfy the regulations given in [7], scheduled transactions on the EPEX intraday market to regulate the battery SoC are required. A worst-case assumption is made for the normal frequency progression (Section 2.3) to determine the minimum and maximum SoC limits; these activate a corresponding intraday trade when violated. Because the time between the activation of a trade and the actual delivery is at least 30 min, the assumed worst-case scenario must be included accordingly. Therefore, the time period is divided into four areas:
  • Area 1 (00:00–00:15): frequency deviation + 100 mHz;
  • Area 2 (00:15–00:16): frequency deviation + 50 mHz;
  • Area 3 (00:16–00:20): frequency deviation + 200 mHz;
  • Area 4 (00:20–00:30): frequency deviation + 100 mHz.
Even though worse frequency deviations could occur in one direction, this segmentation is chosen to achieve a reasonable balance between safety and reality. The resulting maximum SoC deviation, ∆W, prior to the intervention of a scheduled transaction is calculated using the given P-f characteristic (Figure 2) in Equations (5)–(9):
Δ W 1 = 100   mHz 200   mHz · P pq · 15 60   h = 1 8   h · P pq
Δ W 2 = 50   mHz 200   mHz · P pq · 1 60   h = 1 240   h · P pq
Δ W 3 = 200   mHz 200   mHz · P pq · 5 60   h = 1 12   h · P pq
Δ W 4 = 100   mHz 200   mHz · P pq · 10 60   h = 1 12   h · P pq
Δ W = Δ W 1 + Δ W 2 + Δ W 3 + Δ W 4 = 0.3   h   ·   P pq
The resulting maximum and minimum SoC limits for activating an intraday trade, SoCmax,ID and SoCmin,ID, are calculated with respect to the permitted SoC limits calculated in Equations (1) and (2) and the maximum SoC deviation, ∆W, according to Equations (10) and (11):
S o C max , ID = S o C max Δ W E Batt = E Batt     0.8 ( 0.55 )   h · P pq E Batt
S o C min , ID = S o C min + Δ W E Batt = 0.8 ( 0.55 )   h · P pq E Batt
If the SoC exceeds the SoCmax,ID or falls below the SoCmin,ID, a balancing intraday trade must be activated to keep the SoC within the given boundaries. In accordance with [7], the minimum power, PID, to be traded amounts to 25% of the prequalified PCR power, Ppq, to counteract the maximum normal frequency deviation of 50 mHz.

5.6. Simulation Parameters

To identify the optimal set of parameters to control a PCR storage system, Matlab was used to simulate a variety of potential sets by applying a frequency curve for the whole year of 2012 in 1-s increments. The parameter sets investigated are given in Table 4.
For every possible combination of parameters, the PCR power, Ppq, was reduced from 0.9EBatt/h to 0.5EBatt/h until the SoC regulations given in [7] were kept or 0.5EBatt/h was reached.

5.7. Economic Evaluation Strategy

To properly perform an economic evaluation, the following assumptions were made for costs and energy prices for PCR power and battery-cell aging.

5.7.1. Pricing

The 2014 PCR pricing data published on the website, www.regelleistung.net, was evaluated to assume a suitable average price for PCR power. Frequency data from 2015 was not available in a satisfactory quality; hence, data from 2014 was used. The average electricity price in 2014 from the EPEX intraday stock was determined by evaluating the appropriate published data from the EPEX website. The necessary taxes when purchasing power on the EPEX were obtained from the published price sheet for 2015 from the Bavarian Distribution Grid Operator (DSO) KWH Netz GmbH [10].

5.7.2. Battery Degradation via Aging

To determine the possible yearly profit, we used a proprietary power-flow simulation model, implemented and ran in Matlab, to assess the technical and economic outcomes of the residential PV-battery system presented in [11].
The battery-aging model used in this simulation was specified using the following definitions and assumptions based on [12,13,14,15,16] and considering various in-house experiments undertaken on lithium-ion battery cells [17]. We assumed a capacity fade via both electro-chemical and mechanical mechanisms, which contrasted with the majority of the literature [18].
The end-of-life(time) (EoL) criterion is defined as the point when the battery state of health (SoH) falls below 80% of the nominal capacity of the battery, which is a commonly used estimate according to the U.S. Advanced Battery Consortium (USABC). Furthermore, we assumed an ideal superposition of calendric and cyclic aging. The capacity loss due to the two aging effects is summed up at any given moment and reduces the remaining capacity until the EoL is reached. The increase of the battery’s inner resistance and a decrease in its efficiency are neglected because until the EoL is reached, only insignificant changes can be observed in this parameter.
Calendric aging is dependent only on the time that has passed. Because of the low currents with charge values lower than 0.5C in this application, the battery temperature would not rise more than 2 K, assuming there is a climate-control system cooling the batteries. Our own research shows that for a 200 kWh, 250 kW prototype BESS under low c-rate conditions the battery cell produced heat does not induce enough heating to increase the aging phenomena.
Therefore, for the sake of simplicity, the temperature influence on calendric and cyclic aging was neglected. The dependence of the battery’s SoC on calendric aging was disregarded as well because the mean SoC stays in a constant range of approximately 60% over the entire duration of its operation.
The cyclic aging in this model depends only on the depth of cycle (DoC) of the applied load profile with alternating charging, discharging, and idle time segments. Here, we assumed that the SoC range in which the battery is cycled does not change the resulting capacity loss through cycling. We applied an approach that counts half cycles, which are determined using the following rules:
(1)
Sign change of load (from charge to discharge or vice versa);
(2)
Change from charge/discharge to idle mode or vice versa;
(3)
Relatively strong change of gradient during charge or discharge (i.e., ΔC rate = 0.6).
After one half-cycle is completed, the determined DoC was used to calculate the proportional capacity loss according to the Wöhler curve of the battery’s cycle lifetime. The Wöhler curve represents the achievable cycles until EoL for each DoC [19]. Typically, this curve has an exponential shape, which shows that a load profile of small cycles leads to a higher number of equivalent full cycles before the EoL is reached than a load profile with large cycles, as shown in [20]. In the aging model, the aging of one detected half-cycle corresponds to the inverse of the achievable cycles until the EoL of the specific DoC is reached. One half-cycle is assumed to result in half of the capacity loss associated with the corresponding full cycle with the same DoC.

5.7.3. Inability to Forecast the Market

An important issue concerning the PCR market in Germany is market pricing. Whereas other types of control reserve inherit power and energy prices, PCR only follows a power price, which is set weekly. Because bidding by the participants in this market is secret, there is no method to forecast market prices for the next week. The market behavior over the past three years has been so inconsistent that only rough estimates of future pricing are possible. Hence, we assumed a market price for bidding that guaranteed a 100% acceptance rate to calculate maximum profits. For a PCR BESS in Germany, it was possible to achieve a 100% acceptance rate in 2015. Nevertheless, the logic behind the bidding process is not public.

6. Results

In the following paragraphs, we present the results of a PCR BESS simulation performed using the method outlined above.

6.1. Degrees of Freedom Usage

To illustrate the impact of each DoF, one sample week with a fixed set of parameters (Table 5) was simulated with a Ppq corresponding to a C rate of 0.58 for every DoF. For this example, the 30-min criterion was taken into account.
The appropriate frequency curve for the considered week is shown in Figure 4.

6.1.1. State of Charge Behavior without Scheduled Transactions

Without using scheduled transactions as a DoF to control the battery SoC, a violation of the given SoC limits cannot be avoided, and the storage might reach its physical SoC limits (Figure 5). The effectiveness of the considered DoFs strongly differs, the superiority of the dead band provision (the green curve) becomes obvious, and adjusting the provision rate has almost no influence on the battery SoC.

6.1.2. State of Charge Behavior with Scheduled Transactions

When using only scheduled transactions to control the battery SoC, the given limits were maintained, and no further intervention was necessary (Figure 6).
Even though the additional application of the remaining DoFs is not necessary, it can reduce the necessary trading volume and, therefore, the running expenses of the system. Furthermore, critical frequency progressions can be attenuated, and slightly higher values for Ppq are possible (Figure 7).

6.2. Overall Parametrization

Based on the taxes and prices given in Table 6, the annual revenue was calculated for every possible combination of the parameters given in Table 4.
The resulting ideal parameters that yielded the maximum overall revenue are shown in Table 7.
The ideal set of evaluated parameters was additionally validated using the grid frequencies from 2013 and 2014. The assumed simulation parameters are shown in Table 8, where PID,buy is rounded down and PID,sell is rounded up to an integer multiple of a hundred to meet the regulations for scheduled transactions on the EPEX and minimize their costs.
Figure 8 shows the SoC curves of the simulated battery storage systems over a full year for the grid frequencies from 2012, 2013 and 2014. The SoC limits were included, and the 30-min and 15-min criteria were considered. In every case, at least one SoC exceeds the limit values when the frequency departed from the normal progression given in Section 2.3. This SoC behavior is tolerated in accordance with [7], and the suggested parametrization of the PCR battery storage is, therefore, fit for use.
The characteristics of the SoC curves can be seen in more detail in Figure 9, where the probability distribution of the SoC is plotted for the two storage sizes according to the 15-min and 30-min criteria (1220 kWh, 1775 kWh) over one year of operation using the 2012 frequency data. The SoC shows an almost normal distribution at approximately 50% and remains in the region between 35% SoC and 65% SoC using the DoFs and scheduled transactions at the EPEX. The SoC probability distribution for the 1220 kWh storage is located approximately four SoC percentage points to the left of that for the larger storage size because of the larger possible operation range that assumes the 15-min criterion.
For the same scenario, Figure 9 shows the probability distribution of the C rates. Here, the shapes do not represent a normal distribution. Inside the dead band defined by the C rates (−0.05–+0.05C), this DoF is used only to charge the storage systems; this results in a gap in the region of the discharge direction in the dead band. Furthermore, in this probability distribution, the scheduled transactions at the EPEX can be seen as peaks for charge and discharge transactions with their constant power values, as shown in Table 7. It can be observed that the two storage sizes are operated mainly at C rates below 0.2C, resulting in a small aging impact, which is evaluated in Section 7.2.
In Figure 10 and Figure 11, a closer look at the operating characteristics of the various storage sizes is possible. By detecting the half-cycles of the SoC curve, the cycle depths and C rates for each cycle were registered and are shown in the probability distribution data for one year’s operation using the 2012 frequency data. In the half-cycle, counting cycles with DoC < 1% are neglected; this results in the gap in the middle of the plot. Most of the cycles appear with |DoCs| < 5% and |C rates| < 0.2. In contrast, larger cycle depths appear with |C rates| > 0.2.

7. Economic Impact

7.1. Pricing Impact

The revenues from operating a PCR storage system originate from the PCR power provided and its specific traded price and the amount of energy traded on the EPEX intraday market results in adjustments to the battery SoC (Section 2.2). Using the ideal parameterization shown in Table 7 and assuming the pricing in Table 1 and Table 6, the following yearly revenues and expenses based on the provided PCR power were obtained for operating the storage system and are given in Table 9.
To determine the possible profit from PCR storage, investment costs must be taken into account. Therefore, the battery capacity necessary for providing 1 kW of PCR power must also be considered in the possible revenues given in Table 9. This capacity is calculated by dividing EBatt by Ppq, which is given in Table 7. The resulting possible yearly revenues based on the available battery capacity are 95 €/kWh for the 30-min criterion and 130 €/kWh for the 15-min criterion.
Prior to assuming reasonable battery storage investment costs and calculating the actual possible profits from providing PCR power, an aging simulation was necessary to determine the yearly capacity degradation and battery lifetime because profitability mainly depends on the market evolution and battery lifetime.

7.2. Aging Impact

To reduce any potential precision loss for the final calculations and results, battery aging was considered as described in Section 5.7.2. Therefore, the aging model estimated the influence of the simulated capacity of the BESS on the overall performance. Based on the cycle-counting approaches found in [11], we identified five different parameter sets, defined as scenarios, for the aging model:
Scenario 1—medium agingLiterature-dependent setup with a degradation to 80% SoH after 5000 cycles and a calendric lifetime of 15 years.
Scenario 2—weak agingA weak aging approach where 80% SoH is reached after 6000 full cycles with a calendric lifetime of 15 years.
Scenario 3—strong agingA strong aging approach where 80% SoH is reached after 3000 full cycles with a calendric lifetime of 12.5 years.
Scenario 4—optimistic agingAn optimistic aging approach where 80% SoH is reached after 14,000 full cycles with a calendric lifetime of 20 years.
Scenario 5—oversizingA different optimistic approach where parameter setup 1 is facilitated by oversizing the battery by a factor of 1.5, resulting in a power rating of 1.66 MW and an energy content of 2.62 MWh while the offered PCR power remains the same.
Table 10 gives comprehensive information on the variations in our simulation setup and our results in terms of the criteria, BESS power, BESS energy, the frequency data year used, and aging models. For easier access to the information, we added capacity degradation resulting from calendric and cyclic aging to the table, and the aging scenarios are given in the text immediately above.
The aging data given in Table 10 represents the total loss in capacity from the initial capacity at the simulation start. From our data, we concluded that BESS sizing has a strong influence on the aging effects. The literatures [11,15,16] show that BESS aging is derived from several factors, e.g., the DoC, mean value of the SoC, and the C rate, among others. 
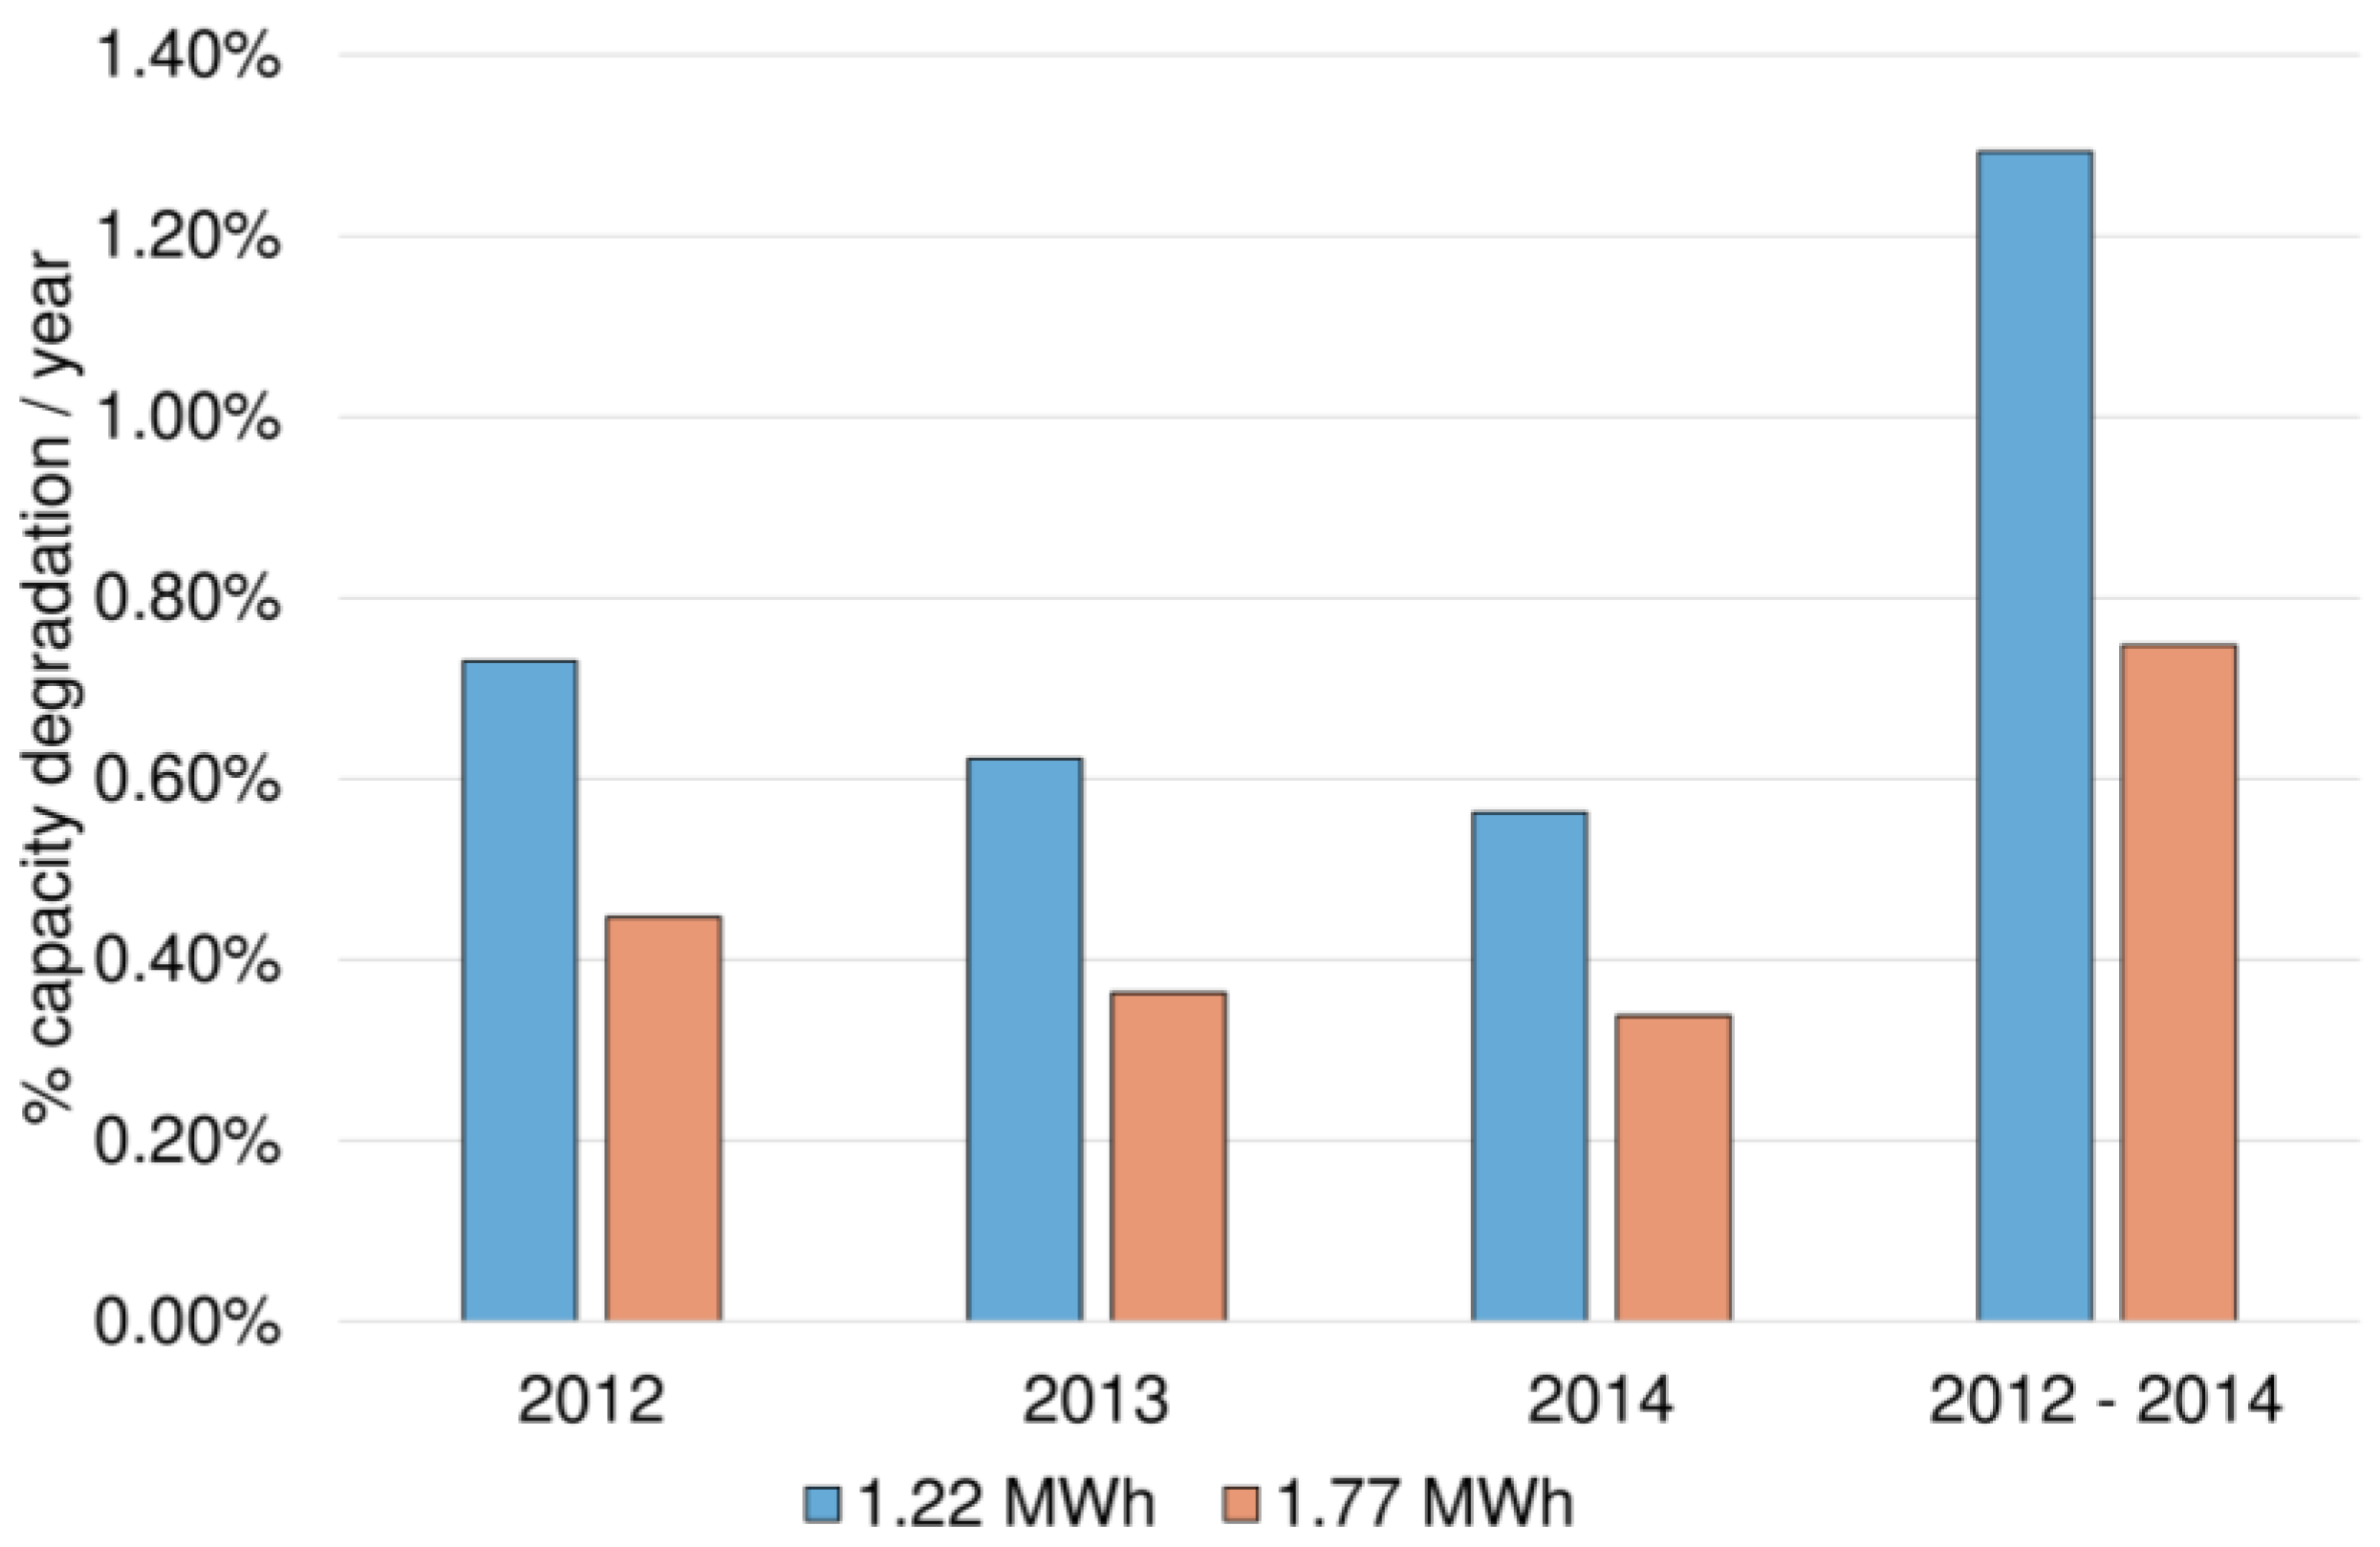
Figure 12 depicts the BESS size and total aging of the BESS drawn from data from the years 2012 to 2014 and a three-year simulation using a mean value for all aging scenarios. Because of the larger BESS capacity, the DoCs decrease, resulting in less capacity fading and smaller absolute values for the C rates. Both the yearly and three-year simulations show the same behavior.
When the aging behavior is separated into calendric and cyclic aging effects, another result is visible. Calendric aging occurs at any time, regardless of the C rate, the DoC, or other factors. However, cyclic aging depends on the DoC, the initial mean SoC of a cycle, and the C rate, among other factors. 
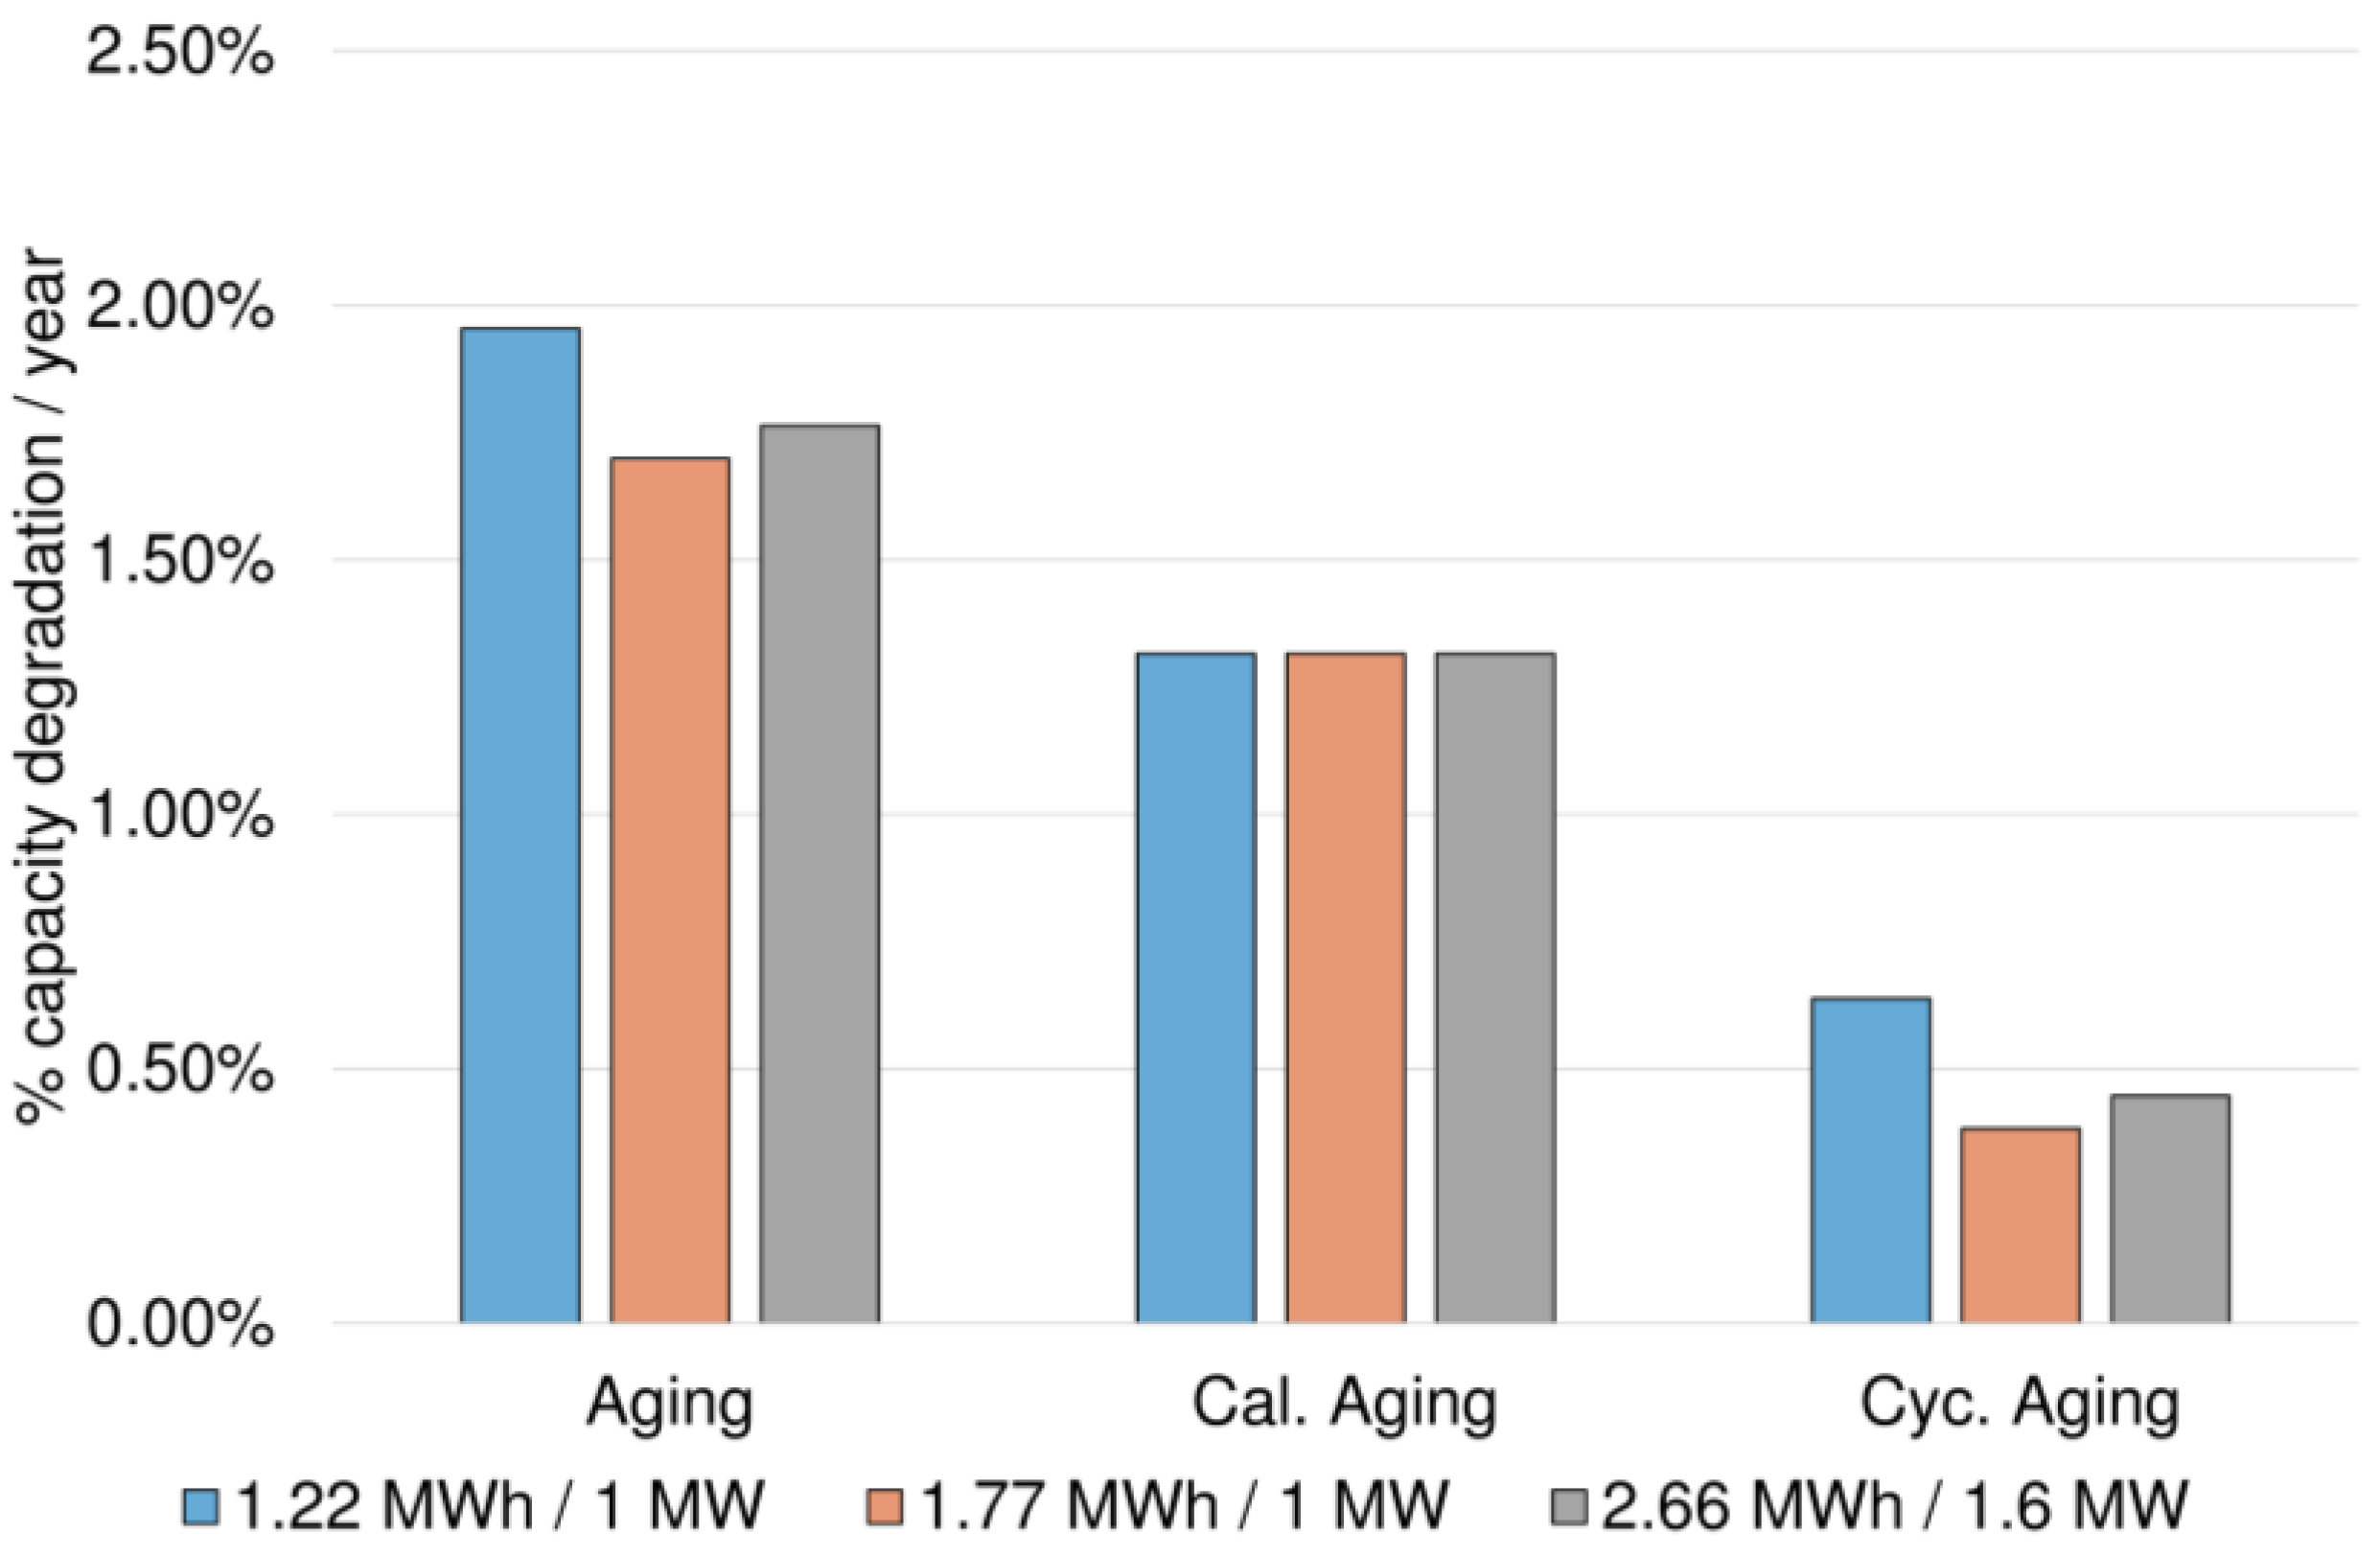
Figure 13 depicts BESS setups with different power-to-energy (P/E) ratios and the resulting aging appearance. Calendric aging is similar in all three setups.
Whereas calendric aging shows no influence on the P/E ratio, cyclic aging has a different aging behavior. As described above, deeper cycles result in more extensive aging [11,15]. Hence, for the same power (1 MW), a larger BESS (1.77 MWh) has a decrease in aging compared to a smaller BESS (1.22 MWh) when the same load is applied. However, this relationship does not hold when the BESS power is adjusted non-linearly (1.6 MW) with the BESS capacity (2.66 MWh). An increase in aging is observed, and it is related to deeper cycles and higher C rates than the other setups.
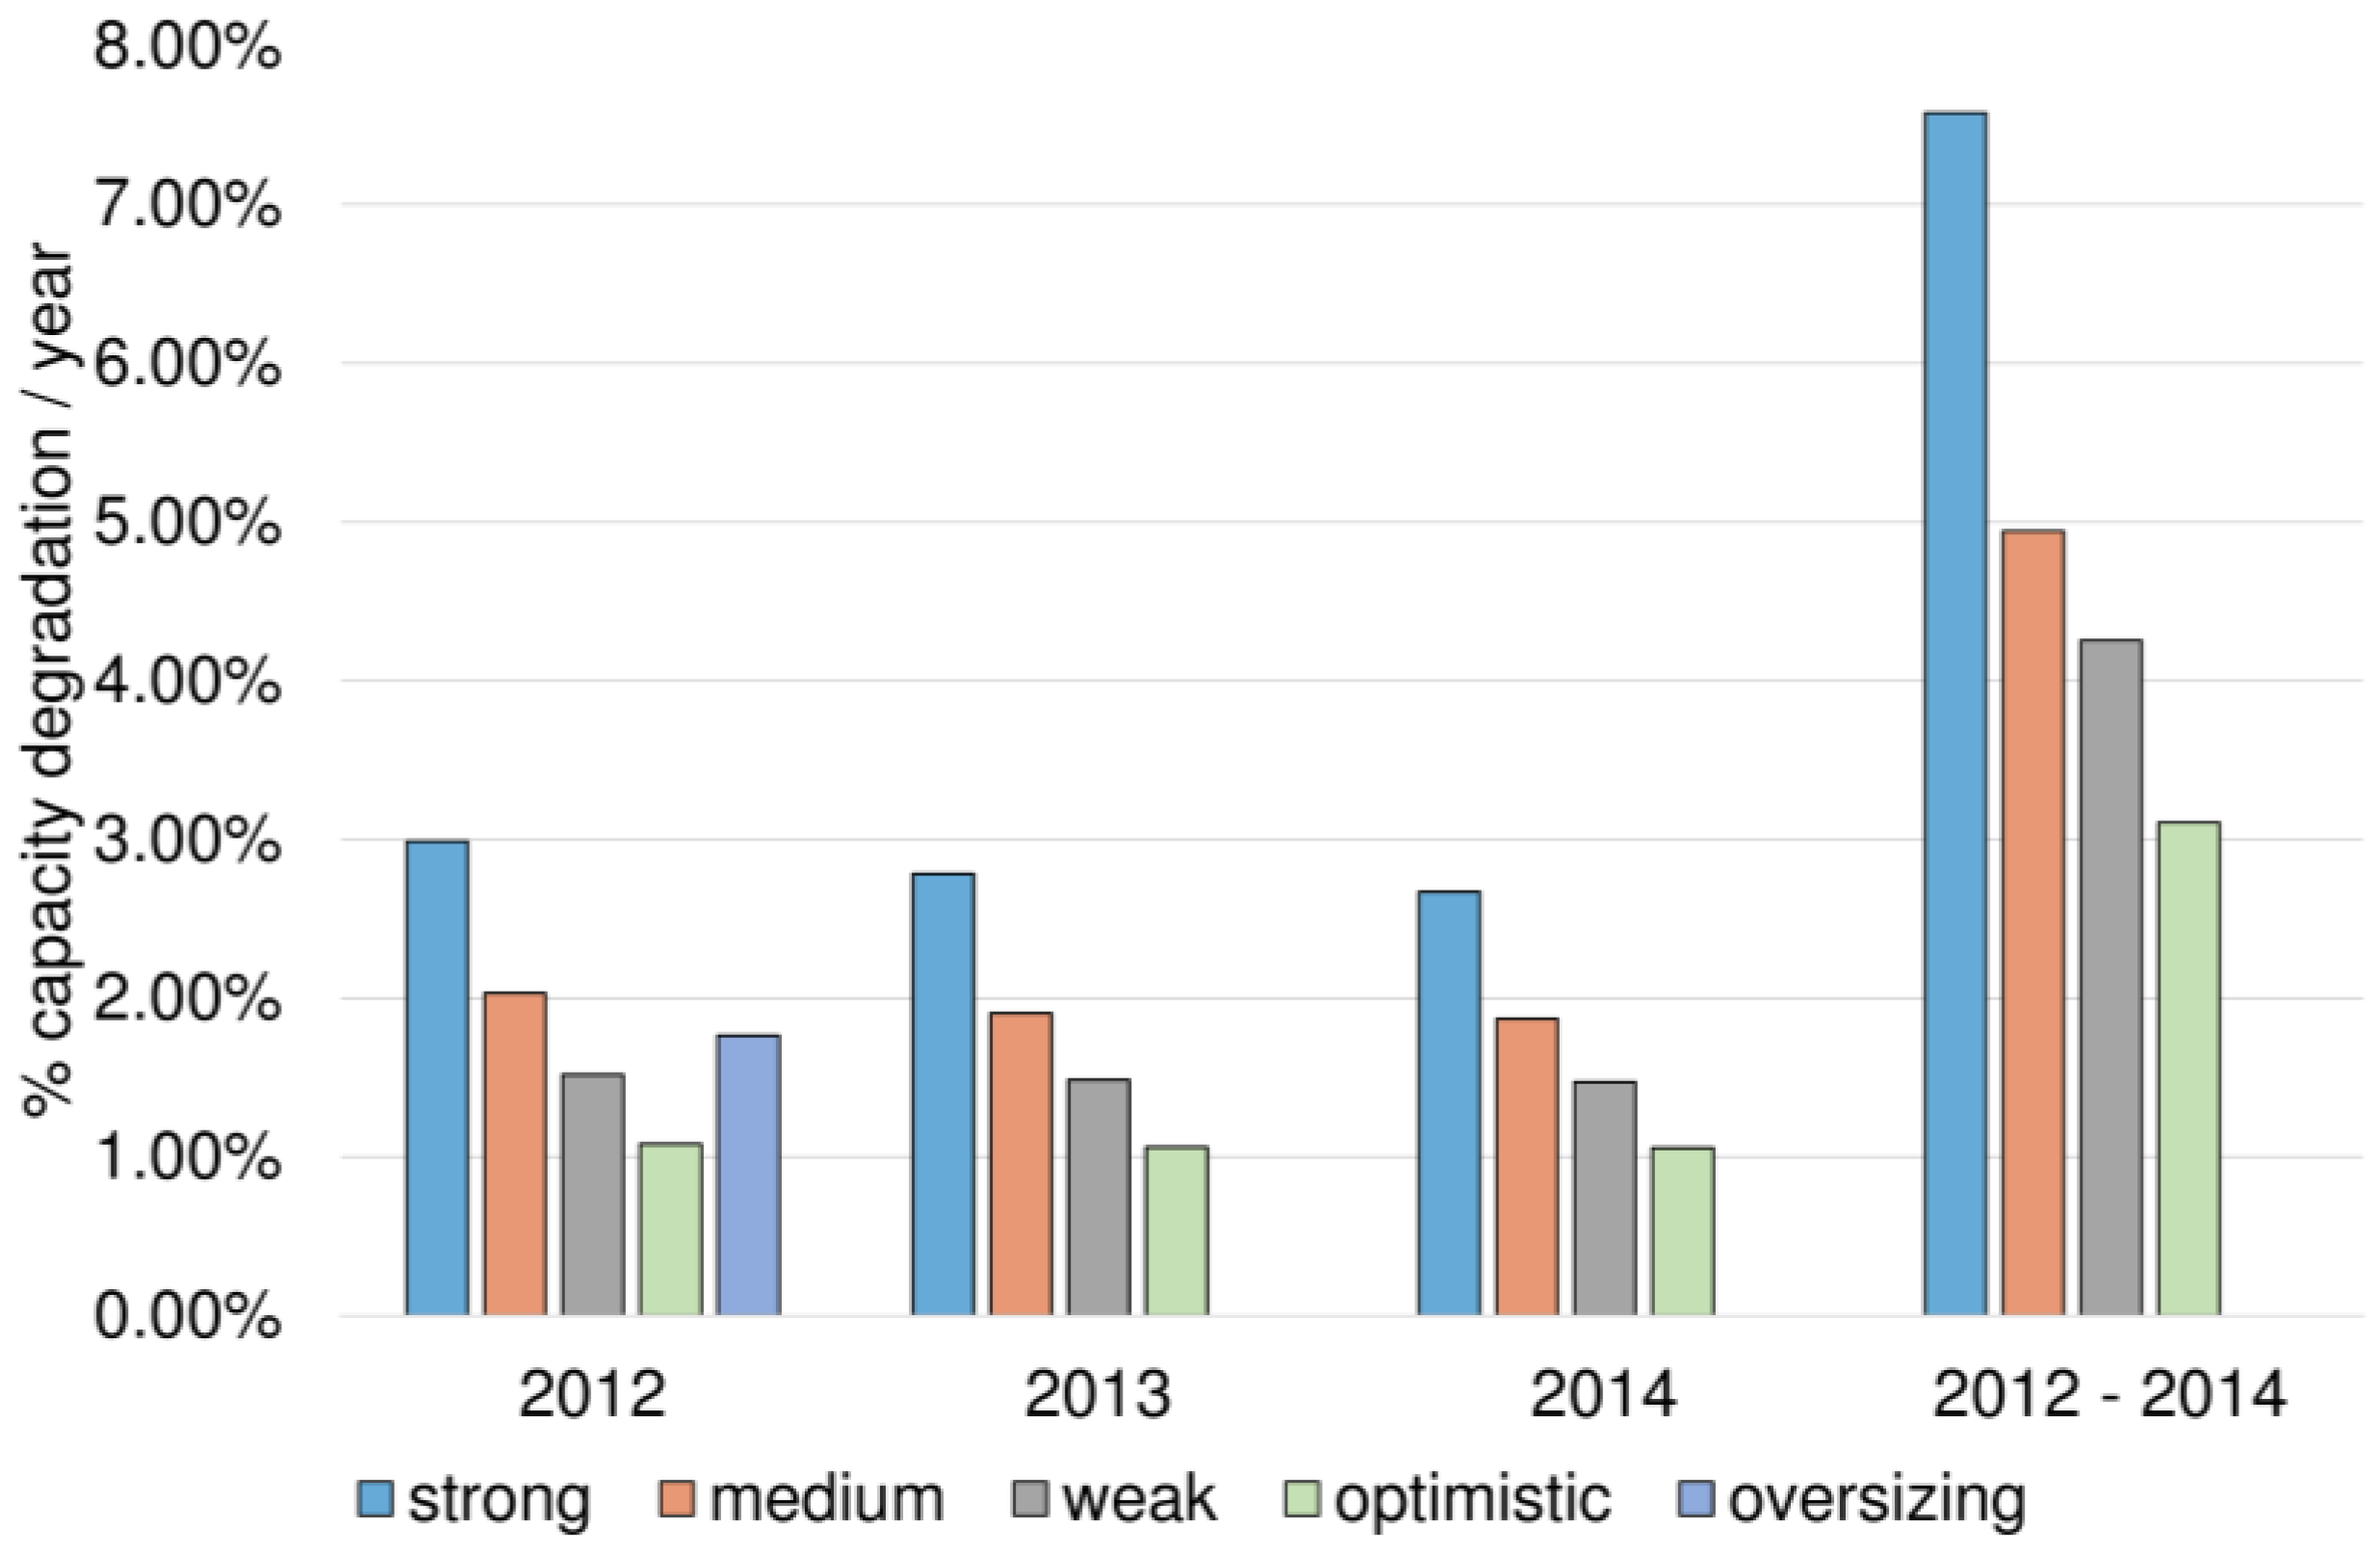
Comparing the overall results in terms of the scenario definition, a few specific tendencies were observed. First, an increase in the cyclic or calendric lifetime leads to a decrease in aging. Second, the cyclic life and calendric lifetime are not linearly correlated to the BESS aging. Figure 14 shows that for the 2012 data, heavy-duty aging (3000 cycles to EoL) results in a total aging of 3%. However, our optimistic scenario (14,000 cycles to EoL) results in only 1% aging. This difference is explained by the differences in cycle and calendric aging. When the cycle life is very weak, each equivalent full cycle has a significant impact on the overall aging processes. However, a high cycle life results in a decrease in cyclic aging, and only calendric aging is observed.
In addition, Figure 13 shows the effects of oversizing a storage system. In 2012, simulations were performed with a system oversized by a factor of 1.6, applying the same load used for all other systems. A decrease in aging from 3% to 1.8% was observed. Since the overall P/E ratio changed, the aging decrease does not correlate with only the BESS capacity. Therefore, an oversized system is not, in general, suitable for increasing the lifetime. A better cell quality, which is more expensive but has a higher lifetime expectancy, solves this problem.
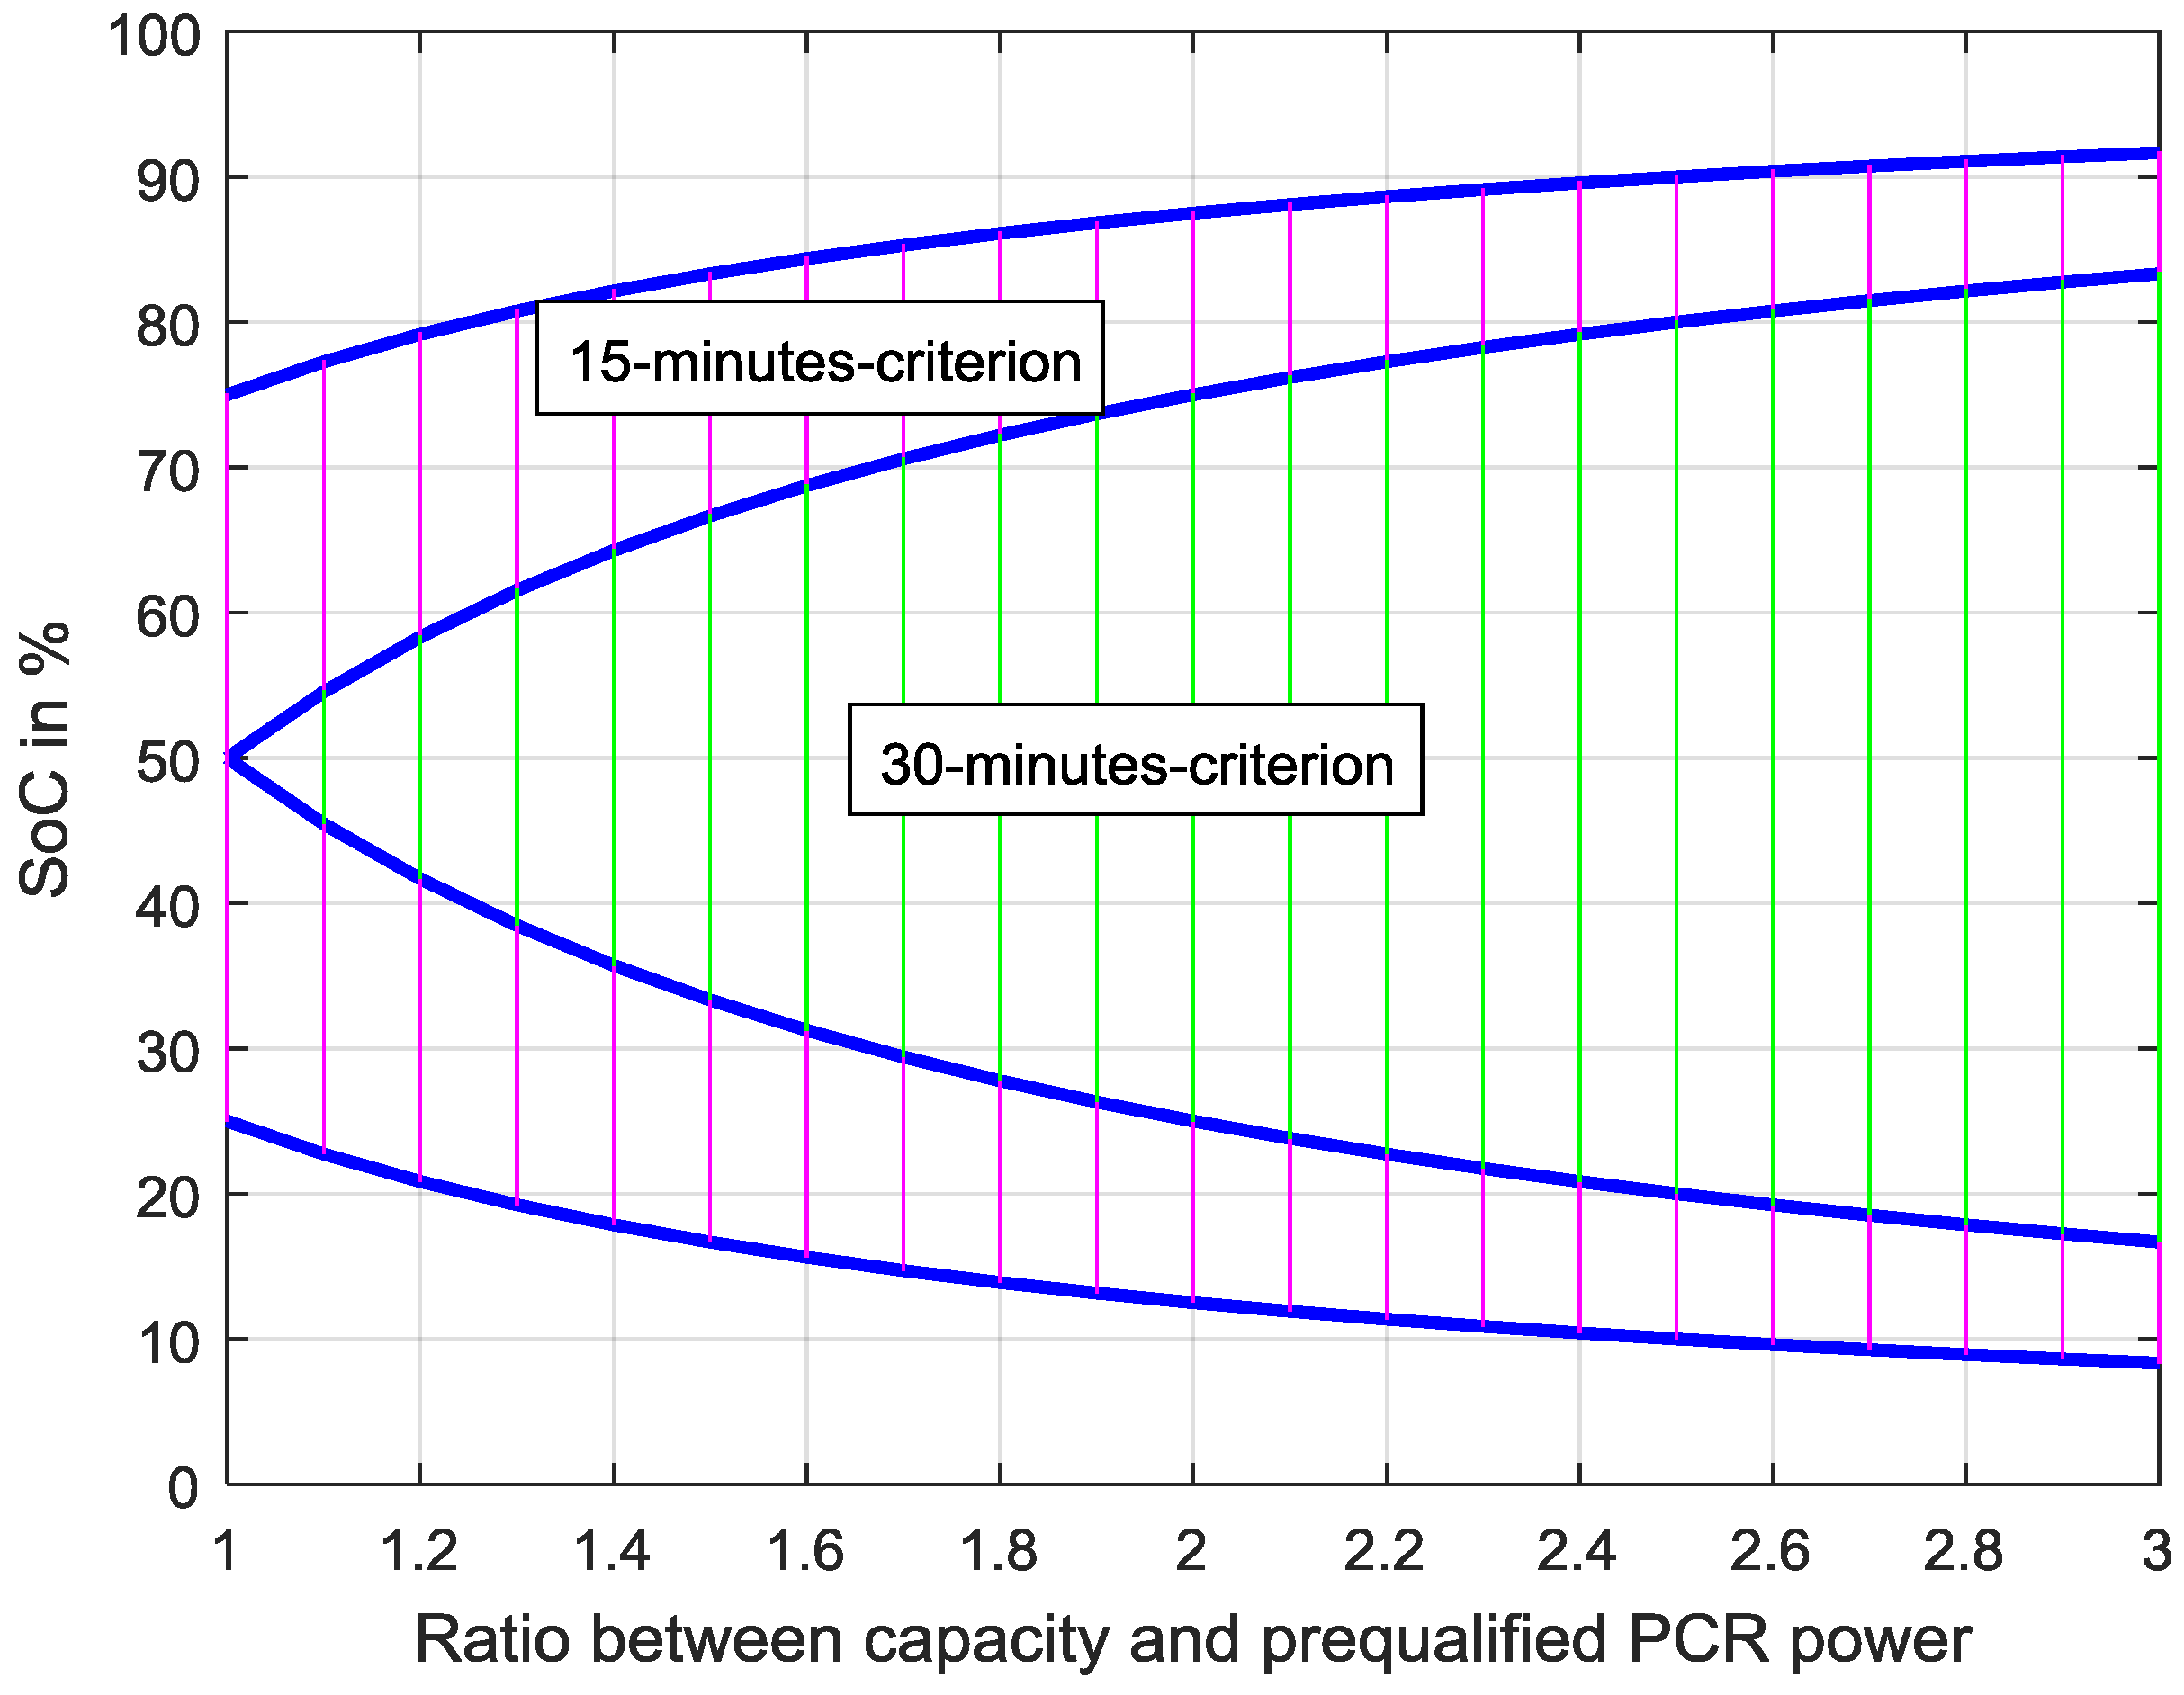
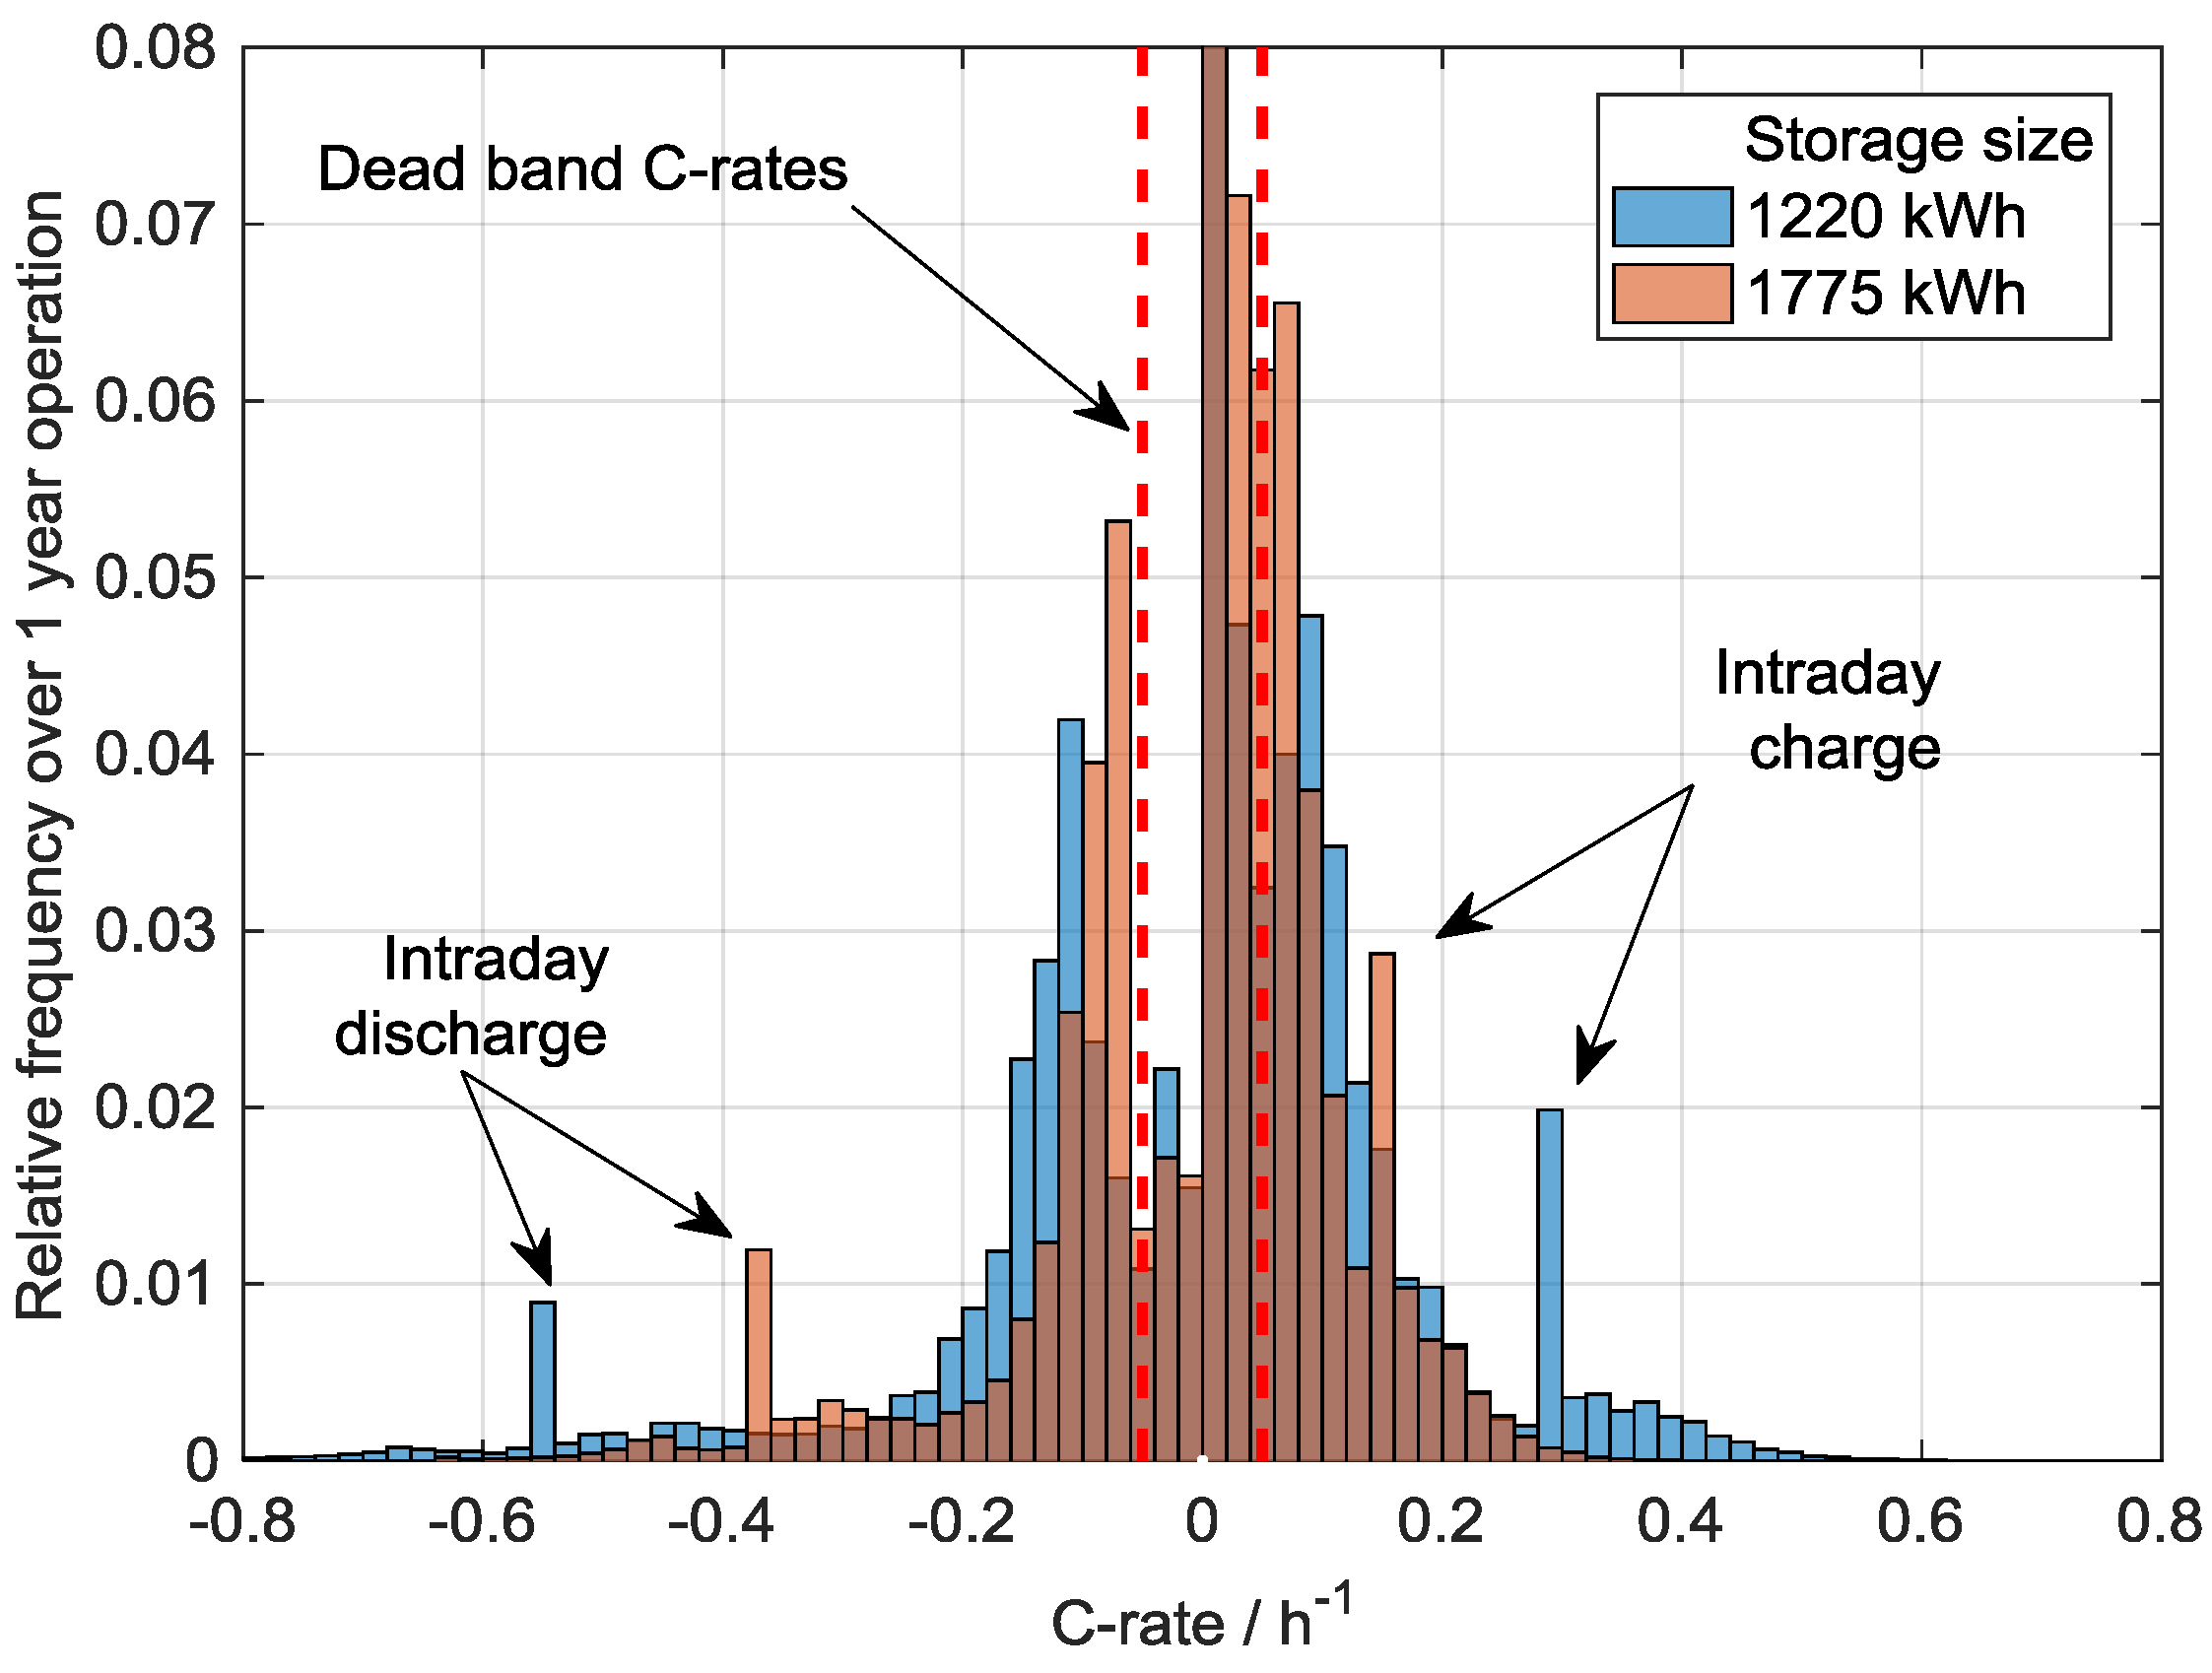
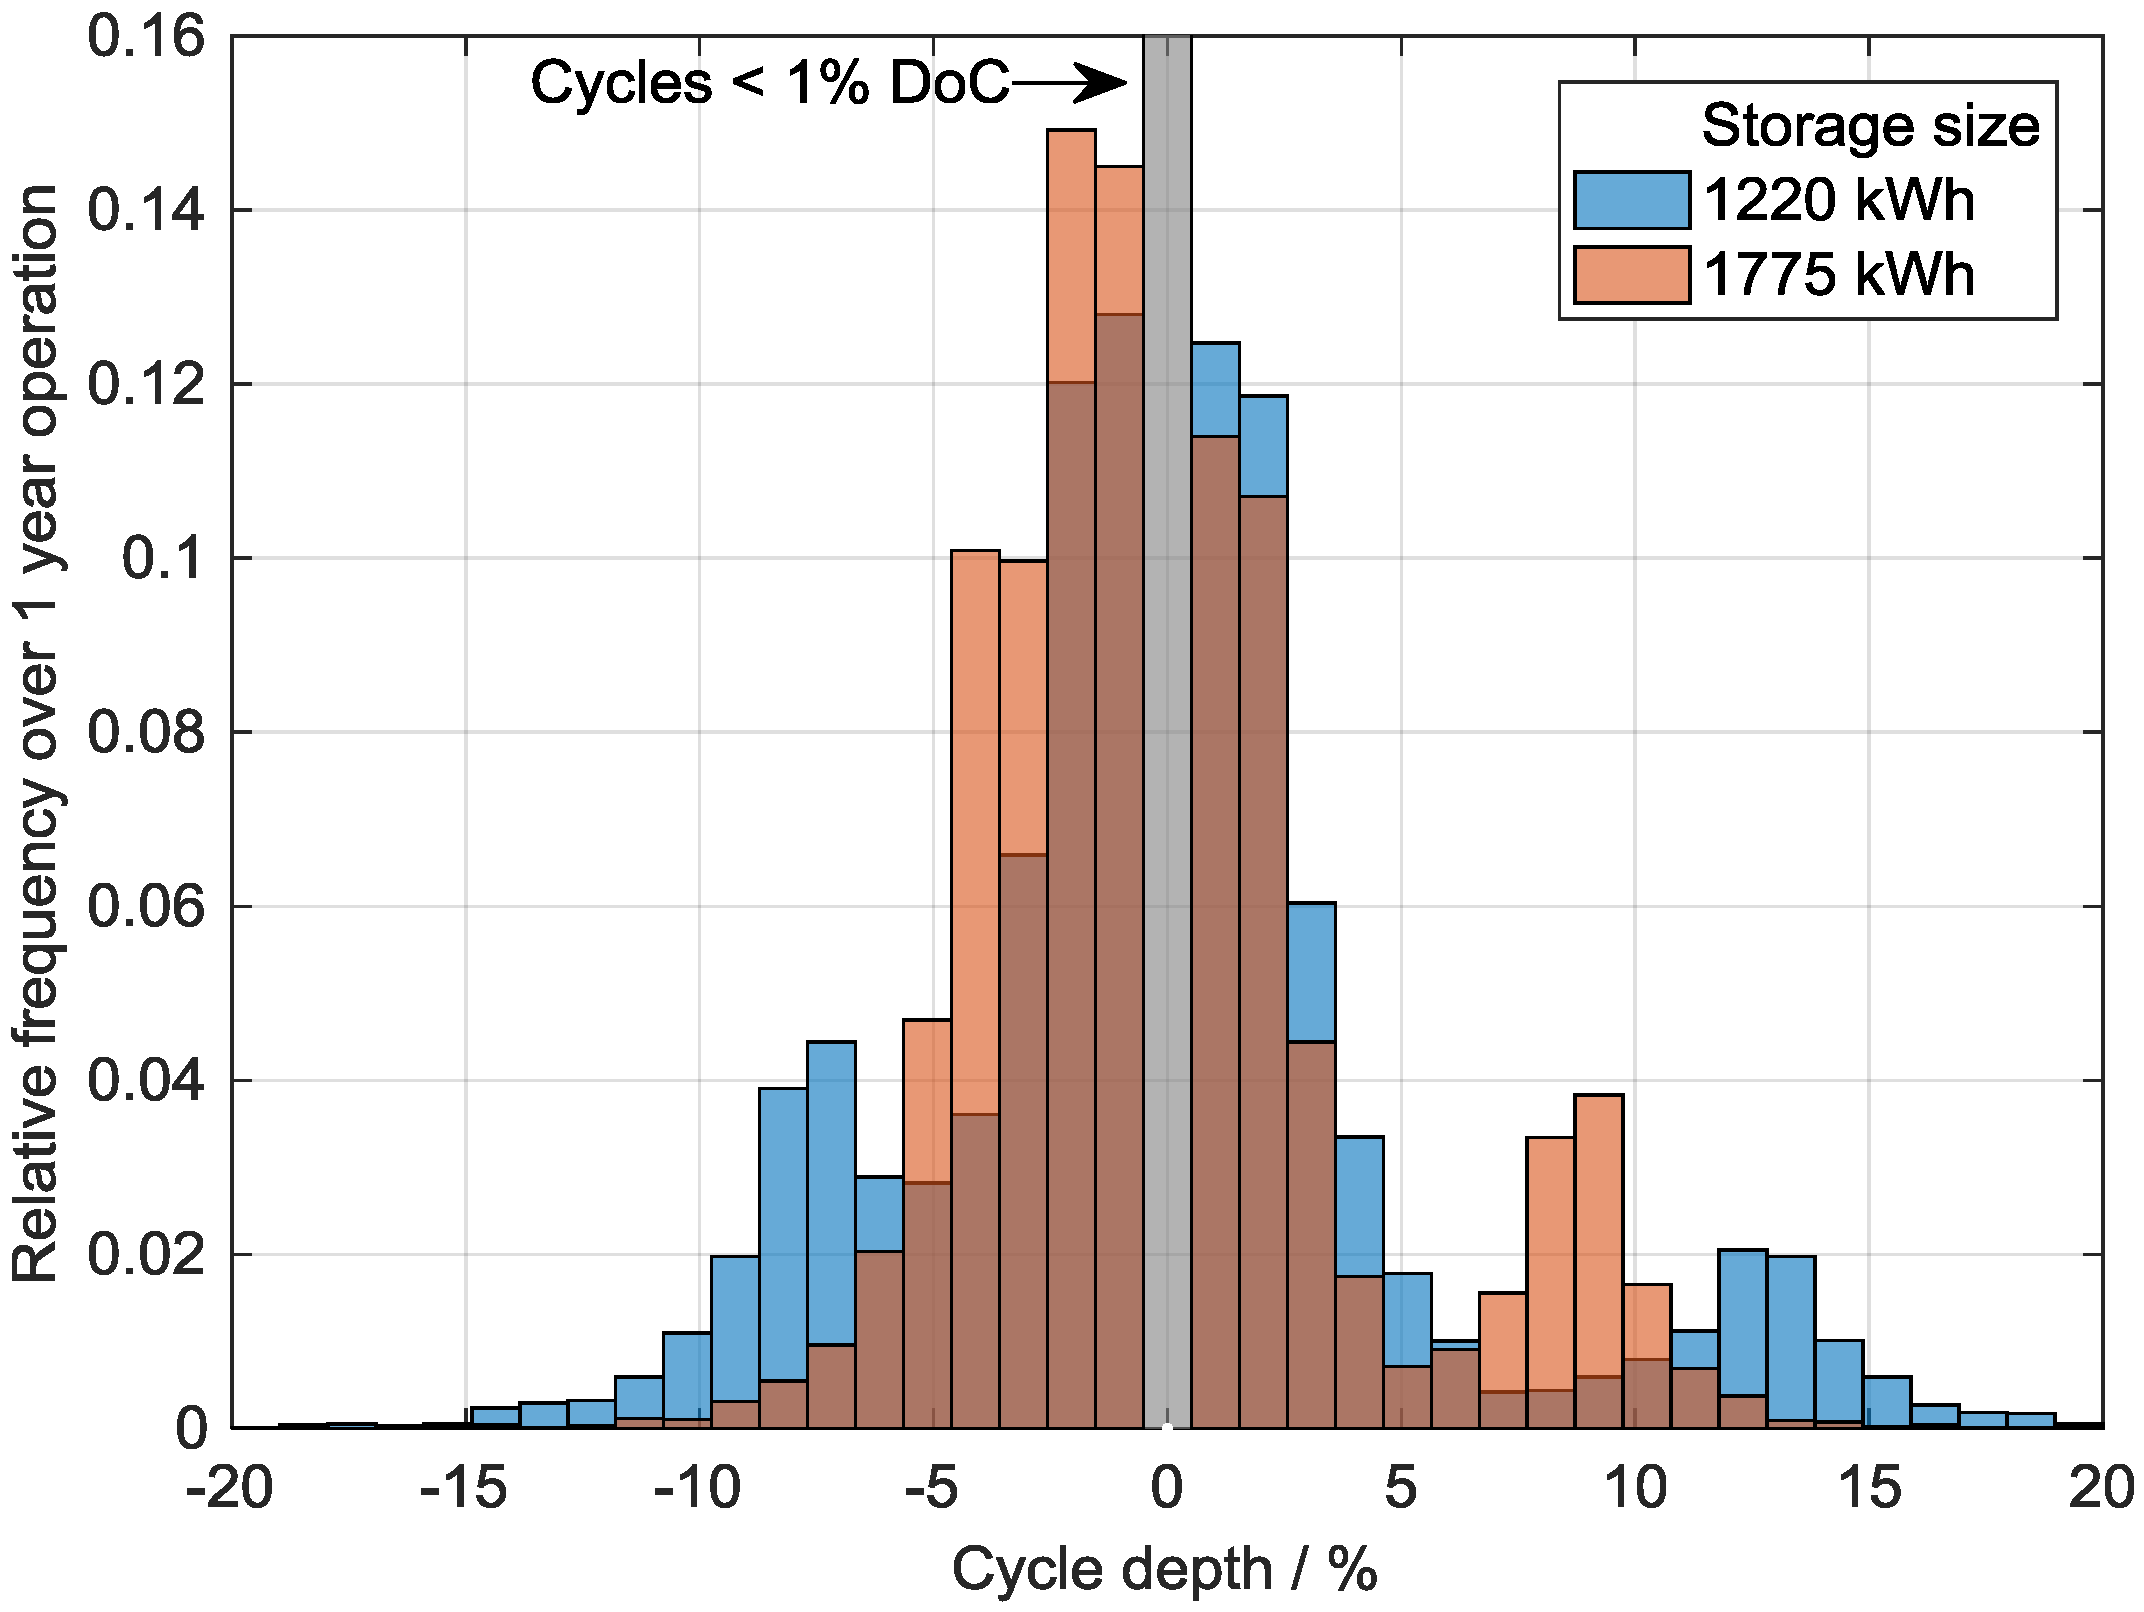
Figure 15 and 
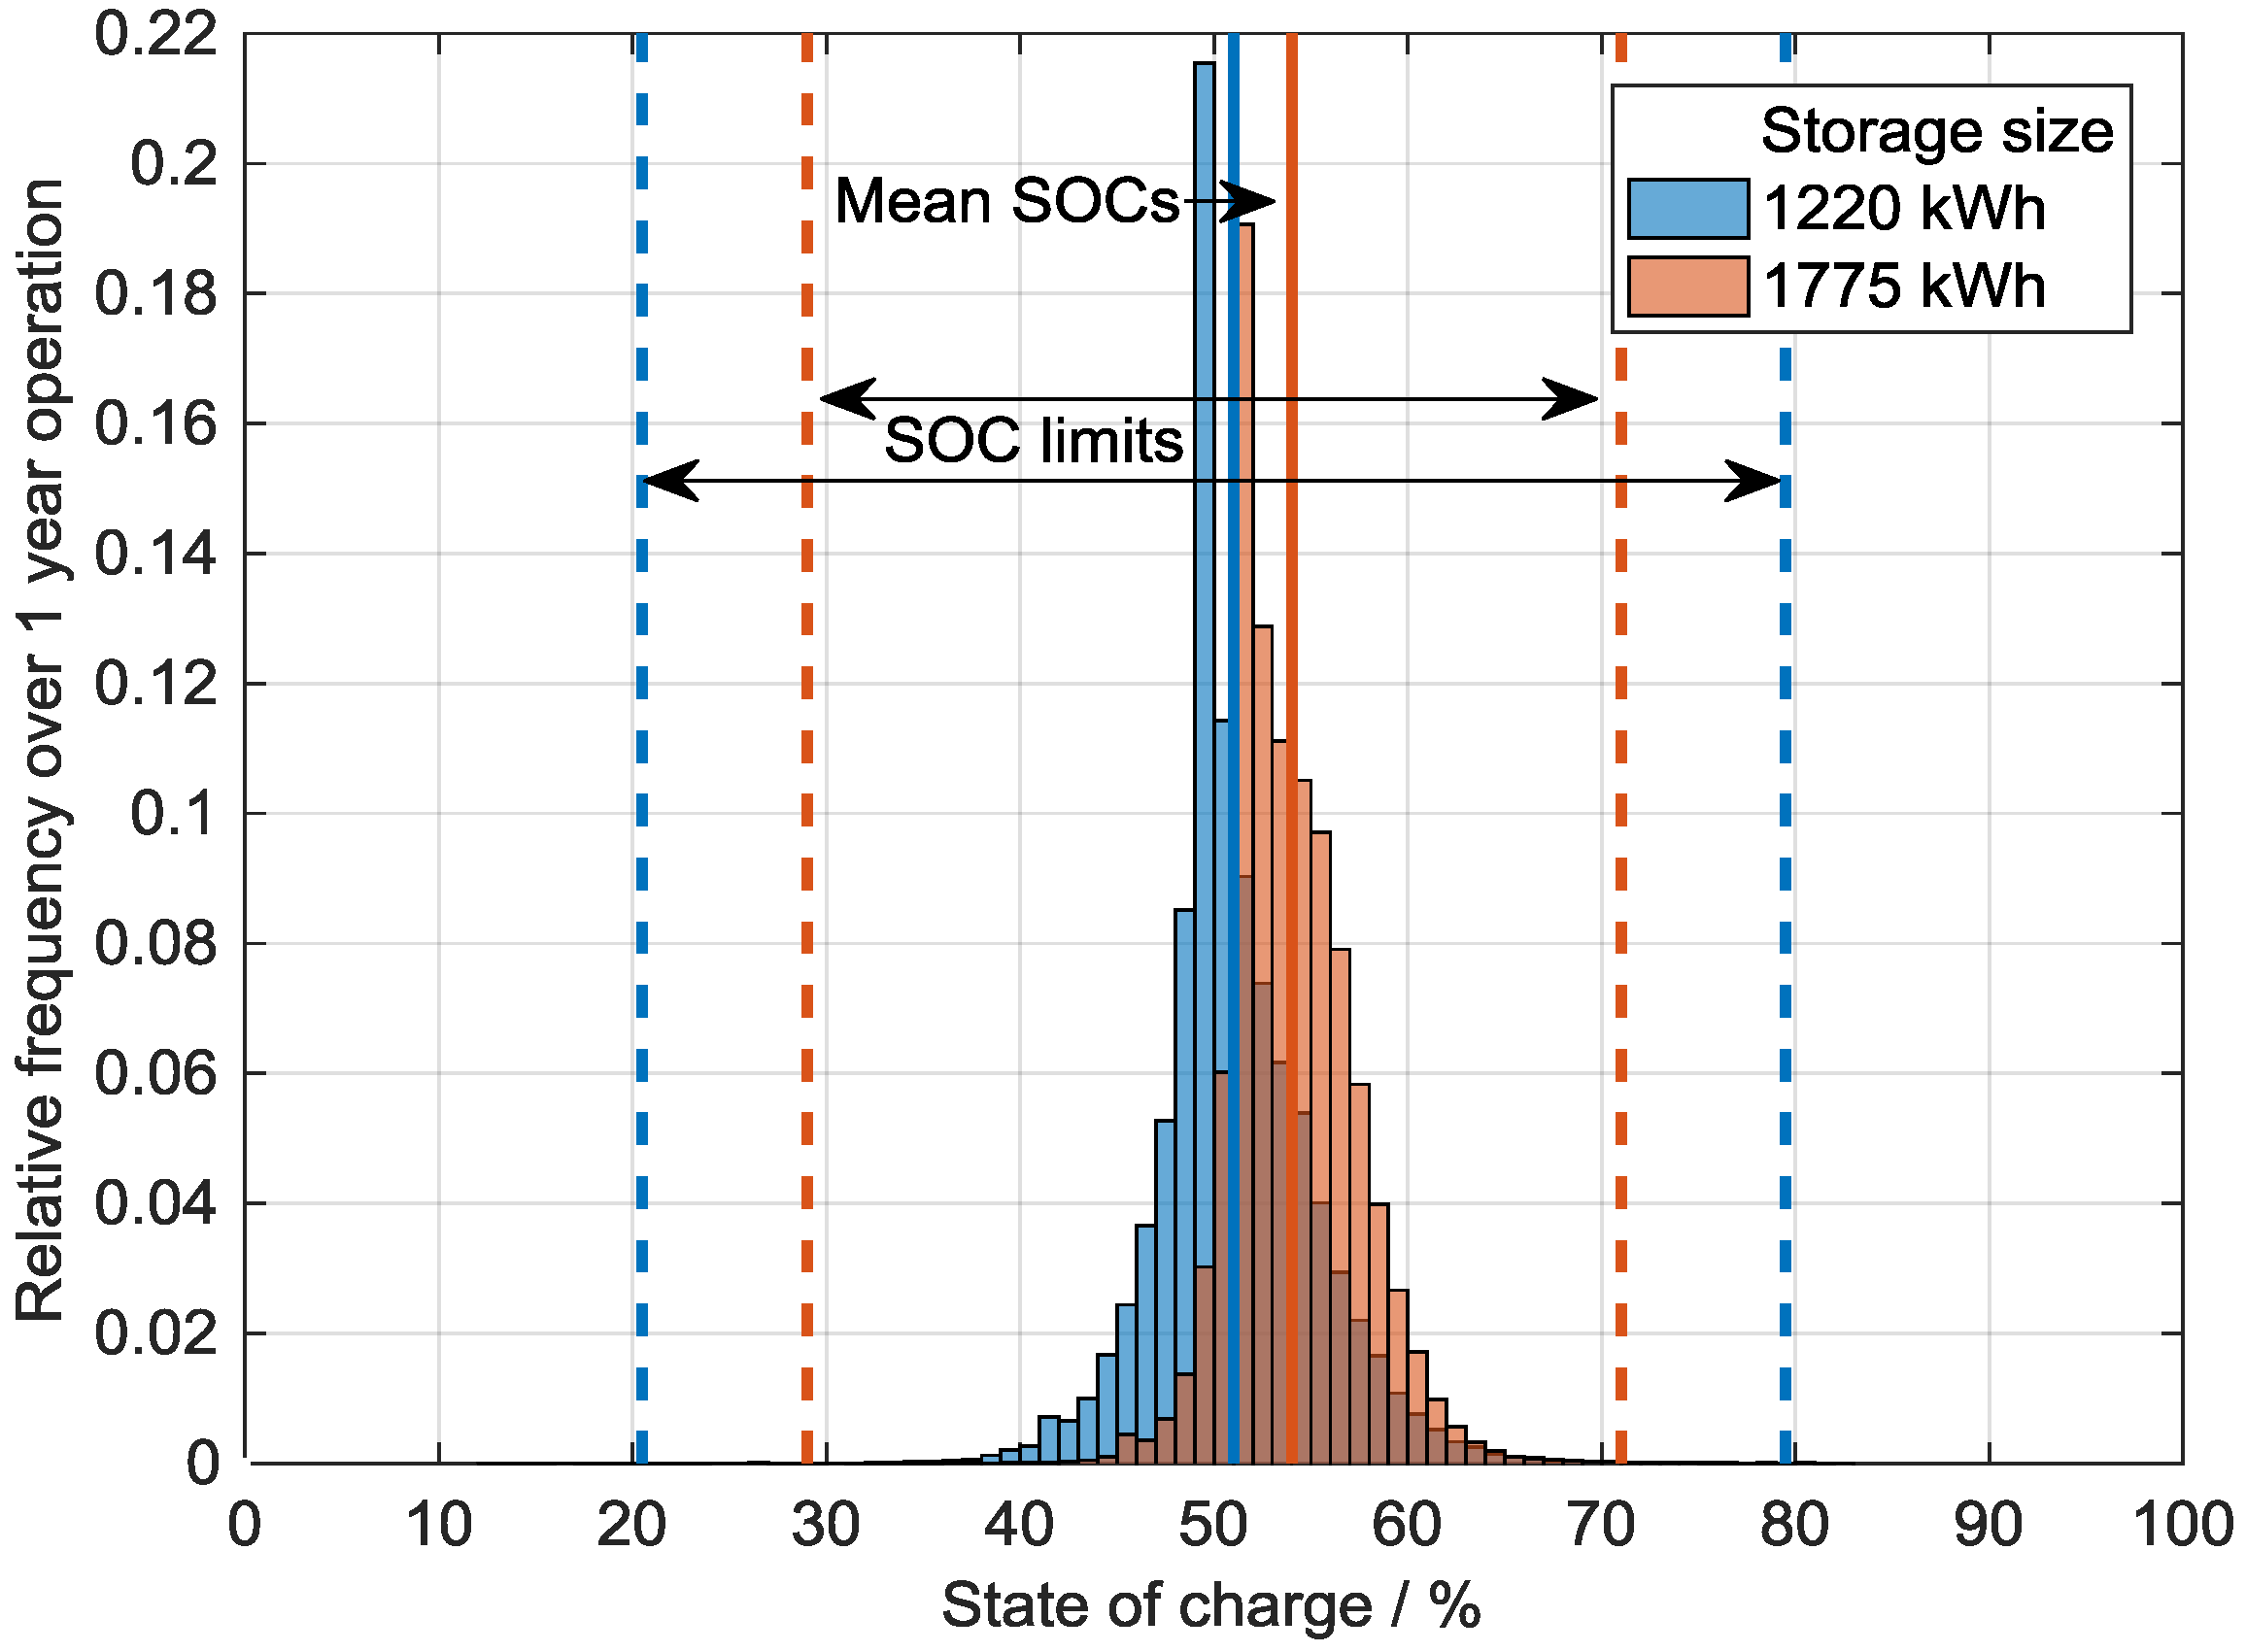
Figure 16 allow a closer look at the aging characteristics for operation of the two storage system sizes, 1220 kWh and 1775 kWh, according to the 15-min and 30-min criteria. In 
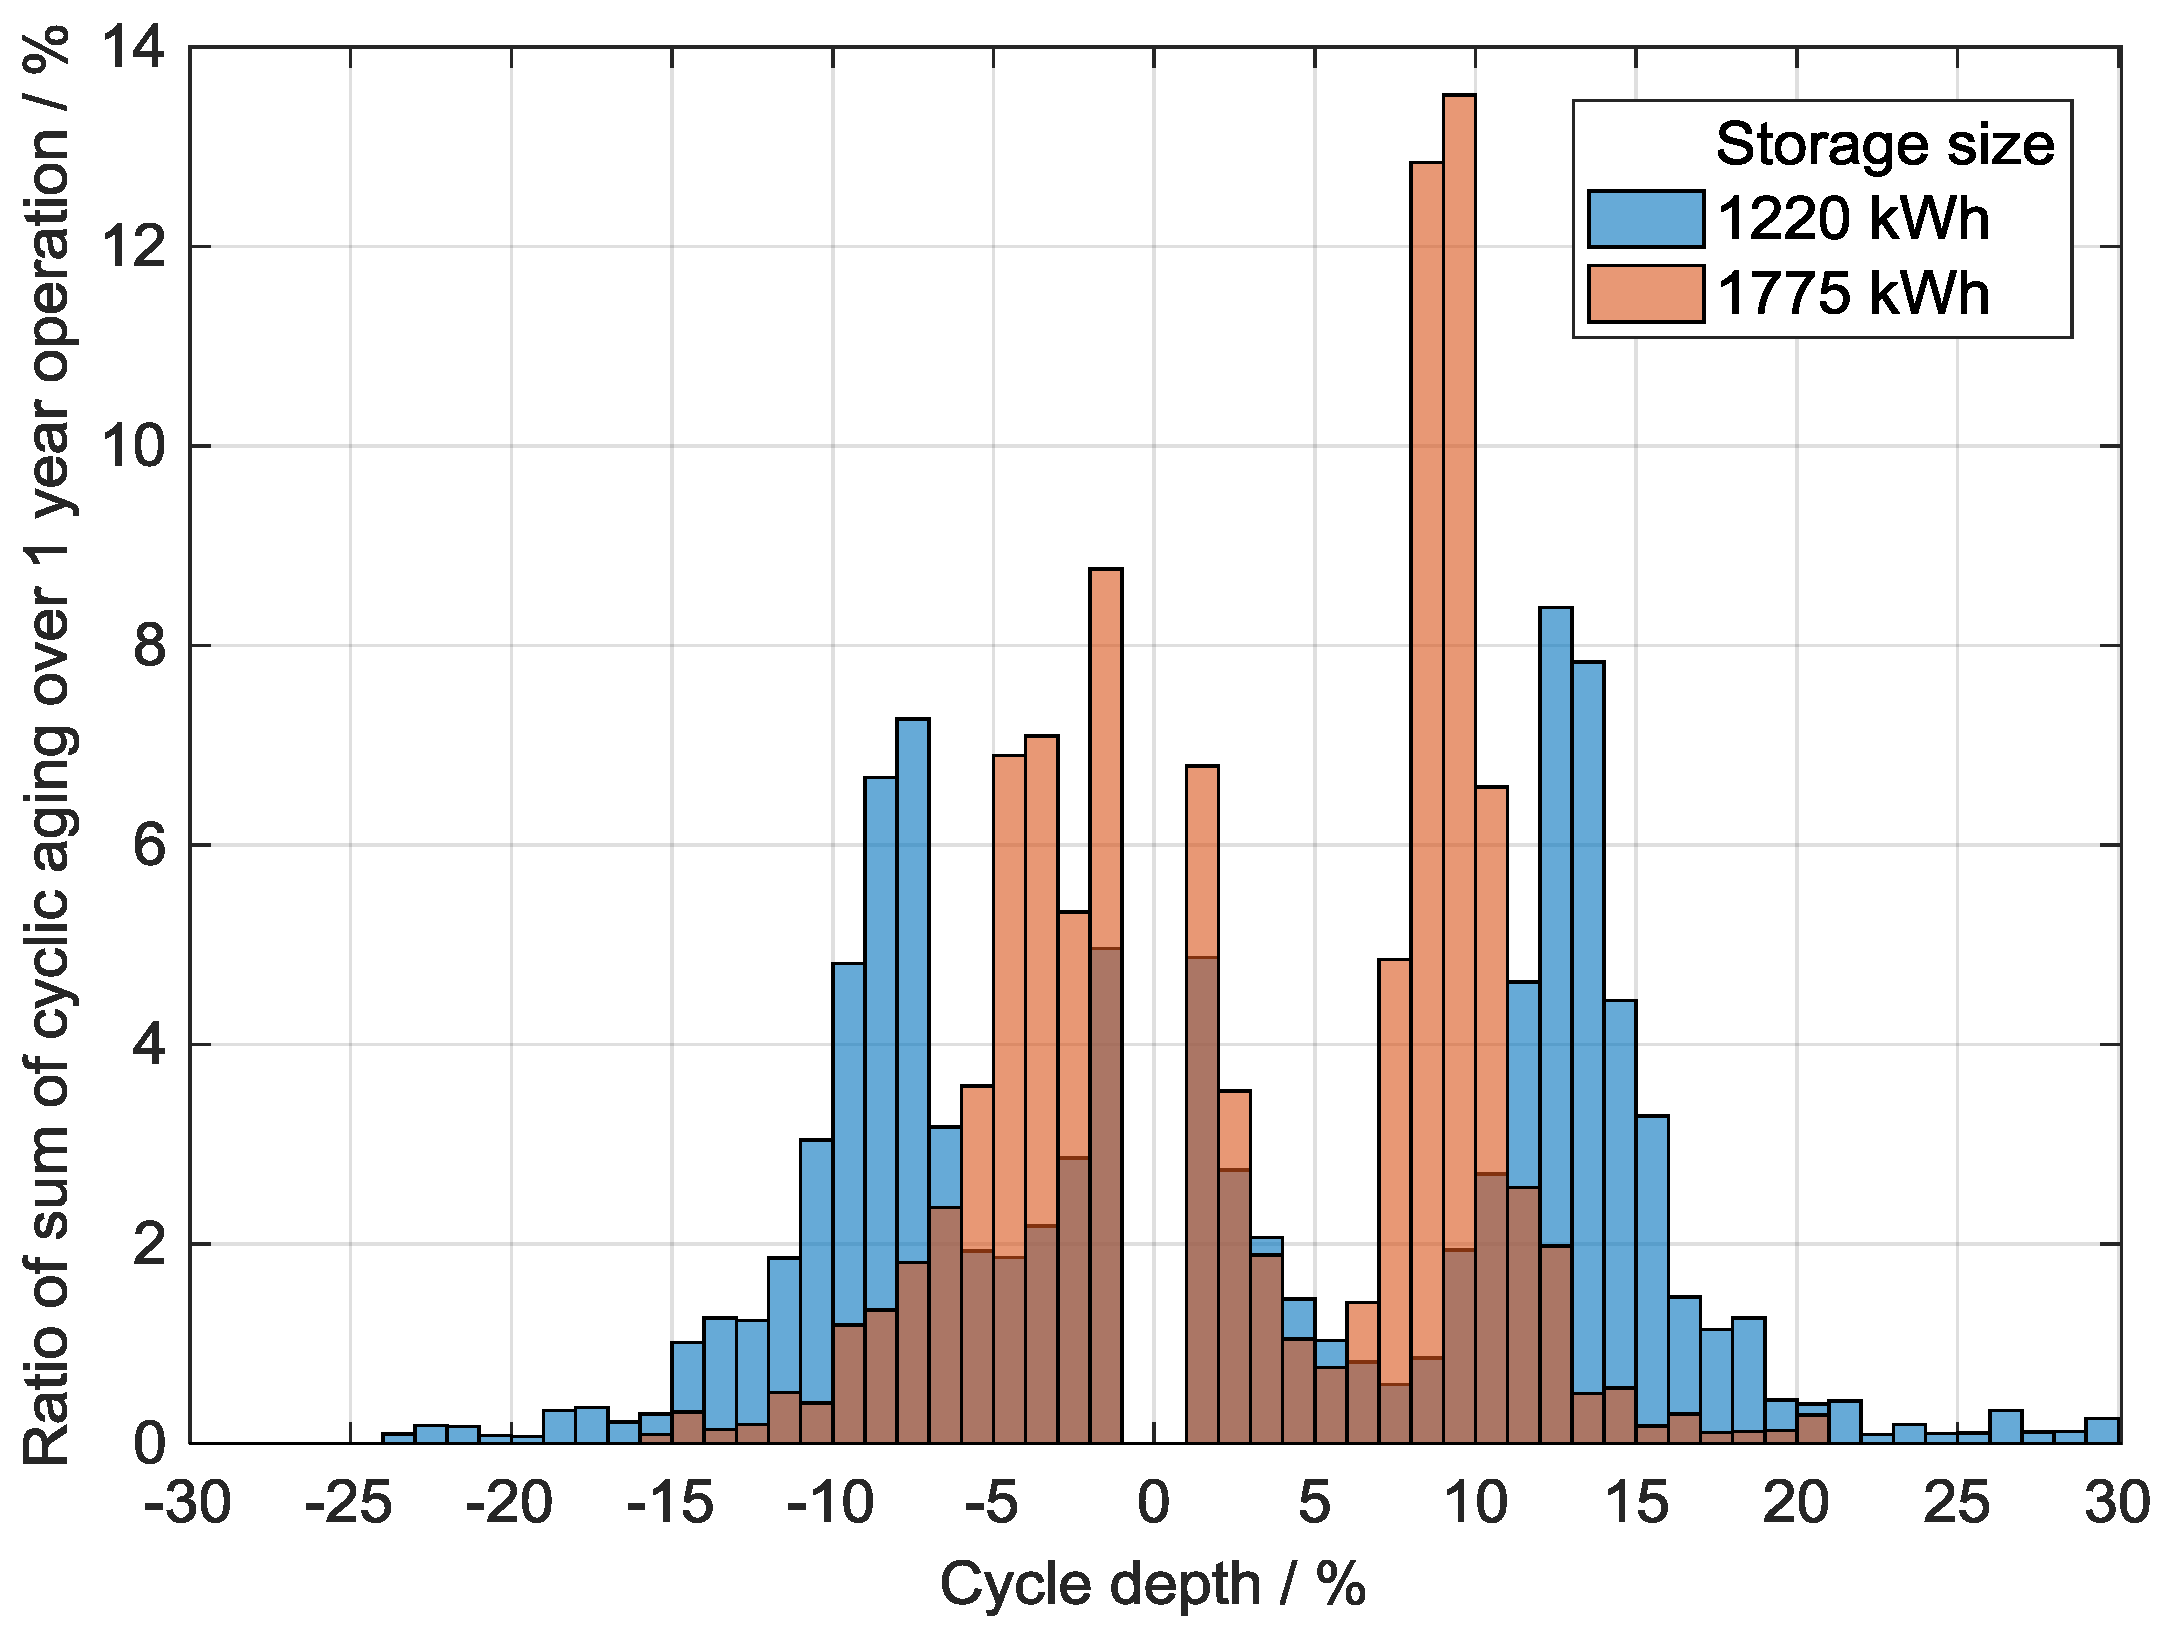
Figure 15, the probability distribution of the cycle depths (DoC) is shown for one year of operation assuming the 2012 frequency data. Cycles with |DoCs| < 1% occur very often and are neglected in the probability distribution because of their insignificant impact on cyclic aging. We can see that cycles with |DoCs| < 15% in discharge and |DoCs| < 20% in the charge direction were most often detected. Comparing the two storage system sizes, we observed different peaks among the DoCs because of the different operation modes of the 15-min and 30-min criteria.
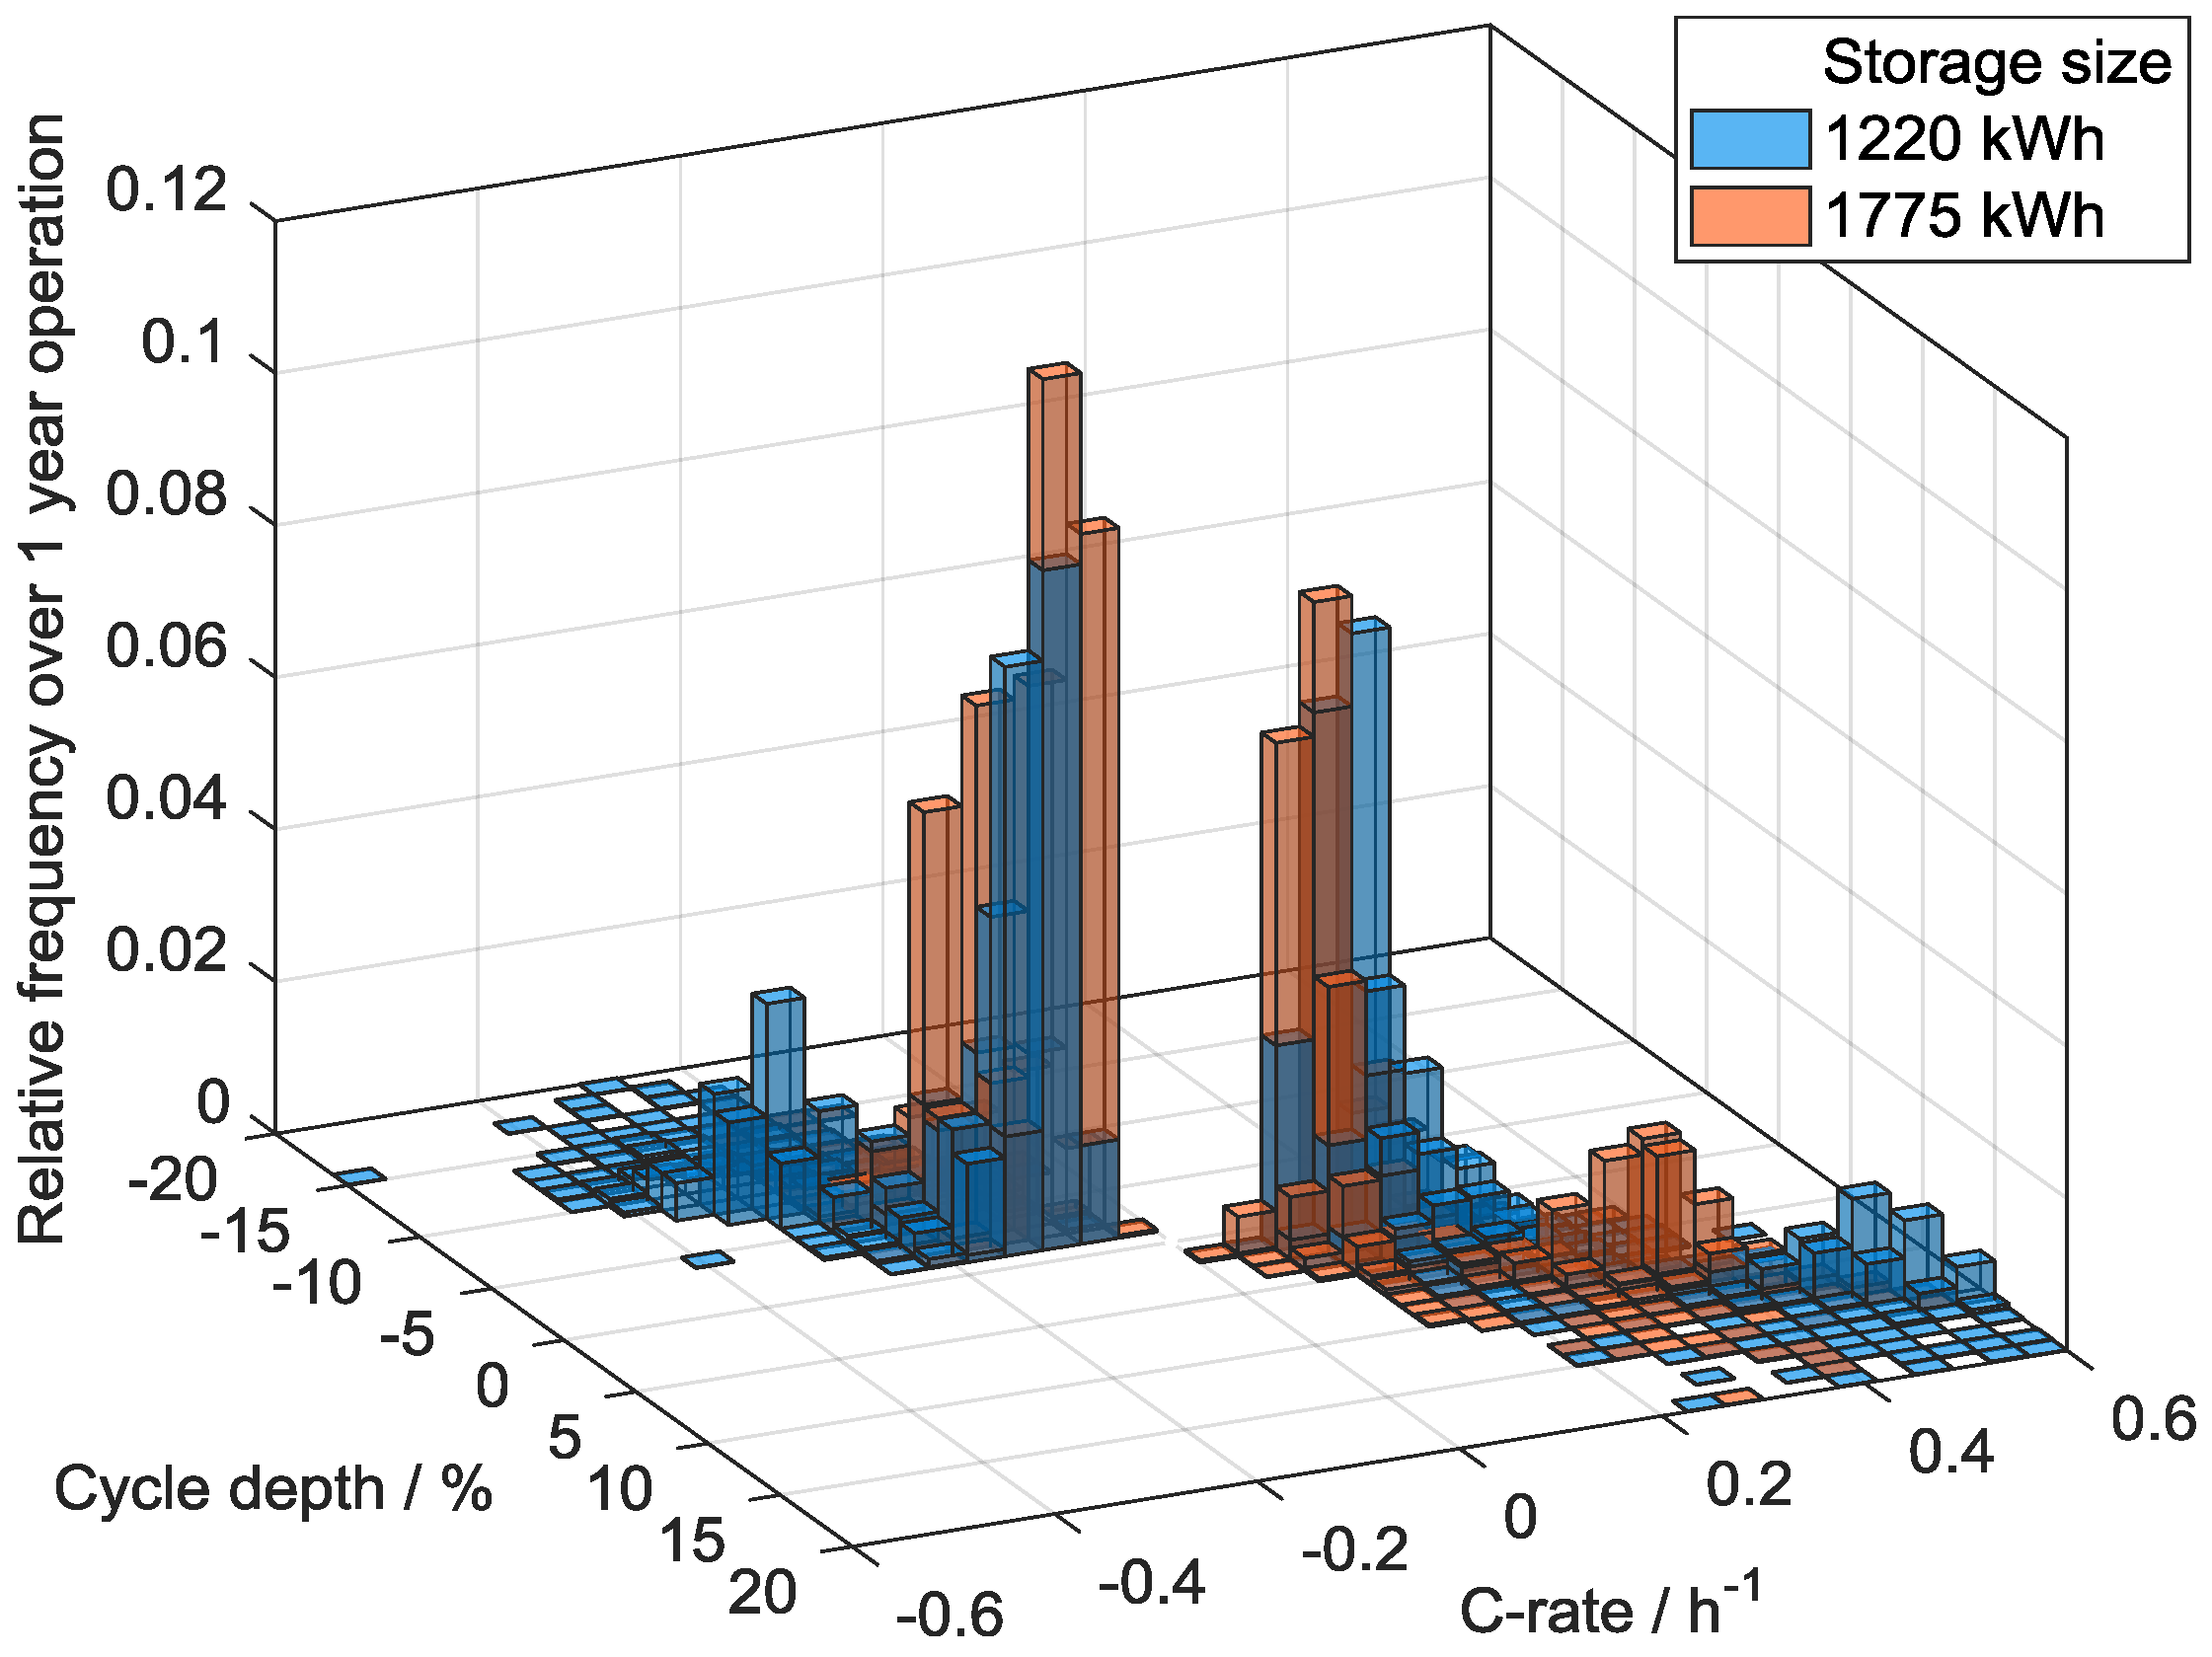
Using the probability distribution of the DoCs, we calculated the specific impact on the cyclic aging, which is represented in Figure 16. In this figure, we see the ratio of the particular cyclic aging related to the overall cyclic aging for each DoC after one year of operation. Again, |DoCs| < 1% were neglected because of their small effect on cyclic aging. As explained in Section 5.7.2, smaller DoCs result in less cyclic aging and capacity degradation than larger DoCs, which is also observed in this figure. The impact of the DoCs near 10% is nearly the same as that of the |DoCs| < 5%, although the cycles with DoC < 5% occur more often than the larger cycles. Nevertheless, in this storage application, the cyclic aging appears much smaller than in other applications such as residential PV storage [11], where we observe larger DoCs that result in significant cyclic aging.

8. Conclusions

Our work assessed the fundamentals of using BESS to provide PCRs in the UTCE area. We have (i) shown the technical requirements for BESS operation as PCR provision systems; (ii) provided explanations of the PCR market and regulations; (iii) demonstrated a methodical approach for operating BESS as PCR storage systems; and (iv) shown potential earnings for such a system. We know from the literature, our own research, and expert knowledge that using BESS as PCRs in Germany currently (as of April 2016) would show significant economic gains compared to other present applications of BESS; this was unexpected a year ago. Furthermore, the significance of our research is backed by numerous projects currently being planned in Europe to use BESS to provide PCRs (April 2016 > 200 MW are known). We have shown the technical readiness and system fitness of BESS for serving as PCR systems in Germany and in any grid where frequency-control services are needed. Hence, the scope of our work was to provide comprehensive knowledge to future operators of PCR BESS systems. We concluded that BESS are able to serve PCRs from a technical and economic perspective, and we fully uncovered the methodology behind this. However, we are aware that this will change in the future with a rise renewable energy shares in Europe and increase numbers of BESS installed in the grid.

9. Outlook and Limitations

We look forward to increasing our accuracy in both the system and aging simulations. In future research, more aging effects will be included, and the precision of the data will increase. Nevertheless, the data resulting from this research were within a prior set of tolerances and are valid. We are willing to offer complete datasets for PCR calculations and the algorithm basis with no constraints to run a PCR BESS. The BESS and aging simulation data are not inherited due to numerous author contributions. For this reason, we strongly encourage direct contact with the authors to obtain access to the datasets.

Acknowledgments

The authors thank Cong Nam Troung for managing the SimSES simulation tool. The authors thank the Bavarian Ministry of Economic Affairs and Media, Energy, and Technology for its financial support via the EEBatt Project.

Author Contributions

Alexander Zeh and Marcus Müller conducted the PCR simulations, analyzed the data, and conducted the aging simulations. Maik Naumann developed the aging model and evaluated the aging data with Marcus Müller. Holger C. Hesse, Andreas Jossen, and Rolf Witzmann were consulted on the paper structure and overall idea, and discussed the results.

Conflicts of Interest

The authors declare no conflicts of interest. The founding sponsors had no role in the design of the study, the collection, analyses, interpretation of data, writing of the manuscript, and the decision to publish the results.

Abbreviations

BESSBattery energy storage system
DoCDepth of cycle
DoFDegree of freedom
DSODistribution grid operator
EESEnergy storage system
EEGRenewable Energies Act
EnWGGerman Energy Economy Law
EPEXEuropean Energy Exchange
IGCCInternational Grid Control Cooperation
LFPLithium iron phosphate
NC LFCREuropean Network Code on Load Frequency Control & Reserves
NPVNet present value
PCRPrimary control reserve
PVPhotovoltaic
SCRSecondary control reserve
SoCState of charge
TCRTertiary control reserve
TSOTransmission system operator

References

  1. Bruch, M.; Müller, M. Calculation of the Cost-Effectiveness of a PV Battery System. In Proceedings of the 8th International Renewable Energy Storage Conference (IRES 2013), Berlin, Germany, 18–20 November 2013.
  2. Zeh, A.; Witzmann, R.; Müller, M. Operating a Multitasking Stationary Battery Storage System for Providing Secondary Control Reserve on Low-Voltage Level. In Proceedings of the International ETG Congress 2015, Bonn, Germany, 17–18 November 2015.
  3. Zeh, A.; Rau, M.; Witzmann, R. Comparison of decentralized and centralized grid-compatible battery storage systems in distribution grids with high PV penetration. Prog. Photovolt. Res. Appl. 2014, 24, 496–506. [Google Scholar] [CrossRef]
  4. Viernstein, L.; Zeh, A.; Pardatscher, R.; Witzmann, R. Substitution of Low-Voltage Grid Extension through Storages in Low-Voltage Grids. In Proceedings of the 9th International Renewable Energy Storage Conference (IRES 2015), Düsseldorf, Germany, 9–11 March 2015.
  5. Kairies, K.-P.; Haberschusz, D.; van Ouwerkerk, J.; Strebel, J.; Wessels, O.; Magnor, D.; Badeda, J.; Sauer, D.U. Wissenschaftliches Mess- und Evaluierungsprogramm Solarstromspeicher—Jahresbericht 2016; Institute for Power Electronics and Electrical Drives, RWTH Aachen: Aachen, Germany, 2016. (In German) [Google Scholar]
  6. Hartig, A. From Generation to Integration: New Business Opportunities in the German Energiewende. In Proceedings of the Energy Storage Europe Conference (ESE 2015), Düsseldorf, Germany, 9–11 March 2015.
  7. German Transmission System Operators. Anforderungen an die Speicherkapazität bei Batterien für die Primärregelleistung, 2015. Available online: https://www.regelleistung.net/ext/download/anforderungBatterien (accessed on 24 March 2016). (In German)
  8. Bundesverband Energiespeicher. Faire Bedingungen für Energiespeicher am Regelenergiemarkt in Sicht, 2015. Available online: http://www.bves.de/wp-content/uploads/2015/10/20151022_PM_BVES_PQ_30Minuten.pdf (accessed on 24 March 2016). (In German)
  9. German Transmission System Operators. Eckpunkte und Freiheitsgrade bei Erbringung von Primärregelleistung, 2014. Available online: https://www.regelleistung.net/ext/download/eckpunktePRL (accessed on 24 March 2016). (In German)
  10. KWH Netz GmbH. NETZENTGELTE 2015–Entgelte für die Nutzung der Netzinfrastruktur im Jahr 2015. Available online: http://kwh-netz.de/tl_files/downloads/Netzentgelte_2015_neu.pdf (accessed on 4 April 2016). (In German)
  11. Naumann, M.; Karl, R.C.; Truong, C.N.; Jossen, A.; Hesse, H.C. Lithium-ion battery cost analysis in PV-household application. Energy Procedia 2015, 73, 37–47. [Google Scholar] [CrossRef]
  12. Ecker, M.; Nieto, N.; Käbitz, S.; Schmalstieg, J.; Blanke, H.; Warnecke, A.; Sauer, D.U. Calendar and cycle life study of Li(NiMnCo)O2-based 18650 lithium-ion batteries. J. Power Sources 2014, 248, 839–851. [Google Scholar] [CrossRef]
  13. Millner, A. Modeling Lithium Ion Battery Degradation in Electric Vehicles. In Proceedings of the IEEE Conference on Innovative Technologies for an Efficient and Reliable Electricity Supply, Waltham, MA, USA, 27–29 September 2010.
  14. Miyaki, Y.; Hayashi, K.; Makino, T.; Yoshida, K.; Terauchi, M.; Endo, T.; Fukushima, Y. A common capacity loss trend: LiFePO4 cell’s cycle and calendar aging. ECS Meet. Abstr. 2012, 2, 1091. [Google Scholar]
  15. Peterson, S.B.; Apt, J.; Whitacre, J.F. Lithium-ion battery cell degradation resulting from realistic vehicle and vehicle-to-grid utilization. J. Power Sources 2010, 8, 2385–2392. [Google Scholar] [CrossRef]
  16. Dubarry, M.; Truchot, C.; Liaw, B.Y. Cell degradation in commercial LiFePO4 cells with high-power and high-energy designs. J. Power Sources 2014, 258, 408–419. [Google Scholar] [CrossRef]
  17. Schuster, S.F.; Bach, T.; Fleder, E.; Müller, J.; Brand, M.; Sextl, G.; Jossen, A. Nonlinear aging characteristics of lithium-ion cells under different operational conditions. J. Energy Storage 2015, 1, 44–53. [Google Scholar] [CrossRef]
  18. Han, X.; Ji, T.; Zhao, Z.; Zhang, H. Economic evaluation of batteries planning in energy storage power stations for load shifting. Renew. Energy 2015, 78, 643–647. [Google Scholar] [CrossRef]
  19. Sauer, D.U.; Wenzl, H. Comparison of different approaches for lifetime prediction of electrochemical systems—Using lead-acid batteries as example. J. Power Sources 2008, 176, 534–546. [Google Scholar] [CrossRef]
  20. Rosenkranz, C.A.; Köhler, U.; Liska, J.L. Modern Battery Systems for Plug-In Hybrid Electric Vehicles. In Proceedings of the 23rd International Battery, Hybrid and Fuel Cell Electric Vehicle Symposium and Exhibition (EVS-23), Anaheim, CA, USA, 2–5 December 2007.
Figure 1. Growth of photovoltaic (PV) and primary control reserve (PCR) storage system markets in Germany [6].
Batteries 02 00029 g001
Figure 2. P-f characteristics for providing PCR.
Batteries 02 00029 g002
Figure 3. Required state of charge (SoC) range for a battery energy storage system (BESS) based on the 30-min or 15-min criterion.
Batteries 02 00029 g003
Figure 4. Exemplary frequency curve in the period considered, including a floating average of 60 min.
Batteries 02 00029 g004
Figure 5. SoC characteristics for different DoFs.
Batteries 02 00029 g005
Figure 6. SoC characteristics when using only scheduled transactions.
Batteries 02 00029 g006
Figure 7. SoC characteristics for using all DoFs.
Batteries 02 00029 g007
Figure 8. SoC curves and SoC limits (red lines) generated via validation simulations: (a) 30-min-criterion; and (b) 15-min-criterion.
Batteries 02 00029 g008
Figure 9. Relative frequency of SoC over one year of operation.
Batteries 02 00029 g009
Figure 10. Relative frequency of the C rate.
Batteries 02 00029 g010
Figure 11. Relative frequency of cycle depth and C rate in 2014.
Batteries 02 00029 g011
Figure 12. Influence of BESS sizing on aging by year.
Batteries 02 00029 g012
Figure 13. BESS sizing influence on aging effects.
Batteries 02 00029 g013
Figure 14. Aging influence of predefined scenarios on overall BESS performance (mean values of BESS power and sizes were taken into account for better results).
Batteries 02 00029 g014
Figure 15. Relative frequency of cycle depth.
Batteries 02 00029 g015
Figure 16. Percentage of cyclic aging versus cycle depth.
Batteries 02 00029 g016
Table 1. Comparison of electricity overhead fees effective in Germany for end consumers and PCR usage, respectively. EEG: Renewable Energy Act; and VAT: value-added tax.
Fees and Taxes for Energy ConsumptionNormal CasePCR Storage
Electricity taxYesYes
Concession levyYesYes
EEG reallocation feeYesNo
Grid feeYesNo
Remaining pegged feesYesYes
Costs for generation and marketingYesYes
VATYesYes
Table 2. Four case system for controlling the degrees of freedom (DoFs).
SoCPCR DirectionDemand ProgressionCase N°
>SoCdesPositiveIncreasing2
Decreasing1
NegativeIncreasing3
Decreasing4
<SoCdesPositiveIncreasing3
Decreasing4
NegativeIncreasing2
Decreasing1
Table 3. Strategy for activating the DoFs.
Case N°OverfulfillmentDead BandProvision Rate
1ActiveActiveActive
2ActiveActiveInactive
3InactiveInactiveActive
4InactiveInactiveInactive
Table 4. Parameter sets for the simulation.
ParameterDescriptionRangeIncrement
SoCdesDesired SoC48%–54%0.01
TID,buyBuying duration15–45 min15 min
TID,sellSelling duration15–45 min15 min
PID,buyBought power0.25Ppq–0.65Ppq0.1Ppq
PID,sellSold power0.25Ppq–0.85Ppq0.1Ppq
PpqPCR power0.5EBatt/h–0.9EBatt/h0.1EBatt/h
Table 5. Parameter set for illustration.
ParameterValueUnit
SoCdes50%-
TID,buy15min
TID,sell15min
PID,buy0.55EBatt-
PID,sell0.55EBatt-
Table 6. Assumed taxes and prices for Germany in 2015. KWK: combined heat and power; and EPEX: European Energy Exchange.
VariableValueUnit
Electricity tax2.05cent/kWh
Concession levy1.32cent/kWh
KWK charge0.379cent/kWh
Offshore charge0.04cent/kWh
§19 charge0.378cent/kWh
Ø PCR revenue170€/kW∙a
Ø EPEX Intraday3.00cent/kWh
VAT19%-
Table 7. Ideal parameter set evaluated via simulation of years 2013 and 2014.
ParameterDescription30-min Criterion15-min Criterion
SoCdesDesired SoC0.520.51
TID,buyBuying duration15 min15 min
TID,sellSelling duration15 min15 min
PID,buyBought power0.35Ppq0.45Ppq
PID,sellSold power0.55Ppq0.55Ppq
PpqPCR power0.58EBatt/h0.82EBatt/h
SoCmaxMaximum SoC0.710.795
SoCminMinimum SoC0.290.205
SoCmax,IDSoC limit sell0.5360.549
SoCmin,IDSoC limit buy0.4640.451
Table 8. Parameters for validation simulations.
ParameterDescription30-min Criterion15-min Criterion
EbattBattery energy content1725 kWh1220 kWh
PpqPCR power1000 kW1000 kW
PID,buyBought power300 kW400 kW
PID,sellSold power600 kW600 kW
Table 9. Yearly revenues and expenses.
Parameter30-min Criterion15-min Criterion
PCR sales+170 €/kW+170 €/kW
EPEX sales+5 €/kW+5.5 €/kW
EPEX purchases−11.5 €/kW−17.0 €/kW
Overall+163.5 €/kW+158.5 €/kW
Table 10. Assumptions and results for the given aging scenarios with BESS property sensitivity according to cyclic and calendric aging.
AssumptionsResults
CriterionPowerEnergy ContentYearAging ModelLifetime CyclicLifetime CalendricAging in %Calendric Aging in %Cyclic Aging in %
15-min1 MW1.22 MWh2012Strong300012.53.271.601.67
Medium5000152.241.330.91
Weak6000151.571.330.24
Optimistic14,000201.101.000.10
2013Strong300012.53.051.601.45
Medium5000152.091.330.76
Weak6000151.531.330.20
Optimistic14,000201.081.000.08
2014Strong300012.52.901.601.30
Medium5000152.031.330.70
Weak6000151.511.330.18
Optimistic14,000201.081.000.08
2012–2014Strong300012.58.334.803.53
Medium5000155.154.001.15
Weak6000154.344.000.34
Optimistic14,000203.143.000.14
30-min1.77 MWh2012Strong300012.52.711.601.11
Medium5000151.821.330.49
Weak6000151.471.330.13
Optimistic14,000201.061.000.06
2013Strong300012.52.521.600.92
Medium5000151.721.330.39
Weak6000151.441.330.11
Optimistic14,000201.041.000.04
2014Strong300012.52.441.600.84
Medium5000151.711.330.37
Weak6000151.431.330.10
Optimistic14,000201.041.000.04
2012–2014Strong300012.56.824.802.02
Medium5000154.734.000.73
Weak6000154.174.000.17
Optimistic14,000203.073.000.07
1.6 MW2.66 MWh2012Oversizing300012.52.711.601.11
Oversizing5000151.821.330.49
Oversizing6000151.471.330.14
Oversizing14,000201.061.000.06

