Five superlattice HAAs (Fe1–Fe5) with a general composition of Mm
0.83Mg
0.17Ni
2.94−xAl
0.17Co
0.2Fe
x (
x = 0, 0.05, 0.1, 0.15, 0.2) were prepared for this study. Design compositions and ICP results in at% are listed in
Table 1. The B/A ratio was set to 3.31, which is the same as in previous matrices for Mn [
8] and Co substitutions [
9], and the stoichiometry for the main Ce
2Ni
7 phase was independent of the overall composition [
10]. The base alloy (Fe1) was chosen from a previous matrix of Co-substituted superlattice HAAs (C3) due to its superior low-temperature performance [
9]. ICP results show that the composition of each alloy is very close to its designed value (
Table 1).
3.1. X-Ray Diffraction Analysis
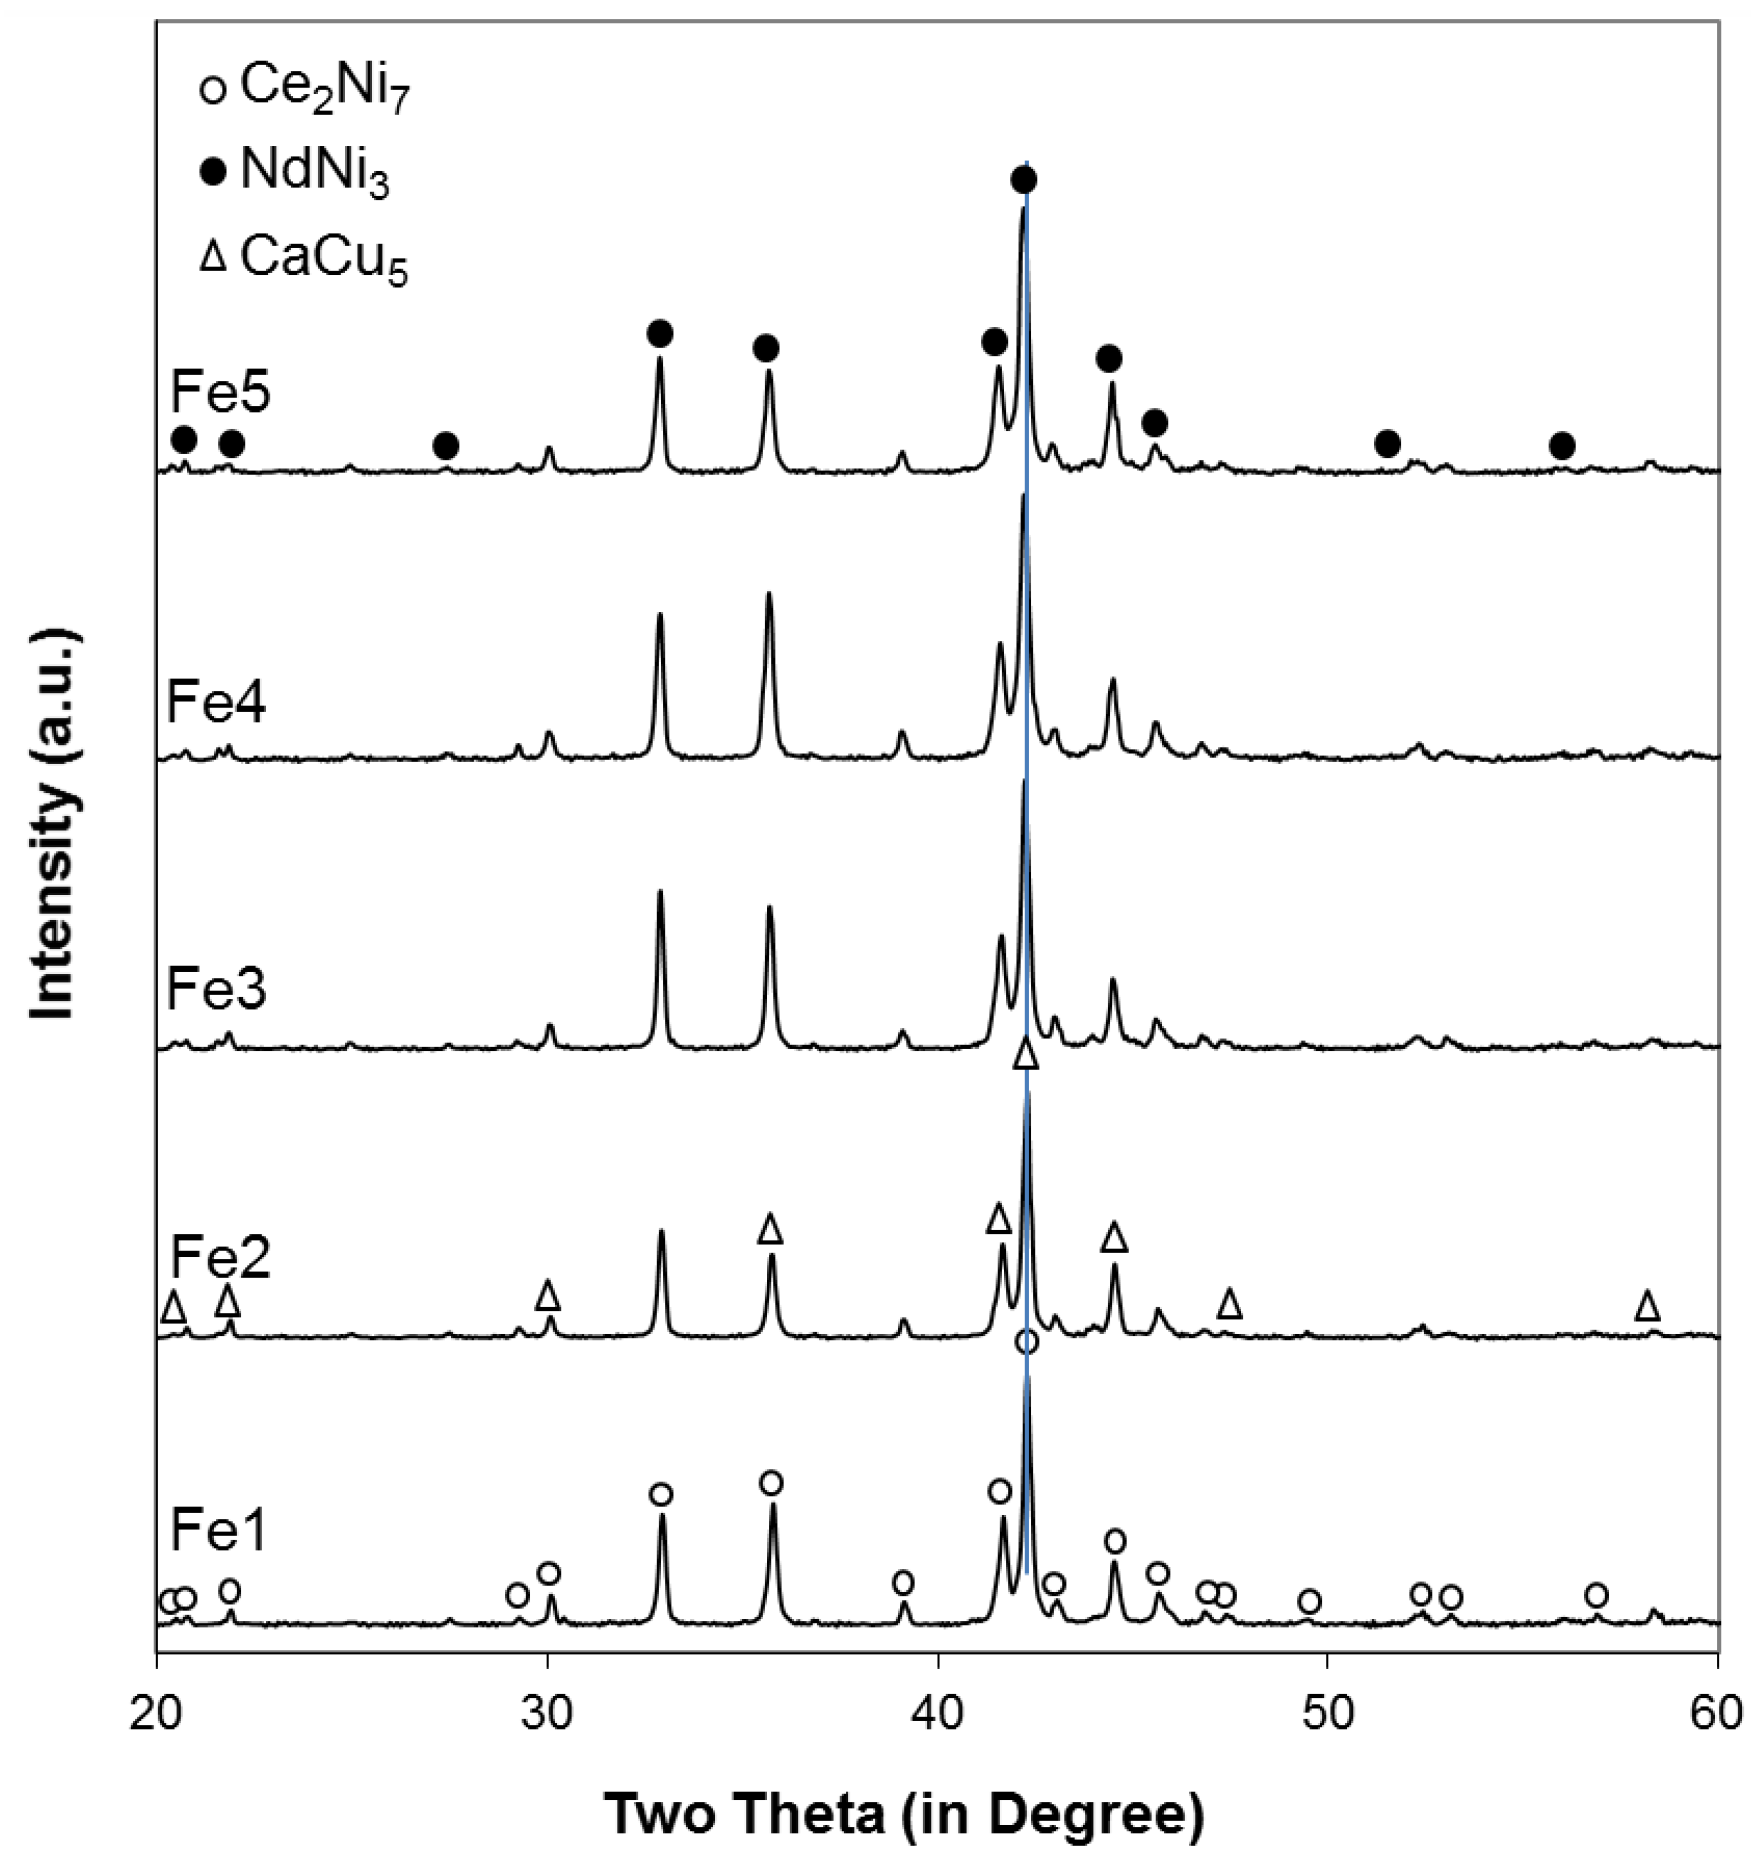
The powder XRD patterns of the five alloys in this study are shown in
Figure 1. Peaks from the Ce
2Ni
7, NdNi
3, and CaCu
5 phases can easily be identified. The lattice parameters of the main phase (Ce
2Ni
7) and phase abundances of all three phases were calculated using the Rietveld refinement method with the Jade 9 software (Materials Data Inc. (MDI), Livermore, CA, USA), and the results are summarized in
Table 2.
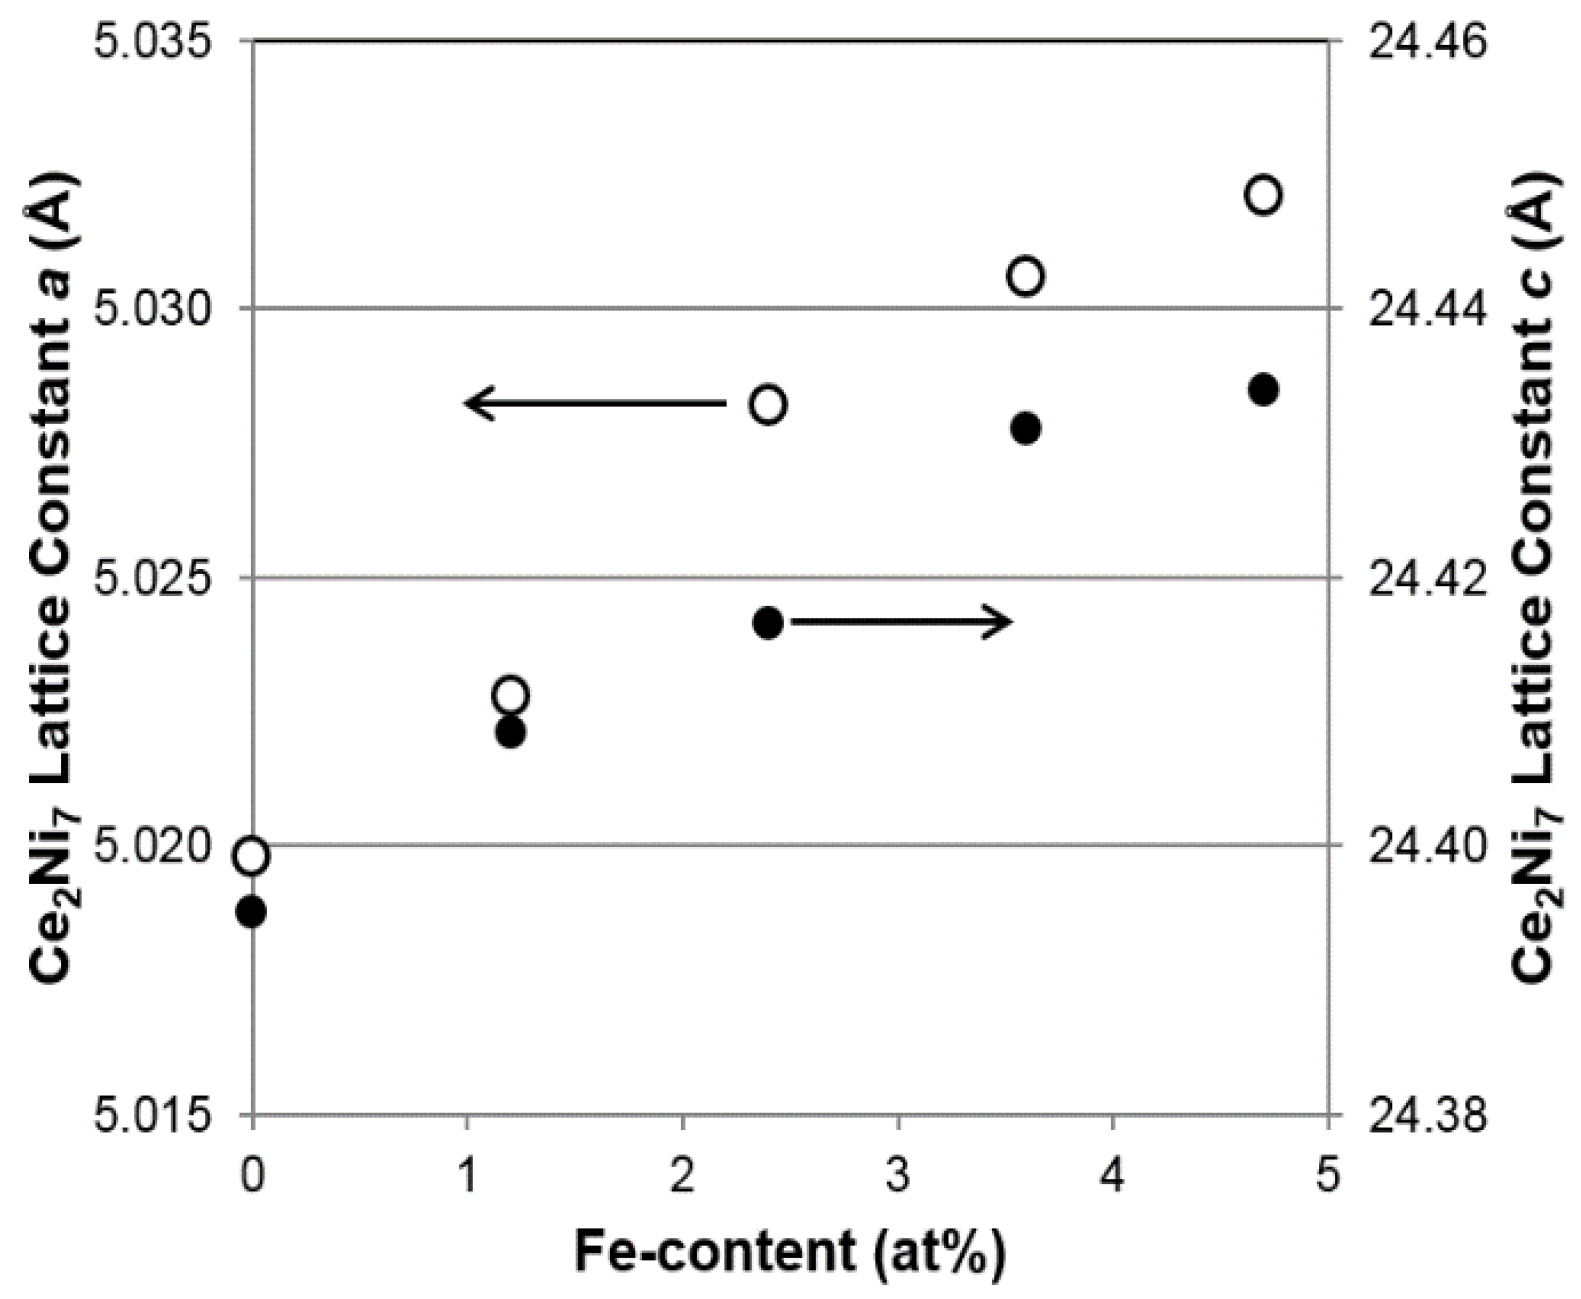
As seen in
Figure 2, both lattice parameters
a and
c of the main Ce
2Ni
7 phase increase with increasing Fe content (larger size compared to that of Ni), resulting in the unit cell expansions and, consequently, a shift in the main XRD peak (around 42.2°) to lower angles (larger interplanar distance), as indicated by the vertical line in
Figure 1. Moreover, the roughly unchanged
c/
a ratios shown in
Table 2 suggest that the Ce
2Ni
7 unit cell expansion is isotropic, which differs from the faster growth in the a-direction reported in the Mn-substitution study [
8]. Changes in the Ce
2Ni
7 unit cell volume with Mn, Fe, and Co substitutions are compared in
Figure 3. While the slopes of graphs representing increase versus substitution amount for the Mn and Fe substitutions are similar, no change is observed for the Co substitution due to the similarity in atomic radii between Co and the replaced Ni. Additionally, no particular trend in Ce
2Ni
7 crystallite size (determined by the full width at half-maximum of the (109) peak) with increasing Fe content can be established, which differs from the Mn (decreasing) [
8] and Co substitutions (increasing) [
9].
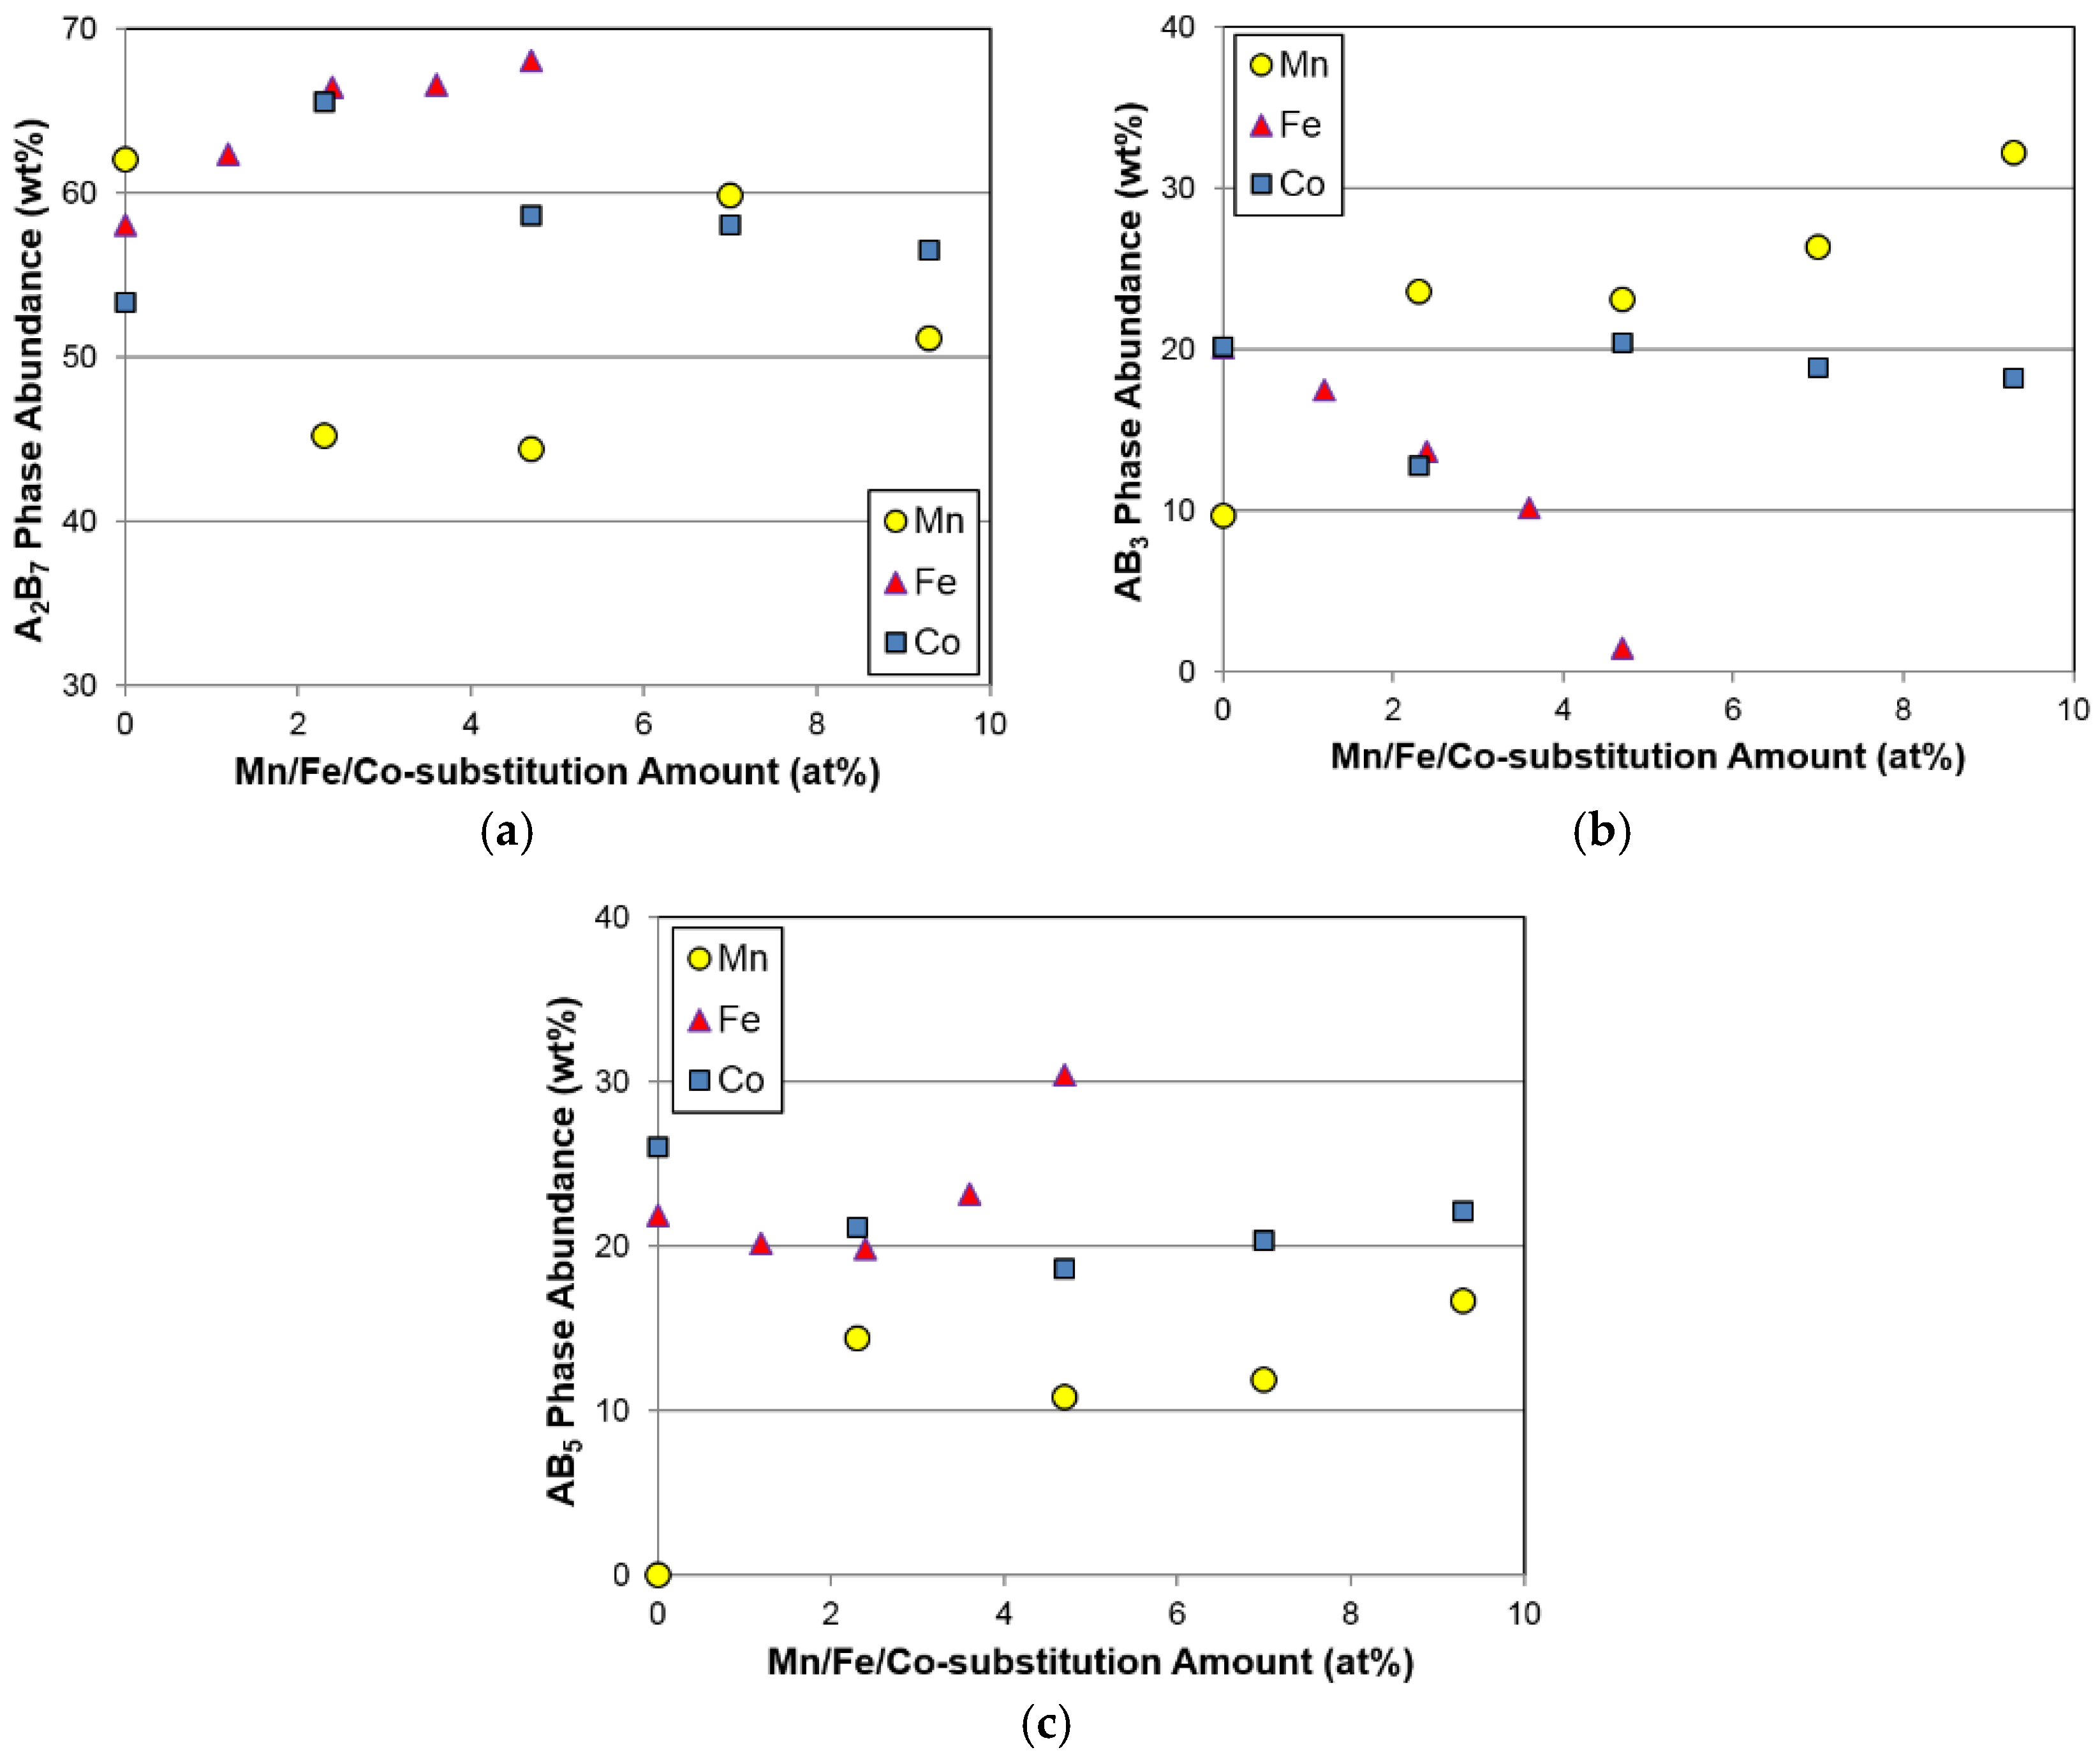
Phase abundances of the three constituent phases from the Mn, Fe, and Co substitution studies are plotted in
Figure 4. It should be noted that phases with the same composition are merged into one category. For example, calculations for the A
2B
7 phase abundance include both the hexagonal (Ce
2Ni
7) and rhombohedral (Pr
2Ni
7) phase structures. Compared to the large fluctuations in A
2B
7 phase abundance for the Mn and Co substitutions, the Fe substitution increases the amount of the main A
2B
7 phase (
Figure 4a). The electrochemical performance of the A
2B
7 phase was believed to be superior to that of the AB
3 phase [
45]. However, while additives, including Ce, Nd, Pr, Sm, Zr, Ti, Si, and Cr, decreased the A
2B
7 phase abundance, only Fe and Cu were found to increase the abundance of this phase [
46]. It is clear from the comparison shown in
Figure 4b that Mn promotes and Fe decreases the AB
3 phase formation. Meanwhile, the effect of Co in this case is not obvious. Trends in AB
5 phase abundance are similar for the increases in all three substitutions, except for the alloy with the least amount of Mn in the Mn-series, and exhibit the behavior of first decreasing and then increasing. Among the three substitutions, the average amount of the AB
5 phase abundance increases in the following trend: Mn < Co < Fe.
3.2. Scanning Electron Microscope/Energy Dispersive Spectroscopy Analysis
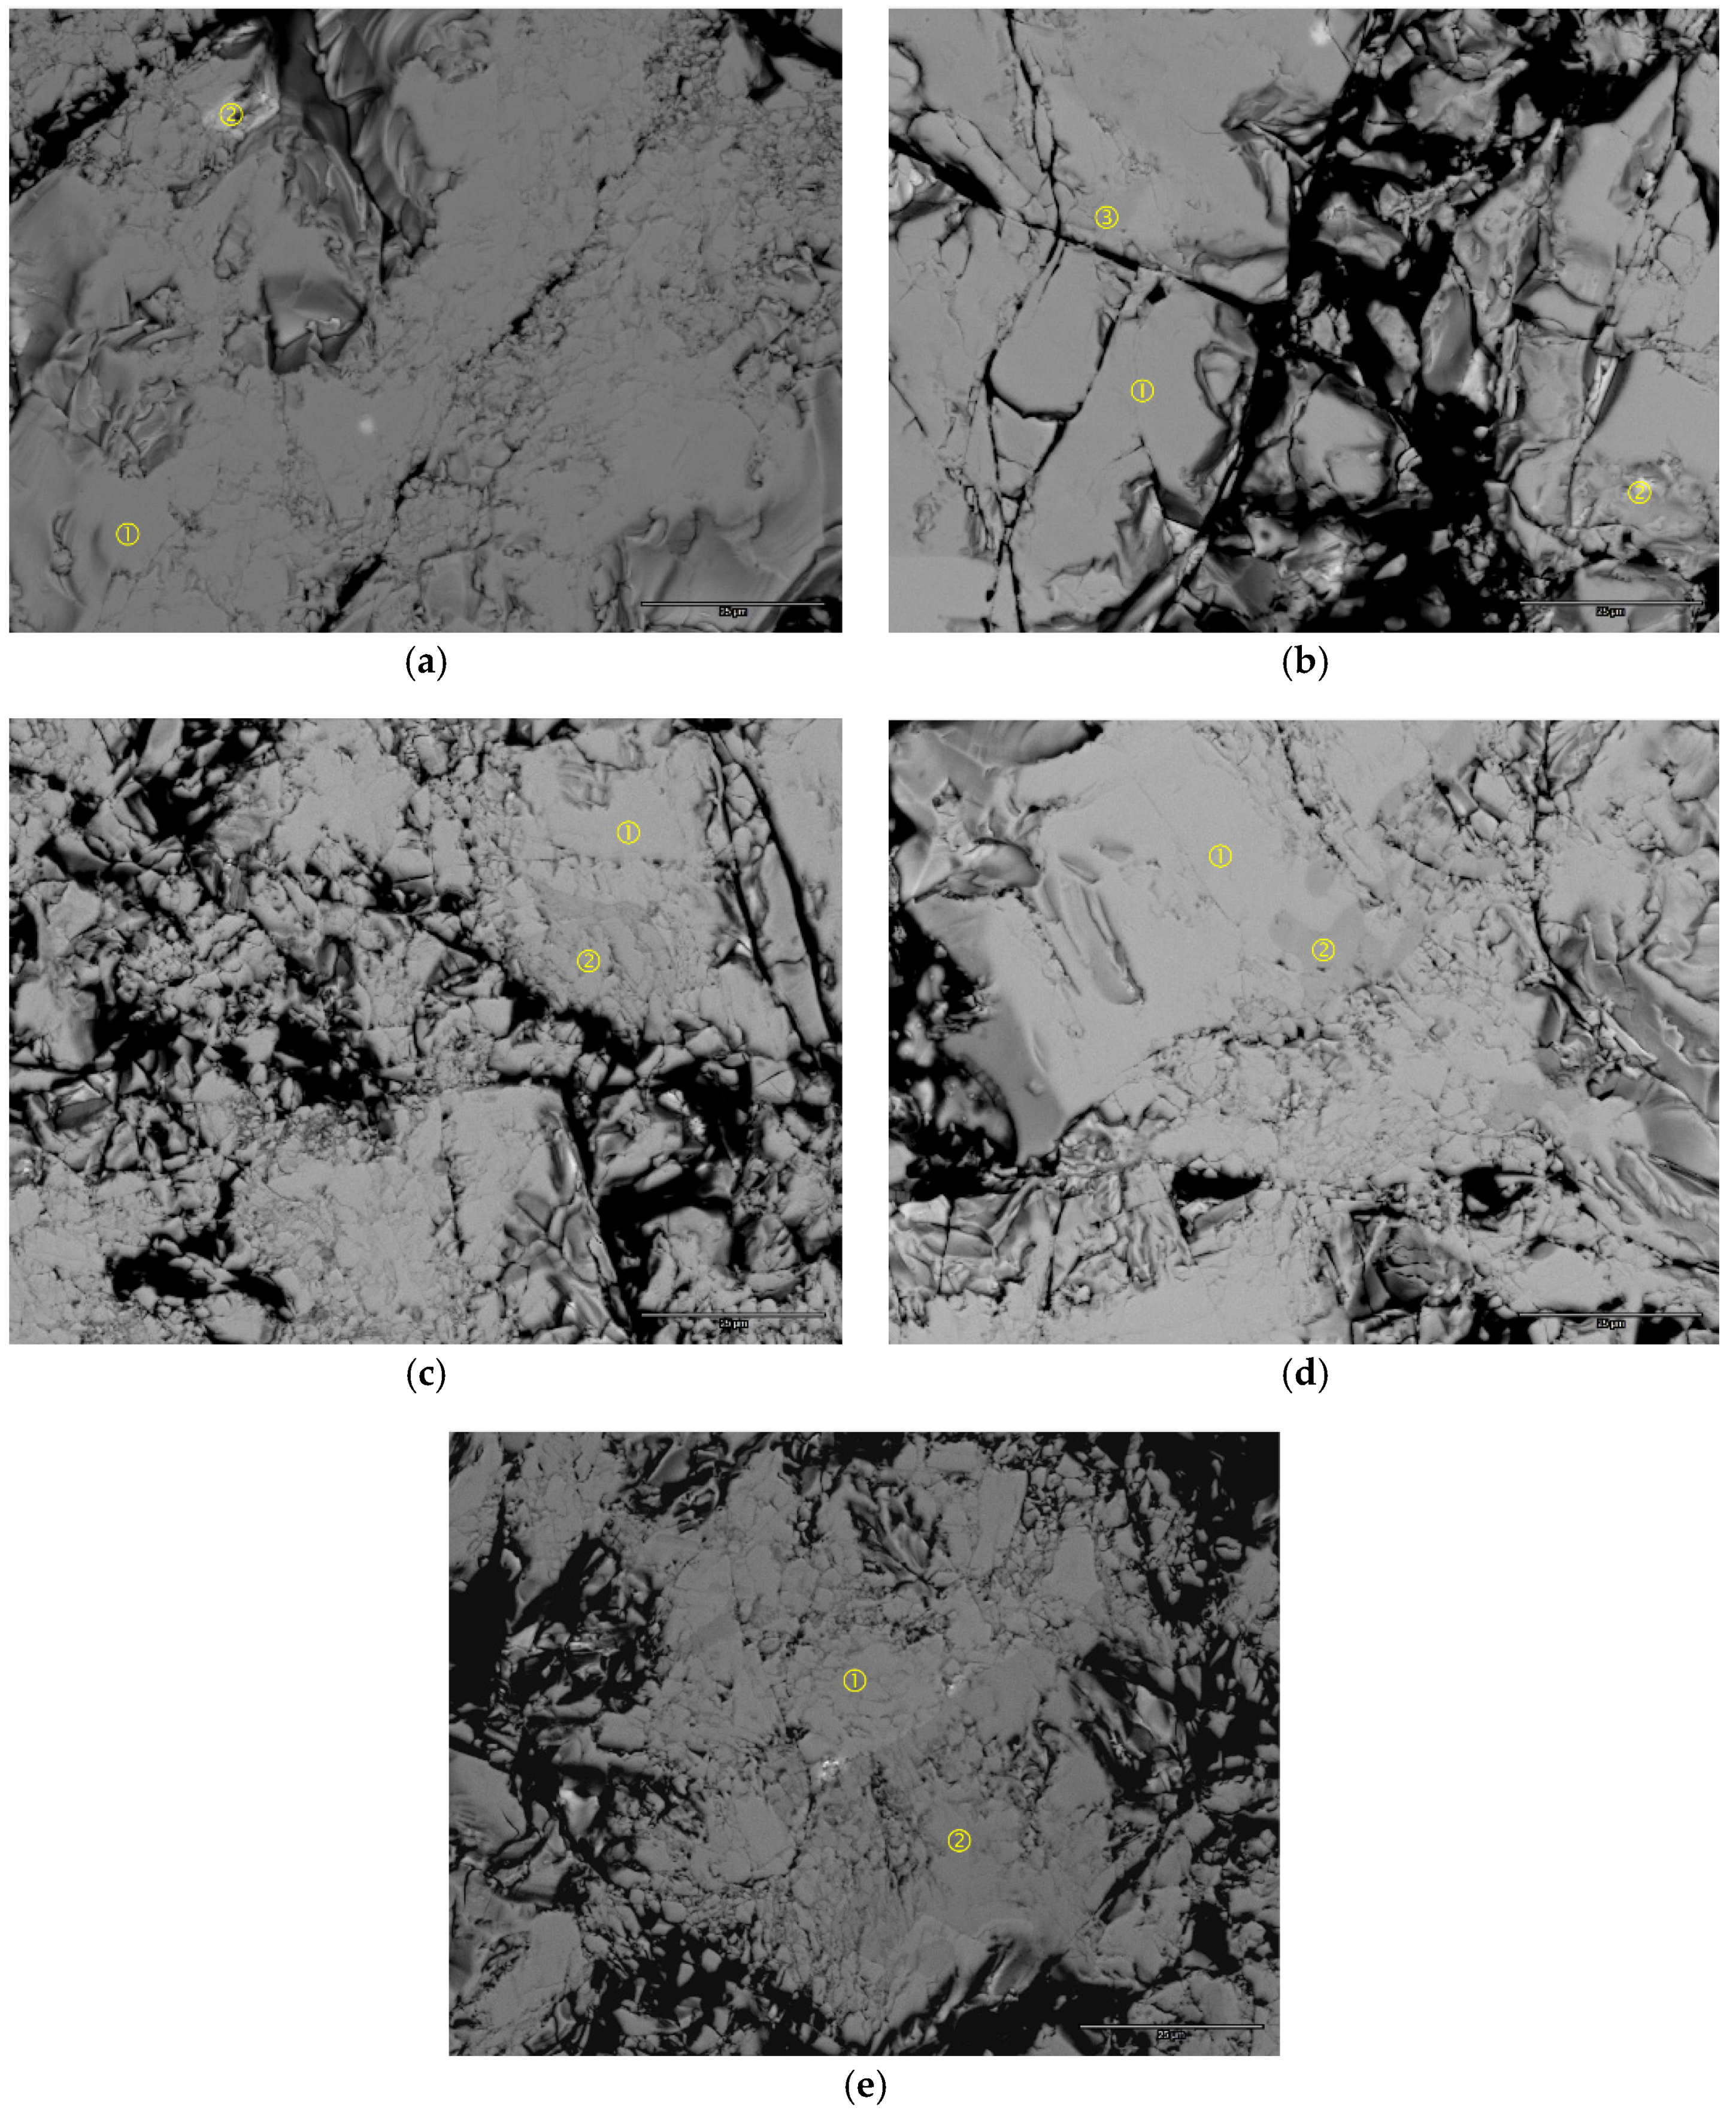
SEM analysis was performed on the polished powder sample surface, and the backscattered electron (BSE) micrographs of the five alloys are shown in
Figure 5. In general, the color intensity of each image is very uniform, with some occasional brighter spots and/or areas with slightly darker contrasts. The chemical composition of the numbered areas in each BSE micrograph were studied by EDS, and the results are summarized in
Table 3. Brighter spots (
Figure 5a-2,b-2) are an excess of rare earth metals, and the darker areas are either the AB
5 (
Figure 5b-3,d-2) or LaMgNi
4 (
Figure 5c-2,e-2) phase. The AB
3 and A
2B
7 phases cannot be separated due to their similarity in composition. The B/A ratios in the main AB
3/A
2B
7 phase of alloys Fe1–Fe5 are in the range of 3.31–3.41, which is between the B/A ratios of AB
3 (3.0) and A
2B
7 (3.5) and closer to the B/A ratio of A
2B
7 (3.5). This finding is in agreement of the XRD results, where the A
2B
7 phase abundance was found to be higher than the AB
3 phase abundance. Similar to the cases of Mn and Co substitutions, Fe does not form any separated secondary phase and dissolves completely in the main AB
3/A
2B
7 phase. Therefore, changes in the lattice constant of the main phase, as revealed by XRD, were the result of Fe incorporation. EDS analysis also shows that the LaMgNi
4 phase is deficient in Al, Co, and Fe, while the AB
5 phase is rich in Al, Co, and Fe.
3.3. Gaseous Phase Hydrogen Storage
The gaseous phase H-storage characteristics of the alloys were studied using PCT measurements performed at 30 and 45 °C. The PCT isotherms are plotted in
Figure 6. In general, the changes in shape and position of the isotherms from the Fe-incorporated alloys are small. The isotherms are similar to those from the Co-incorporated alloys [
9], but different from the Mn-incorporated alloys [
8].
Several gaseous phase parameters obtained from the PCT measurements are listed in
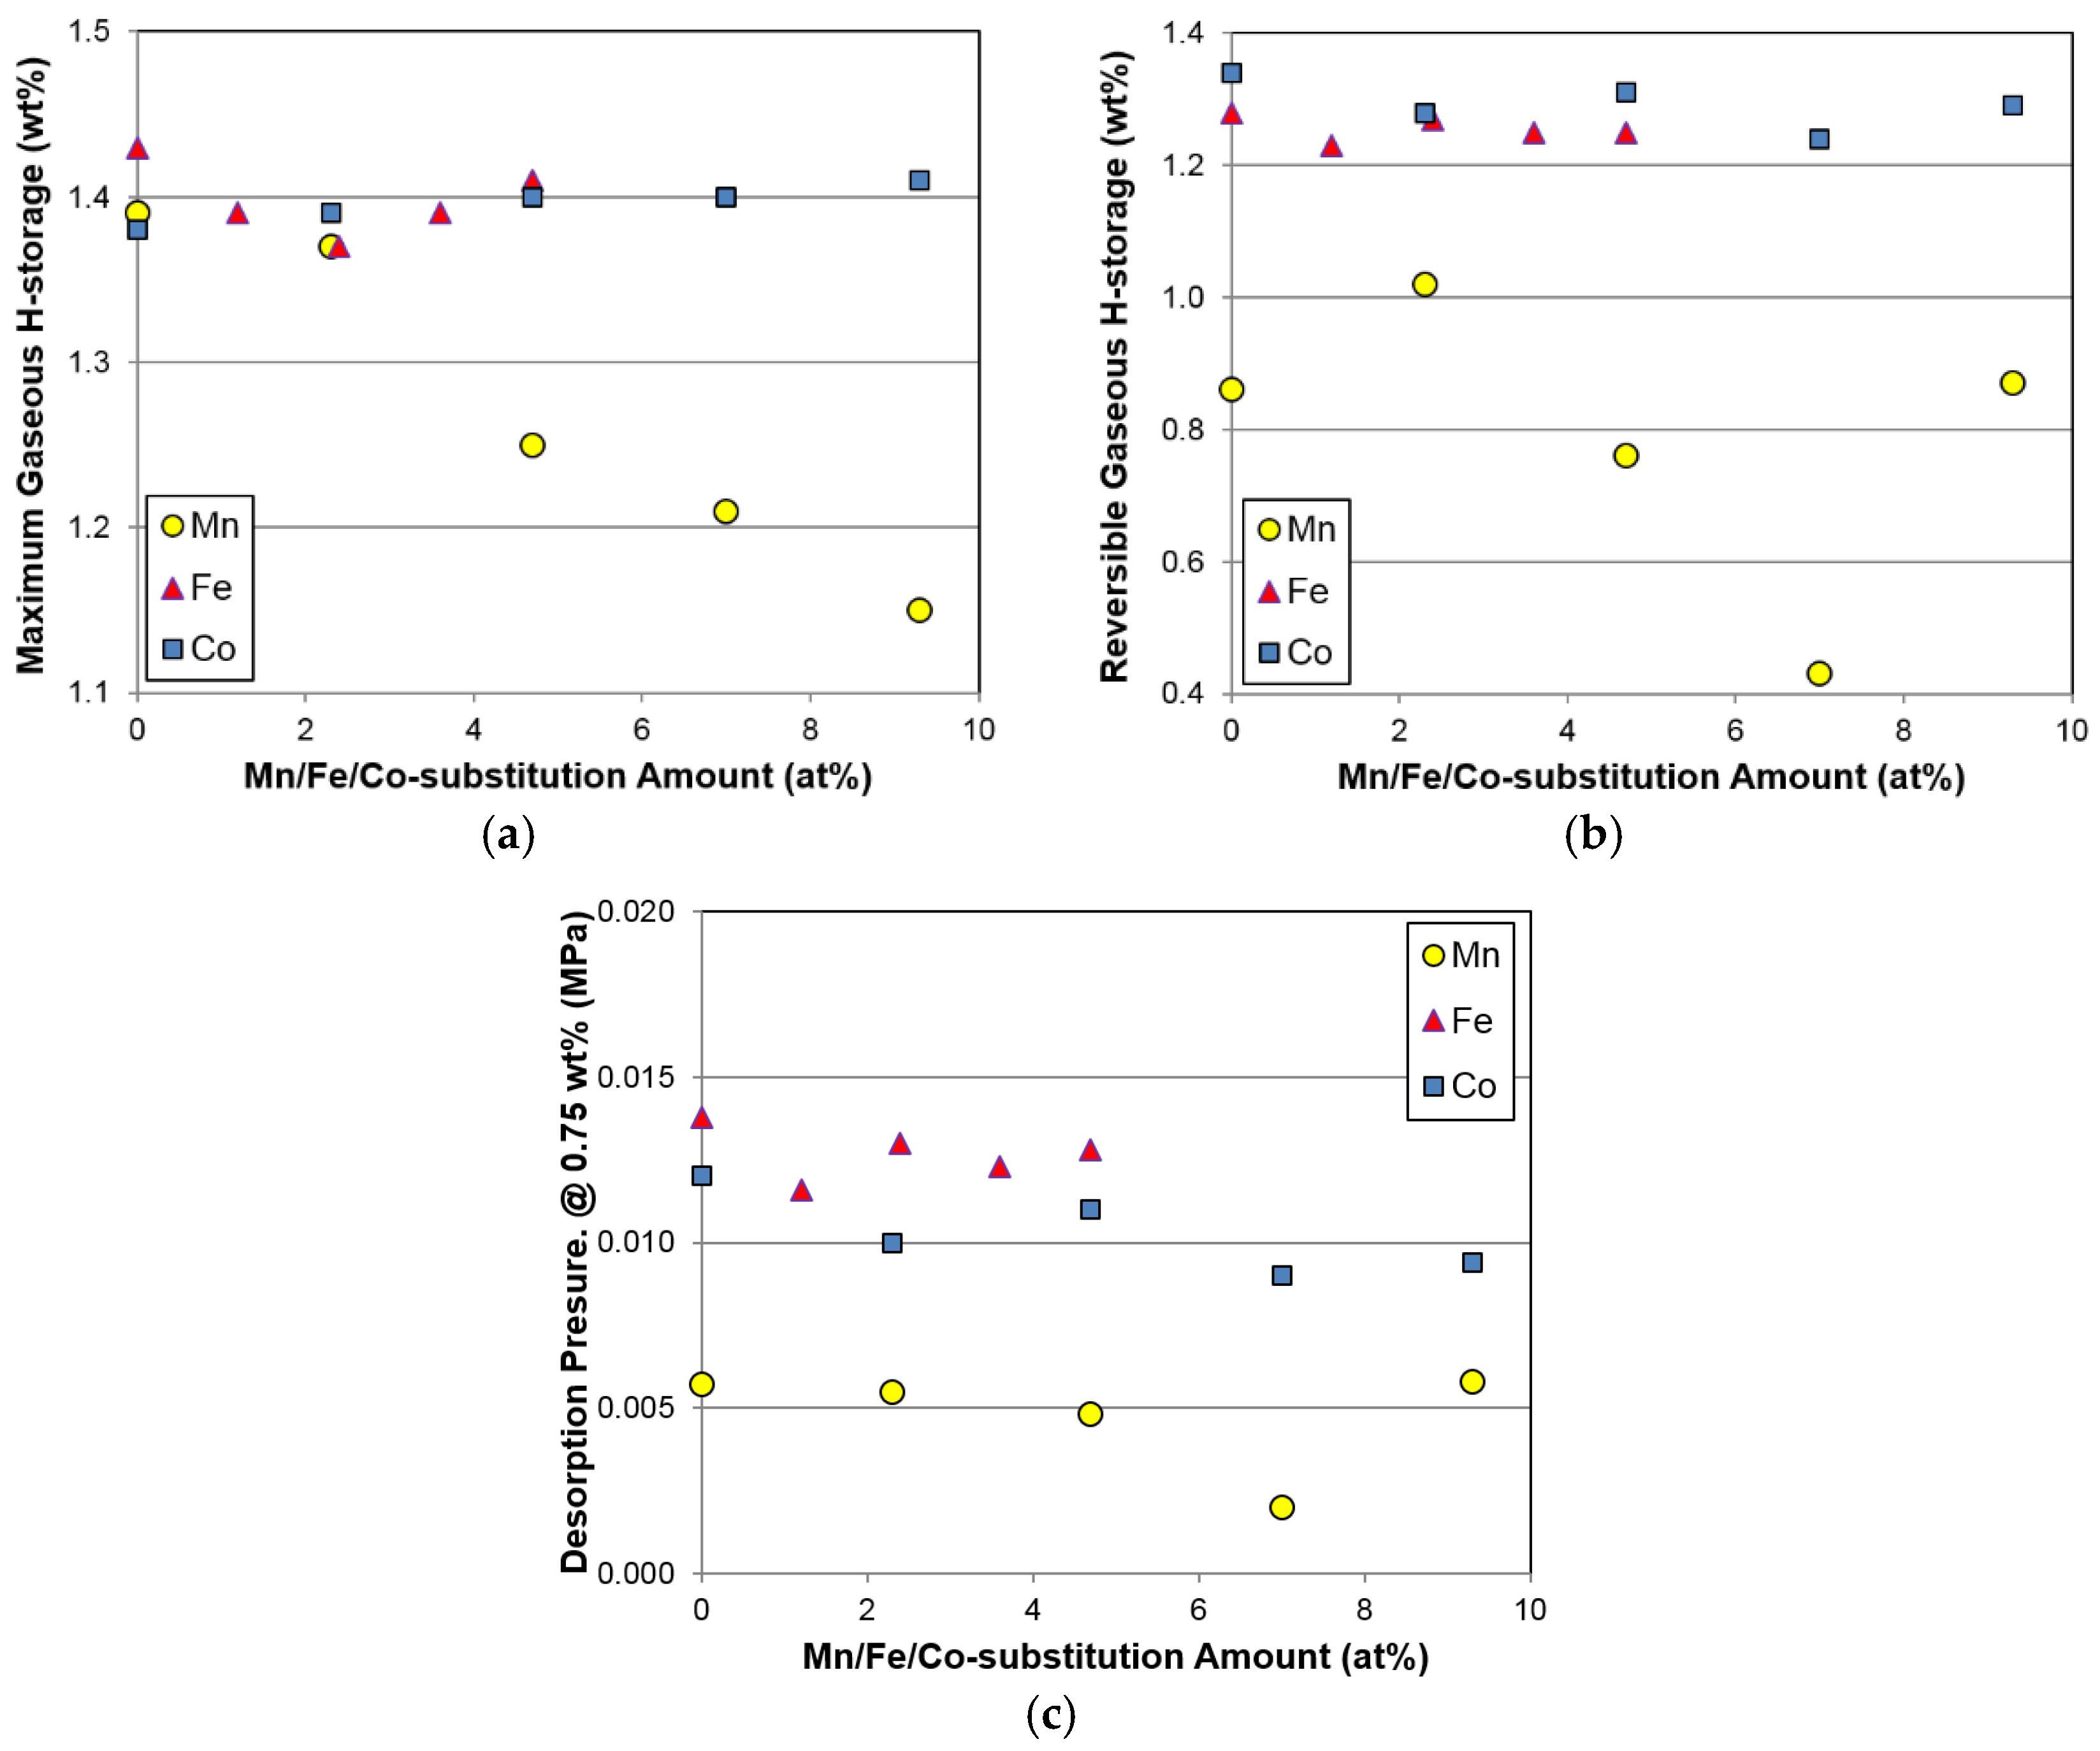
Table 4. Maximum H-storage at 30 °C decreases marginally and then increases slightly with increasing Fe content. Furthermore, changes in maximum and reversible H-storage with the Fe substitution are small, which again reflects similar results to Co substitution, but is unlike the results obtained with Mn substitution (
Figure 7a,b). Unexpectedly, increases in unit cell volume (
Figure 3) and abundance (
Figure 4a) of the main Ce
2Ni
7 phase with increasing Fe content do not increase the gaseous phase H-storage, suggesting that a synergetic effect between the main and secondary phases may dominate the H-storage performance in the Fe-substituted alloys. However, the exact mechanism is not clear at the present time.
Due to the multi-phase nature of the superlattice HAA, the plateau region of the PCT isotherm is not well defined. Therefore, the desorption pressure at 0.75 wt % H-storage is used instead of the plateau pressure in this study. Changes in desorption pressure at 0.75 wt % H-storage for the Fe-substituted alloys were very small, which is similar to what occurs with Co and Mn substitutions (
Figure 7c). Composition modifications with Al [
11] and La [
12] are more effective in changing the equilibrium pressure.
PCT hysteresis is defined as ln(absorption pressure at 0.75 wt % H-storage/desorption pressure at 0.75 wt %). PCT hysteresis is an indication of the elastic deformation energy needed to overcome the lattice expansion at the metal (α)-hydride (β) interface and has been used to predict the pulverization rate during hydride/dehydride cycling [
47]. Both PCT hystereses measured at 30 and 45 °C increase and then decrease with increasing Fe content. In addition, Fe-substituted alloys show smaller PCT hysteresis compared to the Mn- and Co-substituted alloys.
Slope factor (SF), defined as the ratio of the H-storage capacity between 0.005 and 0.2 MPa and the reversible H-storage, is related to the degree of homogeneity in the alloy. More specifically, a higher SF value corresponds to a higher uniformity and lesser degree of disorder in the alloy. For the Fe-substituted alloys, SF is independent of Fe content, and the SFs measured at 30 °C are lower than those at 45 °C. Addition of Fe does not alter the alloy homogeneity, which is similar to the case of Co incorporation [
9], but different from Mn incorporation, where a reduction in homogeneity was observed [
8].
Two thermodynamic parameters, the changes in enthalpy (Δ
H) and entropy (Δ
S), were estimated using the Van’t Hoff equation and the results are listed in
Table 4. With increasing Fe content, both Δ
H and Δ
S become more negative, indicating the formation of a more stable (involving stronger metal–hydrogen (M–H) bonding) and ordered hydride. Compared to the results obtained previously [
8,
9], the influences on both Δ
H and Δ
S from Fe are stronger than those from Co and Mn. If we only focus on the Fe-substituted alloys, we may reach the conclusion that with increasing Fe content, the unit cell volume of the main Ce
2Ni
7 phase increases, resulting in a more stable hydride. However, compared to the Fe-substituted alloys, the Mn-substituted alloys have larger Ce
2Ni
7 unit cells, but higher Δ
Hs. Therefore, the correlation between the structural properties and gaseous phase H-storage characteristics may be too convoluted to establish due to the complex and multi-phase nature of the superlattice alloys.
3.4. Electrochemical Analysis
The open-to-atmosphere half-cell configuration was used to measure the discharge capacities of the five alloys in this study. The dry-compacted electrode was charged with a current density of 100 mA∙g
−1 for 5 h, and it was then discharged initially with the same current density and followed by two pulls at 24 and 8 mA∙g
−1. These three discharge capacities were added, and the sum considered as the full discharge capacity measured at 8 mA∙g
−1. In order to examine the activation behaviors, full discharge capacities and HRDs (the ratio of the high-rate discharge capacity to the full discharge capacity) from the first 13 cycles for the five alloys in this study are plotted in
Figure 8. Compared to the capacity and HRD curves from the Mn- and Co-substituted alloys, Fe does not facilitate the formation process in the same manner as Mn and Co, which is possibly due to the relatively low solubility of Fe in alkaline solutions, as shown by the following comparison [
48]:
Achievable concentrations of soluble Mn and Co ions are higher than for soluble Fe ion, indicating that Mn and Co are more soluble compared to Fe and therefore contribute positively to the activation performance. Both the full and high-rate discharge capacities, together with HRD, are listed in
Table 5. A lower amount of Fe (≤2.3 at%) does not affect the capacity or HRD significantly, but a larger amount of Fe deteriorates both the capacities and HRD. Moreover, the reduction in discharge capacity does not correlate well with the relatively unchanged gaseous phase H-storage values (
Figure 7a,b).
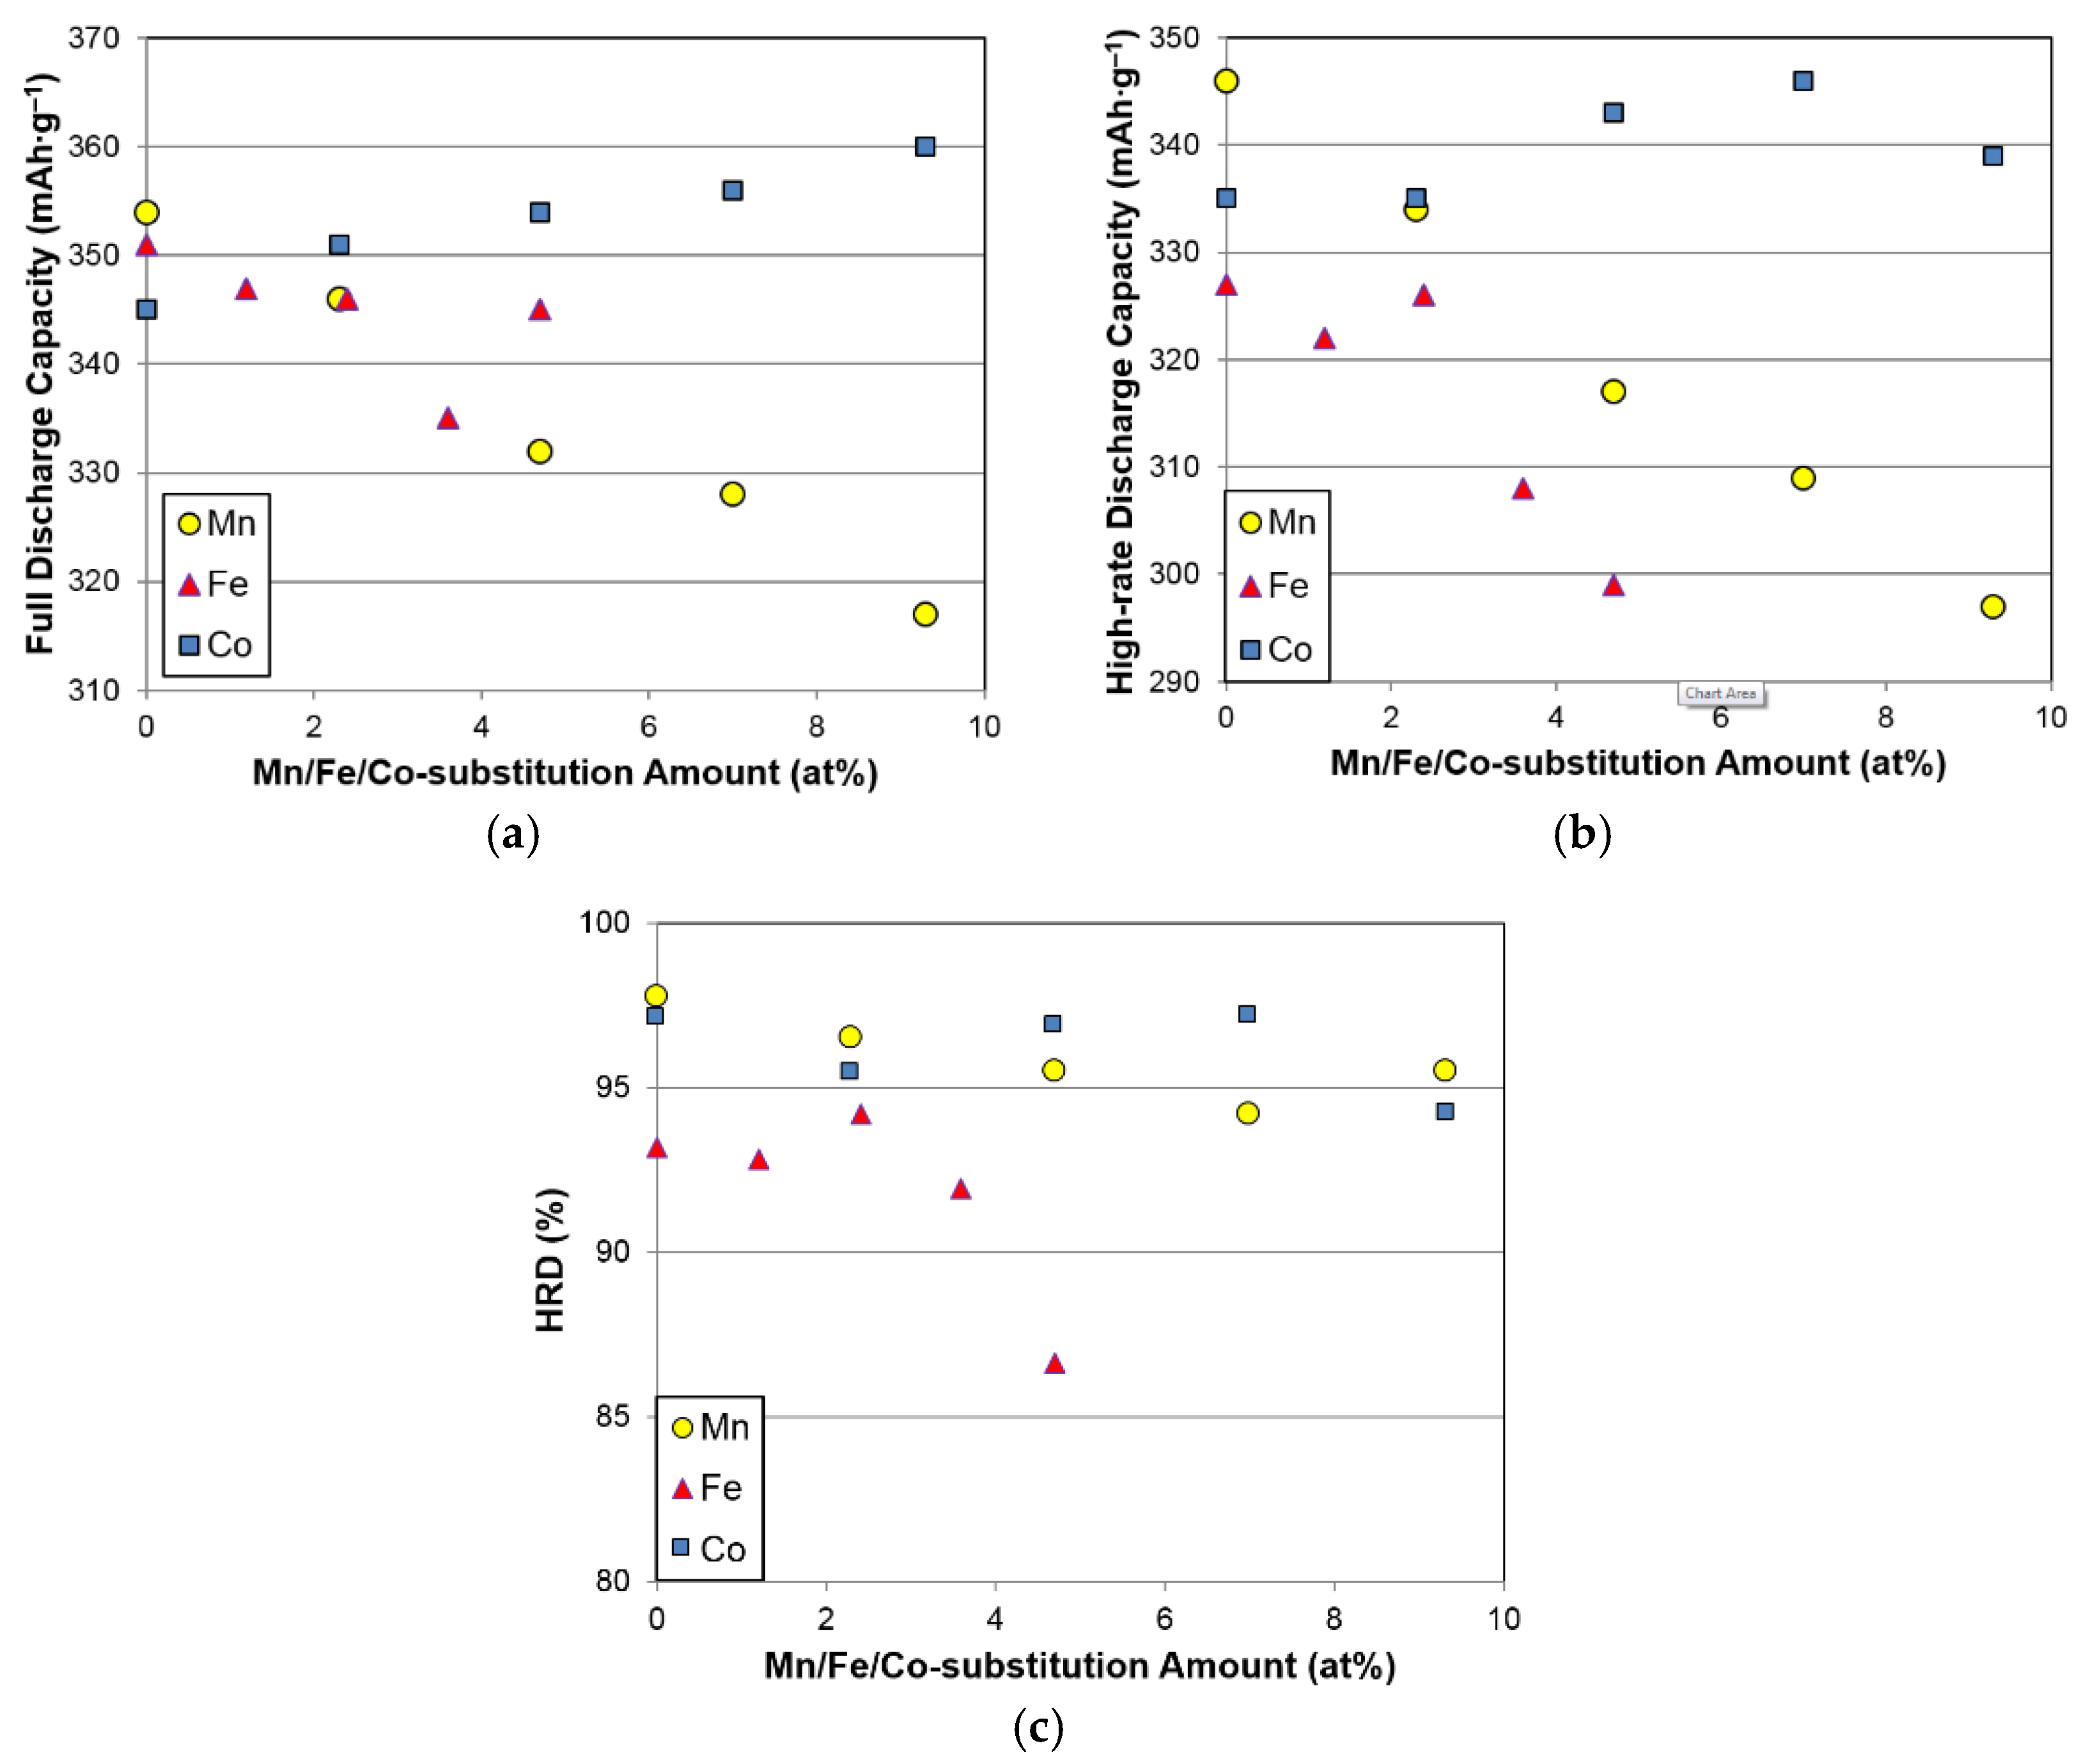
Changes in full capacity, high-rate capacity, and HRD with different substitution elements are compared in
Figure 9a–c, respectively. While Co substitution slightly improves both the full and high-rate capacities, Mn and Fe substitutions (>2.3 at%) decrease the capacities and HRD.
In order to trace the source of the degradations in electrochemical capacities and HRD, both the bulk hydrogen diffusion constant (
D) and surface exchange current (
Io) were measured electrochemically (a detailed methodology were reported in our earlier publications [
9,
49]), and the results are summarized in
Table 5. Since
D decreases monotonically from the initial measurements, while
Io decreases when the Fe content is greater than 1.2 at%, both bulk hydrogen diffusion and surface catalytic ability deteriorate with Fe incorporation. The decrease in
D may be due to a decrease in abundance of the AB
3 secondary phase, which decreases the synergetic effects and is an indispensable element in electrochemical H-storage in a multi-phase HAA system [
50,
51]. Similar to the case in the Laves phase-related bcc solid solution HAA system, where C14 (with stronger M–H bonding) serves as the catalytic phase for the bcc storage phase (with weaker M–H bonding) [
51], the AB
3 phase can also serve as the catalytic phase that contributes to the synergetic effects despite the fact that it has stronger M–H bonding (judging from its lower B/A ratio compared to the main A
2B
7 phase). By reducing the AB
3 phase abundance through Fe incorporation, the synergetic effects are lowered and, consequently, the hydrogen diffusion in the alloy bulk is impeded. Furthermore, the observed decrease in
Io may be caused by the differences in alloy surface created by addition of Fe, which will be further investigated in the next section. From the observations of
D and
Io, it can be concluded that both poor bulk diffusion and surface reaction properties are responsible for the decrease in HRD seen with Fe incorporation. Changes in
D and
Io with different substitution elements are compared in
Figure 10, and both Mn and Fe result in deterioration, but Co improves the bulk hydrogen diffusion and surface electrochemical reaction.
Overcoming low-temperature performance (especially at −40 °C) in Ni/MH batteries has always been a very challenging task [
52]. We have consistently chosen the AC impedance measurement as the main tool for investigating the −40 °C electrochemical reaction [
53,
54]. Details regarding the experimental setup can be found in our earlier publications [
55,
56]. Surface charge-transfer resistances (
R) and surface double-layer capacitances (
C) obtained from the Cole–Cole plots measured at both room temperature and −40 °C are summarized in
Table 6. In general,
Rs and
Cs measured at room temperature and −40 °C increase with increasing Fe content. An increase in the reactive surface area (proportional to
C) with Fe incorporation was also reported for the AB
2 [
21] and AB
5 HAAs [
29]. However, the contributions of Fe to
R vary for the AB
2 [
21] and AB
5 HAAs;
R decreases in AB
2 [
21], but increases in AB
5 [
34]. The
RC product has been previously used to characterize the surface catalytic ability [
29,
34]. With increasing Fe content, the
RC product increases in the current study and for the AB
5 HAA [
34], but it decreases with the AB
2 HAA [
29], which suggests that Fe incorporation impedes the surface electrochemical reaction of A
2B
7 and AB
5, but facilitates that of AB
2.
R,
C, and
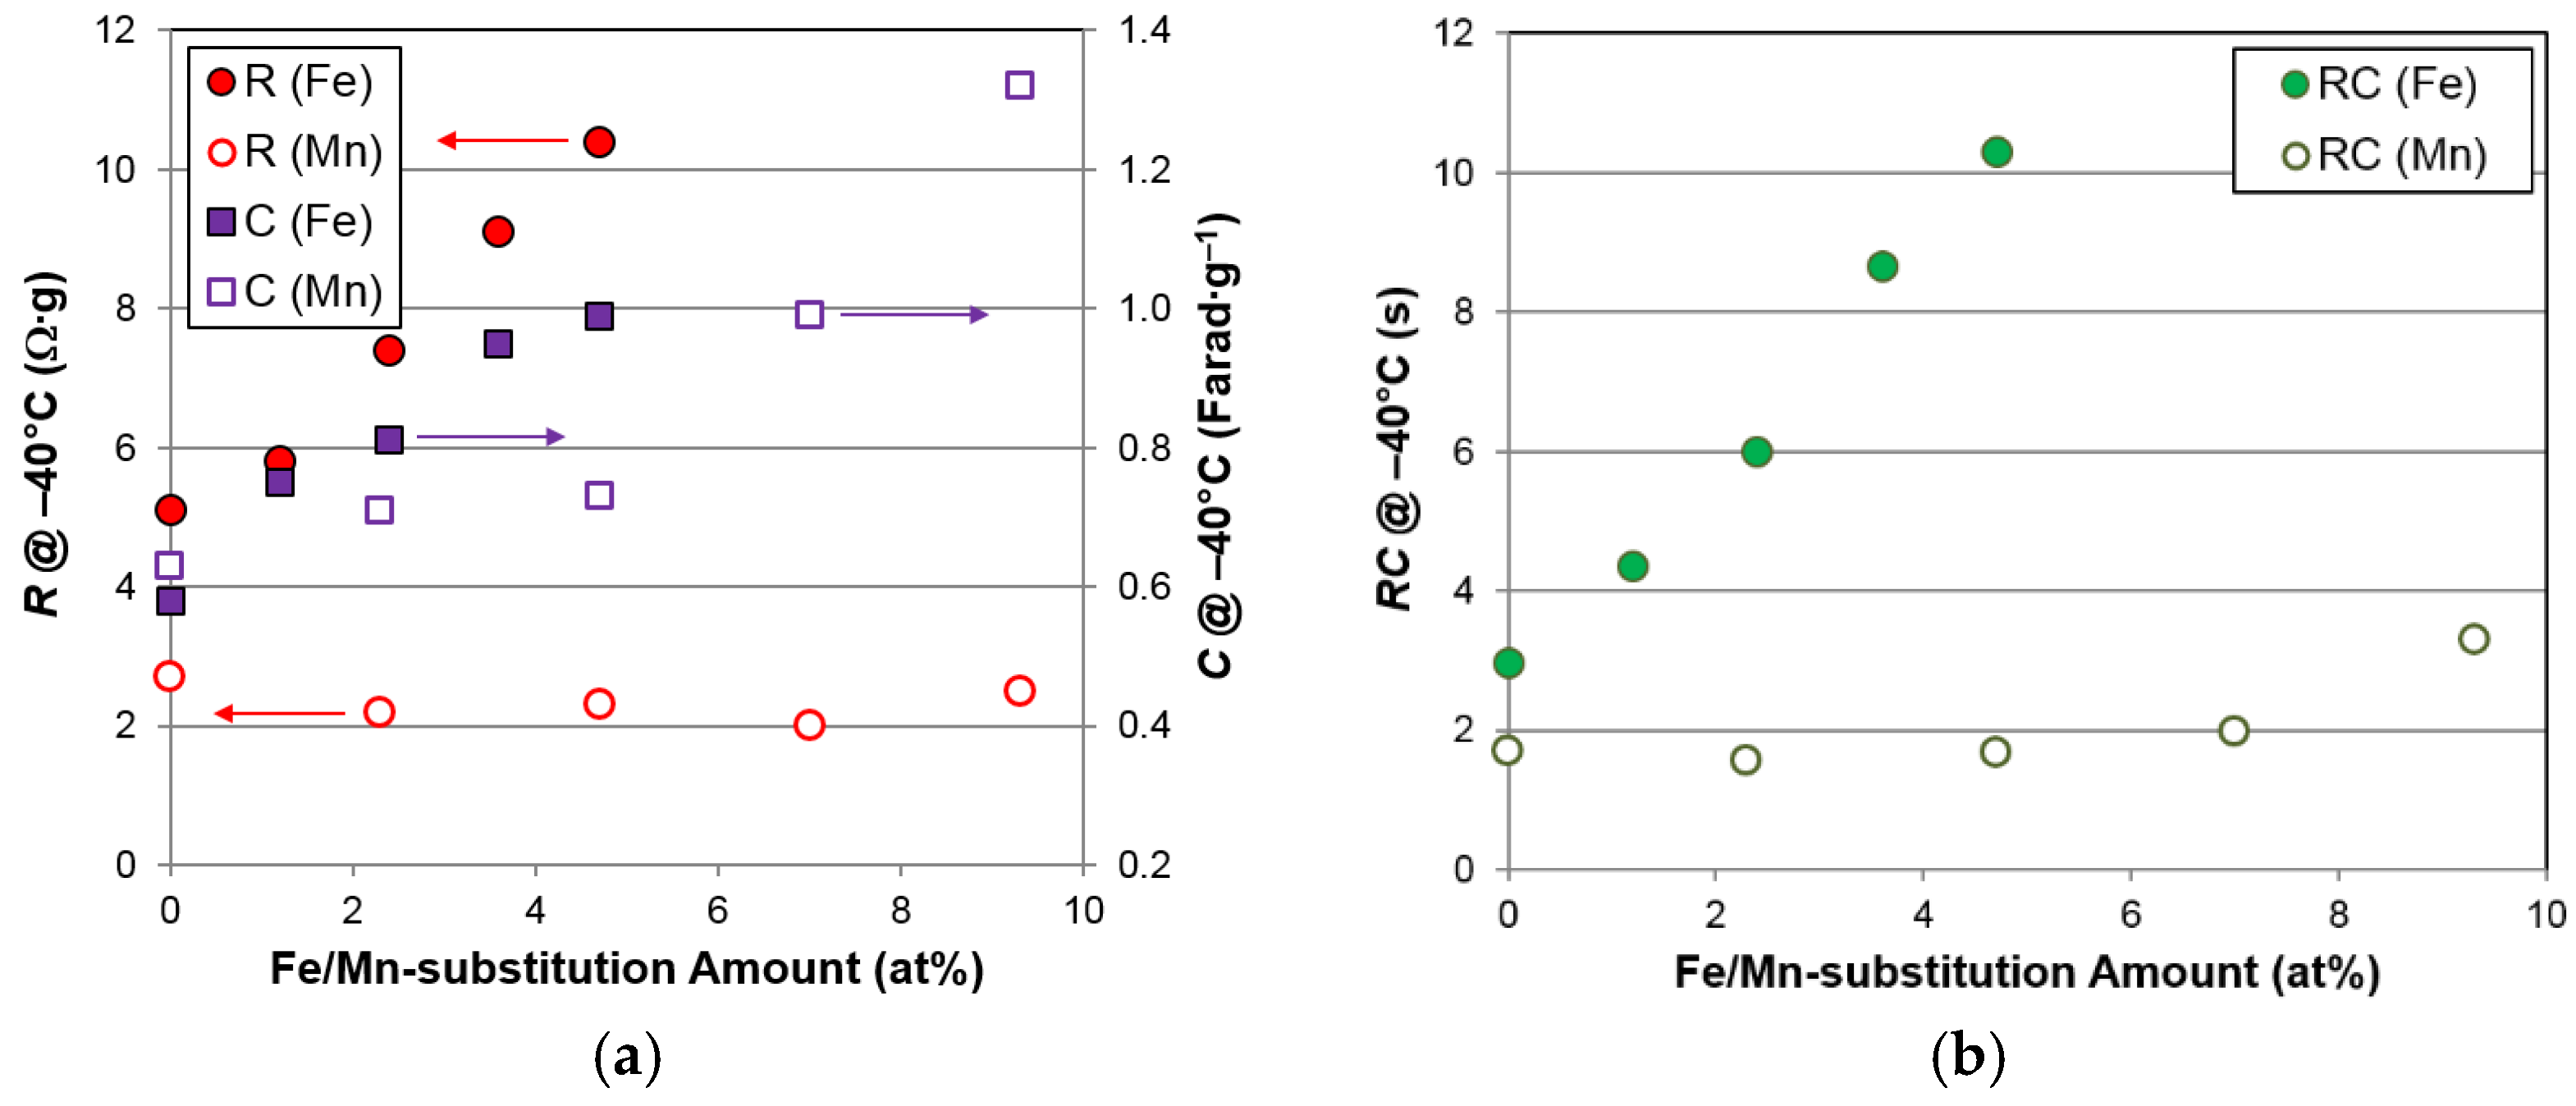
RC measured at −40 °C for the Fe- and Mn-substituted superlattice alloys are compared in
Figure 11. Although Fe promotes an increase in the surface area more effectively than Mn, the resistances of Fe-containing alloys are much higher than those of the Mn-containing alloys, due to the loss of surface catalytic ability with Fe incorporation, as indicated by the
RC plot in
Figure 11c.
3.5. Magnetic Properties
The source of degradation in the surface catalytic ability for the Fe-containing superlattice HAAs was further investigated using magnetic susceptibility measurements. Due to the large difference (more than seven orders of magnitude) in the saturated magnetic susceptibilities (
MS) of elemental Ni and Ni in HAA,
MS has been used to estimate the total volume of the metallic Ni clusters imbedded in the surface oxide formed during activation [
57]. This measurement has been successfully correlated to HRD of HAA [
58]. Moreover, the strength of the applied magnetic field corresponding to half of the
MS value (
H1/2) is inversely proportional to the magnetic domain size and used as an indicator of the size of metallic clusters in the surface oxide [
59]. Both the
MS and
H1/2 values obtained from the five alloys in this study are listed in
Table 6 and plotted with the data from Mn- and Co-substitution studies [
8,
9] in
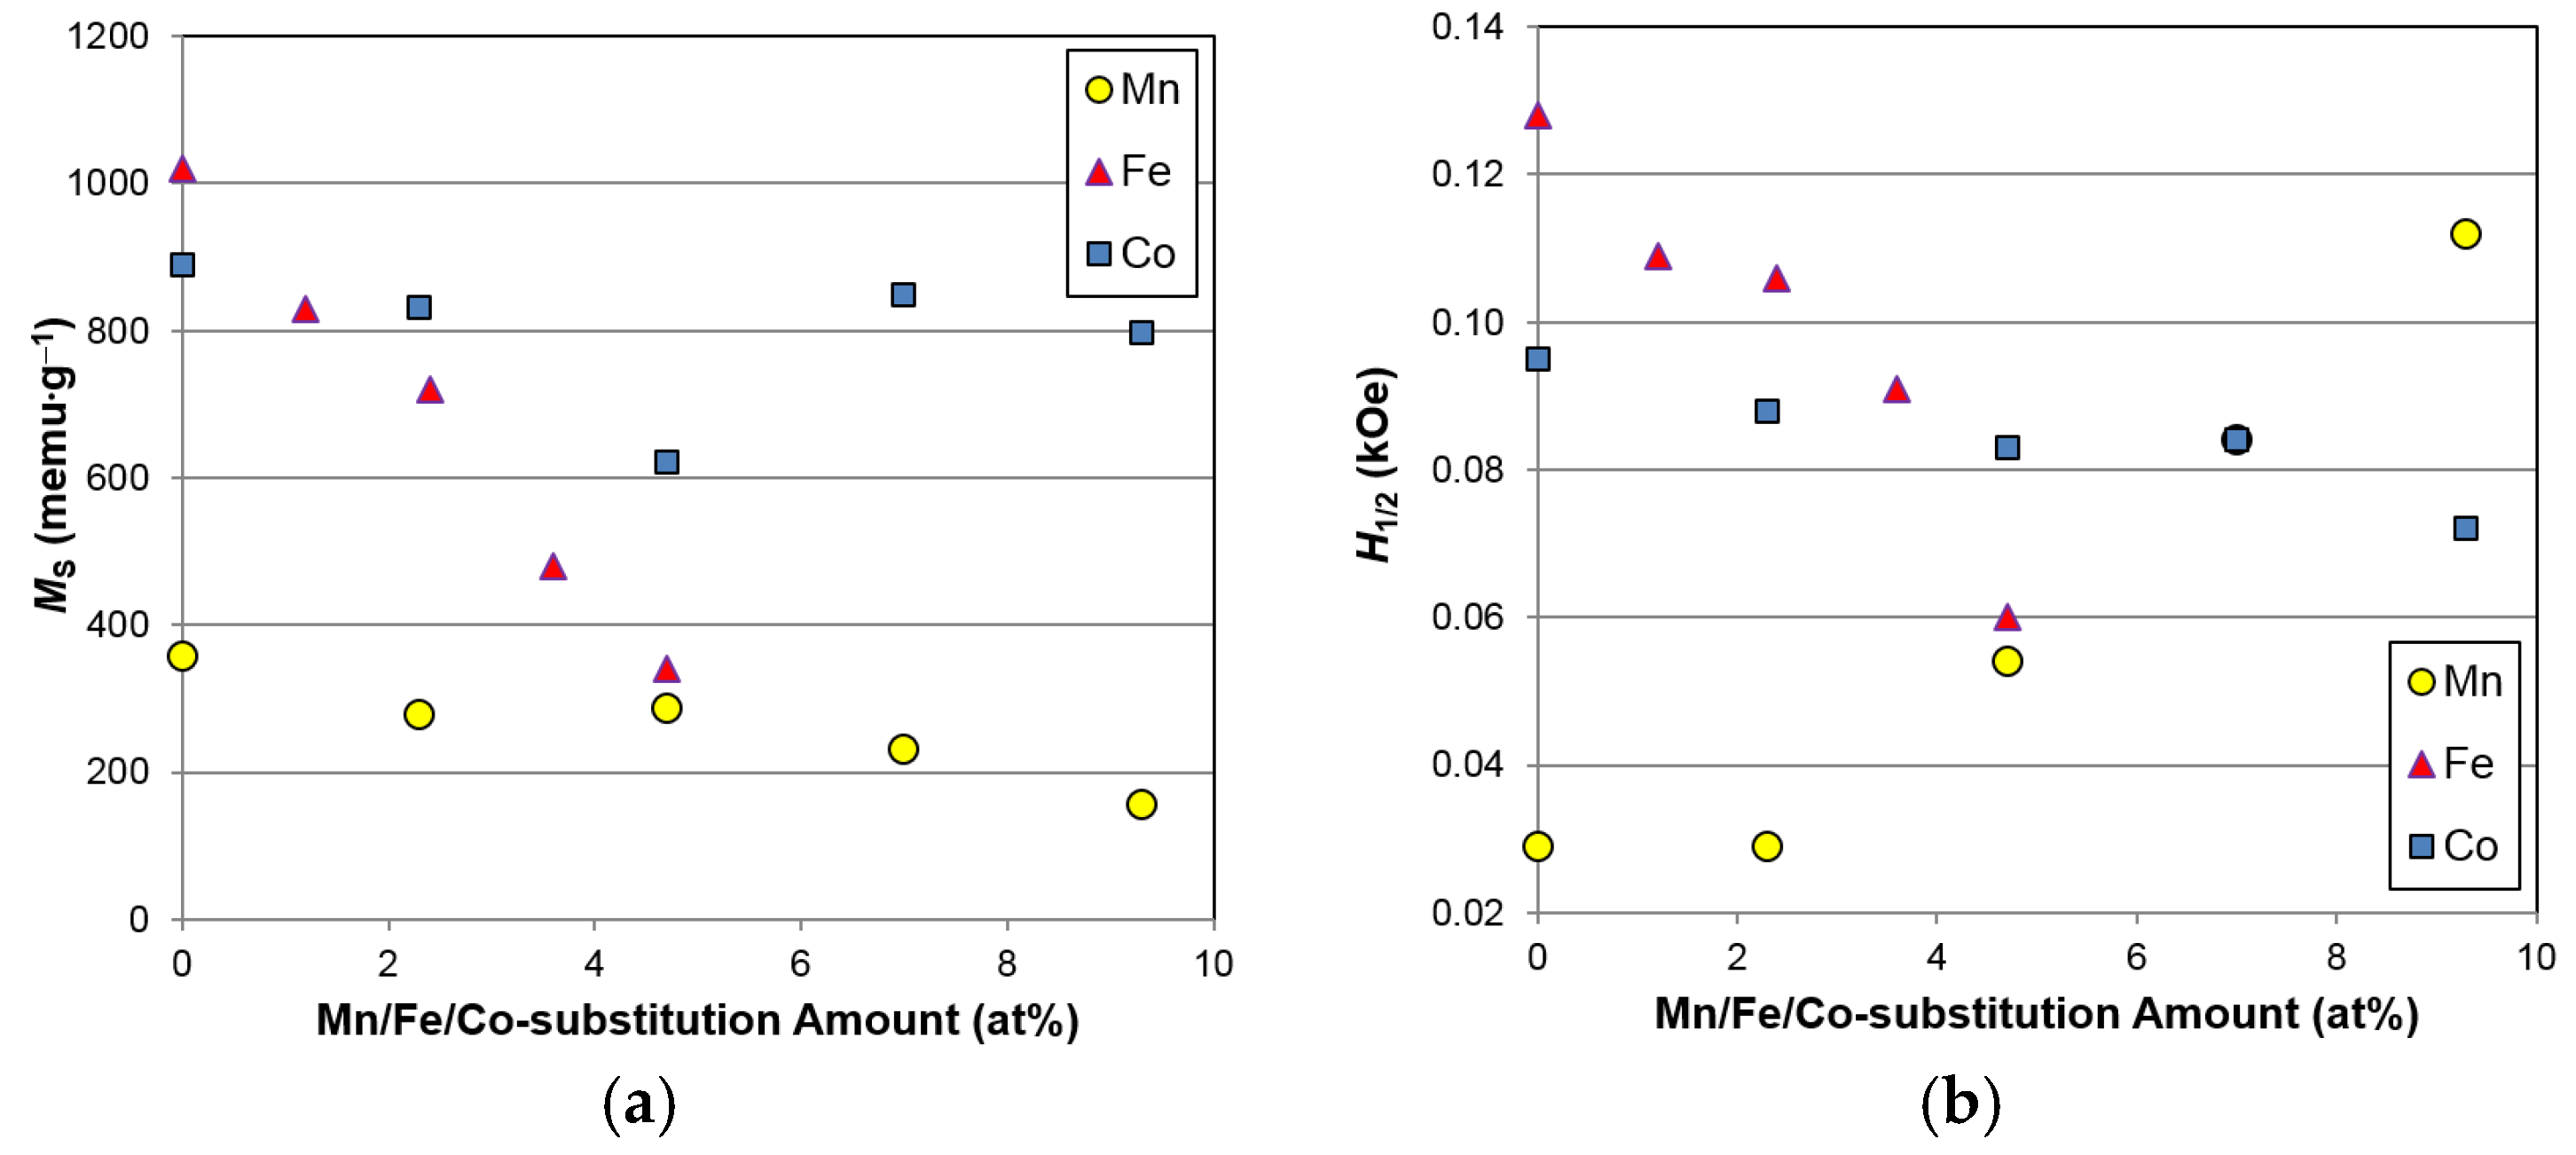
Figure 12. With increasing Fe content, both
MS and
H1/2 decrease, suggesting that Fe incorporation decreases the total volume and surface area of catalytic Ni clusters, judging from the increase in cluster size indicated by the reduction in
H1/2. The reduction in the amount of catalytic Ni clusters in the surface oxide for the Fe-containing alloys explains the observed decreases in surface catalytic ability, as indicated by the increase in
RC in
Figure 11c and the surface reaction current (
Figure 10b), causing the deterioration in HRD (
Figure 9). In addition, the
MSs of the Mn- and Co-containing alloys are slightly lower than those seen in the base alloy (free of Mn and Co), which suggests that the amount of Ni in the alloy composition correlates closely to the amount of metallic Ni in the surface oxide after activation. Partial replacement of Mn, Fe, and Co for Ni may benefit several electrochemical properties, but certainly deteriorate the high-rate and low-temperature performances due to the reduction in amount of surface catalytic Ni clusters. Interestingly, it was also observed that both
H1/2 and the AB
3 phase abundance demonstrate similar trends (
Figure 4b and
Figure 12), and such correlations will be verified in the future.
