Variable Porous Electrode Compression for Redox Flow Battery Systems


School of Mechanical and Manufacturing Engineering, University of New South Wales, UNSW, Sydney 2052, Australia
*
Author to whom correspondence should be addressed.
Batteries 2018, 4(4), 53; https://doi.org/10.3390/batteries4040053
Submission received: 28 September 2018
/
Revised: 16 October 2018
/
Accepted: 19 October 2018
/
Published: 22 October 2018
(This article belongs to the Special Issue Vanadium Redox Flow Battery and Its Applications)
Abstract
:Vanadium redox flow batteries (VRFBs) offer great promise as a safe, cost effective means of storing electrical energy on a large scale and will certainly have a part to play in the global transition to renewable energy. To unlock the full potential of VRFB systems, however, it is necessary to improve their power density. Unconventional stack design shows encouraging possibilities as a means to that end. Presented here is the novel concept of variable porous electrode compression, which simulations have shown to deliver a one third increase in minimum limiting current density together with a lower pressure drop when compared to standard uniform compression cell designs.
1. Introduction
The global economy is shifting towards renewable power generation, both on a cost basis and as a means of addressing anthropogenic climate change from greenhouse gas emissions. The limitation now being faced by electricity providers is finding suitable methods of storing this energy on a large-scale. Batteries are emerging as a key player in this field [1], offering rapid response to grid fluctuations as well as significant load-shifting capability and quick installation. Vanadium redox flow batteries (VRFBs) are particularly suited to this in industrial and utility scale applications [2] at megawatt (MW) levels due to their nature as an inherently scalable technology that utilizes tanks of liquid electrolyte. In addition to the ability to de-couple power and capacity, VRFBs are safe and long-lasting.
While energy is stored in tanks for VRFB systems, power conversion occurs inside stacks of cells composed of two half-cells divided by a separator of ion-selective membrane and linked with bipolar electrodes. The half cells are usually composed of conductive porous carbon felt electrodes. The ions of active material, vanadium in a VRFB, are converted to different oxidation states during charge and discharge [3] as the electrolyte flows through these electrodes under an applied current. This process requires adequate delivery of reactants to maintain elevated power densities, particularly at the extremes of the battery’s State of Charge (SOC). Mass-transport limitations within the cell, predominately towards the outlet and current collectors, can result in material degradation if current and flow rate are not regulated appropriately. This limits the power density of Redox Flow Battery (RFB) systems [3,4].
The power generated by a battery stack is the product of the current and the voltage. The voltage of a cell, Vcell, is described below in Equation (1) [3]:
The phenomenon discussed above is known as concentration polarization. The concentration overpotential, , can become the dominant term in this situation. The limiting current density, , is then be expressed as shown in Equation (2) [4]:
where the local mass transfer coefficient is a function of velocity, , as shown in Equation (3) [4]:
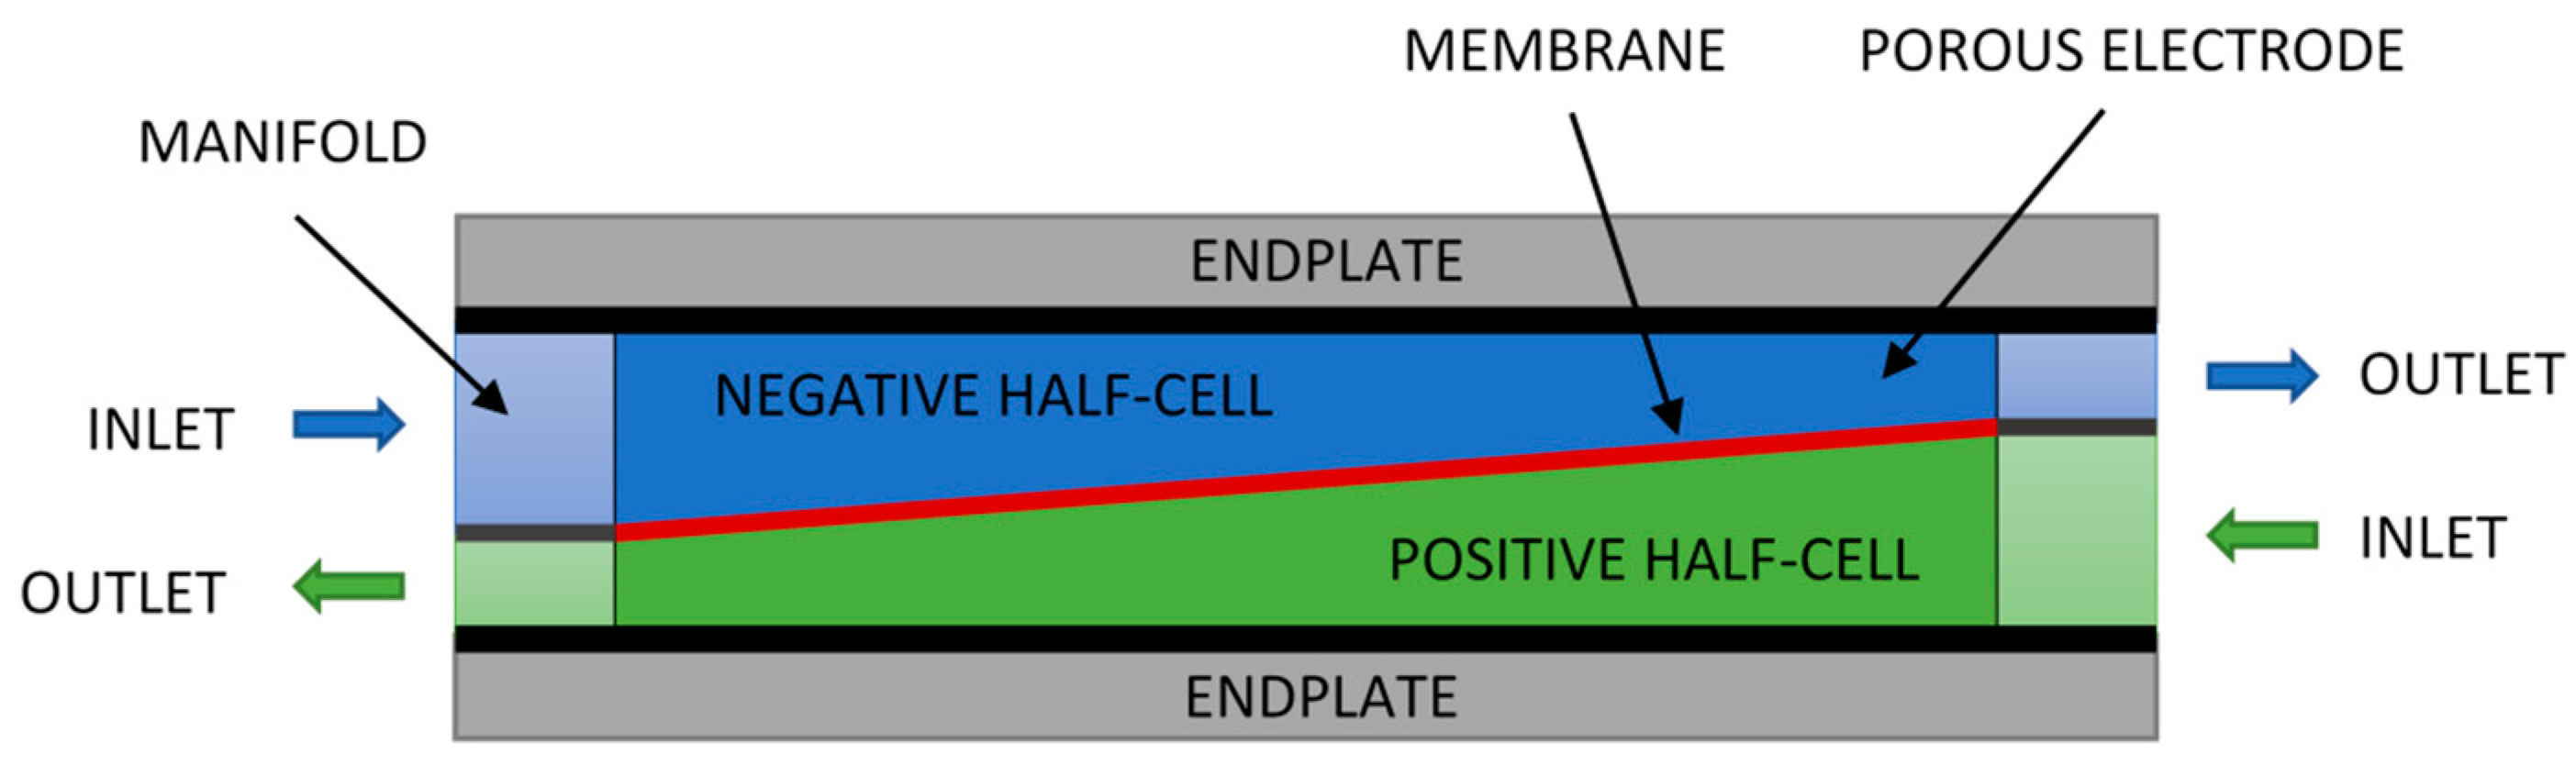
Variable porous electrode compression is proposed here to address this issue. With this novel geometry, the velocity of the electrolyte would increase as it flows through the cell, improving the delivery of reactants as they are depleted/converted. Figure 1 provides a visual representation of this concept.
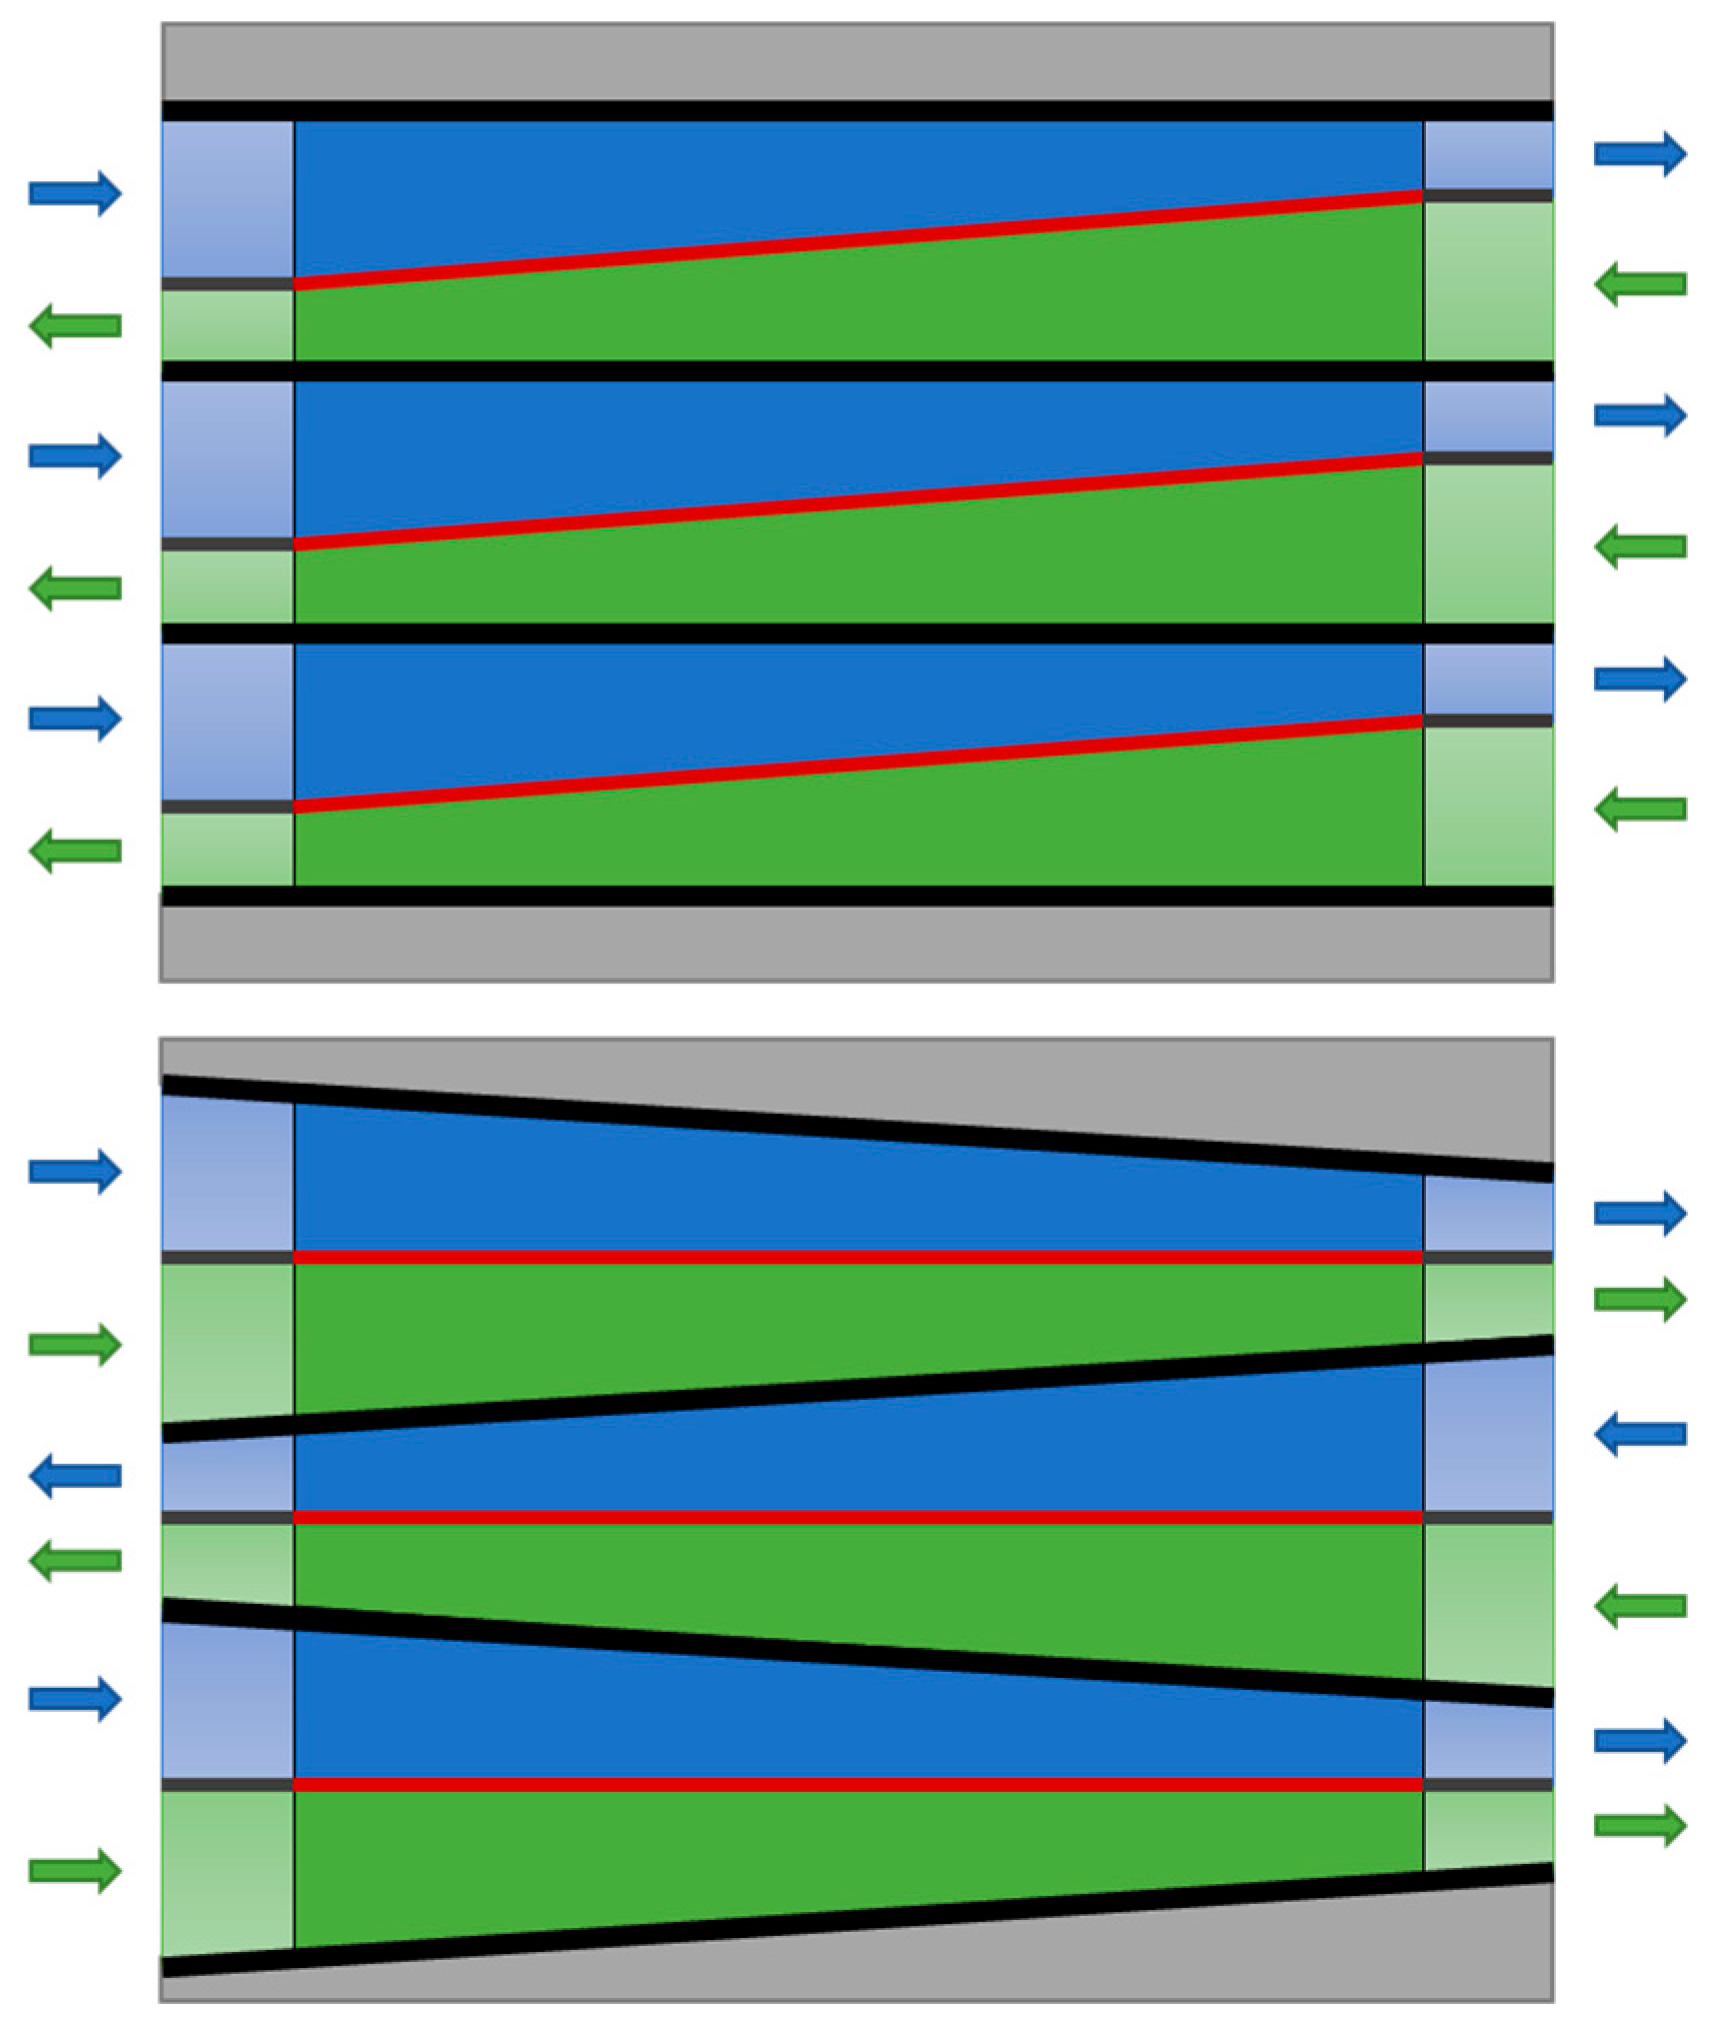
Compressing porous electrodes has been demonstrated to improve their electrical properties, increasing their conductivity, however this comes with hydraulic penalties as the permeability is reduced. Thus, a compromise is required between electrochemical performance and the parasitic pump energy required due to overcome pressure losses. Varying the compression through a cell can reduce the pressure drop while improving the electrolyte behavior under limiting conditions. Two possible methods of stacking these cells to create higher voltages are shown in Figure 2.
Numerical modelling and simulation is an essential tool for the analysis of RFB systems, allowing researchers to investigate the flow of electrolyte within VRFB cells. Coupled hydraulic and electrochemical models have been developed and applied in this field since 2008, when Shah and co-workers began publishing their dynamic two-dimensional models [5,6,7]. A number of groups have built on this research in various formats for a range of purposes, beginning with the simplified stationary model published by You et al. [8]. Ma and co-workers applied this to a three-dimensional format [9] and others incorporated additional considerations such as vanadium crossover and water transport through the membrane [10].
These models have been applied to simulate different cell geometries and electrode configurations, including serpentine flow fields [11,12,13] as well as circular and trapezoidal electrode geometries [14,15]. Research presented here builds on this body of work by applying a validated model [8] to simulate variable felt compression with published porous electrode data [10,16,17]. Results show a significant improvement over conventional geometry.
2. Results
Four cases were simulated in this study, three under conventional uniform compression (Cases 1 to 3) and one applying variable reducing compression (Case 4), for the range 0 to 30%. Single cells of various dimensions at 90% SOC were charged at 160 mA cm−2 with a flowrate set at 10 times the stoichiometric requirement. Key values for each case at 40 cm2 are summarized in Table 1.
Minimum reactant (V3+) concentration, limiting current density and differential pressure were calculated for the negative half-cell only. The voltage was calculated between the electrode boundaries for the full cell.
2.1. Reactant Concentration and Limiting Current Density
As outlined in the introduction, depletion of reactants in the cell is a key concern for optimizing flow battery performance. Focusing on the negative half-cell during charging, this means assessing the concentration of V3+ ions. If this drops to zero, the energy from the applied current will start to decompose the water and the materials that make up the cell. This is hazardous, particularly with respect to hydrogen gas generation, and can also reduce the lifetime of the battery. Figure 3 provides a graphical representation of the minimum reactant (V3+) concentration alongside the pressure drop over the half-cell.
As expected, the minimum reactant concentration correlates well with the limiting current density, as shown in Figure 4. These figures, together with Table 1, show the variable reducing configuration, reducing local reactant depletion and raising the minimum current density for a similar pressure drop when compared to 15% uniform compression.
Depletion of reactants is a concern, even when the bulk concentration is well above zero. There must be enough ions available to supply the porous electrode at the micro scale. When the reactant concentration falls, a higher velocity is required to maintain the reaction kinetics. As such, the limiting current density is a function of both the concentration and velocity.
2.2. Effect of Cell Dimensions
Relative improvements were found to be independent of active area after simulating cells of 10, 25, 40, 50, and 100 cm2. Reduction in pressure drop, however, correlated with the ratio of cell length to width as expected i.e., the effect was reduced in a shorter, wider cell for the same area. Results are shown for 40 cm2 cells below in Figure 5.
3. Discussion
While the improvement generated by the novel geometry is small in absolute terms on this scale, the relative improvement suggests that the benefit could be significant at a large scale by optimizing a stack design with this approach. For example, the 6 mA cm−2 increase shown here applied to a 40 × 1500 cm2 cell VRFB stack at 1.7 V per cell equates to 0.6 kW. This is 12% of a 5 kW nominal power rating [4] for the stack. Comparing the variable compression results in relative terms shows a significant gain. Key values from this study are shown below in Table 2.
Figure 6 shows the limiting current is lowest near the electrode boundary in both the conventional configuration and the new variable design. This suggests there is value of exploring other novel electrode geometries to address this phenomenon as a possible avenue for further research in this field.
Taken together, the results from this research suggest that this concept is worthy of further investigation. Figure 6 shows the limiting current density at the inlet region is higher in Case 4 due to the negligible compression in the region. Additional parametric studies with more porous electrode data may find that the design would benefit from increased compression overall—particularly as zero compression generates a high cell resistance, although this is only the case at the inlet boundary. Optimization would likely deliver the enhanced electrochemical performance of standard 25% compression while significantly reducing the pressure drop across the cell.
4. Materials and Methods
Governing equations were applied in this work based on the approach developed by Shah et al. [5] and You et al. [8]. Ion flux is described by the Nernst-Planck equations and the Butler-Volmer law is used to define electrode reaction kinetics, while Darcy’s law was applied to give the velocity in the porous electrode. Some elements of the model were taken from Knehr et al. [10] in relation to fluid parameters and the treatment of the boundaries between the membrane and electrodes.
As described by You et al., and later by Zheng et al. [18], this work examines only selected SOC values using a simplified, stationary, two-dimensional model rather than implement a transient model. Overall cell SOC is defined as:
Inlet concentrations are then defined as a function of initial vanadium concentration, , as follows:
The model was solved using the finite element method with software package COMSOL Multiphysics. A combination of interfaces was used to implement the convection-diffusion, general-form, and ordinary differential equations. Mapped meshes with 3320 elements biased towards the outlet and current collector boundaries were used throughout, after a mesh refinement study showed values for concentration and velocity converged at this configuration.
Data published by Park et al. [16] for carbon felt electrodes at various states of compression was used for electrical conductivity and porosity parameters, as shown below in Table 3.
These values were entered as interpolation definitions in COMSOL. Porous electrode properties for porosity and conductivity were then defined as a function of local compression, based on position on the x-axis between the inlet and outlet, as shown below in Figure 7.
Except where stated elsewhere, the general parameters shown in Table 4 were applied.
The electrolyte is assumed to have constant physical properties. Key parameters are shown below in Table 5. The Carmen-Kozeny equation was used to define the permeability of the electrodes as a function of porosity.
Electrochemical properties used are summarised in Table 6 for reference. A Bruggeman correction was applied to diffusion coefficients and electrical conductivity parameters.
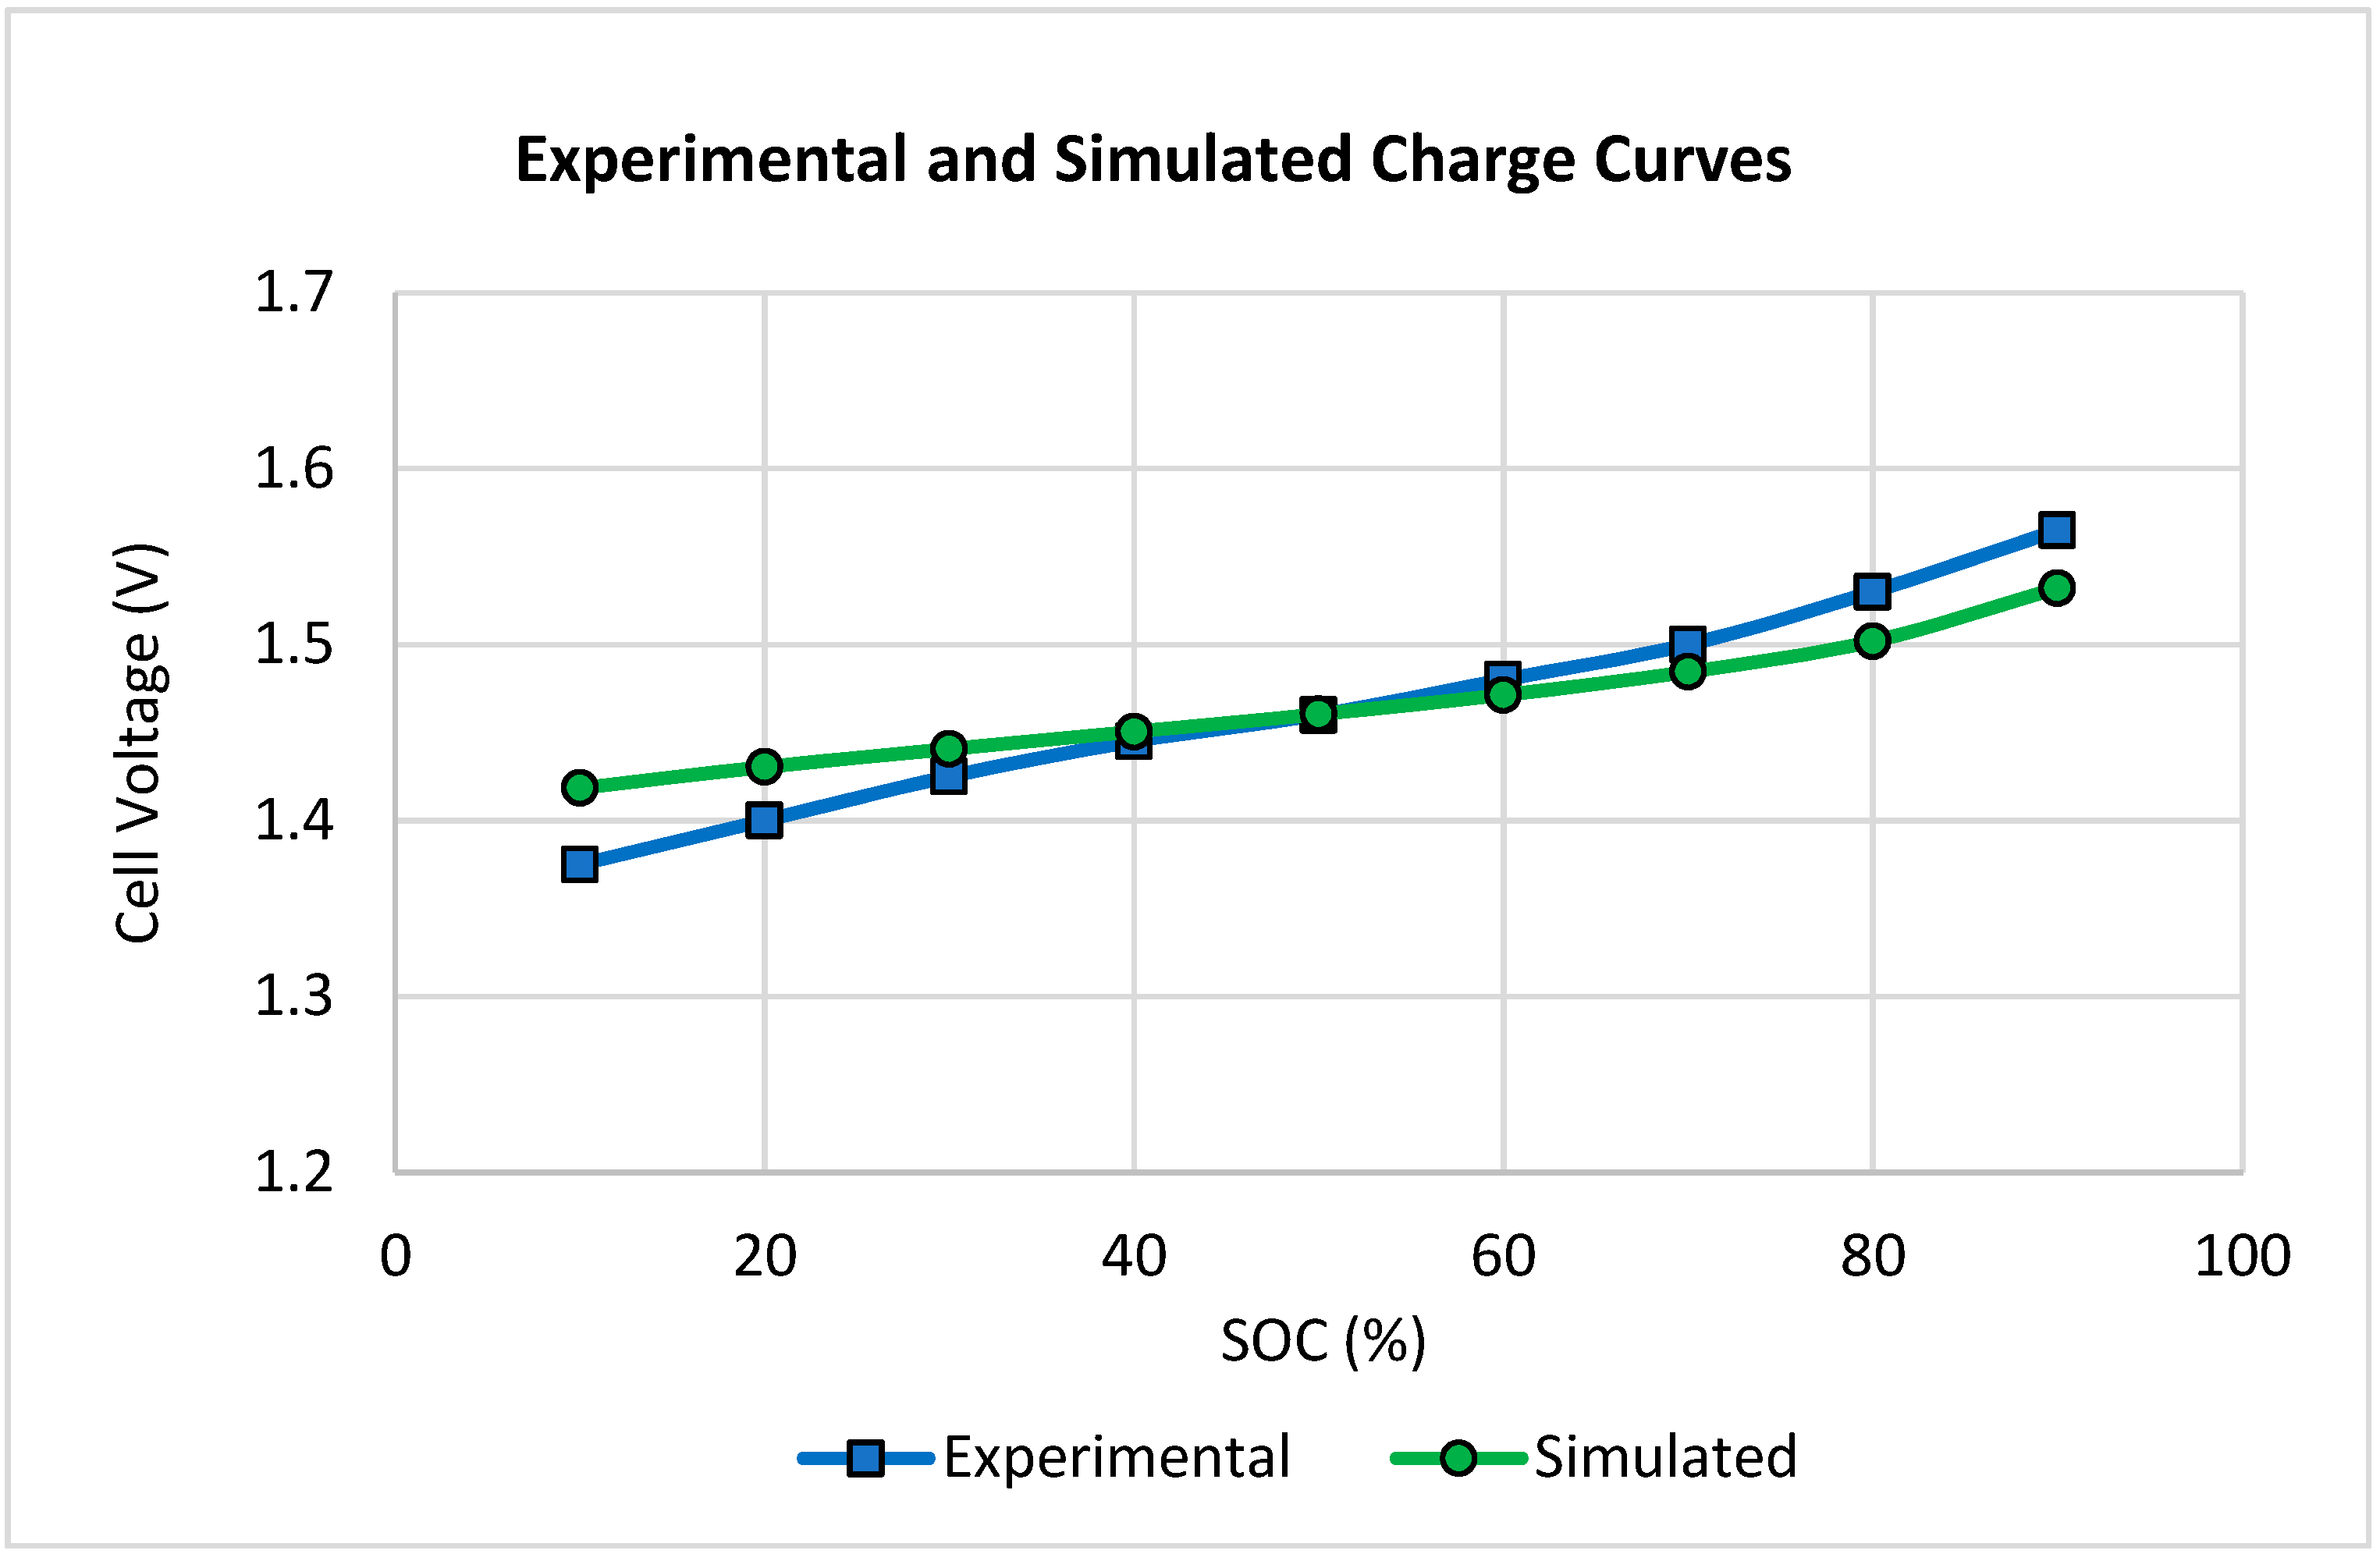
The model implemented here with parameters defined by You et al. [8], including a 140 mV voltage correction for considerations not included in the simplified model such as contact resistances, showed good agreement with the experimental data published in their work. Experimental and simulated charge curves for the range 10 to 90% SOC are shown in Figure 8 below.
The maximum error was 3.2% at 10% SOC, the minimum 0% at 50% SOC, and the average 1.4%. This is acceptable for this application, and hence the model is considered to be validated in this context.
The remainder of the analysis was conducted using simulations with inlet concentrations fixed at 90 % SOC. Performance parameters were obtained through post-processing in COMSOL. Derived values were introduced to provide the minimum V3+ concentration and limiting current density over the negative electrode cross-section. In the case of limiting current density, this was defined using Equations (2) and (3) as introduced earlier in this article. A boundary probe was used to obtain the electric potential on the current collector boundary on the positive half-cell. This boundary is defined with an electrode current boundary condition set at the applied average current density, while the negative is defined as electric ground. Differential pressure was obtained by subtracting the average absolute pressure at the inlet from the absolute pressure at the outlet boundary.
Author Contributions
Author contributions were as follows; conceptualization, N.G. and C.M.; methodology, N.G.; software, N.G.; validation, N.G.; formal analysis, N.G.; investigation, N.G.; resources, C.M.; data curation, N.G.; writing—original draft preparation, N.G.; writing—review and editing, C.M. and V.T.; visualization, N.G.; supervision, V.T. and C.M.
Funding
The first author acknowledges the support of an Australian Government Research Training Program (RTP) Scholarship.
Conflicts of Interest
Authors Nicholas Gurieff and Chris Menictas declare a professional relationship as colleagues of guest editor Maria Skyllas-Kazacos.
References
- Ryan, J.; Eckhouse, B. The Age of the Giant Battery is Almost upon Us, Bloomberg. Available online: https://www.bloomberg.com/news/articles/2017-02-21/big-batteries-coming-of-age-prompt-bankers-to-place-their-bets (accessed on 28 September 2018).
- Conca, J. Vanadium-Flow Batteries: The Energy Storage Breakthrough We’ve Needed. Available online: https://www.forbes.com/sites/jamesconca/2016/12/13/vanadium-flow-batteries-the-energy-storage-breakthrough-weve-needed/#7077b6885bde (accessed on 28 September 2018).
- Skyllas-Kazacos, M.; Menictas, C.; Lim, T. Redox flow batteries for medium to large scale energy storage. In Electricity Transmission, Distribution and Storage Systems; Melhem, Z., Ed.; Woodhead Publishing: Cambridge, UK, 2013; pp. 398–441. [Google Scholar]
- Tang, A.; Bao, J.; Skyllas-Kazacos, M. Studies on pressure losses and flow rate optimization in vanadium redox flow battery. J. Power Sources 2014, 248, 154–162. [Google Scholar] [CrossRef]
- Shah, A.A.; Watt-Smith, M.J.; Walsh, F.C. A dynamic performance model for redox-flow batteries involving soluble species. Electrochim. Acta 2008, 53, 8087–8100. [Google Scholar] [CrossRef] [Green Version]
- Shah, A.A.; Al-Fetlawi, H.; Walsh, F.C. Dynamic modelling of hydrogen evolution effects in the all-vanadium redox flow battery. Electrochim. Acta 2010, 55, 1125–1139. [Google Scholar] [CrossRef] [Green Version]
- Shah, A.A.; Tangirala, R.; Singh, R.; Wills, R.G.A.; Walsh, F.C. A Dynamic Unit Cell Model for the All-Vanadium Flow Battery. J. Electrochem. Soc. 2011, 158, A671–A677. [Google Scholar] [CrossRef]
- You, D.; Zhang, H.; Chen, J. A simple model for the vanadium redox battery. Electrochim. Acta 2009, 54, 6827–6836. [Google Scholar] [CrossRef]
- Ma, X.; Zhang, H.; Xing, F. A three-dimensional model for negative half cell of the vanadium redox flow battery. Electrochim. Acta 2011, 58, 238–246. [Google Scholar] [CrossRef] [Green Version]
- Knehr, K.W.; Agar, E.; Dennison, C.R.; Kalidindi, A.R.; Kumbur, E.C. A Transient Vanadium Flow Battery Model Incorporating Vanadium Crossover and Water Transport through the Membrane. J. Electrochem. Soc. 2012, 159, A1446–A1459. [Google Scholar] [CrossRef]
- Ke, X.; Alexander, J.I.D.; Prahl, J.M.; Savinell, R.F. Flow distribution and maximum current density studies in redox flow batteries with a single passage of the serpentine flow channel. J. Power Sources 2014, 270, 646–657. [Google Scholar] [CrossRef]
- Jyothi Latha, T.; Jayanti, S. Ex-situ experimental studies on serpentine flow field design for redox flow battery systems. J. Power Sources 2014, 248, 140–146. [Google Scholar] [CrossRef]
- Xu, Q.; Zhao, T.S.; Leung, P.K. Numerical investigations of flow field designs for vanadium redox flow batteries. Appl. Energy 2013, 105, 47–56. [Google Scholar] [CrossRef]
- Zheng, Q.; Xing, F.; Li, X.; Liu, T.; Lai, Q.; Ning, G.; Zhang, H. Dramatic performance gains of a novel circular vanadium flow battery. J. Power Sources 2015, 277, 104–109. [Google Scholar] [CrossRef]
- Yue, M.; Zheng, Q.; Zhang, H.; Li, X.; Ma, X. Flow field design and optimization of high power density vanadium flow batteries: A novel trapezoid flow battery. AIChE J. 2017, 64, 13–18. [Google Scholar] [CrossRef]
- Park, S.K.; Shim, J.; Yang, J.H.; Jin, C.S.; Lee, B.S.; Lee, Y.S.; Shin, K.H.; Jeon, J.D. The influence of compressed carbon felt electrodes on the performance of a vanadium redox flow battery. Electrochim. Acta 2014, 116, 447–452. [Google Scholar] [CrossRef]
- Oh, K.; Won, S.; Ju, H. Numerical study of the effects of carbon felt electrode compression in all-vanadium redox flow batteries. Electrochim. Acta 2015, 181, 13–23. [Google Scholar] [CrossRef]
- Zheng, Q.; Zhang, H.; Xing, F.; Ma, X.; Li, X.; Ning, G. A three-dimensional model for thermal analysis in a vanadium flow battery. Appl. Energy 2014, 113, 1675–1685. [Google Scholar] [CrossRef]
Figure 1.
Single cell concept with proposed variable porous electrode compression in a counter-flow configuration allowing for standard endplates and bipolar electrodes. The separator or membrane is angled in this format.
Figure 1.
Single cell concept with proposed variable porous electrode compression in a counter-flow configuration allowing for standard endplates and bipolar electrodes. The separator or membrane is angled in this format.

Figure 2.
Possible stack configurations employing counter flow (top) and parallel flow (bottom) configurations with proposed variable porous electrode compression. A single cell with parallel flow was simulated in this study.
Figure 2.
Possible stack configurations employing counter flow (top) and parallel flow (bottom) configurations with proposed variable porous electrode compression. A single cell with parallel flow was simulated in this study.

Figure 3.
Minimum V3+ reactant concentration (mol m−3) and differential pressure (kPa) for Cases 1 to 4 showing the improvement delivered by variable reducing compression.
Figure 3.
Minimum V3+ reactant concentration (mol m−3) and differential pressure (kPa) for Cases 1 to 4 showing the improvement delivered by variable reducing compression.

Figure 4.
Minimum limiting current density (mA cm−2) and differential pressure for Cases 1 to 4 showing the improvement delivered by variable reducing compression.
Figure 4.
Minimum limiting current density (mA cm−2) and differential pressure for Cases 1 to 4 showing the improvement delivered by variable reducing compression.
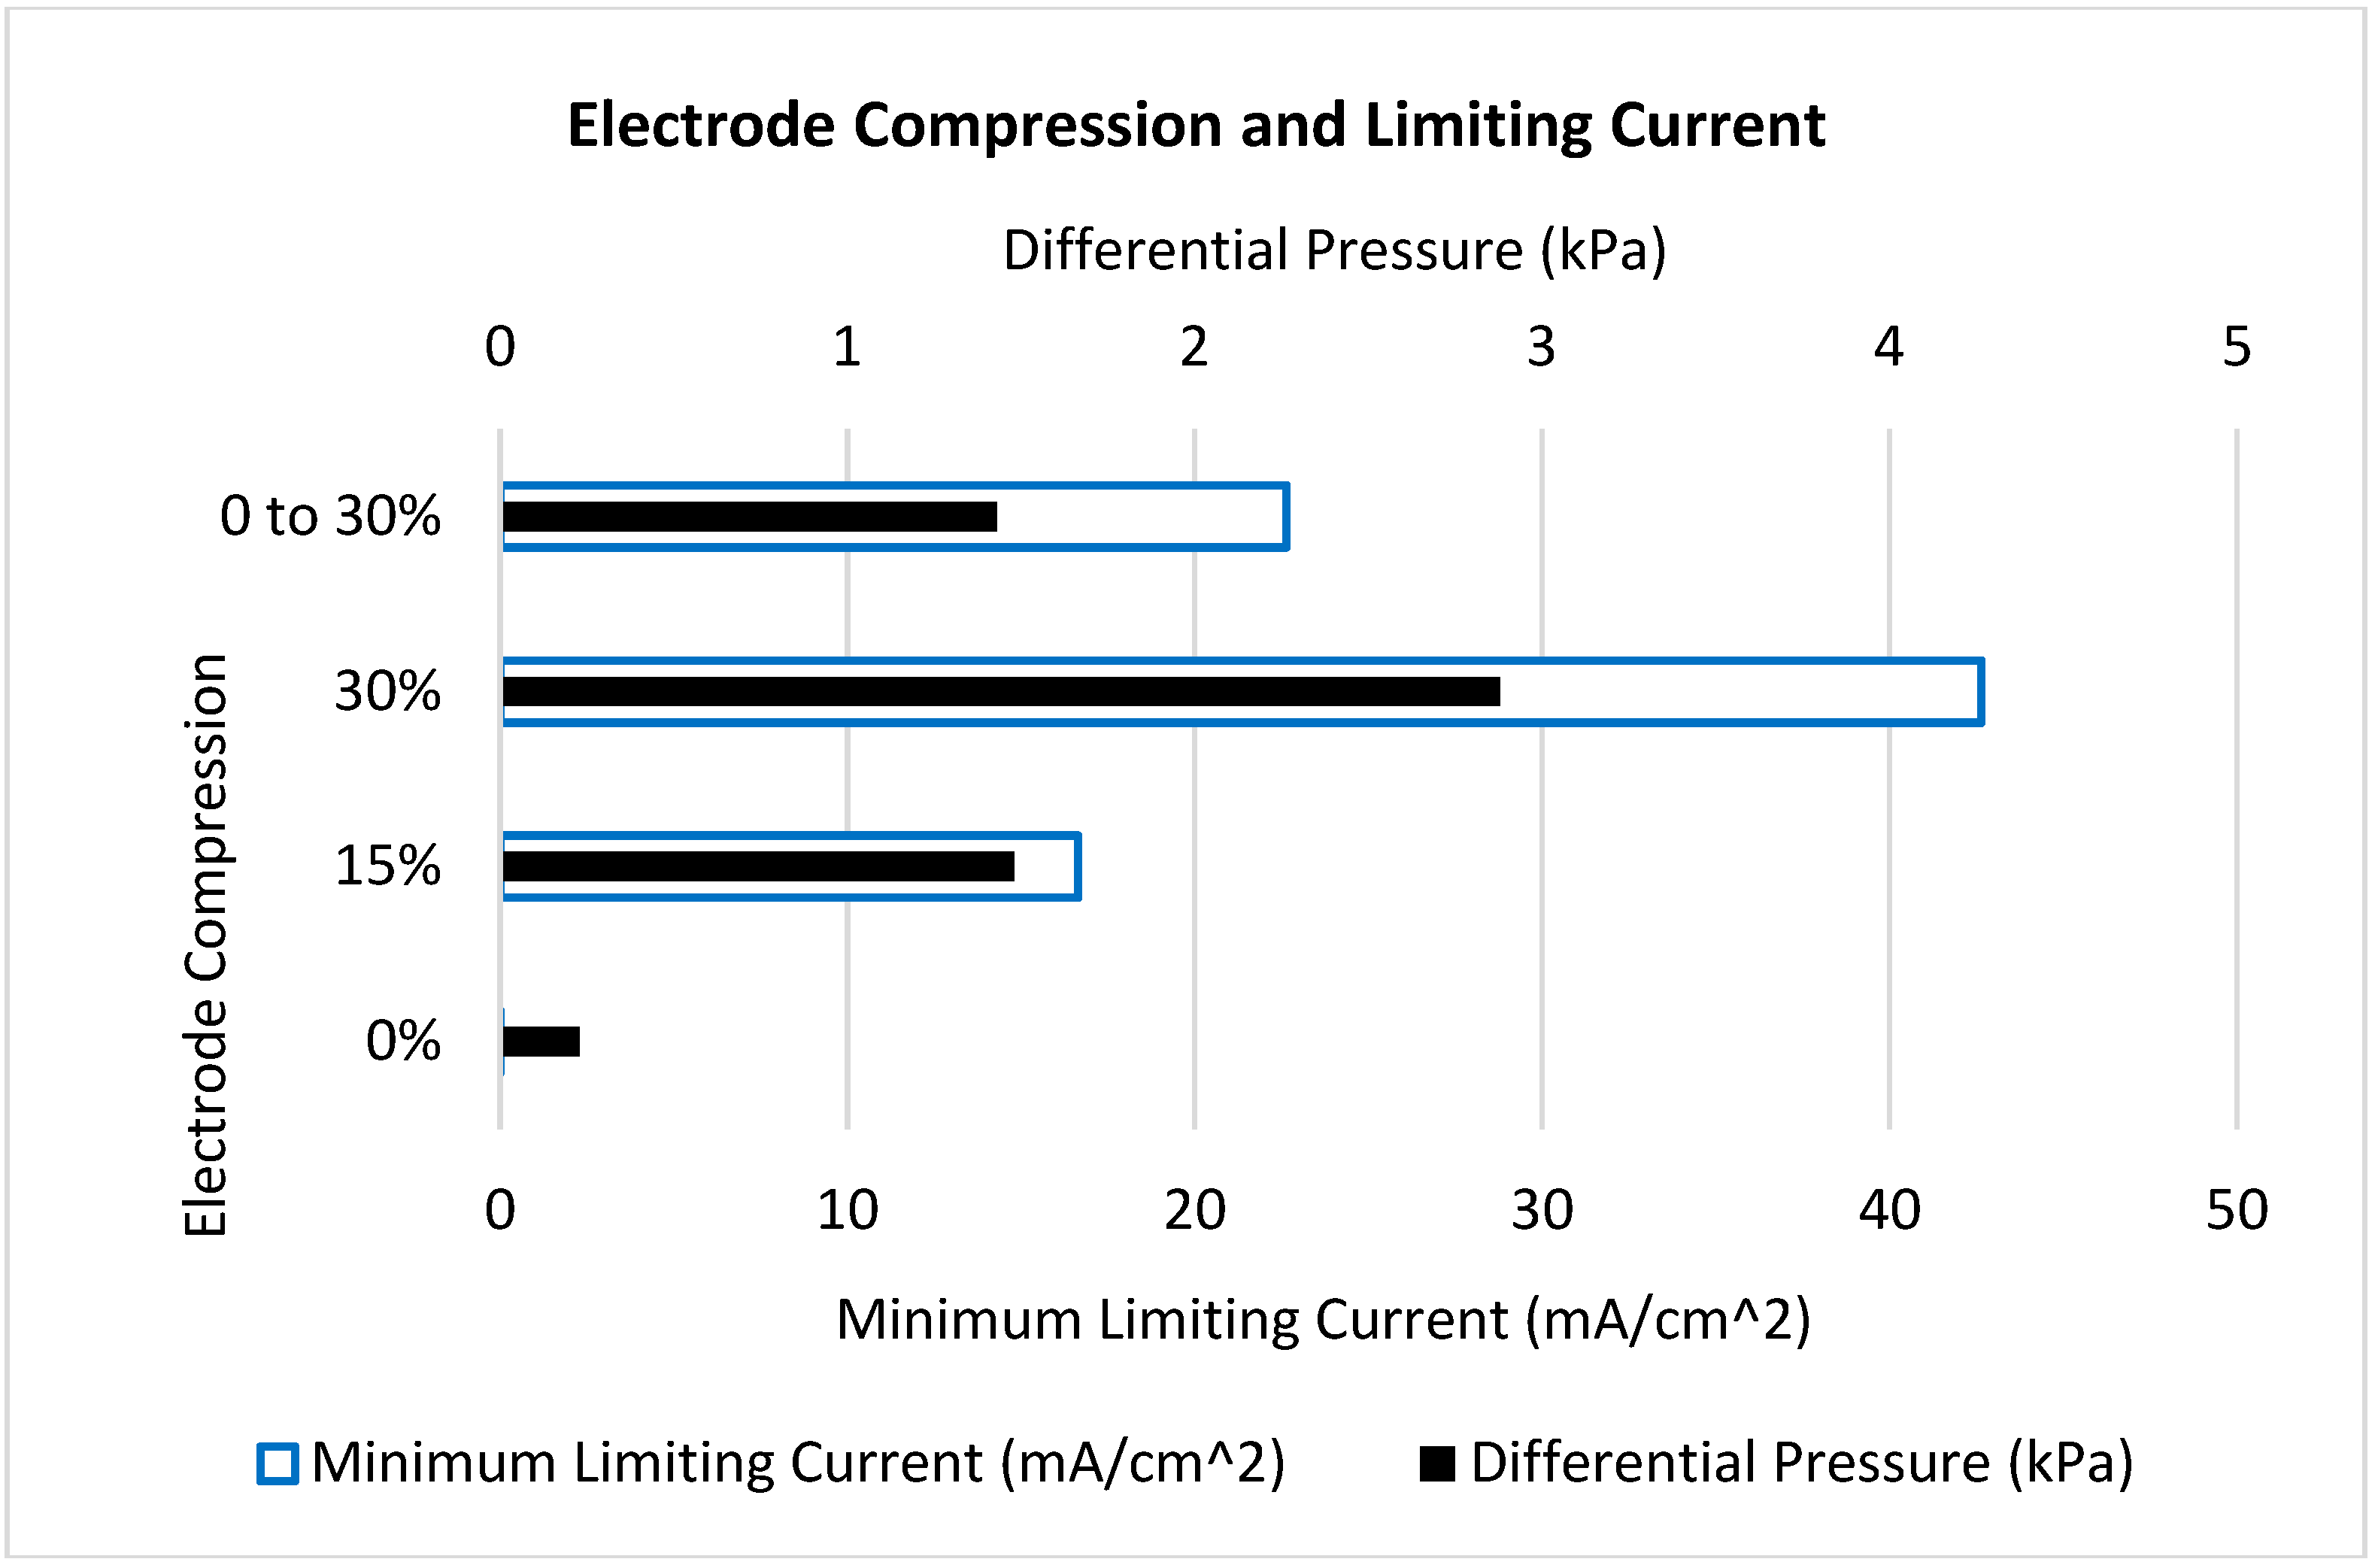
Figure 5.
Pressure improvement for 40 cm2 cells with varying dimensions.

Figure 6.
Minimum limiting current density (mA cm−2) for Case 2 uniform 15% (top) and Case 4 variable reducing (bottom) compression configurations.
Figure 6.
Minimum limiting current density (mA cm−2) for Case 2 uniform 15% (top) and Case 4 variable reducing (bottom) compression configurations.

Figure 7.
Diagram showing the definition of uniform (top) and variable (bottom) compression as a function of position on the x-axis between the inlet and outlet.
Figure 7.
Diagram showing the definition of uniform (top) and variable (bottom) compression as a function of position on the x-axis between the inlet and outlet.

Figure 8.
Experimental [8] and simulated charge curves for at 5 cm2 cell at 40 mA cm−2 from 10 to 90% state of charge (SOC) for model validation.
Figure 8.
Experimental [8] and simulated charge curves for at 5 cm2 cell at 40 mA cm−2 from 10 to 90% state of charge (SOC) for model validation.


Table 1.
Key values for Cases 1 to 4. Results for simulations of 40 cm2 cells in a 5 (width) × 8 (length) cm configuration charged at 160 mA cm−2 with electrolyte at 90% state of charge (SOC) and a flowrate of 10 stoich.
Table 1.
Key values for Cases 1 to 4. Results for simulations of 40 cm2 cells in a 5 (width) × 8 (length) cm configuration charged at 160 mA cm−2 with electrolyte at 90% state of charge (SOC) and a flowrate of 10 stoich.
| Case | Geometry | Electrode Compression | Min. V3+ Concentration (mol m−3) | Min. Limiting Current (mA cm−2) | Differential Pressure (kPa) | Cell Voltage (V) |
|---|---|---|---|---|---|---|
| 1 | Uniform | 0% | 0 | 0 | 0.23 | 1.92 |
| 2 | Uniform | 15% | 46 | 17 | 1.48 | 1.72 |
| 3 | Uniform | 30% | 110 | 43 | 2.88 | 1.59 |
| 4 | Reducing | 0 to 30% | 58 | 23 | 1.43 | 1.69 |
Table 2.
Comparison between Cases 2 and 4 for key criteria. Values are relative improvement (%) over conventional geometry.
Table 2.
Comparison between Cases 2 and 4 for key criteria. Values are relative improvement (%) over conventional geometry.
| Dependent Variable | Improvement |
|---|---|
| Minimum V3+ Concentration (mol m−3) | 25% |
| Minimum Limiting Current (mA cm−2) | 36% |
| Differential Pressure (kPa) | 3% |
| Cell Voltage (V) | 1% |
Table 3.
Carbon felt electrode data adapted from Park et al. [16].
Table 3.
Carbon felt electrode data adapted from Park et al. [16].
| Thickness | Compression | Conductivity | Porosity | |
|---|---|---|---|---|
| mm | mm | % | S/m | |
| 4.0 | 0.0 | 0% | 5.9 | 0.95 |
| 3.6 | 0.4 | 10% | 14.3 | 0.90 |
| 3.2 | 0.8 | 20% | 20.0 | 0.89 |
| 2.8 | 1.2 | 30% | 50.0 | 0.87 |
Table 4.
General operating parameters.
| Parameter | Symbol | Value | Unit |
|---|---|---|---|
| Inlet velocity | 26 × 10−3 | m/s | |
| Outlet pressure | 0 | Pa | |
| Temperature | 280 | K | |
| Current density | 1600 | A m−2 | |
| State of Charge | 90 | - | |
| Cell width | 0.05 | m | |
| Cell length | 0.08 | m | |
| Membrane thickness | 0.123 × 10⁻³ | m |
Table 5.
Fluid model parameters from Knehr et al. [10].
Table 5.
Fluid model parameters from Knehr et al. [10].
| Parameter | Symbol | Value | Unit |
|---|---|---|---|
| Dynamic viscosity (negative electrolyte) | 0.0025 | Pa s | |
| Dynamic viscosity (positive electrolyte) | 0.005 | Pa s | |
| Density (negative electrolyte) | 1300 | kg m−3 | |
| Density (positive electrolyte) | 1350 | kg m−3 | |
| Mean pore radius | 50.3 × 10⁻⁶ | m | |
| Kozeny-Carman constant | 180 | – |
Table 6.
Electrochemical parameters from You et al. [8].
Table 6.
Electrochemical parameters from You et al. [8].
| Parameter | Symbol | Value | Unit |
|---|---|---|---|
| V2+ diffusion coefficient | 2.4 × 10⁻¹⁰ | m2 s−1 | |
| V3+ diffusion coefficient | 2.4 × 10⁻¹⁰ | m2 s−1 | |
| VO2+ diffusion coefficient | 3.9 × 10⁻¹⁰ | m2 s−1 | |
| VO2+ diffusion coefficient | 3.9 × 10⁻¹⁰ | m2 s−1 | |
| Proton diffusion coefficient | 9.312 × 10⁻⁹ | m2 s−1 | |
| Initial vanadium concentration | 1500 | mol m−3 | |
| Initial proton concentration (negative) | 4500 | mol m−3 | |
| Initial proton concentration (positive) | 6000 | mol m−3 | |
| Standard reaction rate constant (negative) | 1.7 × 10⁻⁷ | m s−1 | |
| Standard reaction rate constant (positive) | 6.8 × 10⁻⁷ | m s−1 | |
| Anodic transfer coefficient | 0.5 | – | |
| Cathodic transfer coefficient | 0.5 | – | |
| Equilibrium potential: V2+/V3+ | −0.255 | V | |
| Equilibrium potential: VO2+/VO2+ | 1.004 | V |
© 2018 by the authors. Licensee MDPI, Basel, Switzerland. This article is an open access article distributed under the terms and conditions of the Creative Commons Attribution (CC BY) license (http://creativecommons.org/licenses/by/4.0/).
Share and Cite
MDPI and ACS Style
Gurieff, N.; Timchenko, V.; Menictas, C. Variable Porous Electrode Compression for Redox Flow Battery Systems. Batteries 2018, 4, 53. https://doi.org/10.3390/batteries4040053
AMA Style
Gurieff N, Timchenko V, Menictas C. Variable Porous Electrode Compression for Redox Flow Battery Systems. Batteries. 2018; 4(4):53. https://doi.org/10.3390/batteries4040053
Chicago/Turabian StyleGurieff, Nicholas, Victoria Timchenko, and Chris Menictas. 2018. "Variable Porous Electrode Compression for Redox Flow Battery Systems" Batteries 4, no. 4: 53. https://doi.org/10.3390/batteries4040053
Note that from the first issue of 2016, this journal uses article numbers instead of page numbers. See further details here.