Conversion of Spent Coffee Beans to Electrode Material for Vanadium Redox Flow Batteries
by
Vida Krikstolaityte
1,2, 
Oh En Yao Joshua
1,2,
Andrei Veksha
2,
Nyunt Wai
3,
Grzegorz Lisak
1,2 and
Tuti Mariana Lim
1,* 1
School of Civil and Environmental Engineering, Nanyang Technological University, 50 Nanyang Avenue, Singapore 639798, Singapore
2
Residues and Resource Reclamation Centre (R3C), Nanyang Environment and Water Research Institute (NEWRI), Nanyang Technological University, CleanTech One, Singapore 637141, Singapore
3
Energy Research Institute @Nanyang Technological University (ERI@N), CleanTech One, Singapore 637141, Singapore
*
Author to whom correspondence should be addressed.
Batteries 2018, 4(4), 56; https://doi.org/10.3390/batteries4040056
Submission received: 6 September 2018
/
Revised: 12 October 2018
/
Accepted: 22 October 2018
/
Published: 1 November 2018
(This article belongs to the Special Issue Vanadium Redox Flow Battery and Its Applications)
Abstract
:This study presents the application of pyrolyzed spent coffee beans as a potential electrode material to replace commercial bipolar graphite plate in vanadium redox flow batteries (VRB). The results indicate that the biochar obtained from spent coffee beans shows relatively good electrochemical charge transfer kinetics of vanadium redox reactions as well as generates higher energy and voltage efficiency in a static cell test when compared to TF6 bipolar graphite plate. Additionally, the biochar was activated via steam at various activation times to increase its surface area, and their effect on the kinetics of the electrochemical reactions was investigated. The activated carbon did not exhibit any improvement neither in electron transfer kinetics nor in the battery efficiency, despite their increased surface area. The performed studies demonstrate that the biochar obtained from spent coffee beans can be a low-cost electrode material for VRB with improved performance characteristics.
1. Introduction
Energy consumption has been steadily increasing as a result of the growth of energy intensive societies and the current major sources of energy, fossil fuels, are not sustainable due to their non-renewable nature and the environmental degradation associated with their uses. Thus, there is a need to generate sustainable energy by exploiting renewable sources. However, renewable energy sources are unstable and intermittent. In order to mitigate this problem, efficient and safe energy storage systems need to be developed to store and harness the full potential of renewable energy [1]. Electrochemical storage systems have potential for large scale energy storage because of their efficiency and scalability [2]. In particular, redox flow batteries exhibit relevance to this specific application due to their power/energy independent sizing, good operational performance at ambient temperature, and extremely long charge/discharge life cycle [3]. Among them, vanadium redox flow batteries (VRB), developed by Maria Skyllas-Kazacos et al. in the 1980s [4], have a major advantage since a single element, i.e., vanadium, is used as an electrolyte in both half-cells under different oxidation states, which eliminates the risk of electrolyte cross-contamination [5,6]. The seriousness of electrolyte cross-contamination was observed in the iron–chromium redox flow battery developed by NASA that caused enormous capacity loss due to the mixing of iron and chromium ions through the membrane [5]. Yet, few VRB systems have been practically implemented due to their low specific energy and the high cost related to their stack components including an electrode [1,7]. At present, pristine carbon or graphite plates are commonly used as electrodes in VRB systems; however, these types of electrodes yield poor kinetic reversibility, electrochemical activity, life cycle and their weight limit their power capacity. Different carbon nanomaterials, such as carbon nanotubes [8] and graphene sheets [9]—which are mechanically stable, electrically conductive building blocks and have high-surface-area-to-volume ratio, were intensively studied to modify VRB electrodes and to improve electrode durability and electrochemical performance characteristics. Yet, despite their plausible electrochemical and mechanical characteristics, large scale production of carbon nanomaterials is rather expensive [10]. Recently, different carbon nanomaterial production from various biomass waste has drawn increasing attention [11]. Utilization of biomass waste as a low-cost, abundant and renewable resource would contribute to green environmental development. For VRB application, we have previously investigated carbon nanomaterial which was produced by using different biomass waste as precursors, such as coconut shell [12] and orange peel [13]. In our present work, via an integrated pyrolysis-steam activation system, we have successfully converted spent coffee beans into activated biochar. We selected spent coffee beans as a precursor material since coffee is a commonly and abundantly available feedstock.
In previous research, it was demonstrated that biochar obtained from spent coffee beans showed potential as an electrode material for high performance super capacitors [14]. In this work, we aimed in particular to evaluate if it could also facilitate electrode catalytic properties, such as the electrochemical performance of a VRB system. Moreover, the biochar was activated via steam at different activation times (1, 2 and 3 h) to increase surface area by introducing pores on the surface, and establish the effect of the activation process on the electrochemical performance of activated carbon modified electrodes. Cyclic voltammetry and electrochemical impedance spectroscopy measurements were carried out to investigate the electro-catalytic properties of individual electrodes, while charge/discharge measurements were employed to evaluate the performance of the whole static cell of the VRB. Prior to the electrochemical tests, surface area, morphological properties and elemental composition of biochar and activated carbon samples were characterized using N2 adsorption (−196 °C), field emission scanning electron microscopy (FESEM), Raman spectroscopy and X-ray powder diffraction analysis (XRD) using 40 kV and 40 mA with Cu-Kα (λ = 1.5418 Å).
2. Materials and Methods
2.1. Preparation of Biochar and Activated Carbon
Spent coffee beans, which are the residue of a coffee brewing process, were obtained from a coffee shop located on the Nanyang Technological University campus. The feedstock was pyrolyzed in N2 atmosphere, and the produced biochar was then activated in the presence of steam using the following method. The spent coffee beans were pelletized (ZLSP150C pelletizer) to obtain pellets with the diameter of 4 mm and then dried at 105 °C overnight. For the pyrolysis and activation, 100 g of the produced pellets were loaded into a quartz vertical reactor with i.d. 40 mm (Figure 1) and the electric furnace was heated to 850 °C in the presence of N2 flow of 250 mL min−1 at a heating rate of 5 °C min−1. The reactor had a quartz frit with 50–90 μm openings to support pellets in the hot zone of the electric furnace and a K-type thermocouple in the center of the bed to monitor the actual temperature of the sample. To produce biochar, the temperature of the electric furnace was maintained at 850 °C (the actual temperature of biochar was approximately 5 °C lower) for 30 min and then the reactor was cooled down. Bio-oil was collected in a trap located inside the ice bath at the bottom of the reactor. To produce activated carbon, after 30 min of pyrolysis at 850 °C, water was pumped into the built-in steam generator installed at the top of the reactor. The activation was carried out for 1, 2 or 3 h using a mixture of 63 vol % steam and 37 vol % N2 (total flow rate of 670 mL min−1). After the activation process, activated carbon was allowed to cool naturally in an N2 flow of 250 mL min−1. To remove soluble inorganic compounds, biochar and activated carbon samples were boiled in 3 M HCl for 30 min, filtered and then washed with deionized water until pH ~5–5.5. The produced biochar is denoted as BC and activated carbon samples are denoted as AC1, AC2 and AC3 in accordance with 1, 2 and 3 h activation time.
2.2. Characterization of Carbon Properties
Carbon yields and burn-offs were calculated as follows:
Ultimate analysis of samples was performed by a CHNS elemental analyzer (Vario EL Cube). Powder X-ray diffraction (XRD) patterns were recorded using a Bruker AXS, D8 Advance equipped with a Cu Ka radiation source. Morphological features were studied by means of field emission scanning electron microscopy (FESEM, JEOL JSM-7600F). Raman spectra of the samples were recorded with a HORIBA Scientific XploRA ONE™ (argon laser, 532 nm). N2 adsorption and desorption isotherms were measured at −196 °C using a Quantachrome Autosorb-1 Analyzer. The BET (Brunauer-Emmett-Teller) and NLDFT (Non-local Density Functional Theory) models were applied to calculate specific surface areas and pore size distributions of materials, respectively. Micropore volumes were obtained using the t-plot method and total pore volumes were calculated from N2 adsorption at relative pressures of 0.95–0.96.
2.3. Electrochemical Characterization of Carbon Material Based Electrodes
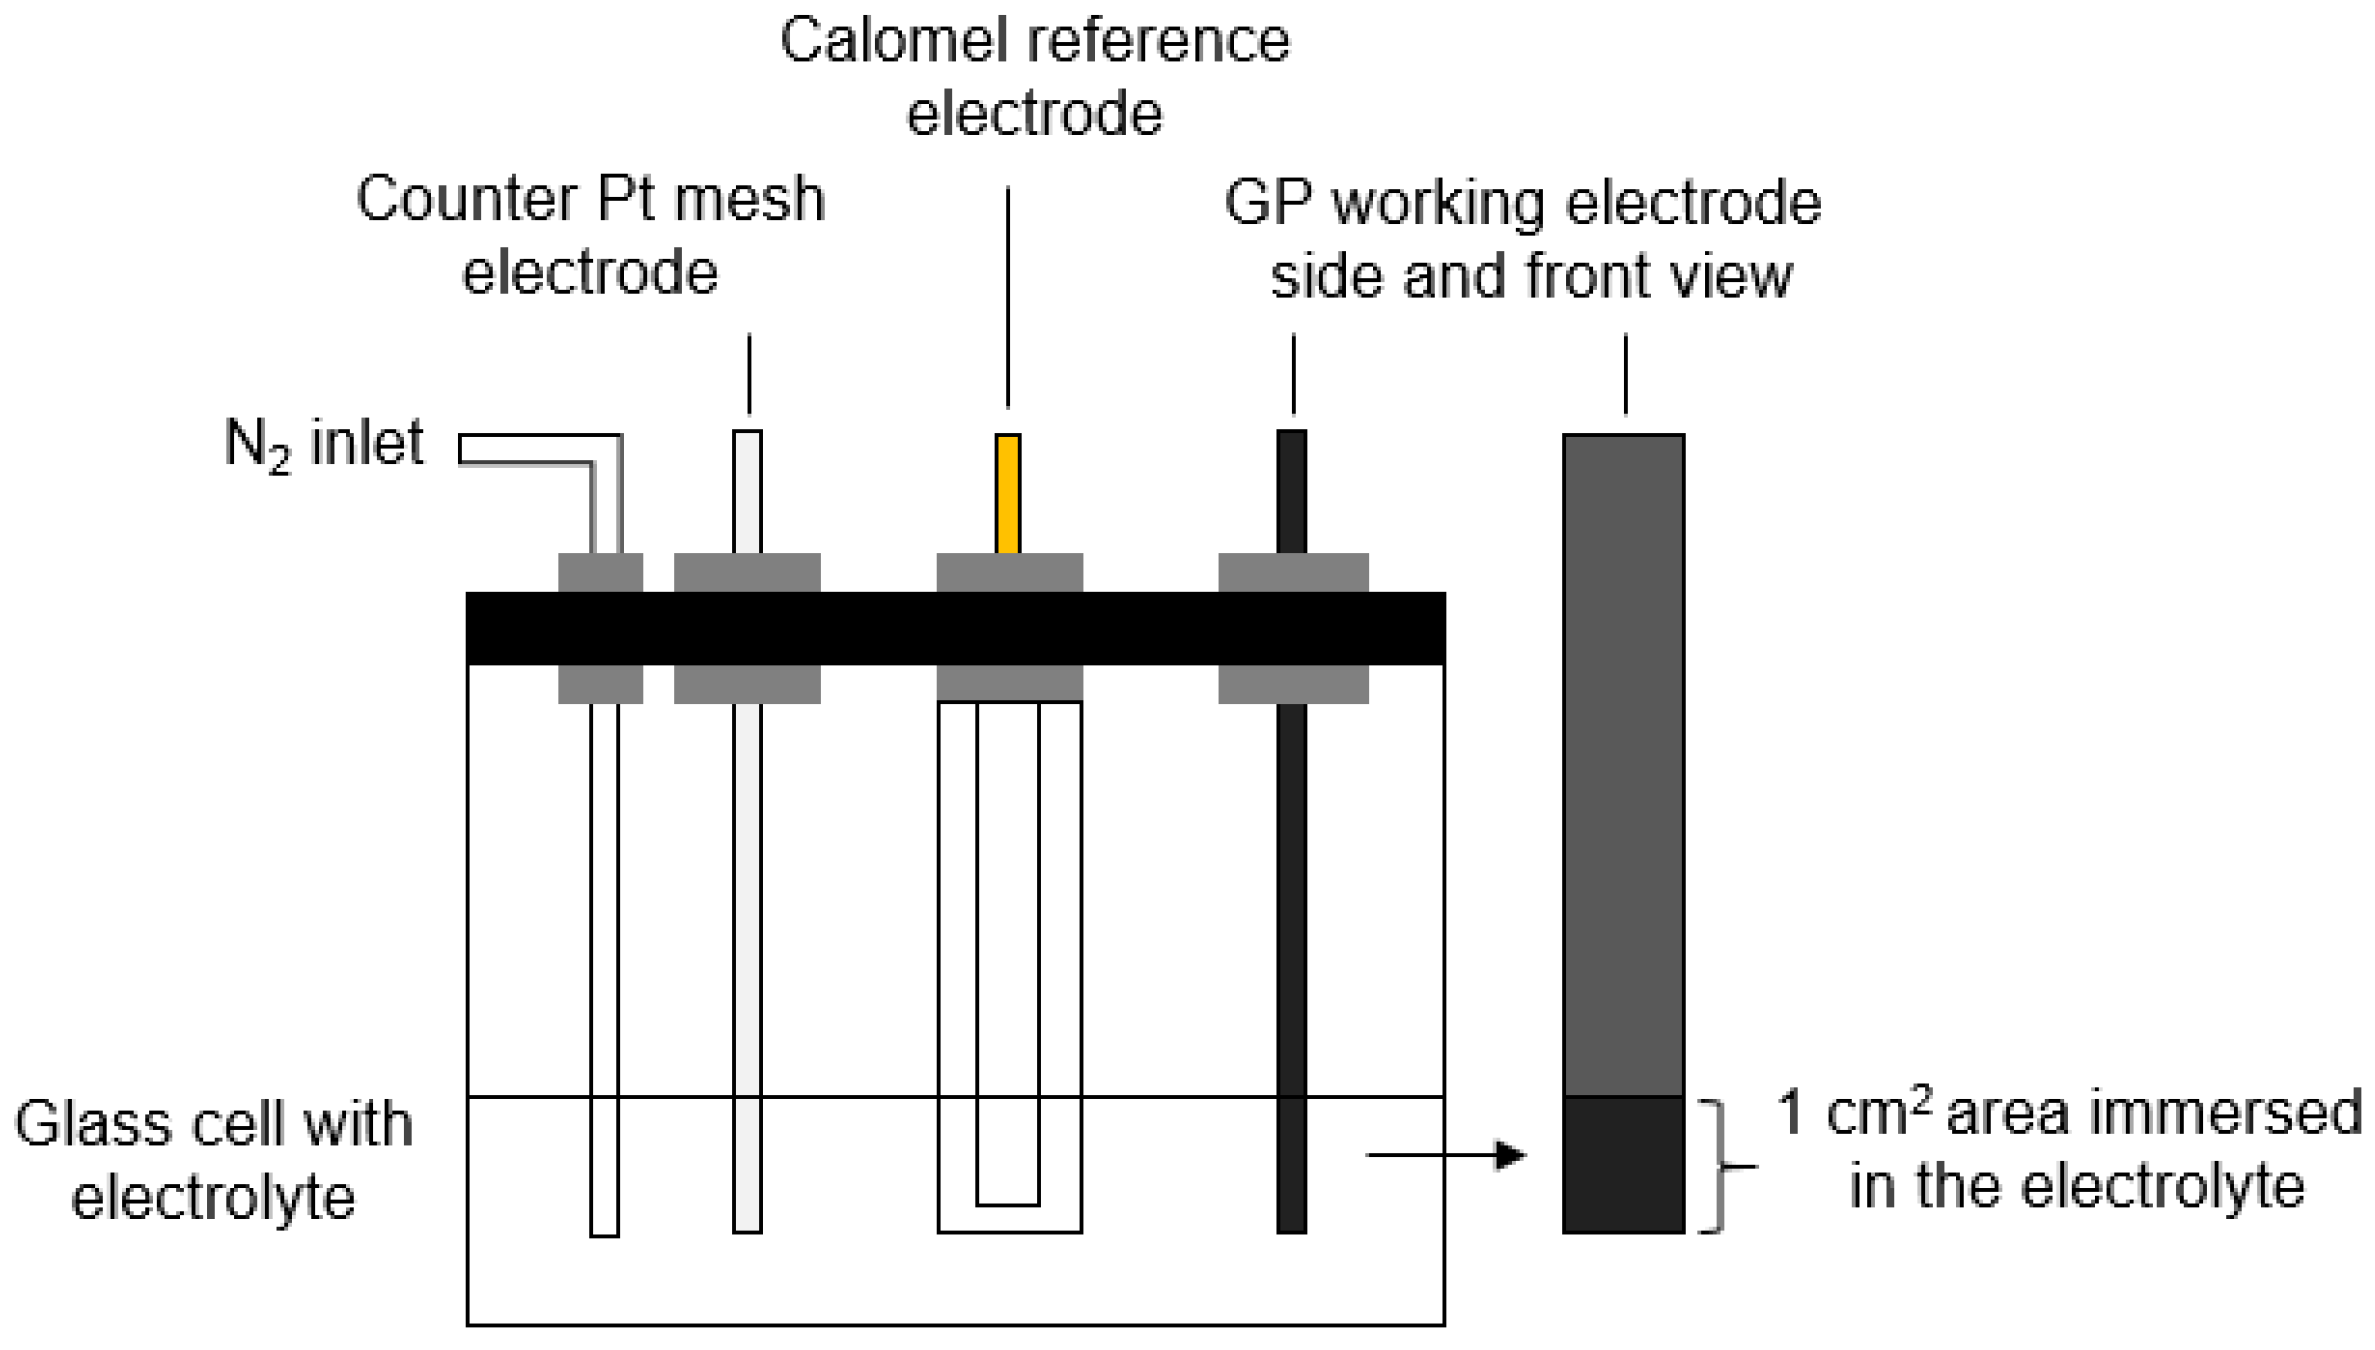
The homogenous slurry of the carbon material (50 mg mL−1) was prepared by mixing 5 mg of BC or AC and 45 mg of polyvinylidene fluoride (PVDF) in 1 mL of N-methyl-2-pyrrolidone (NMP) solution as previously described [13]. For electrochemical characterization, 60 μL cm−1 of the slurry was deposited on the surface of 0.6 mm thick graphite plates (TF6, SGL Carbon) which were accordingly kept overnight in the oven at 60 °C to remove solvent molecules. Specifically, the graphite plate (GP) electrodes with a modified area of 1 cm2 (1 cm × 1 cm) were used for cyclic voltammetry (CV) and electrochemical impedance spectroscopy (EIS) measurements (Figure 2), while GP electrodes of 4 cm2 (2 cm × 2 cm) modified surface area were exploited for VRB static cell testing.
The electrochemical characterization of the GP electrodes was performed by CV and EIS measurements using a multi-channel potentiostat (VMP3, Bio-Logic Science Instruments, Seyssinet-Pariset, France) equipped with a three-electrode electrochemical cell. The cell consisted of GP as a working electrode, Pt mesh as a counter electrode and saturated calomel electrode (SCE) as a reference electrode (Figure 2). All electrochemical experiments were performed by purging N2 to create an O2 free atmosphere with no agitation at room temperature (25 °C). CVs were performed in 1.6 M V3+/4+ (1:1 mixture of V3+ and V4+) containing a 4 M H2SO4 solution within the voltage window of −1.0 to 1.6 V (vs. SCE) at a 5 mV s−1 scan rate. EIS measurements were carried out in 1.6 M V4+/5+ containing 4 M H2SO4 and were measured in the frequency range from 10 mHz to 100 kHz at an open circuit potential with an alternating potential amplitude of 10 mV.
Hereinafter, the performances of BC- and AC-based electrodes were studied in a VRB static cell by galvanostatic cycling studies using a battery testing system (NEWARE, Shenzhen, China) as described elsewhere [13]. Briefly, in each half-cell, a 2 cm × 2 cm GP, respectively coated by BC or AC, was placed between a 4.6 mm thick porous carbon felt (SIGRACELL GFD 4.6 EA, SGL Carbon, Meitingen, Germany) and a copper current collector. An anion exchange membrane (FAP 450, Fumatech, GmbH, Bietigheim-Bissingen, Germany) was used as a separator between the two half-cells. A stainless-steel plate was bolted to the side of each half-cell to tighten the cell components to prevent any leakage of electrolytes. The charge-discharge cycling was performed in 1.6 M V3+/4+ containing a 4 M H2SO4 solution under constant current densities of 5, 10, 15 and 20 mA cm−2. The charge-discharge test was carried for 5 cycles at each current density under a potential window of 1.6 to 0.9 V. Consequently, the obtained charge-discharge curves were used to calculate the coulombic energy and voltage efficiencies of the cell.
3. Results and Discussion
3.1. Carbon Properties
The N2 adsorption-desorption isotherms of biochar and activated carbon are shown in Figure 3a and the corresponding surface properties are summarized in Table 1. According to the N2 adsorption-desorption isotherms in Figure 3a, N2 uptake by BC was negligible and increased with the longer activation time, indicating the formation of a porous structure in activated carbon. The development of porosity was attributed to the partial gasification of carbon with steam during activation. This process was accompanied by the conversion of carbon into CO and increasing burn-off from 21% for AC1 to 77% for AC3 (Table 1). In activated carbon samples, N2 uptake prevailed at low relative pressures (P/P0 < 0.1), corresponding to the adsorption in micropores (pore widths up to 20 Å) (Figure 3a). In addition to micropores, longer activation time resulted in the development of mesopores (pore widths above 20 Å) as evidenced by the increased slope at relative pressures above 0.1 and the appearance of hysteresis loops in AC2 and AC3 samples.
The activation process increased BET specific surface areas from 541 m2 g−1 in AC1 to 1113 m2 g−1 in AC3 and micropore volumes from 0.28 mL g−1 in AC1 to 0.60 mL g−1 in AC3 (Table 1). The difference between total pore and micropore volumes represented the content of meso- and macropores participating in N2 adsorption. Meso- and macropore volumes of activated carbon samples increased from 0.01 in AC1 to 0.15 mL g−1 in AC3. These values were lower compared to the volumes of micropores. The pore size distributions of the activated carbon samples in Figure 3b showed that the developed mesopores had sizes mainly between 20 and 45 Å. Figure 3c,d illustrates the changes in morphology due to steam activation indicating the presence of a well-developed porous structure in AC3 compared to non-activated BC.
Table 2 presents the elemental analysis of the spent coffee beans and produced carbon nanomaterial. The contents of carbon, hydrogen and nitrogen in feedstock were similar to those reported for spent coffee beans in other studies [15,16]. Pyrolysis and activation resulted in an increase in carbon and a decrease in hydrogen and nitrogen contents. Ash content was the highest in BC, decreased to the lowest value in AC1 and gradually increased thereafter. This phenomenon could be attributed to the differences in accessibility of inorganic compounds to water and HCl acid during washing as well as to the accumulation of insoluble ash components. Due to the low porosity in BC, the access of liquid molecules into biochar particles was limited, which restricted the removal of soluble compounds. The development of porosity during steam activation facilitated this process, resulting in the lower ash content at low burn-offs. However, as carbon burns during activation, the amount of both soluble and insoluble inorganic compounds increased. While soluble compounds could still be removed by washing, insoluble compounds (e.g., Al, Si and Ti species [16]) would accumulate in carbon samples.
XRD patterns of samples shown in Figure 4 demonstrate that both non-activated BC and activated carbon samples (AC1, AC2 and AC3) were similar in nature. There were two broad diffraction peaks detected at 23 and 43° which corresponded to the diffraction from the (002) and (100/101) planes in graphite and suggested the presence of graphitic microcrystallites, which were also observed in biochar and activated carbon from other types of biomass [17,18]. The presence of a sharp XRD peak at 27° in the BC sample corresponding to the diffraction from graphite indicated the presence of relatively large graphitic crystallites. According to the disappearance of this XRD peak, the sizes of crystallites were reduced after the activation process.
3.2. Electrochemical Characterization
Figure 5 shows the CV curves of pristine graphite plate (GP) (grey curve), BC-modified (black curve) and AC3-modified GP (green curve) electrodes in 1.6 M V3+/4+ containing 4 M H2SO4 at a scan rate of 5 mV s−1. The CV curves exhibited two pairs of redox peaks representing electrochemical reversibility of redox couples V2+/V3+ and V4+/V5+ on negative (Equation (3)) and positive (Equation (4)) sides of the VRB system [19], respectively.
Thus, there are four main electrochemical reactions that take place in the VRB [20] which are presented below:
Peak A = V4+ → V5+
Peak B = V5+ → V4+
Peak C = V3+ → V2+
Peak D = V2+ → V3+
In order for the VRB to function efficiently, all four redox reactions must have achieved fast heterogonous electron transfer kinetics which were electrochemically reversible. It generally meant higher peak current and narrower potential peak separation [21]. The comparison between CVs of a pristine GP and BC-modified GP electrodes clearly showed that the BC-modified GP electrode demonstrated higher anodic and cathodic peak currents for both redox couples than the pure GP electrode, indicating an improved heterogeneous electron transfer process on both the anode and cathode. Moreover, for the BC-modified electrode, the peak potential separation of the V4+/V5+ redox couple was also significantly (0.40 V vs. SCE) decreased when compared to the unmodified GP electrode (0.55 V vs. SCE), suggesting the facilitated electrochemical reversibility of the reactions. However, no change in peak separation was observed for the V2+/V3+ redox couple which is usually the limiting part of the VRB system [22].
The AC3-modified GP electrode (biochar activated with steam for 3 h) also showed higher anodic and cathodic peak currents for both redox couples than for the pure GP electrode, though the redox process facilitation was less pronounced than for the BC-modified electrode. This indicated that even though AC3 material had both increased surface area and porosity (Table 1), the presence of these micropores may have caused some stagnancy of the electrolyte due to the depth of the microporous AC3 structures. Further studies involving the use of transmission electron microscopy (TEM) will be carried out to investigate the depth of the micropores and reported in future.
Since the improvement of redox activity was more significant on the positive electrolyte (V4+/V5+ redox couple), EIS measurements were carried out using a positive electrolyte to get a better understanding of what caused the difference in electrochemical activity of BC and AC materials. Figure 6 shows Nyquist plots, representing real impedance (Z′) vs imaginary impedance (Z″), for pristine GP (grey curve), GP-modified with biochar (black curve) and carbon activated at different extents, namely AC1 (red curve, 1 h), AC2 (dark blue curve, 2 h), and AC3 (green curve, 3 h).
The diameter of a semi-circle represented the heterogeneous electron transfer kinetics between an electrode surface and redox reactant in a solution phase, and its extrapolation to the intercept on the Z′ axis at a lower frequency range gave the sum of electron transfer resistance and electrolyte/system resistance. In the insertion of graph 6, where the high frequency range is highlighted to better determine the semi-circle diameter/its apparent intersection on the Z′ axis, it could clearly be observed that the electrode modification by the carbon material resulted in the depressed semi-circle showing decreased charge transfer resistance. More specifically, the longer the activation time of the biochar the more diminished charge transfer resistance. This meant that the longer activation time induced the structural properties of the activated carbon that in turn improved charge transfer in the electrolyte/surface interface. However, as previously observed during the CV measurements, the AC3-modified GP electrode resulted in lower redox current which was probably attributed to some of the electrolyte being trapped inside the microporous channel.
To monitor the actual battery performance, the static cell test was run for pristine, BC and AC coated GPs. The charge–discharge cycling was performed in 1.6 M V3+/4+ containing a 4 M H2SO4 solution applying constant current densities ranging from 5 to 20 mA cm−2 in the potential window of 1.6 to 0.9 V. The obtained charge–discharge curves were used to calculate the coulombic energy and voltage efficiencies of the battery as shown by the following equation:
Coulombic efficiency refers to the ratio of the number of charges entering the battery during charging and coming out of the battery during discharge. Due to the occurrence of secondary reactions such as the electrolysis of water or unwanted redox reactions, this would lead to a loss of coulombic efficiency. Voltage efficiency was established by the voltage difference between charging voltage and discharging voltage . It was affected by state-of-charge and internal resistance. Choosing suitable electrodes and membrane components could reduce the internal resistance of the cell, and thus improve its voltage efficiency [23].
The results in Figure 7 consistently showed that BC had higher voltage efficiency and corresponding energy efficiency than pristine graphite at various current densities. As aforementioned, voltage efficiency was related to the battery cell components and its internal resistance. This was probably due to the low porosity in BC which allowed all the electrolyte solution to be on the surface for redox reaction to take place, resulting in improved voltage efficiency. Interestingly, the voltage efficiency tended to decrease with the increase in activation time (voltage efficiency of AC1 > AC2 > AC3). It could be explained by increased microporosity/structural disorders of AC samples with the longer activation time [24]. Energy efficiency is a function of both voltage efficiency and coulombic efficiency. Since it was well accepted that coulombic efficiency was near 99–100% throughout the operation, energy efficiency was to a great extent dependent on the voltage efficiency. Therefore, it could be observed that energy efficiency followed the trend of voltage efficiency closely.
4. Conclusions
This study successfully demonstrated that spent coffee beans could be successfully converted via pyrolysis-steam activation system into biochar and activated carbon. The synthesized biochar, when exploited as an electrode material, facilitated electrochemical performance of vanadium redox couples as well as yielded a high energy and voltage efficiency in a static VRB cell tests. This could be attributed to the high degree of carbonization of biochar achieved at 850 °C which could have resulted in good conductivity. These results clearly showed the biochar was a superior electrode material that could be used for VRB application.
Physical activation of the biochar with steam resulted in the development of porosity which could have led to increased micropore volume. Therefore, it may not be practically beneficial to perform the steam activation of the biochar for its application in VRB system.
Author Contributions
Conceptualization, O.E.Y.J., A.V. and T.M.L.; Methodology O.E.Y.J., A.V. and T.M.L.; Software, V.K., O.E.Y.J. and A.V.; Validation, V.K., T.M.L. and N.W.; Formal Analysis, O.E.Y.J., T.M.L., G.L., N.W., V.K. and A.V.; Investigation, O.E.Y.J., A.V., V.K.; Resources, G.L. and T.M.L.; Data Curation, O.E.Y.J., A.V., N.W., T.M.L. and V.K.; Writing-Original Draft Preparation, V.K. and A.V.; Writing-Review & Editing, V.K., A.V., N.W., G.L. and T.M.L.; Visualization, V.K. and A.V.; Supervision, G.L., A.V. and T.M.L.; Project Administration, G.L. and T.M.L.; Funding Acquisition, G.L., N.W. and T.M.L.
Funding
The authors would like to acknowledge the Nanyang Environment and Water Research Institute (NEWRI) and Nanyang Technological University (NTU), Energy Research Institute at NTU (ERI@N) for financial support of this research.
Conflicts of Interest
The authors declare no conflict of interest.
References
- Nguyen, T.; Savinell, R.F. Flow Batteries. Electrochem. Soc. Interface 2010, 19, 54–56. [Google Scholar] [CrossRef] [Green Version]
- Wang, D.; Chen, N.; Li, M.; Wang, C.; Ehrenberg, H.; Bie, X.; Wei, Y.; Chen, G.; Du, F. Na3V2(PO4)3/C composite as the intercalation-type anode material for sodium-ion batteries with superior rate capability and long-cycle life. J. Mater. Chem. A 2015, 3, 8636–8642. [Google Scholar] [CrossRef]
- Alotto, P.; Guarnieri, M.; Moro, F. Redox flow batteries for the storage of renewable energy: A review. Renew. Sustain. Energy Rev. 2014, 29, 325–335. [Google Scholar] [CrossRef]
- Skyllas-Kazacos, M.; Grossmith, F. Efficient Vanadium Redox Flow Cell. J. Electrochem. Soc. 1987, 2950–2953. [Google Scholar] [CrossRef]
- Skyllas-Kazacos, M.; McCann, J.F. Vanadium Redox Flow Batteries (VRBs) for Medium- and Large-Scale Energy Storage; Woodhead Publishing: Sawston, UK, 2014. [Google Scholar]
- Park, M.; Ryu, J.; Cho, J. Nanostructured Electrocatalysts for All-Vanadium Redox Flow Batteries. Chem. Asian J. 2015, 10, 2096–2110. [Google Scholar] [CrossRef] [PubMed]
- Kear, G.; Shah, A.A.; Walsh, F.C. Development of the all-vanadium redox flow battery for energy storage: A review of technological, financial and policy aspects. Int. J. Energy Res. 2011, 36, 1105–1120. [Google Scholar] [CrossRef]
- Li, W.; Liu, J.; Yan, C. Multi-walled carbon nanotubes used as an electrode reaction catalyst for VO2+/VO2+ for a vanadium redox flow battery. Carbon 2011, 49, 3463–3470. [Google Scholar] [CrossRef]
- Liu, Q.; Li, Z.-F.; Liu, Y.; Zhang, H.; Ren, Y.; Sun, C.-J.; Lu, W.; Zhou, Y.; Stanciu, L.; Stach, E.A.; et al. Graphene-modified nanostructured vanadium pentoxide hybrids with extraordinary electrochemical performance for Li-ion batteries. Nat. Commun. 2015, 6, 6127. [Google Scholar] [CrossRef] [PubMed] [Green Version]
- Zhang, Q.; Huang, J.-Q.; Qian, W.-Z.; Zhang, Y.-Y.; Wei, F. The Road for Nanomaterials Industry: A Review of Carbon Nanotube Production, Post-Treatment, and Bulk Applications for Composites and Energy Storage. Small 2013, 9, 1237–1265. [Google Scholar] [CrossRef] [PubMed]
- Gao, Z.; Zhang, Y.; Song, N.; Li, X. Biomass-derived renewable carbon materials for electrochemical energy storage. Mater. Res. Lett. 2017, 5, 69–88. [Google Scholar] [CrossRef]
- Ulaganathan, M.; Jain, A.; Aravindan, V.; Jayaraman, S.; Ling, W.C.; Lim, T.M.; Srinivasan, M.P.; Yan, Q.; Madhavi, S. Bio-mass derived mesoporous carbon as superior electrode in all vanadium redox flow battery with multicouple reactions. J. Power Sources 2015, 274, 846–850. [Google Scholar] [CrossRef]
- Maharjan, M.; Bhattarai, A.; Ulaganathan, M.; Wai, N.; Oo, M.O.; Wang, J.-Y.; Lim, T.M. High surface area bio-waste based carbon as a superior electrode for vanadium redox flow battery. J. Power Sources 2017, 362, 50–56. [Google Scholar] [CrossRef]
- Rufford, T.E.; Hulicova-Jurcakova, D.; Zhu, Z.; Lu, G.Q. Nanoporous carbon electrode from waste coffee beans for high performance supercapacitors. Electrochem. Commun. 2008, 10, 1594–1597. [Google Scholar] [CrossRef]
- Li, X.; Strezov, V.; Kan, T. Energy recovery potential analysis of spent coffee grounds pyrolysis products. J. Anal. Appl. Pyrolysis 2014, 110, 79–87. [Google Scholar] [CrossRef]
- Pacioni, T.R.; Soares, D.; Domenico, M.D.; Rosa, M.F.; Moreira, R.D.; José, H.J. Bio-syngas production from agro-industrial biomass residues by steam gasification. Waste Manag. 2016, 58, 221–229. [Google Scholar] [CrossRef] [PubMed]
- Nabais, J.M.V.; Laginhas, C.; Carrott, M.M.L.R.; Carrott, P.J.M.; Amorós, J.E.C.; Gisbert, A.V.N. Surface and porous characterisation of activated carbons made from a novel biomass precursor, the esparto grass. Appl. Surf. Sci. 2013, 265, 919–924. [Google Scholar] [CrossRef] [Green Version]
- Yang, C.-S.; Jang, Y.S.; Jeong, H.K. Bamboo-based activated carbon for supercapacitor applications. Curr. Appl. Phys. 2014, 14, 1616–1620. [Google Scholar] [CrossRef]
- Skyllas-Kazacos, M.; Menictas, C.; Lim, T. Redox flow batteries for medium- to large-scale energy storage. In Electricity Transmission, Distribution and Storage Systems; Melhem, Z., Ed.; Woodhead Publishing: Sawston, UK, 2013; pp. 398–441. [Google Scholar]
- Zhong, S.; Kazacos, M.; Burford, R.P.; Skyllas-Kazacos, M. Fabrication and activation studies of conducting plastic composite electrodes for redox cells. Power Sources 1991, 29–43. [Google Scholar] [CrossRef]
- Wang, W.; Li, B.; Gu, M.; Nie, Z.; Wei, X.; Wang, C.; Sprenkle, V. Nanorod Niobium Oxide as Powerful Catalysts for an All Vanadium Redox Flow Battery; Nano Letters: Washington, DC, USA, 2013; pp. 158–165. [Google Scholar]
- Taylor, S.M.; Pătru, A.; Perego, D.; Fabbri, E.; Schmidt, T.J. Influence of Carbon Material Properties on Activity and Stability of the Negative Electrode in Vanadium Redox Flow Batteries: A Model Electrode Study. ACS Appl. Energy Mater. 2018, 1, 1166–1174. [Google Scholar] [CrossRef]
- Garg, B. Introduction to Flow Batteries: Theory and Applications; Stanford University: Stanford, CA, USA, 2016. [Google Scholar]
- Kennedy, L.J.; Vijaya, J.J.; Sekaran, G. Electrical Conductivity Study of Porous Carbons Derived from Rice Husk. Mater. Chem. Phys. 2004, 91, 471–476. [Google Scholar] [CrossRef]
Figure 1.
Pyrolysis and steam activation setup.
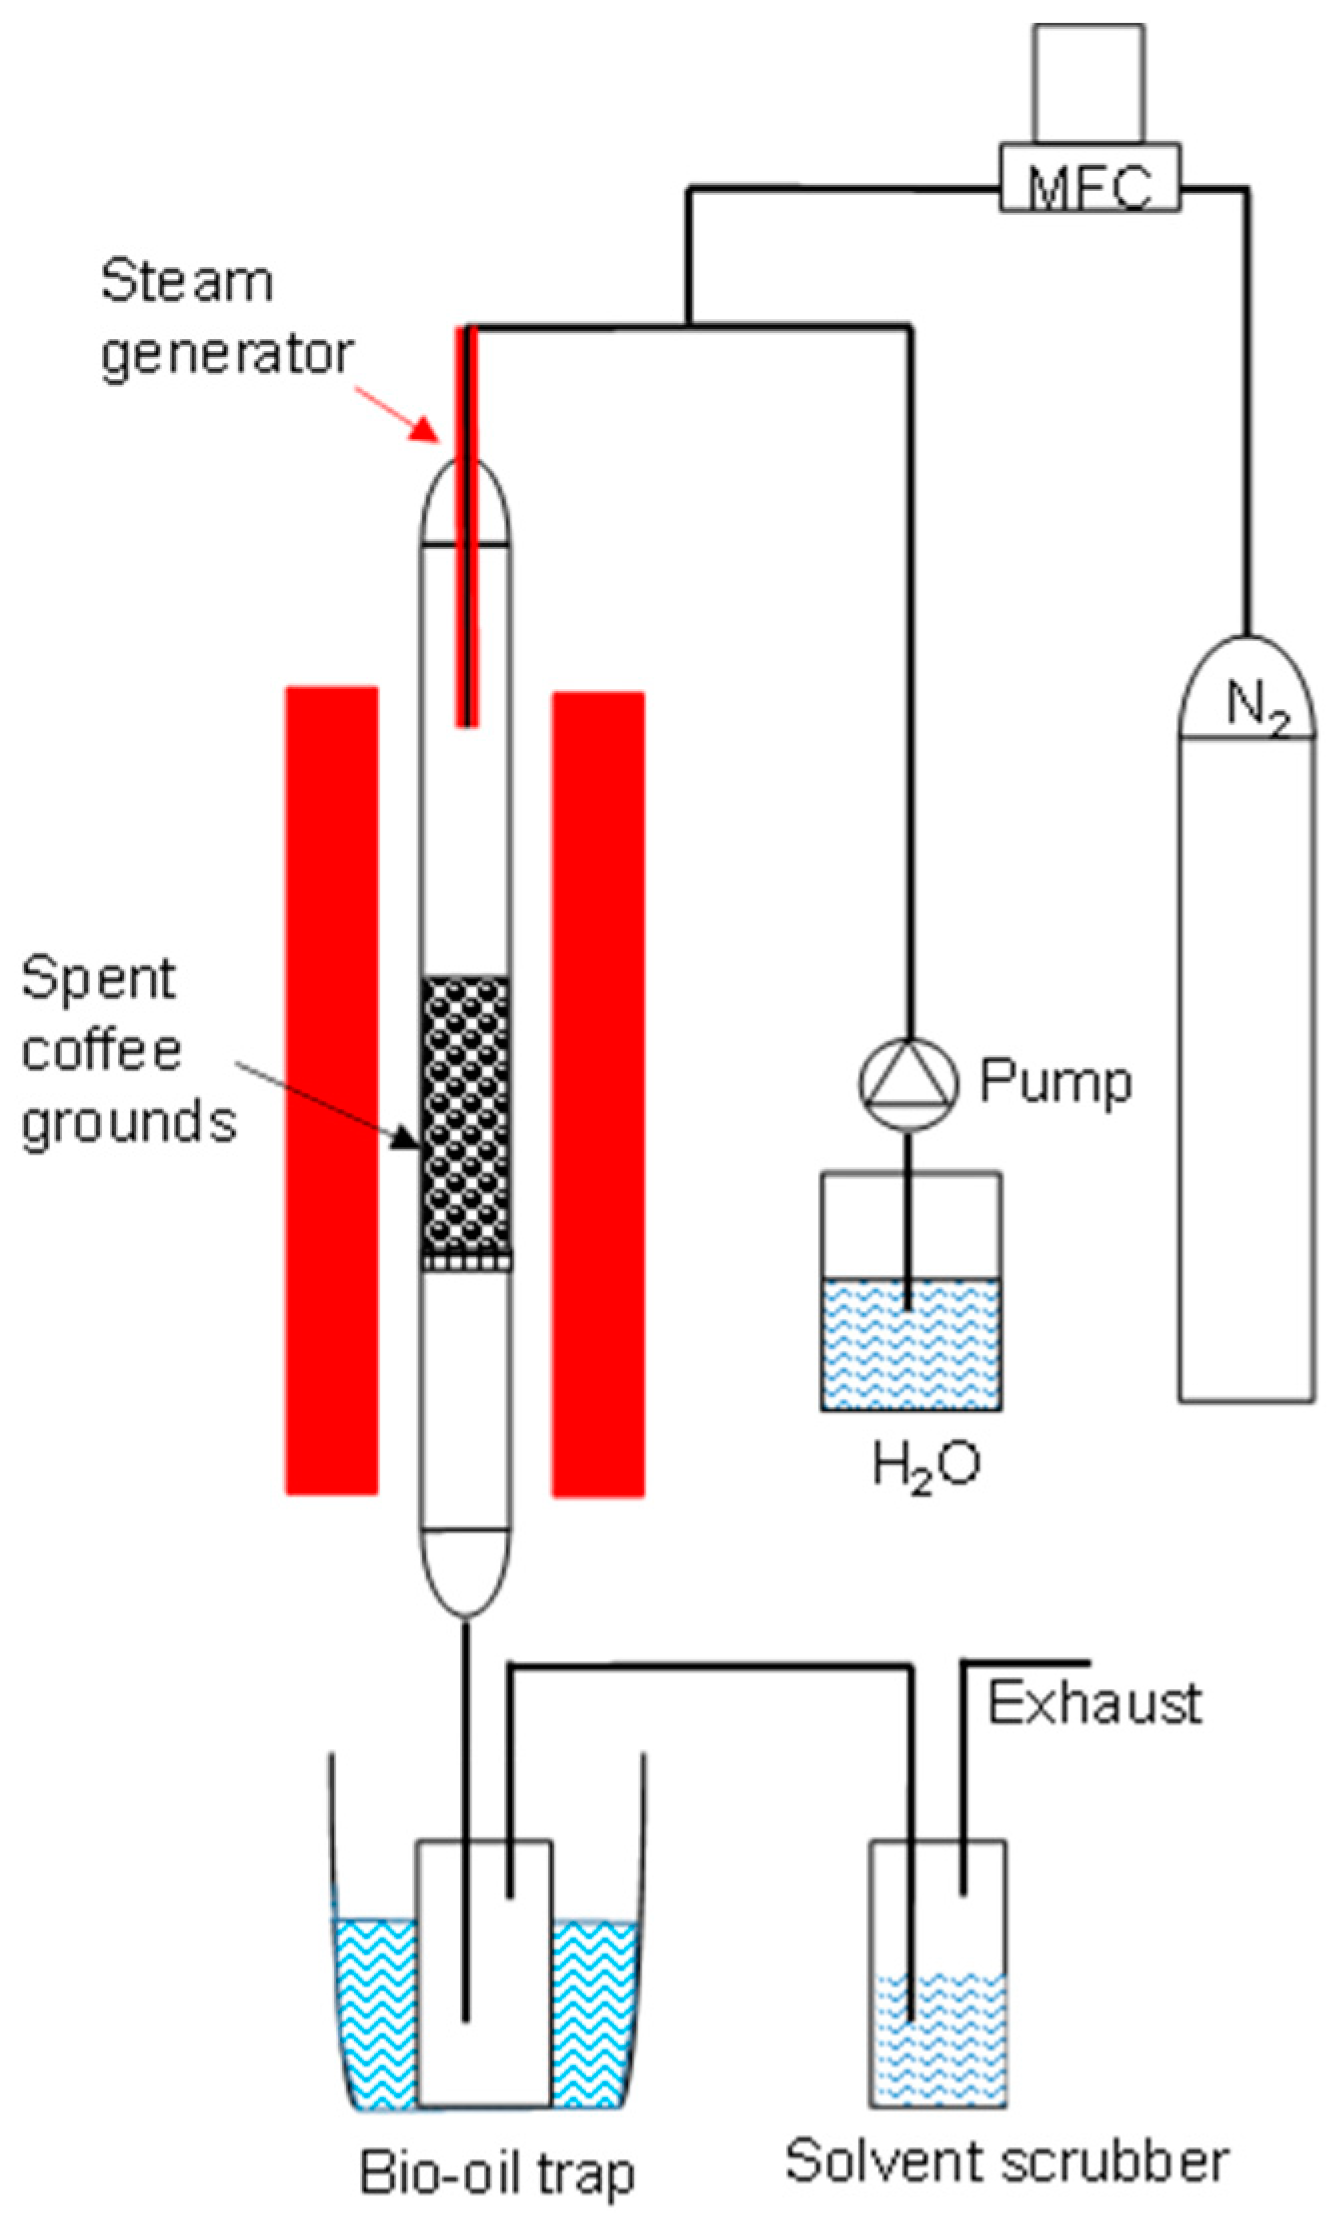
Figure 2.
Schematic representation of cyclic voltammetry electrochemical and impedance spectroscopy measurement setup.
Figure 2.
Schematic representation of cyclic voltammetry electrochemical and impedance spectroscopy measurement setup.

Figure 3.
Properties of biochar and activated carbon samples: (a) N2 adsorption-desorption isotherms at −196 °C (closed and open symbols correspond to adsorption and desorption points, respectively); (b) NLDFT pore size distributions; (c) FESEM image of BC and (d) FESEM image of AC3.
Figure 3.
Properties of biochar and activated carbon samples: (a) N2 adsorption-desorption isotherms at −196 °C (closed and open symbols correspond to adsorption and desorption points, respectively); (b) NLDFT pore size distributions; (c) FESEM image of BC and (d) FESEM image of AC3.

Figure 4.
XRD patterns of biochar and activated carbon.
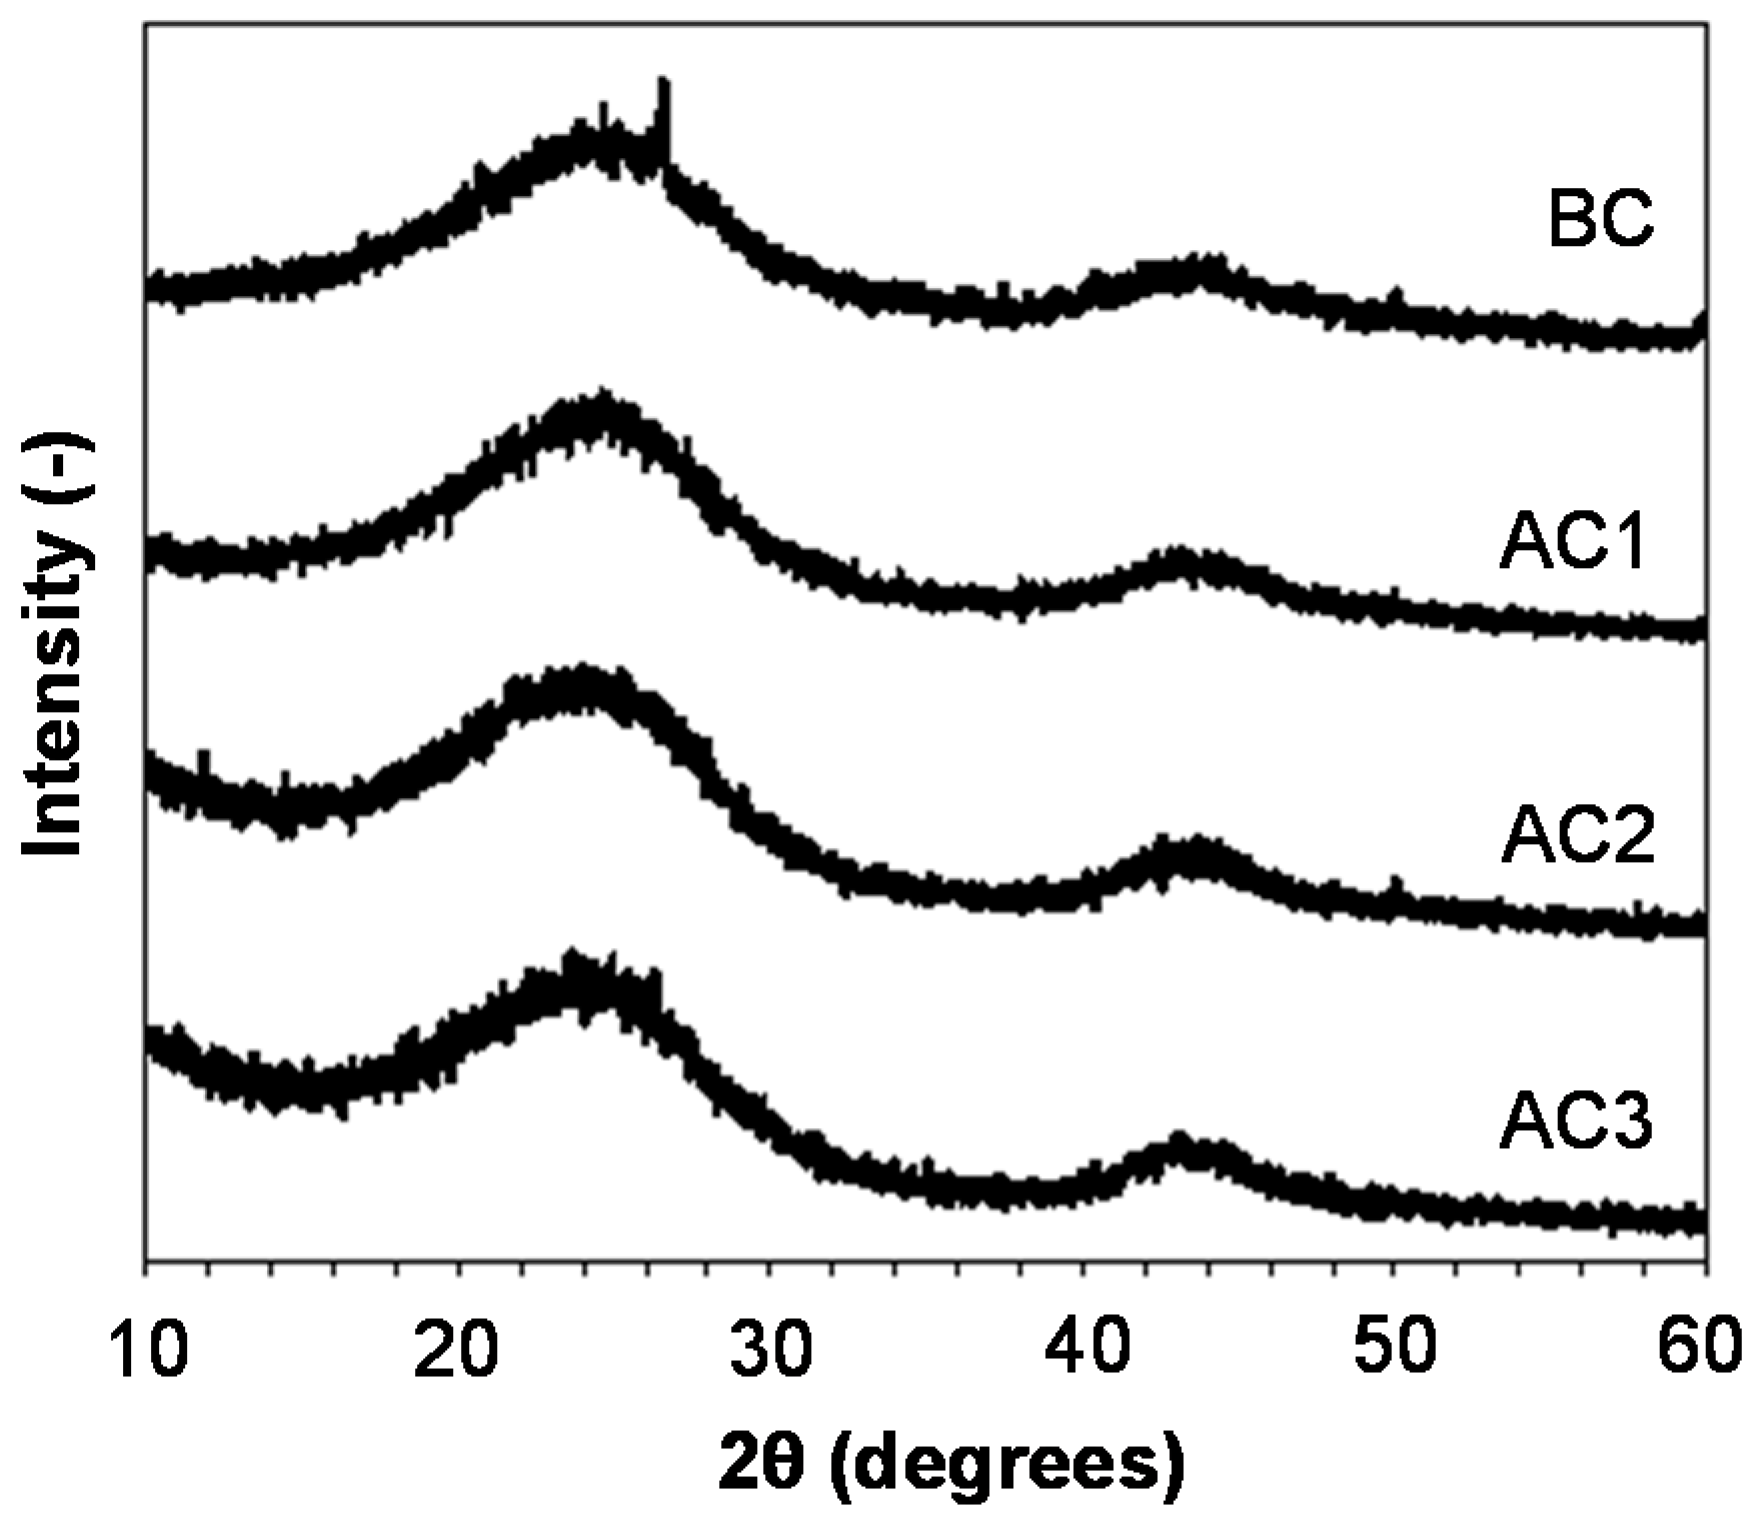
Figure 5.
CVs of a pristine GP (grey curve), BC-modified (black curve) and AC3-modified GP (green curve) electrodes in 1.6 M V3+/4+ containing 4 M H2SO4. Scan rate: 5 mV s−1.
Figure 5.
CVs of a pristine GP (grey curve), BC-modified (black curve) and AC3-modified GP (green curve) electrodes in 1.6 M V3+/4+ containing 4 M H2SO4. Scan rate: 5 mV s−1.

Figure 6.
Nyquist plots of EIS measurement of pristine GP (grey curve), GP-modified with biochar (black curve) and carbon activated at different extents, namely AC1 (red curve), AC2 (dark blue curve), and AC3 (green curve) electrodes, in 1.6 M V4+/5+ containing 4 M H2SO4. The frequency range used was from 0.1 Hz to 100 kHz at an open circuit potential with an alternating potential amplitude of 10 mV.

Figure 7.
Voltage (a) and energy (b) efficiency over different current densities.


Table 1.
Yields and porous characteristics of samples.
| Sample | Yield (%) | Burn-Off (%) | Micropore Volume (mL g−1) | Total Pore Volume (mL g−1) | BET Specific Surface Area (m2 g−1) |
|---|---|---|---|---|---|
| BC | 26.1 | 0 | <0.01 | <0.01 | <1 |
| AC1 | 20.5 | 21 | 0.28 | 0.29 | 541 |
| AC2 | 11.8 | 55 | 0.47 | 0.55 | 817 |
| AC3 | 5.9 | 77 | 0.60 | 0.75 | 1113 |
Table 2.
Ultimate analysis of samples (% by mass on a dry basis).
| Sample | C | H | N | Ash |
|---|---|---|---|---|
| Spent coffee beans | 54.5 | 8.9 | 1.8 | - |
| BC | 81.2 | 1.3 | 2.1 | 5.7 |
| AC1 | 82.3 | 2.2 | 1.4 | 3.3 |
| AC2 | 83.0 | 2.9 | 1.0 | 3.9 |
| AC3 | 83.1 | 2.4 | 0.7 | 4.8 |
© 2018 by the authors. Licensee MDPI, Basel, Switzerland. This article is an open access article distributed under the terms and conditions of the Creative Commons Attribution (CC BY) license (http://creativecommons.org/licenses/by/4.0/).
Share and Cite
MDPI and ACS Style
Krikstolaityte, V.; Joshua, O.E.Y.; Veksha, A.; Wai, N.; Lisak, G.; Lim, T.M. Conversion of Spent Coffee Beans to Electrode Material for Vanadium Redox Flow Batteries. Batteries 2018, 4, 56. https://doi.org/10.3390/batteries4040056
AMA Style
Krikstolaityte V, Joshua OEY, Veksha A, Wai N, Lisak G, Lim TM. Conversion of Spent Coffee Beans to Electrode Material for Vanadium Redox Flow Batteries. Batteries. 2018; 4(4):56. https://doi.org/10.3390/batteries4040056
Chicago/Turabian StyleKrikstolaityte, Vida, Oh En Yao Joshua, Andrei Veksha, Nyunt Wai, Grzegorz Lisak, and Tuti Mariana Lim. 2018. "Conversion of Spent Coffee Beans to Electrode Material for Vanadium Redox Flow Batteries" Batteries 4, no. 4: 56. https://doi.org/10.3390/batteries4040056
Note that from the first issue of 2016, this journal uses article numbers instead of page numbers. See further details here.