Heat Loss Measurement of Lithium Titanate Oxide Batteries under Fast Charging Conditions by Employing Isothermal Calorimeter


Department of Energy Technology, Aalborg University, DK-9220 Aalborg, Denmark
*
Author to whom correspondence should be addressed.
Batteries 2018, 4(4), 59; https://doi.org/10.3390/batteries4040059
Submission received: 3 October 2018
/
Revised: 24 October 2018
/
Accepted: 29 October 2018
/
Published: 20 November 2018
(This article belongs to the Special Issue Thermal Characteristics of Batteries)
Abstract
:To understand better the thermal behaviour of lithium-ion batteries under different working conditions, various experiments were applied to a 13 Ah Altairnano lithium titanate oxide battery cell by means of isothermal battery calorimeter. Several parameters were measured such as the battery surface temperature, voltage, current, power, heat flux, maximum temperature and power area. In addition, the efficiency was calculated. Isothermal battery calorimeter was selected as the most appropriate method for heat loss measurements. Temperatures on the surface of the battery were measured by employing four contact thermocouples (type K). In order to determine the heat loss of the battery, constant current charge and discharge pulses at sixteen different C-rates were applied to the battery. It was seen that the charge and discharge C-rates has a considerable influence on the thermal behaviours of lithium-ion batteries. In this research paper, the C-rate was linked to the peak temperature, efficiency and heat loss and it was concluded that they are linear dependent on the C-rate. In addition, the outcomes of this investigation can be used for battery thermal modelling and design of thermal management systems.
1. Introduction
Lithium-ion batteries are extensively employed in many applications including electric vehicles (EVs), hybrid electric vehicles (HEVs) and many consumer products such as cell phones, tablets and computers. Notwithstanding the foregoing, there are still concerns about the safety of lithium-ion batteries. In other words, safety is an important issue for lithium-ion batteries.
The electric vehicle is one of the significant machines, which are used for transportation. They should work under different weather conditions. Lithium-ion cells are one the most important parts of electric vehicles. The temperature and heat loss characteristics of the lithium-ion batteries in the electric vehicle have a significant influence on the operation performance of the electric vehicle.
Abuse conditions such as excessing external heat, over-charging, over-discharging, nail penetration, crush, high charging currents and external and internal short-circuit can cause battery temperature to go far beyond the manufacturer ratings.
If the heating rate exceeds dissipation rate for the longer time, thermal runaway will occur. Thermal runaway leads to several unwanted accidents such as a leak, smoke, gas venting, flames and rapid battery disassembly.
Battery performance is subordinate of the ambient temperature. For instance, at high temperatures, the battery performance is not in an optimized condition nevertheless at temperate temperatures, the battery performance is in highest level.
Complicated reactions inside the cell causes the non-uniform surface temperature distribution of a battery cell and this result in efficient thermal management to be a challenging problem [1,2].
The lithium ion batteries have so many favourable characteristics compared to the other secondary rechargeable batteries such as lengthened cycling life, charge and capacity maintenance capabilities, developed specific energy densities [3,4]. Regardless of its many advantages, a considerable issue faces manufacturers in taking out the uttermost energy utility from a lithium ion battery pack.
Heavy energy demand condition in electric vehicles leads to extreme increase in pack temperatures so that leading to considerable deterioration of the battery pack’s power supplying capability and performance [3,4].
Research on different forms of transportation systems, which are using clean energy such as Plug-In Hybrid Electric Vehicles (PHEVs), Battery Electric Vehicles (BEVs) and Hybrid Electric Vehicles (HEVs), are increasing. This is because of global warming, environmental pollution and oil prices.
A temperature estimation procedure was presented based upon impulse response method for a lithium ion battery [5]. The magnitude of the current and the width were determined by experimental investigations in order to derive a reference thermal impulse. The experimental outcomes showed a very good agreement between temperatures which was predicted by the suggested algorithm and measurements [5].
A comparative investigation was accomplished between the fibre sensors and thermocouples response with the intention of monitoring the temperature changes, which occurred in three different positions of a lithium battery [6]. Various discharge rates and constant current charge, under abusive and normal operating conditions were applied to the battery. For this studied case, the outcomes demonstrated that the fibre Bragg grating sensors have better resolution compared to the K type thermocouples. It was concluded that they are appropriate tool for an optimum management in batteries and failure detection. In addition, they are better option for the real time monitoring of the surface temperature of the lithium batteries [6].
The calendar aging impacts on the thermal safety of a 4.6 Ah pouch cells was studied by using a battery test calorimeter [7]. The outcomes demonstrated the cell thermal safety improved after aging. It was concluded that the thermal runaway temperature and the self-heating temperature were increased. In addition, the exothermal rate during thermal runaway was decreased [7].
To contribute to the finding of a temperature gradient in real time inside a lithium-ion cell, which could specify feasible damage in the battery performance under abnormal and normal operating conditions, the integration of Fibre Bragg Grating (FBG) sensors was presented for internal and external temperature monitoring of lithium-ion cells [8]. Temperature variations were measured by four FBG sensors. The sensors were located both inside and outside the cell during cycling at C-rates ranging from 1 C to 8 C [8].
A new method was proposed to utilize differential voltage for prediction of the internal temperature of a lithium-ion pouch cell [9]. It was concluded that the difference between measured internal and external temperatures depends on the ambient temperature and C-rate. In addition, for a continuous discharge rate condition, the difference, between measured and surface temperatures, increases at start of discharge [9].
The discharging and charging analysis of a 50 Ah lithium-iron phosphate battery under temperature range of −40 °C to 40 °C were accomplished with the intention of investigating the effect of the environment temperatures on the internal resistance, efficiency, voltages, the cycle life and the consistency of the battery during discharging and charging [10]. In addition, the experiments were advantageous to selection of the battery and the designing and modelling of the thermal management [10].
A thermal investigation of lithium-ion batteries during discharging, charging and thermal runaway have been accomplished by using a mathematical model [11]. The impacts of battery operating conditions and design parameters were examined on temperature profile during routine battery application and the evaluation of the thermal runaway owing to battery abuse [11].
A comprehensive three-dimensional thermal model was prospered to investigate the thermal behaviour of a lithium-ion battery [11]. In addition, a simplified thermal model was suggested pursuant to validation from the detailed thermal model and the analysis of different simplification procedures. The models described satisfyingly the asymmetric temperature distribution inside a lithium-ion battery [11].
Main parameters of a lithium-ion battery cell were measured at temperature between −30 °C and +50°C. The measured parameters include main parameters of equivalent electric-circuit based models such as the open-circuit voltage, the discharge capacity and the discharge and charge resistance [12].
The thermal modelling and experimental validation of a large prismatic lithium-ion battery were investigated [13]. A lumped model was proposed which presented the principal thermal phenomena in the cell. Interfacial thermal resistance, the internal thermal resistance and the heat capacity were determined experimentally. The suggested model was validated with an accuracy of 1 °C [13].
The thermal analysis of cylindrical lithium-ion battery cells and modules were investigated by employing electro thermal finite element model [14]. The simulation outcomes demonstrated good agreement with measurements. It was concluded that the electro-thermal finite element model, which was developed in this research, could characterize properly the thermal behaviour of a battery pack. In addition, the model could be applied to battery cells with different geometries, like pouch and prismatic cells [14].
Accelerating rate calorimeter was used to measure temperature of the cells and to characterize heat capacity during discharge in adiabatic mode [15]. Variations in entropy and impedance profile were noticed as result of prolonged cycling. Outcomes clarified the complicated relationship between energy efficiency, resulting thermal behaviour and cell aging conditions. Cells at identical state of health demonstrated remarkably different thermal behaviour and energy efficiencies during discharge [15].
A thermal-electrochemical modelling approach were used to understand the thermal behaviour of lithium-ion cells [16]. In addition, simulations were used to approximate the active material utilization and the electrical and thermal energy at different rates in order to comprehend the effect of electrochemistry on the temperature and vice versa [16].
A modelling method was offered to anticipate the thermal behaviours of a lithium-ion battery during constant-power charge and discharge [17]. In addition, an efficient algorithm was demonstrated to approximate the current and voltage of a lithium-ion battery as a subordinate of time in constant-power charge and discharge conditions. The two-dimensional temperature distributions of the lithium-ion battery cell as a subordinate of time were calculated. The temperature distributions, which were obtained from the experimental measurements, agree well with the modelling [17].
Recently, considerable attention has been paid to designing proper and efficient thermal management systems for lithium-ion batteries. Isothermal battery calorimetry is a very effective method for characterizing the thermal behaviours of lithium-ion batteries. However, to the author’s best knowledge, very few publications can be found in the literature that discuss and address the issue of thermal behaviours of lithium-ion batteries under fast charging conditions by using isothermal battery calorimeter. However, most of the previous studies did not take into account the effect of temperature, efficiency and current rate on the battery heat loss at fast charging and discharging conditions.
Future electric vehicles need to be able to be charged in a time frame comparable to the refilling time of nowadays conventional combustion vehicles in order to be attractive. In consequence, in this work, the thermal behaviour and heat loss of a lithium-ion battery subjected to different fast charging and discharging protocols was investigated.
2. Experimental Setup
The experiments were accomplished by employing isothermal battery calorimeter, which was manufactured by NETZSCH. The calorimeter is not comprehensively automatic. Approximately all of the functions are controlled manually through the front panel. All of the experimentation parameters and data acquisition are set up with the user-friendly control program.
The isothermal battery calorimeter is an isothermal calorimeter capable of operating from minus thirty to sixty degree Celsius. The isothermal battery calorimeter can measure heat generated by any kind of batteries functioning between 100 mW and 50 W. The main diagram of the calorimeter is illustrated in Figure 1. As can be seen from the figure, it consists of a tank, cooling plate, heating element and isothermal bath. To control the fluids flow, four solenoid valve and one manual valve and motorized ball valve are employed.
The Maccor automated test system was connected to the IBC 284 through four cables. Maximum current, power and voltage of the IBC 284 are 250 A and 50 W, 50 V correspondingly. The IBC 284, setup of the battery cell inside the calorimeter and Maccor automated test system are illustrated in Figure 2. Surface temperature was measured by using contact thermocouples to understand and determine the evolution of surface temperature distribution on the surface of the battery. The IBC 284 measured these parameters simultaneously. Positions of thermocouples on the battery cell surface are shown in Figure 3.
The IBC 284 has a high thermal inertia, which confines its cooling and heating rates. An uttermost of five K/h could be reached in the intermediate of the temperature range. The cooling and heating rates may be around one to two K/h near to the ends. For example, when starting from 30 °C for a test to be run at 45 °C, it may take three hours to reach a well temperature equilibrium. Isothermal bath stability and enthalpy accuracy of the IBC 284 are 0.01 °C and 2% correspondingly.
Determination of heat flux area was accomplished through linear baseline. The IBC is working in isothermal conditions, so the measurements selected were linear for all the experiments. Baseline stability and noise were 30 and 5 mW correspondingly. Heat flux background noise is illustrated in Figure 4. The average background noise of the heat flux, which was measured from peak to peak, was less than 15 mW.
3. Experimental Procedure
At the beginning, the isothermal bath was drained to gain access to the calorimeter chamber. The liquid was transferred from the isothermal bath to the bottom tank until the level reached beneath the calorimeter lid. The calorimeter lid is shown in Figure 5a. The lid is entirely insulated and ensures the IBC tightness by employing sixteen latches.
A fixture was designed for the battery to avoid expansion during operation. After placing the battery inside the calorimeter chamber, it was connected electrically. For this purpose, two wires for powering and two wires for sensing were attached to the existing connections. To be operated by the Maccor automated test system, the battery was connected to the two bus bars. Following that, the calorimeter lid was fastened by placing it on the box and closing all the latches. Once the experiment was established, the bath was filled out with liquid. Filling the isothermal bath operates the reverse draining way.
The calorimeter chamber pressure was increased until it reached two psi. When the pressure reaches greater than three psi owing to a temperature increase in the instrument, it will release pressure to protect the rupture disk from bursting. When the pressure reaches under two psi owing to a temperature decline in the instrument, it will open a solenoid valve, so that the calorimeter can be filled with inert gas.
The temperature set point was defined. To achieve very good temperature homogeneity inside the isothermal bath stirring motors were turned on. Two different ranges exist for heating. The high power range was used to move quickly from one temperature to a higher one in order to save time. The low power range was used during measurement in order to assure very good and stable temperature control of the isothermal bath.
In order to measure the temperature distribution of the battery during charging and discharging cycles, four thermocouples were used which were located onto four different locations on the battery. The battery cell, which was used in the experiments are illustrated in Figure 5b.
4. Calibration
Calibration of the IBC 284 consists of applying electrical current to a precision resistance, which is located inside the calorimeter chamber of the IBC 284. The calibration of the calorimeter was performed at several temperatures.
Joule effect calibration procedure, which is a common method to most calorimeters, was employed for the calibration of the IBC 284. A controlled electrical current was applied to a precision resistance, which was placed inside the calorimeter chamber of the IBC 284. Setup of the Joule effect protocol, which was defined from Maccor automated test system side is shown in Table 1. Rest period before and after each pulse was selected one hundred eighty minutes. Therefore, whole period of the Joule effect protocol was twenty-one hours, which means that full standard calibration process of the instrument lasted at least 4 days.
It was assumed that one hundred percent of the electrical energy, which was applied to the resistance, was converted into heat. The heat, which was actually measured by the sensors, was compared to electrical energy expended by the resistance. The measuring range of the IBC 284 is from 100 mW to 50 W, which was adapted to the power of the different Joule effect pulses. A 500 mΩ resistance with one percent precision and 50 W power rating and temperature coefficient of 100 ppm/°C was employed for calibration. Setup of the calibration resistance, which was placed inside the calorimeter chamber, is illustrated in Figure 6. The contact between the calorimeter bottom plate and the resistance was provided as well as possible so all the heat, which was generated by the resistor, transferred to the sensors. Current pulses and corresponding heat fluxes are illustrated in Figure 7. Calibration coefficients at a specific temperature was determined by using the following equation:
where
- CC: Calibration coefficient;
- A1: Power area;
- A2: Heat flux area;
- T: Temperature.
By calculating the four calibration runs at 20 °C, 30 °C, 40 °C and 50 °C and applying third order polynomial regression to the four calibration coefficients, the calibration coefficient evolution was obtained in polynomial form in regard to temperature. Calibration graph at different temperature are illustrated in Figure 8.
The calibration was accomplished at many different temperatures ranging from 20 °C to 50 °C. Several calibration coefficients were computed from these different calibrations at different temperatures. By using the produced data, a calibration polynomial was generated. The equation, which was resulted, represents the calibration as a function of temperature.
5. Results
Constant charge and discharge current rates from 1 C to 8.5 C were applied to the battery to measure different parameters. Heat loss and efficiency were the most important parameters, which were measured in these experiments. Load profile, which was applied to the battery in 33 period, is illustrated in Figure 9. The period was a time, which was needed for discharging or charging the battery cell at each step and cycle.
To determine heat flux area, the starting point was defined at a point just before the discharge or charge begins. At this point, the heat flux signal was stabilized and was near to its baseline level. The ending point was selected far from the end of discharge or charge. Subsequently six to seven hours after the end point all the heat was evacuated and the heat flux signal was returned to its baseline level. A linear baseline was employed for area determination.
Heat loss at different temperature was determined by integration of the heat flux over the period. The energy loss is the integration of the power over the period of time, which was defined from starting point to ending point. Processing of the data was accomplished by means of Proteus Analysis Software (PAS) and MATLAB.
Experiments were carried out to better comprehend the thermal behaviours of lithium-ion batteries under different working conditions. The main concern of the paper was to find out the effect of efficiency and current rate on the battery heat loss; especially at fast charging and discharging conditions.
The heat loss, which was produced by the cell, was determined at different charge and discharge constant current conditions and temperatures. At first, heat flux was measured by the calorimeter, which was followed by determining the graph using produced heat flux data. Heat flux area is the integration of the heat flux over the period of time, which was defined from starting point to ending point. Heat flux variations of 13 Ah Altairnano battery cell at different charge and discharge rates is illustrated in Figure 10. Surface temperature evolution of the 13 Ah Altairnano battery cell during charging and discharging cycles are illustrated in Figure 11. In order to determine the battery efficiency, total energy loss was subtracted from the absolute power area and then it was divided by the absolute power area. The following equation was used for determining the battery efficiency:
A comprehensive investigation of the battery cell thermal behaviour by using isothermal calorimeter is illustrated in Table 1 and Table 2. Different parameters such as the current, efficiency, maximum temperature and heat loss are illustrated. The overall measurement results during charge cycles are summarized in Table 2. These data were obtained from the calorimetric measurements. The variation of efficiency, heat loss and maximum temperature at four different positions during 1 C to 8.5 C full charging and discharging at 20 °C are illustrated. From an overall prospective, most of the categories showed overall increase pattern from 1 C to 8 C.
At the third column, heat losses during charge are compared to each other from 1 C to 8.5 C. As is observed from the given data heat losses had increased more than any other category. The overall pattern from 1 C to 8.5 C is a moderate increase except from 7 C to 8.5 C. Looking at the detail, heat loss during charge started at 6986 J for 1 C and then experienced a moderate growth from 1 C to 1.5 C. Then there was a moderate rise from 1.5 C to 2 C but much steeper than previous one. After that up to 6.5 C the variations pattern was almost the same. The most dramatic change could be seen from 7 C to 7.5 C, which was an increase of 13% relative to 7 C. On the contrary, the lowest growth was from 7.5 C to 8 C, which was about 80 J. Unlike other C-rates from 5 C to 6.5 C showed a linear variation in heat loss. The most striking feature was a six-fold increase of heat loss from 1 C to 8.5 C.
As is observed from the data, in contrast to heat loss, the efficiency during charging and discharging showed a decreasing pattern from 1 C to 8.5 C. For charging started with 93.86% for 1 C and then dropped modestly to 6.5 C. Then it dropped slightly from 6.5 C to 7 C. After that, it experienced a noticeable decrease from 7 C to 7.5 C. This was followed by another decrease from 7.5 C to 8 C, although much milder. The highest percentage of efficiency was for 1 C while the lowest was for 8.5 C, which were 93.86% and 49.19% correspondingly. It was detected that the highest rate of decline was from 7 C to 7.5 C, which was a decrease of 6.22%. The lowest decrease was from 5 C to 5.5 C, which was about 2.2%. The most striking feature is 44.67% decrease in efficiency from 1 C to 8.5 C.
The overall measurement results during discharge cycles are summarized in Table 3. As can be seen, heat loss during discharge experienced almost a similar pattern compared to charging which was an increasing pattern from 1 C to 8 C. Looking at the detail, heat loss during discharging started at 8424 J for 1 C and reached to 40,100 J for 8 C. Like charging, the highest rate of increase was from 7 C to 7.5 C, which was an increase of 11.1%. The lowest climb was from 7.5 C to 8 C, which was about 100 J. A five-fold growth was seen in heat loss from 1 C to 8 C for discharging.
The efficiency during discharging started with 93.22 % for 1 C and then declined modestly to 8 C. The rate of decrease was almost the same from 1 C to 8 C. Reduction from 6 C to 6.5 C, was a little higher compared to 6.5 C to 7 C. Then it dropped moderately from 7 C to 7.5 C. After that, it experienced a decrease from 7.5 C to 8 C although much calmer than previous one. The highest percentage of efficiency was for 1 C while the lowest was for 8 C, which were 93.22% and 68.67% correspondingly. It was detected that the highest rate of decline was from 7 C to 7.5 C, which was 2.53% and the lowest decrease was from 7.5 C to 8 C, which was about 1.08%. The most striking feature was 24.55% decrease in efficiency from 1 C to 8 C.
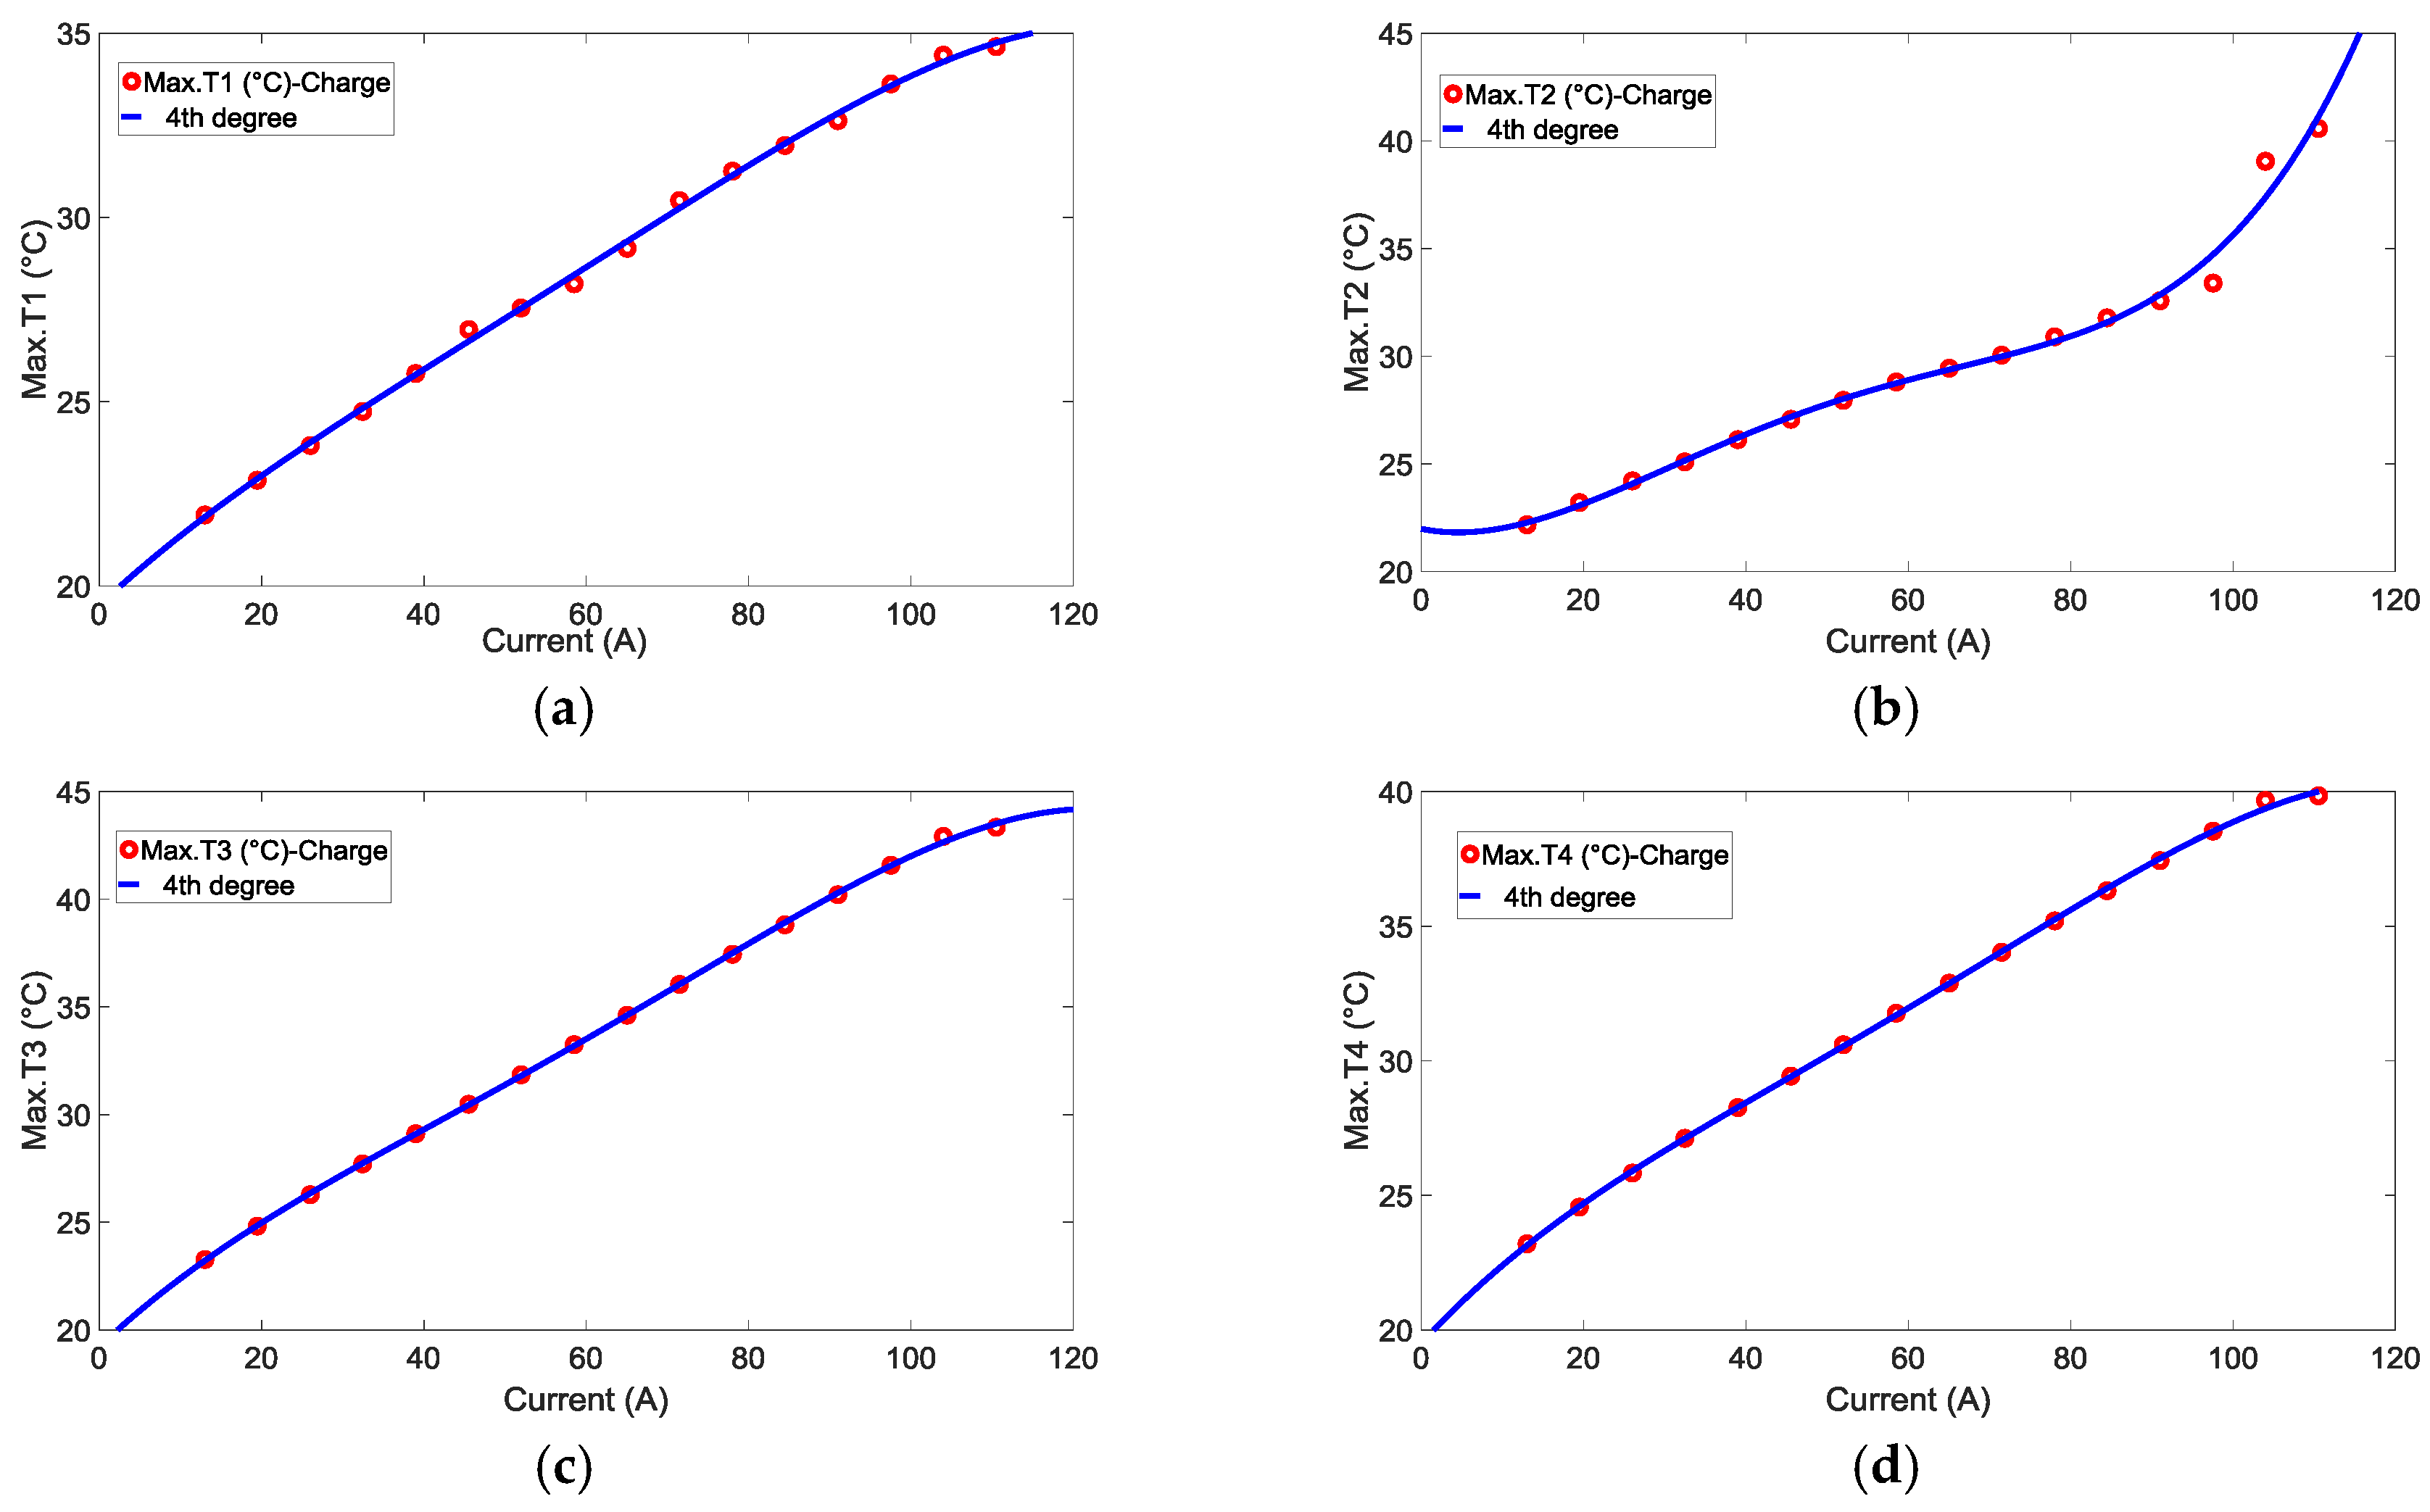
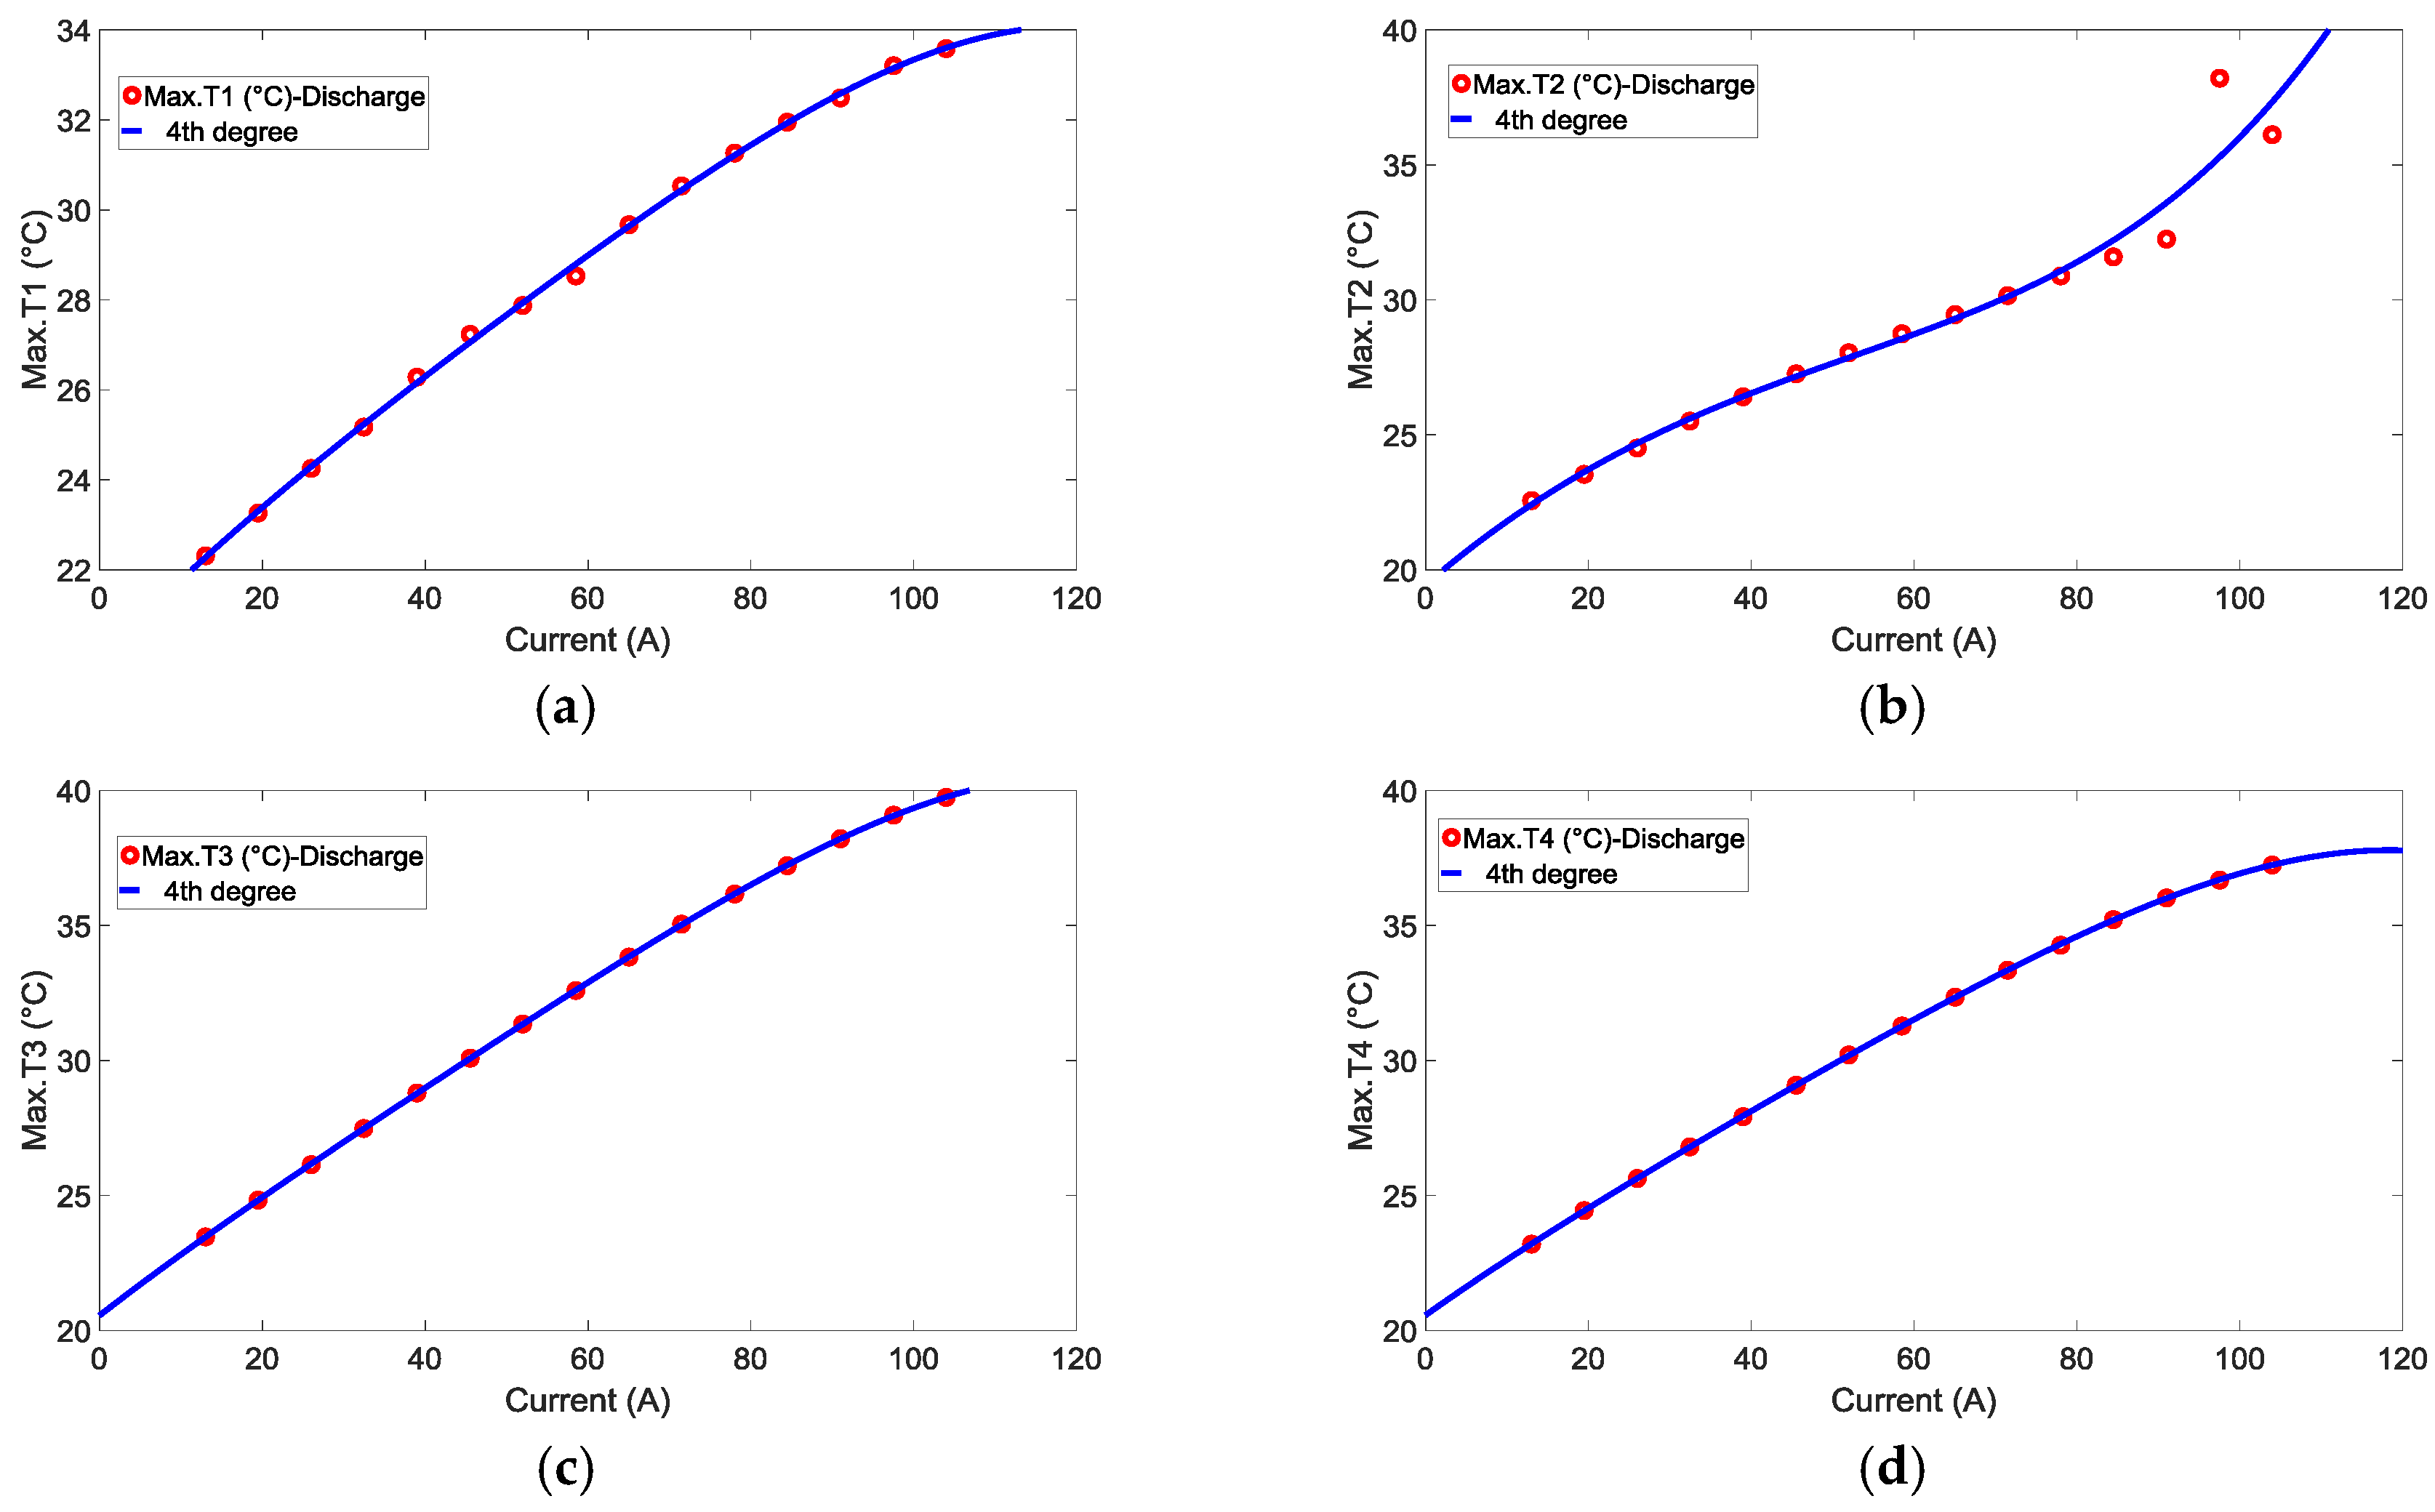
According to the given data, during charging maximum temperatures demonstrated almost slightly increasing pattern from 1 C to 8.5 C. It starts from 21.93, 22.17, 23.26, 23.19 °C and reached to 34.64, 40.57, 43.34, 39.83 °C for thermocouples 1, 2, 3 and 4 correspondingly. The highest temperature variation was seen for T3, which was 20.08 °C. The pattern for discharge was almost the same as charge.
The resulting heat loss, efficiency and maximum temperatures during charging and discharging were considered according to polynomial equation. Coefficients A, B, C, D and E during charge and discharge are shown in Table 4 and Table 5 respectively. The fourth order polynomial was used for data fitting:
Efficiency and heat loss evolution and fourth order polynomial curve fitting during charging and discharging are shown in Figure 12. Maximum temperatures evolution at four different location of the battery surface and fourth order polynomial curve fitting during charging and discharging are shown in Figure 13 and Figure 14 correspondingly. It is clear from the figures that the fitting graphs are in good agreement with the experimental data.
The heat losses and efficiencies results demonstrated completely different shape for different C-rates. In addition, their corresponding amounts varied between discharge and charge procedures. It is clear that the efficiency tends to decrease, towards high current rates during discharging and charging. Conversely, the corresponding heat loss tends to increase. It was seen that the thermal efficiency during charge was lower than that of discharge except for 13 A, 19.5 A and 26 A, which was greater. In addition, it could be seen that the discrepancy between discharge and charge thermal efficiencies increased at higher current rates. This difference was highest at 97.5 A.
The efficiency, heat generation and temperature seem to be linear depending on the C-rate. It should be noted that when the current doubles, the average power become four times as big but only for half of the time, so the energy loss only doubles. This indicates, that R × I2 actually is the dominating heat loss component. The great influence of the functioning current on the heat loss of the battery cell were approved by the experiments, which were accomplished by IBC. This might be attributed to the great influence of current on reversible and irreversible heat sources.
It was observed that the heat loss during charge was lower than that of discharge except for 97.5 A and 104 A, which was greater. In addition, it could be seen that the discrepancy between discharge and charge heat losses remained almost the same for all current rates. This difference was highest at 19.5 A. It was concluded that the heat loss variation level is approximately linear. This linear heat loss is responsible for the linear alteration of corresponding efficiency in various C-rates in the specified temperature. A non-linear drop in efficiency was seen at high rates. Likely this is due to the reduced energy that can be extracted from the battery at higher rates.
6. Conclusions
Several calorimetric experiments were accomplished to comprehend thermal behaviour of the battery under different conditions. Important parameters such as heat loss and efficiency were determined. This paper has clearly shown that efficiency is in opposite proportion to heat loss, which can be seen from the table data. From the outcome of our investigation, it is possible to conclude that the amount of heat loss is related to the corresponding current rate. Especially this accomplishment will contribute to thermal modelling. A new method will be used for lithium-ion batteries thermal modelling through isothermal battery calorimeter. Heat generation measurements would be the first step for this thermal modelling. A dynamic heat source will be defined for the battery model. The surface temperatures of the battery, which were measured in this investigation, can be employed for the thermal model validation of the battery. Summing up the results, it can be concluded that heat loss for charging and discharging reached to 35,793 J and 34,100 J in 8.5 C and 8 C correspondingly. These findings will help us to design a proper thermal management system for the battery pack. The findings suggest that this approach could also be useful for a precise temperature prediction, which is needed to avoid temperature non-homogeneity in the cell. For this purpose, future investigations will be accomplished in order to integrate the heat loss into computational fluid dynamics simulations to attain trustworthy temperature profile and heat generation anticipating in the battery.
Author Contributions
S.S.M. proposed the idea of the paper; S.S.M. wrote the paper; E.S. provided suggestions on the content and structure of the paper; S.K.K. and E.S. has been reviewing the draft manuscripts.
Funding
This research received no external funding.
Conflicts of Interest
The authors declare no conflict of interest.
References
- Newman, J.; Thomas, K.E.; Hafezi, H.; Wheeler, D.R. Modeling of lithium-ion batteries. J. Power Sources 2003, 119, 838–843. [Google Scholar] [CrossRef]
- Bandhauer, T.M.; Garimella, S.; Fuller, T.F. A Critical Review of Thennal Issues in Lithium-Ion Batteries. J. Electrochem. Soc. 2011, 158, R1–R25. [Google Scholar] [CrossRef]
- Chen, J.; Cheng, F. Combination of lightweight elements and nanostructured materials for batteries. Acc. Chem. Res. 2009, 42, 713–723. [Google Scholar] [CrossRef] [PubMed]
- Kizilel, R.; Sabbah, R.; Selman, J.R.; Al-Hallaj, S. An alternative cooling system to enhance the safety of Li-ion battery packs. J. Power Sources 2009, 194, 1105–1112. [Google Scholar] [CrossRef]
- Xiao, Y.; Torregrossa, D.; Paolone, M. Surface Temperature Estimation of Li-ion Battery via Thermal Impulse Response Technique. In Proceedings of the Applied Power Electronics Conference and Exposition (APEC), Charlotte, NC, USA, 15–19 March 2015; pp. 1089–1095. [Google Scholar]
- Nascimento, M.; Ferreira, M.S.; Pinto, J.L. Real time thermal monitoring of lithium batteries with fiber sensors and thermocouples: A comparative study. Meas. J. Int. Meas. Confed. 2017, 111, 260–263. [Google Scholar] [CrossRef]
- Zhang, J.; Su, L.; Li, Z.; Sun, Y.; Wu, N. The Evolution of Lithium-Ion Cell Thermal Safety with Aging Examined in a Battery Testing Calorimeter. Batteries 2016, 2, 12. [Google Scholar] [CrossRef]
- Novais, S.; Nascimento, M.; Grande, L.; Domingues, M.F.; Antunes, P.; Alberto, N.; Leitão, C.; Oliveira, R.; Koch, S.; Kim, G.T.; et al. Internal and External Temperature Monitoring of a Li-Ion Battery with Fiber Bragg Grating Sensors. Sensors 2016, 16, 1394. [Google Scholar] [CrossRef] [PubMed]
- Tripathy, Y.; Mcgordon, A.; Low, J.; Marco, J. Internal temperature prediction of Lithium-ion cell using differential voltage technique. In Proceedings of the 2017 IEEE Transportation Electrification Conference and Expo (ITEC), Chicago, IL, USA, 22–24 June 2017; pp. 464–467. [Google Scholar]
- Zang, M.; Wang, S. Investigation of temperature performance of Lithium-ion batteries for electric vehicles. In Proceedings of the 2017 IEEE Transportation Electrification Conference and Expo, Asia-Pacific (ITEC Asia-Pacific), Beijing, China, 31 August–3 September 2014; pp. 1–8. [Google Scholar]
- Chen, S.C.; Wan, C.C.; Wang, Y.Y. Thermal analysis of lithium-ion batteries. J. Power Sources 2005, 140, 111–124. [Google Scholar] [CrossRef]
- Hussein, A.A. Experimental modeling and analysis of lithium-ion battery temperature dependence. In Proceedings of the 2015 IEEE Applied Power Electronics Conference Exposition, Charlotte, NC, USA, 15–19 March 2015; pp. 1084–1088. [Google Scholar]
- Damay, N.; Forgez, C.; Bichat, M.P.; Friedrich, G.; Ospina, A. Thermal modeling and experimental validation of a large prismatic Li-ion battery. In Proceedings of the 2013–39th Annual Conference of the IEEE Industrial Electronics Society, Vienna, Austria, 10–13 November 2017. [Google Scholar]
- Ma, Y.; Teng, H.; Thelliez, M. Electro-Thermal Modeling of a Lithium-ion Battery System. SAE Int. J. Engines 2010, 3, 306–317. [Google Scholar] [CrossRef]
- Geder, J.; Arunachala, R.; Jairam, S.; Jossen, A. Thermal behavior of aged lithium-ion batteries: Calorimetric observations. In Proceedings of the IEEE Green Energy and Smart Systems Conference (IGESSC), Long Beach, CA, USA, 9 November 2015; pp. 24–29. [Google Scholar]
- Srinivasan, V.; Wang, C.Y. Analysis of Electrochemical and Thermal Behavior of Li-Ion Cells. J. Electrochem. Soc. 2003, 150, A98. [Google Scholar] [CrossRef]
- Kim, U.S.; Yi, J.; Shin, C.B.; Han, T.; Park, S. Modeling the Thermal Behaviors of a Lithium-Ion Battery during Constant-Power Discharge and Charge Operations. J. Electrochem. Soc. 2013, 160, A990–A995. [Google Scholar] [CrossRef]
Figure 1.
Main diagram of the IBC 284.

Figure 2.
Experimental setup. (a) Isothermal battery calorimeter; (b) Maccor automated test system.

Figure 3.
Locations of thermocouples on the battery cell surface.

Figure 4.
The background noise of heat flux.

Figure 5.
The internal outlook of the calorimeter and battery. (a) Calorimeter lid; (b) 13 Ah Altairnano lithium titanate oxide battery cell.
Figure 5.
The internal outlook of the calorimeter and battery. (a) Calorimeter lid; (b) 13 Ah Altairnano lithium titanate oxide battery cell.

Figure 6.
Resistance inside the calorimeter for calibration.

Figure 7.
Calibration graph at 20 °C including power pulse and heat flux.

Figure 8.
Calibration polynomial of the calorimeter.

Figure 9.
Battery current in function of time.

Figure 10.
Heat flux variations of 13 Ah Altairnano battery cell.

Figure 11.
Surface temperature of the 13 Ah Altairnano battery cell.

Figure 12.
Efficiency and heat loss evolution and their curve fitting during charge and discharge. (a) Efficiency-Charge; (b) Heat loss-Charge; (c) Efficiency-Discharge; (d) Heat loss-Discharge.
Figure 12.
Efficiency and heat loss evolution and their curve fitting during charge and discharge. (a) Efficiency-Charge; (b) Heat loss-Charge; (c) Efficiency-Discharge; (d) Heat loss-Discharge.

Figure 13.
Maximum temperatures evolution and their curve fitting during charge. (a) Max. T1-Charge; (b) Max. T2-Charge; (c) Max. T3-Charge; (d) Max. T4-Charge.
Figure 13.
Maximum temperatures evolution and their curve fitting during charge. (a) Max. T1-Charge; (b) Max. T2-Charge; (c) Max. T3-Charge; (d) Max. T4-Charge.

Figure 14.
Maximum temperatures evolution and their curve fitting during discharge. (a) Max. T1-Discharge; (b) Max. T2-Discharge; (c) Max. T3-Discharge; (d) Max. T4-Discharge.
Figure 14.
Maximum temperatures evolution and their curve fitting during discharge. (a) Max. T1-Discharge; (b) Max. T2-Discharge; (c) Max. T3-Discharge; (d) Max. T4-Discharge.


Table 1.
Setup of the Joule effect protocol.
| Pulse/Rest Number | Power Pulse (W) | Current Pulse (A) | Pulse/Rest Period (min) |
|---|---|---|---|
| Rest period 1 | 0 | 0 | 180 |
| Joule effect Pulse 1 | 0.1 | 0.4472 | 180 |
| Rest period 2 | 0 | 0 | 180 |
| Joule effect pulse 2 | 1 | 1.4142 | 180 |
| Rest period 3 | 0 | 0 | 180 |
| Joule effect pulse 3 | 10 | 4.4721 | 180 |
| Rest period 4 | 0 | 0 | 180 |
Table 2.
A comprehensive calorimetric analysis of 13 Ah Altairnano battery cell at 20 °C during charge.
Table 2.
A comprehensive calorimetric analysis of 13 Ah Altairnano battery cell at 20 °C during charge.
| Current (A) | Efficiency (%) | Heat Loss (J) | Max. T1 (°C) | Max. T2 (°C) | Max. T3 (°C) | Max. T4 (°C) | Power Area (J) |
|---|---|---|---|---|---|---|---|
| 13 | 93.86 | 6986 | 21.93 | 22.17 | 23.26 | 23.19 | 113,780 |
| 19.5 | 91.79 | 9011 | 22.87 | 23.22 | 24.83 | 24.56 | 109,760 |
| 26 | 89.11 | 11,911 | 23.82 | 24.2 | 26.29 | 25.83 | 109,380 |
| 32.5 | 86.16 | 14,704 | 24.74 | 25.09 | 27.7 | 27.12 | 106,240 |
| 39 | 83.59 | 17,045 | 25.76 | 26.14 | 29.11 | 28.26 | 103,870 |
| 45.5 | 81.2 | 19,190 | 26.96 | 27.07 | 30.48 | 29.42 | 102,070 |
| 52 | 78.95 | 21,425 | 27.55 | 27.96 | 31.86 | 30.6 | 101,780 |
| 58.5 | 76.35 | 23,946 | 28.2 | 28.79 | 33.26 | 31.76 | 101,250 |
| 65 | 72.99 | 26,239 | 29.17 | 29.44 | 34.61 | 32.89 | 97,150 |
| 71.5 | 70.79 | 28,987 | 30.46 | 30.06 | 36.03 | 34.02 | 99,240 |
| 78 | 66.81 | 31,534 | 31.26 | 30.91 | 37.43 | 35.19 | 95,010 |
| 84.5 | 63.34 | 34,105 | 31.95 | 31.78 | 38.82 | 36.31 | 93,030 |
| 91 | 62.04 | 35,796 | 32.62 | 32.59 | 40.22 | 37.44 | 94,300 |
| 97.5 | 55.82 | 40,420 | 33.63 | 33.4 | 41.59 | 38.54 | 91,490 |
| 104 | 55 | 40,500 | 34.41 | 39.06 | 42.93 | 39.66 | 90,000 |
| 110.5 | 49.19 | 41,793 | 34.64 | 40.57 | 43.34 | 39.83 | 82,250 |
Table 3.
A comprehensive calorimetric analysis of 13 Ah Altairnano battery cell at 20 °C during discharge.
Table 3.
A comprehensive calorimetric analysis of 13 Ah Altairnano battery cell at 20 °C during discharge.
| Current (A) | Efficiency (%) | Heat Loss (J) | Max. T1 (°C) | Max. T2 (°C) | Max. T3 (°C) | Max. T4 (°C) | Power Area (J) |
|---|---|---|---|---|---|---|---|
| 13 | 93.22 | 8424 | 22.32 | 22.57 | 23.46 | 23.2 | 124,250 |
| 19.5 | 91.25 | 10,920 | 23.26 | 23.54 | 24.84 | 24.45 | 124,800 |
| 26 | 88.99 | 13,303 | 24.25 | 24.52 | 26.15 | 25.64 | 120,830 |
| 32.5 | 86.92 | 16,093 | 25.17 | 25.5 | 27.48 | 26.8 | 123,040 |
| 39 | 85.2 | 18,226 | 26.29 | 26.4 | 28.79 | 27.93 | 123,150 |
| 45.5 | 83.46 | 20,284 | 27.23 | 27.26 | 30.08 | 29.08 | 122,640 |
| 52 | 81.17 | 23,140 | 27.88 | 28.05 | 31.36 | 30.2 | 122,890 |
| 58.5 | 79.57 | 25,130 | 28.53 | 28.75 | 32.58 | 31.27 | 123,010 |
| 65 | 77.64 | 27,379 | 29.67 | 29.46 | 33.84 | 32.34 | 122,450 |
| 71.5 | 76.26 | 29,814 | 30.53 | 30.16 | 35.04 | 33.35 | 125,590 |
| 78 | 75.09 | 31,769 | 31.26 | 30.88 | 36.16 | 34.28 | 127,540 |
| 84.5 | 73.49 | 34,843 | 31.95 | 31.6 | 37.22 | 35.21 | 131,430 |
| 91 | 72.25 | 36,000 | 32.49 | 32.25 | 38.21 | 36.02 | 129,730 |
| 97.5 | 69.72 | 40,000 | 33.2 | 38.2 | 39.09 | 36.69 | 132,100 |
| 104 | 68.67 | 40,100 | 33.59 | 36.13 | 39.74 | 37.24 | 127,990 |
Table 4.
Polynomial equations during charge.
| Attribute | A | B | C | D | E |
|---|---|---|---|---|---|
| Efficiency | −1.1778 × 10⁻⁸ | −7.8261 × 10⁻⁶ | 0.00059326 | −0.4018 | 99.153 |
| Heat loss | −0.0006364 | 0.14623 | −11.351 | 717.31 | −1106.6 |
| T1 | −1.0986 × 10⁻⁷ | 2.4026 × 10⁻⁵ | −0.0019236 | 0.20561 | 19.474 |
| T2 | 7.7194 × 10⁻⁷ | −0.00015016 | 0.0094268 | −0.076584 | 21.987 |
| T3 | −2.4426 × 10⁻⁷ | 5.6198 × 10⁻⁵ | −0.0044659 | 0.35669 | 19.214 |
| T4 | −2.2416 × 10⁻⁷ | 5.2199 × 10⁻⁵ | −0.0043067 | 0.32636 | 19.514 |
Table 5.
Polynomial equations during discharge.
| Attribute | A | B | C | D | E |
|---|---|---|---|---|---|
| Efficiency | −2.7719 × 10⁻⁷ | 5.8433 × 10⁻⁵ | −0.0033713 | −0.24186 | 96.796 |
| Heat loss | −0.0003737 | 0.085244 | −6.8197 | 581.49 | 1708.1 |
| T1 | −7.5786 × 10⁻⁸ | 1.4679 × 10⁻⁵ | −0.0012767 | 0.19012 | 19.99 |
| T2 | 8.5688 × 10⁻⁸ | 6.3985 × 10⁻⁶ | −0.0024256 | 0.25863 | 19.449 |
| T3 | −8.7972 × 10⁻⁸ | 1.4494 × 10⁻⁵ | −0.001036 | 0.23455 | 20.556 |
| T4 | −7.8103 × 10⁻⁸ | 1.3037 × 10⁻⁵ | −0.0010293 | 0.2142 | 20.569 |
© 2018 by the authors. Licensee MDPI, Basel, Switzerland. This article is an open access article distributed under the terms and conditions of the Creative Commons Attribution (CC BY) license (http://creativecommons.org/licenses/by/4.0/).
Share and Cite
MDPI and ACS Style
Madani, S.S.; Schaltz, E.; Knudsen Kær, S. Heat Loss Measurement of Lithium Titanate Oxide Batteries under Fast Charging Conditions by Employing Isothermal Calorimeter. Batteries 2018, 4, 59. https://doi.org/10.3390/batteries4040059
AMA Style
Madani SS, Schaltz E, Knudsen Kær S. Heat Loss Measurement of Lithium Titanate Oxide Batteries under Fast Charging Conditions by Employing Isothermal Calorimeter. Batteries. 2018; 4(4):59. https://doi.org/10.3390/batteries4040059
Chicago/Turabian StyleMadani, Seyed Saeed, Erik Schaltz, and Søren Knudsen Kær. 2018. "Heat Loss Measurement of Lithium Titanate Oxide Batteries under Fast Charging Conditions by Employing Isothermal Calorimeter" Batteries 4, no. 4: 59. https://doi.org/10.3390/batteries4040059
Note that from the first issue of 2016, this journal uses article numbers instead of page numbers. See further details here.