Effect of Prelithiation Process for Hard Carbon Negative Electrode on the Rate and Cycling Behaviors of Lithium-Ion Batteries

Department of Mathematical Science and Electrical-Electronic-Computer Engineering, Akita University, Tegatagakuen-machi 1-1, Akita 010-8502, Japan
*
Author to whom correspondence should be addressed.
Batteries 2018, 4(4), 71; https://doi.org/10.3390/batteries4040071
Submission received: 12 September 2018
/
Revised: 21 November 2018
/
Accepted: 4 December 2018
/
Published: 12 December 2018
Abstract
:Two prelithiation processes (shallow Li-ion insertion, and thrice-repeated deep Li-ion insertion and extraction) were applied to the hard carbon (HC) negative electrode (NE) used in lithium-ion batteries (LIBs). LIB full-cells were assembled using Li(Ni0.5Co0.2Mn0.3)O2 positive electrodes (PEs) and the prelithiated HC NEs. The assembled full-cells were charged and discharged under a low current density, increasing current densities in a stepwise manner, and then constant under a high current density. The prelithiation process of shallow Li-ion insertion resulted in the high Coulombic efficiency (CE) of the full-cell at the initial charge-discharge cycles as well as in a superior rate capability. The prelithiation process of thrice-repeated Li-ion insertion and extraction attained an even higher CE and a high charge-discharge specific capacity under a low current density. However, both prelithiation processes decreased the capacity retention during charge-discharge cycling under a high current density, ascertaining a trade-off relationship between the increased CE and the cycling performance. Further elimination of the irreversible capacity of the HC NE was responsible for the higher utilization of both the PE and NE, attaining higher initial performances, but allowing the larger capacity to fade throughout charge-discharge cycling.
1. Introduction
Electric energy storage technologies have been recognized as a powerful solution contributing to the alleviation of the environmental burden [1,2,3]. Lithium-ion batteries (LIBs) have recently gained attention for their application as secondary batteries and large-scale energy storage systems (electric vehicles, output leveling of renewable energy, and so on) [4,5,6]. LIBs are generally composed of a positive electrode (PE, alternatively called cathode) of lithium transition metal oxides and a negative electrode (NE, alternatively termed as anode) of carbonaceous materials. A ternary PE active material of lithium nickel cobalt manganese oxides (NCM) has the superior features of high electropositive potential, high Li-ion insertion-extraction specific capacity, and reduced cost, when compared to other cobalt-type PE active materials [4,7]. The specific capacity of NCM active materials is dependent on the composition of nickel (Ni), cobalt (Co), and manganese (Mn). Li(Ni0.5Co0.2Mn0.3)O2, Li(Ni0.6Co0.2Mn0.2)O2, and Li(Ni0.8Co0.1Mn0.1)O2 are typical compositions for automotive applications [7,8,9]. Generally, heightening the Ni content can increase the specific capacity of NCM active materials.
Carbonaceous materials have been widely used for the NE active materials of commercial LIBs. These can be classified by their crystalline structure [10], namely graphite, soft carbon, hard carbon (HC), and others. To date, graphite has been mostly employed as the NE active material for automotive applications owing to its acceptable specific capacity, low working potential, natural abundance, and low-cost [11]. LIBs using a graphite NE can realize a high energy density, but they have the drawbacks of a low power density and short cycle-life.
HC is a promising NE active material of automotive LIBs owing to its fast Li-ion transport kinetics and longer cycle-life. Those advantages are attributed to its irregular and disordered arrangement of single graphene layers [12,13,14]. However, because of its crystalline structure, a large amount of active Li-ions provided from the PE are consumed during the formation of solid electrolyte interphase (SEI) films, as well as during the passivation of Li-ions in nano-scale voids inside the HC. The consumption of active Li-ions on the NE produces a large irreversible capacity, which is responsible for the decrease in Coulombic efficiency (CE) of the LIB cell at the first charge-discharge cycle and the decrease in its substantial charge-discharge capacity.
The prelithiation of NEs has been noted to be an effective approach to compensate the loss of Li-ions in the NE and thereby improve the battery properties (high CE at the initial cycles and subsequent cycles, superior rate capability, high capacity retention, and high energy and power density) [15,16,17,18,19,20,21]. Zhang et al. demonstrated that a facile prelithiation by means of direct contact between Li-foil and HC/graphene NEs increased the initial CE of the assembled LIB full-cells [12]. Moreover, they explored the influences of prelithiation times on the battery performances. Wang et al. reported that an increased CE at the initial charge-discharge cycles and an increased retention of cell capacity during cycling were observed in LIBs using LiNi0.80Co0.15Al0.05O2 and prelithiated HC using stabilized lithium metal powder [21]. In the field of lithium-ion capacitors (LICs), prelithiation has been essentially employed for deleting the irreversible capacity of the NE and for lowering its potential [13,22,23]. Zhang et al. evaluated the performances of LIC full-cells consisting of activated carbon PE and HC NE [22]. The HCs, having various crystalline structures, were prelithiated accurately using a battery test system without overcharge.
To date, various NE prelithiation methodologies have been proposed for both the assembly of LIBs and LICs. However, to the best of our knowledge, the charge-discharge performances of full-cells using HC NEs prelithiated by different processes have not been investigated. Moreover, prelithiation by means of repeated Li-ion insertion and extraction of the NE, which is conducted in order to completely eliminate its irreversible capacity, has not been examined. The charge-discharge cycling of LIBs involves shuttles of active Li-ions between the PE and NE. If too many Li-ions are inserted inside the cell by prelithiation, Li metal can be deposited on the NE surface. As a result, inactive Li-ions, side reactions on the PE and/or NE, and capacity unbalance between the PE and NE would occur. Therefore, HCs, generally with a large irreversible capacity, require the relevant prelithiation process.
In the present work, we prepared pristine HC NE and two types of prelithiated HC NEs, and assembled LIB full-cells employing a NCM PE. One type of the prelithiation was shallow Li-ion insertion and the other type was thrice-repeated deep Li-ion insertion and extraction; both were employed to negate the irreversible capacity of the HC NE. The assembled full-cells were charged and discharged under a low current density, increasing current densities in a step wise manner, and a constant high current density. Finally, we discussed the effect of the prelithiation process on the charge-discharge behaviors of the NCM/prelithiated HC LIB full-cells.
2. Experimental
2.1. Electrodes Preparation
LiNi0.5Co0.2Mn0.3O2 (NCM; Beijing Easpring Material Technology Co., Ltd., Beijing, China) and HC (LBV-1001, Sumitomo Bakelite Co., Ltd., Tokyo, Japan) were prepared as the PE and NE active materials, respectively. Both the active materials were used without any surface-coating treatment. The median diameters of the NCM and HC powders were 12 and 10 µm, respectively, measured by a laser diffraction particle analyzer (SALD-200V, Shimadzu Corp., Kyoto, Japan). The Brunauer–Emmett–Teller (BET) specific surface areas of NCM and HC were measured to be 2.0 and 8.2 m2 g−1, respectively, using the nitrogen adsorption–desorption isotherm obtained by a gas adsorption analyzer (Autosorb-iQ, Quantachrome Instruments Inc., Boynton Beach, FL, USA).
The slurries to fabricate the PE and NE were prepared by mixing active material, conductive agent, binder, and solvent. N-methyl-2-pyrrolidone (Tokyo Chemical Industry Co., Ltd., Tokyo, Japan) and distilled water were used as the slurry solvents for the PE and the NE, respectively. The PE slurry was composed of 80 mass% NCM, 10 mass% acetylene black (AB; Denka Black, Denka Co., Ltd., Tokyo, Japan), and 10 mass% polyvinylidene difluoride (KF Polymer F #9130, Kureha Corp., Tokyo, Japan). An aluminum foil (t20 µm, no surface treatment, Hohsen Corp., Osaka, Japan) was used as the PE current collector, and coated with the PE slurry using an applicator. The NE slurry, constituting HC, AB, sodium carboxymethyl cellulose (Cellogen 7A, DKS Co., Ltd., Kyoto, Japan), and styrene-butadiene rubber (TRD2001, JSR Corp., Tokyo, Japan) with the ratio of 90:5:2.5:2.5 in mass%, was coated on copper foil (t20 µm, no surface treatment, Hohsen Corp., Osaka, Japan) employed for the NE current collector. The electrodes were dried in an oven at 100 °C for >6 h, and then pressed with a pressure of 2 MPa using a press machine. The dried materials were punched out into disks (φ15 mm). The disk-shaped electrodes were degassed in vacuum at 140 °C for >4 h. The loading masses of the active material were 2.88–2.99 and 2.53–2.69 mg cm−2 for the NCM PE and HC NE, respectively. The coating thicknesses of the NCM PE and HC NE were 32–33 and 32–33 µm, respectively.
2.2. Lithium Nickel Cobalt Manganese Oxide (NCM)/Li and Hard Carbon (HC)/Li Half-Cells Assembly
The specific capacities of NCM and HC electrodes were evaluated in a half-cell configuration employing Li metal as the counter electrode (φ15 mm, t0.2 mm, Honjo Metal Co., Ltd., Osaka, Japan). A polypropylene porosity membrane (t25 µm) was used as the separator. The electrolyte was 1.0 mol L−1 LiPF6 dispersed in a mixture of ethylene carbonate (EC) and diethyl carbonate (DEC) (1 M LiPF6/EC:DEC=1:1 v/v%, Kishida Chemical Co., Ltd., Osaka, Japan). The NCM and HC electrodes as well as the separator were dipped into the electrolyte for ~5 s. The excessive electrolyte drops on the electrodes and the separator were removed by shaking. The LIB full-cells were assembled in a similar manner. Cell assembly was conducted in an argon-filled glove box. Coin-type cells (CR2032, Hohsen Corp., Osaka, Japan) were employed to assemble the half-cells. After the cell assembly, the open circuit voltage (OCV) was measured by a digital multimeter (PC7000, Sanwa Electric Instrument Co., Ltd., Tokyo, Japan).
2.3. Prelithiation Processes and the NCM/HC Full-Cell Assembly
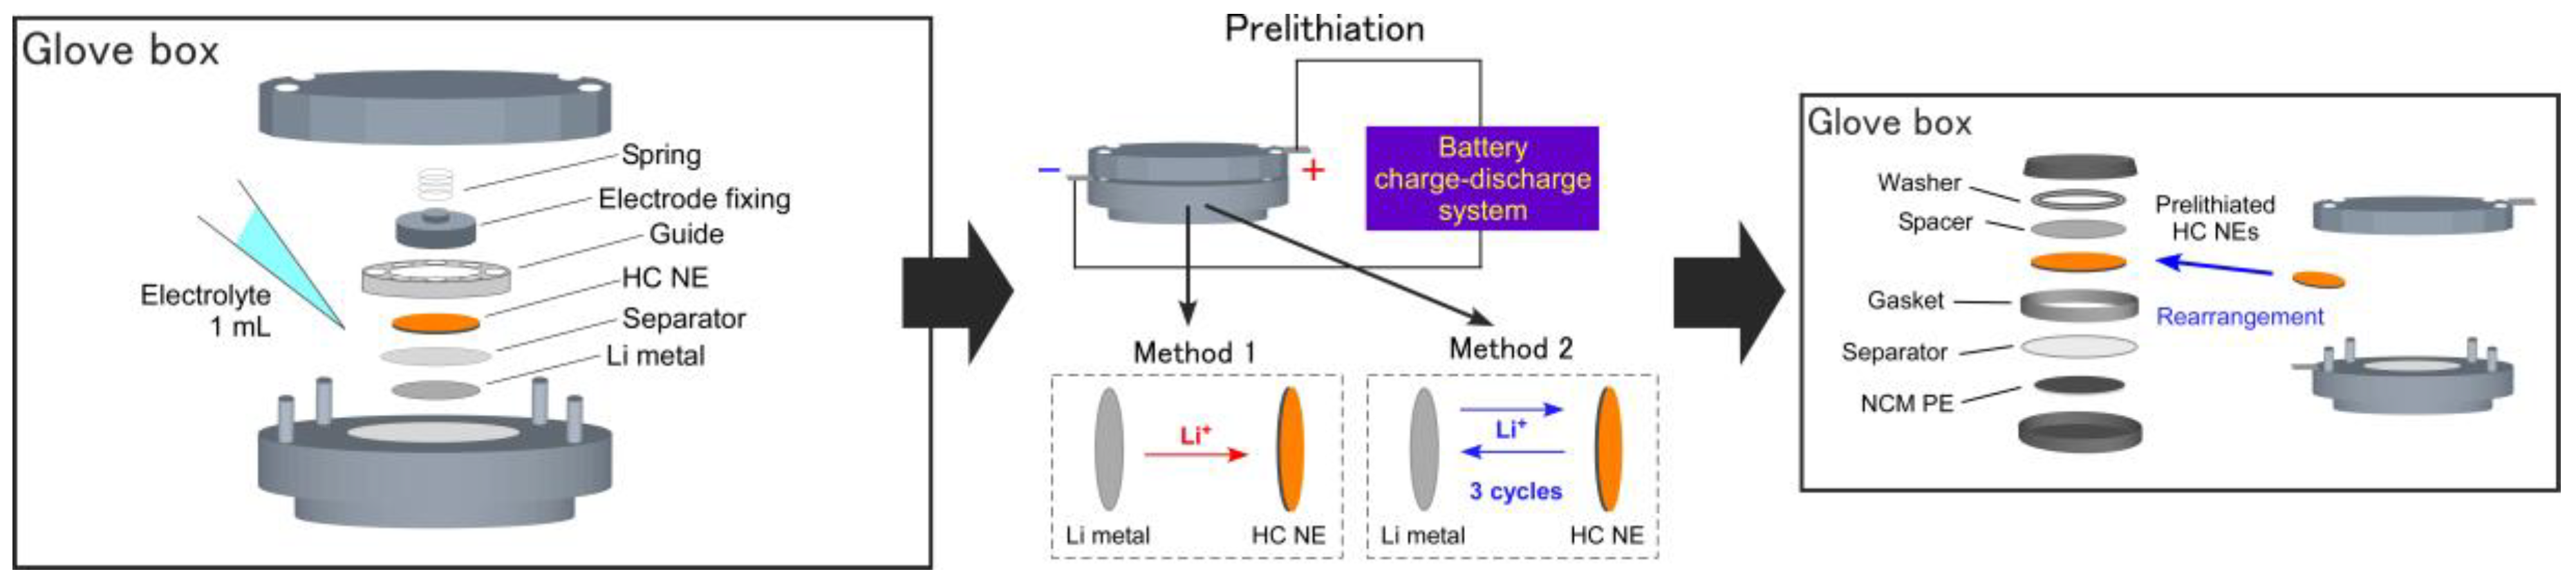
Figure 1 shows the process of prelithiation for the HC NEs and that of NCM/HC full-cell assembly. Two different prelithiation methods were employed. One simply involves providing HC NE Li-ions, in a quantity determined based on their consumption in the first charge-discharge of the NCM/untreated HC full-cell. The other method is a thrice-repeated deep Li-ion insertion and extraction under the constant current constant voltage (CCCV) mode. This was performed with the aim of completely eliminating the irreversible capacity of the HC. Both prelithiation processes were conducted using a battery charge-discharge system (HJ1020mSD8, Hokuto Denko Corp., Tokyo, Japan) to accurately control the amount of Li-ions employed in the insertion and extraction. Half-cells, including the HC electrode and Li metal electrode as the lithium source, were assembled with a SUS304 testing cell (HS flat cell, Hohsen Corp., Osaka, Japan) for prelithiation. A sufficient amount of electrolyte (1 mL) was injected into the SUS304 half-cells to facilitate the prelithiation. The half-cell was removed from the glove box, and then connected to the battery charge-discharge system. After prelithiation, SUS304 half-cells were put into the glove box again, and were carefully disassembled. The fresh NCM PE and separator, in addition to the prelithiated HC NE, were rearranged in a CR2032-type coin cell. The electrolyte penetration into the fresh PE and separator were also implemented for the CR2032 full-cell assembly. The OCV of the assembled full-cells was measured just after cell assembly. The three NCM/HC full-cells were denoted as a pristine HC cell, a shallow prelithiation HC cell, and a cycling prelithiation HC cell.
2.4. Electrochemical Measurements
The battery charge-discharge system used for prelithiation was similarly used for electrochemical measurements. The Li-ion extraction-insertion properties of the NCM and HC electrodes were evaluated under the constant current (CC) mode. The cut-off potential ranges were determined to be 2.5–4.2 and 0–2.5 V vs. Li/Li+ for the NCM and HC electrodes, respectively. The current density varied from 0.1 to 10 C-rate (five cycles for each current density), during which the specific capacities of NCM and HC were set to be 160 and 200 mA g−1, respectively. After the evaluation at 10 C-rate, the cycling of the Li-ion extraction and insertion at the lowest current density (0.1 C-rate) was additionally implemented (five cycles for each C-rate, totaling 40 cycles).
The NCM/HC full-cells were operated at the cell voltage range of 2.5–4.2 V under the CC mode, during which 1 C-rate was set to be 170 mA g−1 on the basis of the specific capacity of the NCM PE, which was determined from the result of the half-cell test. After the OCV measurement, the full-cells were charged and discharged three times at 0.1 C-rate. Then, the cycle test was executed by repeating the charge-discharge 500 times at 2 C-rate. Before and after the cycle test, the rate tests were introduced to evaluate the rate capability of the full-cells. The current density was increased from 0.1 to 10 C-rate during the rate test. The cell capacity was denoted by the PE specific capacity, which was obtained by dividing the cell capacity by the mass of the PE active material. Using the results of the rate tests, Ragone plots were produced to reveal the relationship between the specific energy and the specific power of the full-cells. For the Ragone plots, the specific energy and specific power were calculated based on the total mass of PE and NE active materials. All tests were conducted at 25 °C.
2.5. X-Ray Photoelectron Spectroscopy (XPS)
X-ray photoelectron spectroscopy (XPS) was performed to reveal the thickness and the chemical nature of SEI films formed on the different prelithiated HC electrodes. The shallow and cycling prelithiation HC electrodes were additionally prepared by means of similar prelithiation processes mentioned in Section 2.3. For the shallow prelithiation HC, Li-ions were intended to be extracted by elevating the electrode potential up to 2.5 V vs. Li/Li+. The half-cells used for the above prelithiation were put into an argon-filled glove box and were disassembled. The prelithiated HC electrodes were extracted from the half-cells, and were immersed in 30 mL-DEC (Wako Pure Chemicals Corp., Osaka, Japan) overnight at 25 °C for the removal of residual ions. Then, DEC remaining on the HC electrodes was wiped by using a clean nonwoven cloth. Finally, they were subjected to vacuum drying at 25 °C for >12 h. The pristine HC electrode was also prepared. All the HC electrodes were introduced to a XPS instrument (AXIS Ultra DLD, Kratos Analytical Ltd., Manchester, UK) from the glove box. It should be noted that all the HC electrodes were exposed to air for ca. 60 s during the sample introduction. The XPS spectra were acquired using monochromatic Al Kα radiation (135 W). The XPS analysis area was 0.3 mm × 0.7 mm. Wide scan (survey) spectra were acquired at the binding energy of 1200–0 eV, with pass energy of 160 eV. Atomic composition of the electrode surface was calculated from the integrated intensities of peaks on the wide scan spectra and the atomic sensitivity factors by using the peak analysis software installed in the above XPS instrument. Narrow scan spectra were collected with pass energy of 20 eV. The binding energy of spectrum was corrected on the basis of C1s peak at 284.5 eV [24]. The depth profiling was executed by sputtering the electrodes using an Ar ion gun (acceleration voltage: 4.86 kV). The etching rate was determined using the reference of 20 nm-thick SiO2 deposited on Si wafer (Geller MicroAnalytical Laboratory Inc., Topsfield, MA, USA) to be 0.167 nm s−1 (10 nm min−1). All the electrodes were first etched for 10 s to strip the air-exposed surface layer. The etching time was increased up to 1000 s.
3. Results and Discussion
3.1. Half-Cell Performances of NCM and HC Electrodes
Figure 2 shows the Li-ion extraction-insertion properties of the NCM electrode at the potential range of 2.5–4.2 V vs. Li/Li+ under the CC mode at various C-rates. The rate behavior of the NCM electrode was acquired by elevating the C-rate from 0.1 to 10. Upon increasing the C-rates, the specific capacity of the NCM electrode gradually decreased. The NCM electrode exhibited a specific capacity of 40 mAh g−1, even at the high current density of 5 C-rate in a half-cell configuration. However, at 10 C-rate, it showed a lower specific capacity. In the first Li-ion extraction and insertion cycle at 0.1 C-rate, the NCM electrode exhibited extraction and insertion specific capacities of 163 and 141 mAh g−1, respectively (the CE in the first Li-ion extraction-insertion was 86.3%). In subsequent cycles, the Li-ion extraction and insertion of NCM was found to be stabilized, and a high CE (>99.4%) was observed.
Figure 3 shows the Li-ion insertion–extraction properties of the HC electrode at the potential range of 0–2.5 V vs. Li/Li+. The CE at the first cycle was 74.6%, and those in the subsequent cycles were >95.3%. Probably due to the insufficient penetration of the electrolyte into the electrodes in the half-cell, a slightly increasing trend of the specific capacity was observed in the range of 0.1–0.5 C-rate. A higher C-rate resulted in lower insertion and extraction specific capacities. Specific capacity was hardly observed at 10 C-rate. The HC electrode, which was subjected to the rate test and then evaluated again at 0.1 C-rate, showed very stable behavior throughout the Li-ion insertion and extraction repetitions. Its Li-ion insertion and extraction specific capacities were both 225 mAh g−1.
3.2. Prelithiation of the HC Negative Electrodes (NEs) and the NCM/HC Full-Cell Design
Table 1 shows the prelithiation processes followed to prepare the HC NEs used for the full-cell designs. The first prelithiation process was shallow Li-ion insertion, which provided Li-ions consumed in the first charge-discharge cycle. The amount of consumed Li-ions was determined from the charge-discharge test result of the full-cell using the pristine HC NE at 0.1 C-rate, which will be further discussed below. During the shallow Li-ion insertion, 52.9 mAh g−1 of Li-ions was inserted into the HC NE. The insertion specific capacity of 52.9 mAh g−1 for the HC NE corresponded to 28.1% of the NCM’s specific capacity (170 mAh g−1), which was the irreversible specific capacity measured in the first charge-discharge of the pristine HC cell.
The second prelithiation process was the thrice-repeated deep Li-ion insertion and extraction used to negate the large irreversible capacity of the HC electrode. The insertion and extraction for this method of prelithiation were performed under both the CCCV and CC modes, respectively. The CCCV mode was selected for the full Li-ion insertion of the HC electrode, during which the electrode potential decreased to 0 V vs. Li/Li+ at 0.1 C-rate and then was maintained at 0 V vs. Li/Li+ until the current density was decreased from 0.1 to 0.01 C-rate. For the Li-ion extraction process, the CC mode was selected to increase the electrode potential from 0 to 2.5 V vs. Li/Li+ at 0.1 C-rate. Thrice-repeated deep Li-ion insertion and extraction in the first cycle exhibited the insertion and extraction specific capacities of 497 and 361 mAh g−1, respectively. The CE in the first cycle was 72.6%, while that in the third cycle was 95.0%. The SUS304 half-cell exhibited higher specific capacities than did the CR2032 coin cells, which was attributed to the sufficient amount (1 mL) of the electrolyte and to the deep Li-ion insertion under the CCCV mode.
The specific capacities of the NCM and HC electrodes for the full-cells assembly were determined to be 170 and 225 mAh g−1, respectively, based on the half-cell test results. The NCM electrode showed the specific capacity of 163 mAh g−1 in the first Li-ion extraction. Considering the PE potential in the full-cell configuration, a marginally higher specific capacity was assumed for the NCM since a higher working potential range was expected in the actual full-cell configuration. Using the determined specific capacities of the NCM and HC electrodes, all of the NCM/HC full-cells were designed under a reliable capacity ratio of NE to PE (N/P ratio) of 1.20, so as to prevent the formation of lithium dendrite on the NE surface [25,26,27].
3.3. Open Circuit Voltage (OCV) Measurement after Cell Assembly
Figure 4 shows the OCV of the half-cells and full-cells just after cell assembly. The pristine HC cell exhibited an OCV of 61.0 mV, while the shallow prelithiation HC and the cycling prelithiation HC cells exhibited OCV values of 2376 and 2155 mV, respectively. According to the potential variation in the NCM electrode in the half-cell configuration, the potential of the HC NEs was clearly lowered by the prelithiation process. The OCV of the shallow prelithiation HC cell was comparable to that of the cycling prelithiation HC cell, indicating that a comparable level of NE potential was attained in the two prelithiated full-cells.
3.4. Pre-Cycling for Cell Formation
Figure 5 shows the charge-discharge behaviors of full-cells with pristine and prelithiated HC NEs in pre-cycling tests under a low current density (0.1 C-rate, 17 mA gPE−1). Pre-cycling was executed for cell formation, with the aim of achieving stable formation of SEI film on the NE surface. The CE of the pristine HC cell at the first charge-discharge cycle was 71.9%. The two full-cells with prelithiated HCs showed higher CE values (79.6% for the shallow prelithiation HC cell and 85.4% for the cycling prelithiation HC cell). In the first charging process, the pristine HC cell exhibited a modest increase in cell voltage within the specific capacity of 6.2 mAh gPE−1. The precipitous increase of cell voltage for the prelithiated full-cells was observed at the initial charging stage (<1 mAh gPE−1). For the full-cells with prelithiated HC NEs, irreversible reactions chiefly resulting from the SEI formation on the NE side hardly occurred. Thus, the potential overshoots observed in the initial charging of the full-cells were caused by the first Li-ion extraction of the NCM PE. The charge and discharge specific capacities and the CE values in the first to third cycles are summarized in Table 2. Within the two charge-discharge cycles, the CE of the cycling prelithiation HC cell increased to 99.4%, which was the highest CE in all of the full-cells. At the second and third cycles, the pristine HC and the shallow prelithiation HC cells showed high CE values >97%. Prelithiation with the shallow Li-ion insertion was only effective for CE enhancement at the first charge-discharge cycle. Although all of the full-cells exhibited similar levels of first charge specific capacity, in the range of 176–179 mAh gPE−1, the first discharge specific capacity of the full-cells was dependent on the prelithiation process. It was clearly found that the cycling prelithiation HC cell showed a higher discharge specific capacity than did the shallow prelithiation HC cell, while the pristine HC cell exhibited the lowest discharge specific capacity. In subsequent cycles, all of the full-cells maintained a stable discharge specific capacity. The results indicated that intensive elimination of the initial irreversible capacity of the HC NE was beneficial for increasing the reversible capacity of the full-cell.
3.5. Cycling Behavior
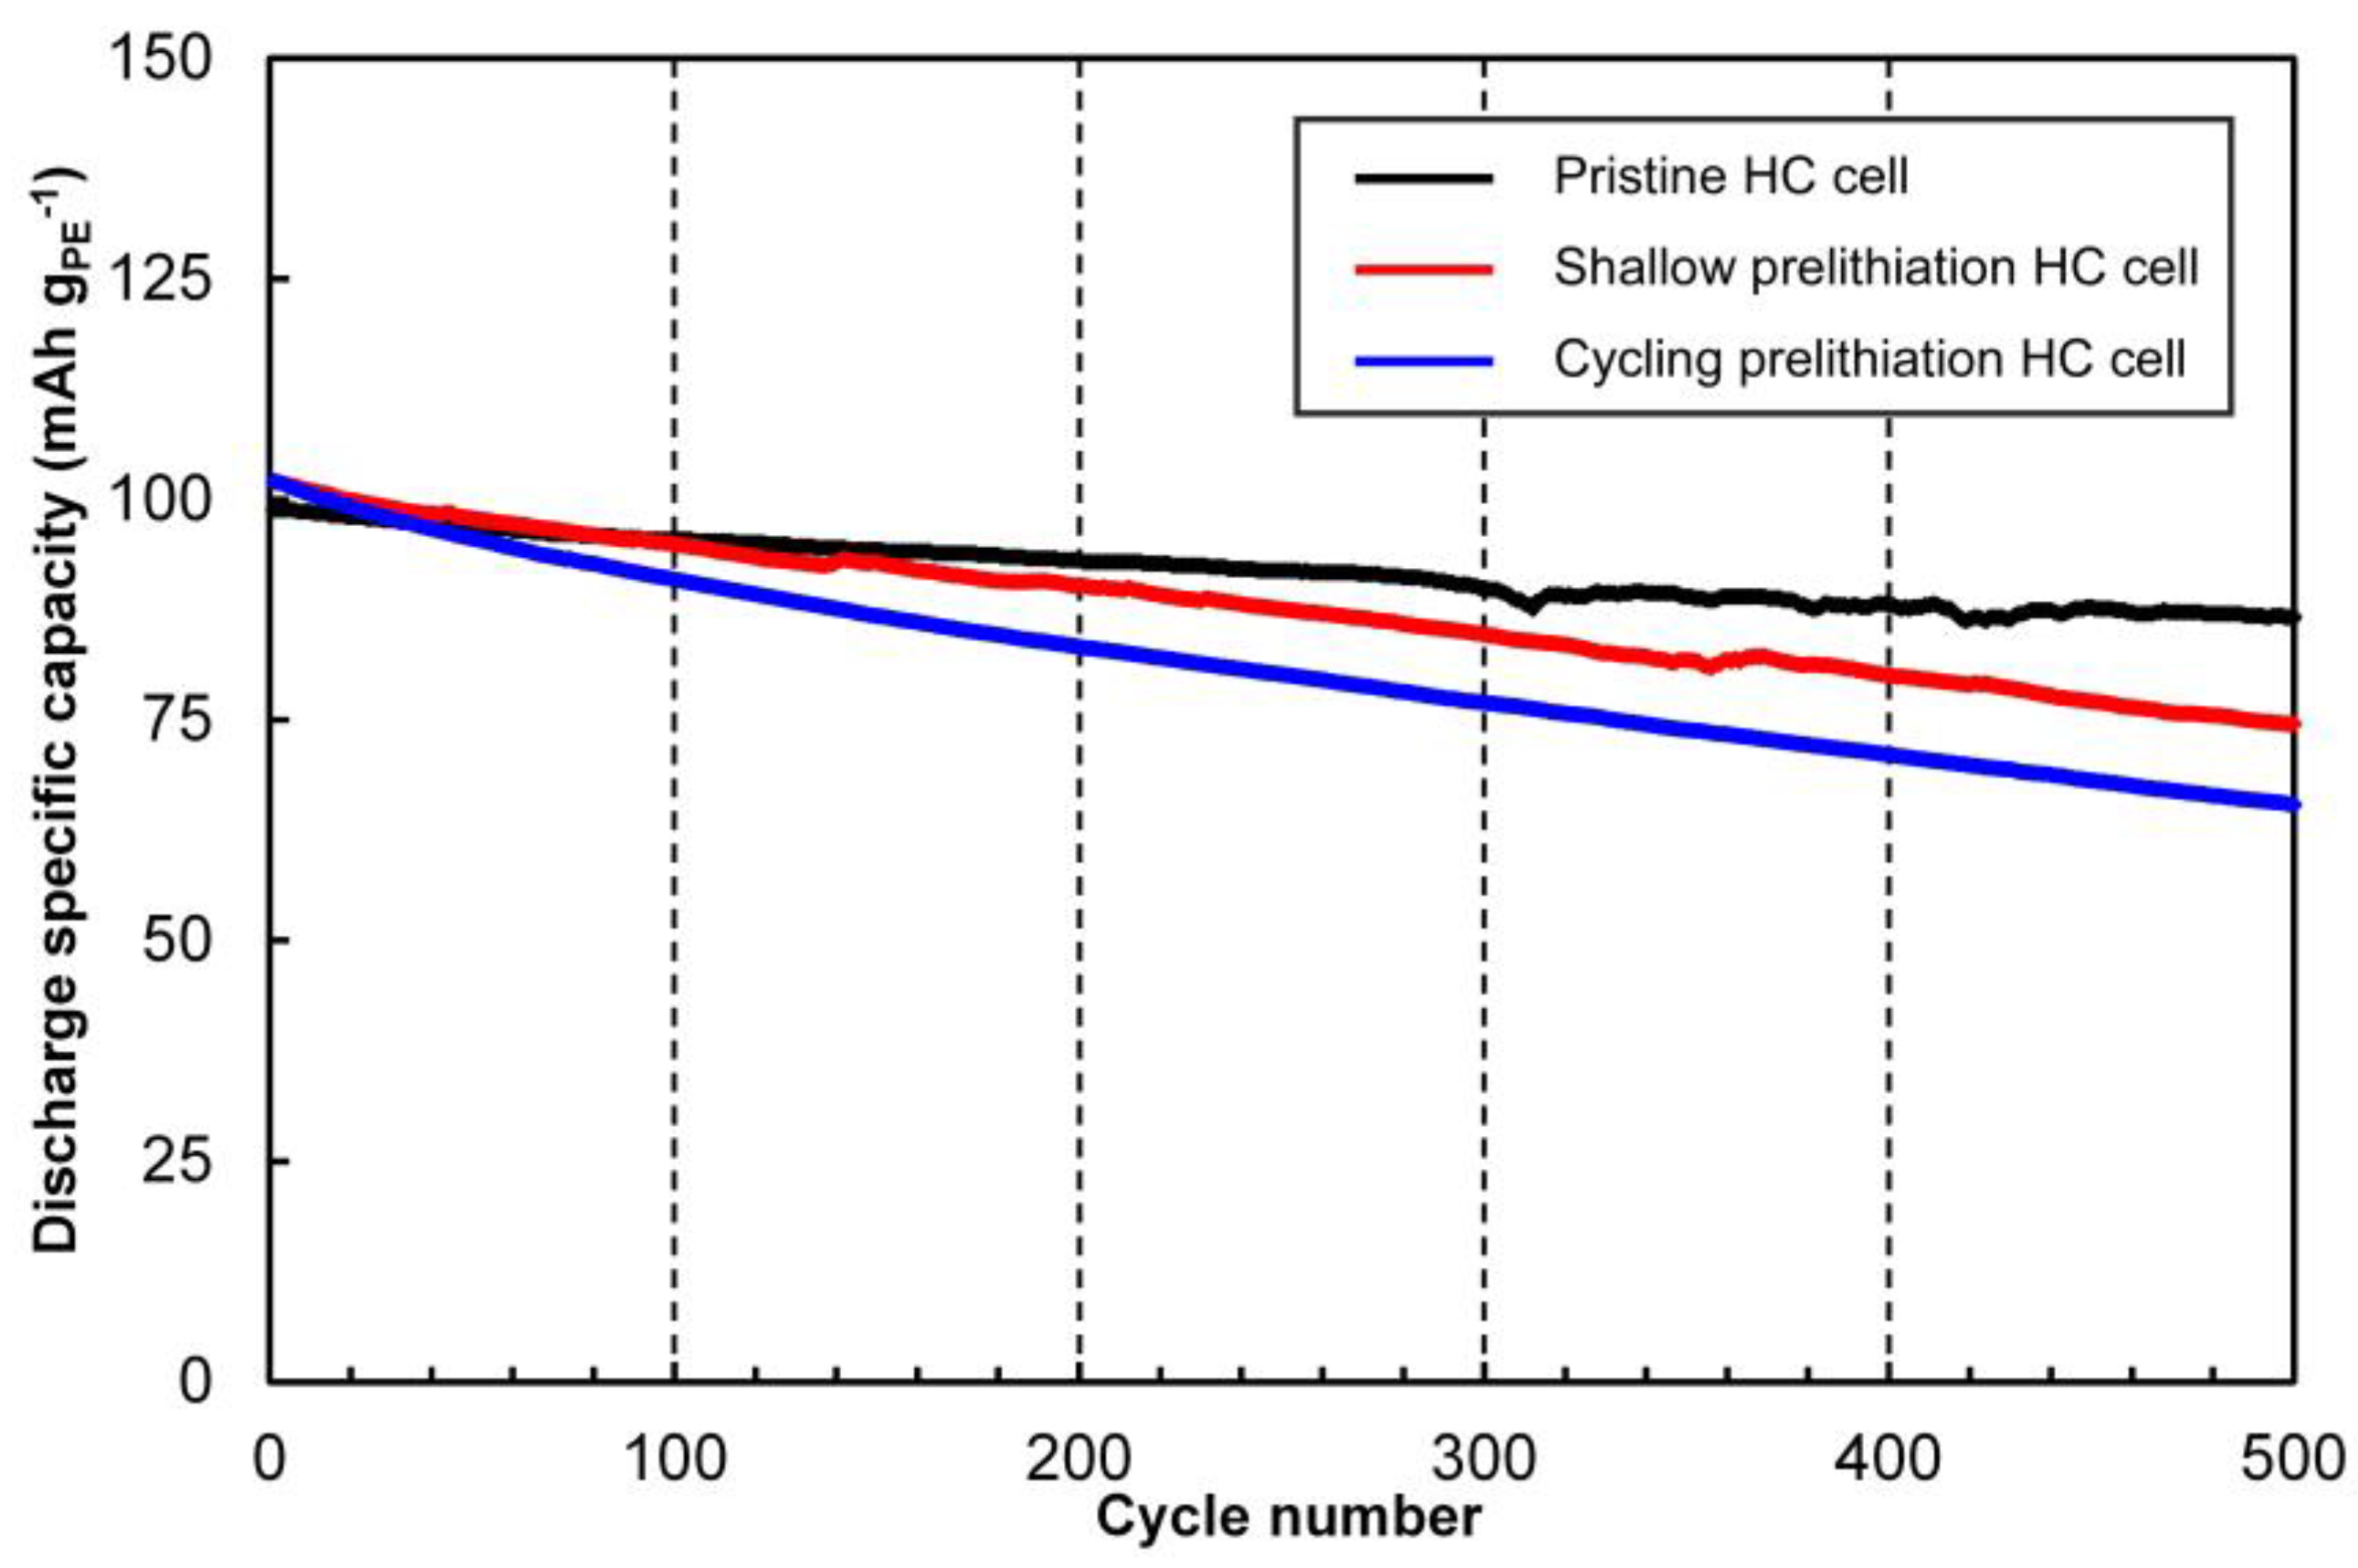
Figure 6 shows the cycling behavior of the full-cells with the pristine and prelithiated HC NEs. All of the full-cells were charged and discharged 500 times at 2 C-rate in the cell voltage range of 2.5–4.2 V. The two full-cells using prelithiated HC NEs exhibited slightly higher specific capacities than that using the pristine HC for the first 10 cycles. However, a larger capacity fading was observed on the two prelithiated cells and the fading degree was enhanced with the number of cycles. The capacity retentions of the shallow prelithiation HC and the cycling prelithiation HC cells after 500 cycles were 73.1 and 64.1%, respectively, while the pristine HC cell exhibited the highest retention of 87.7%. It has been reported that the cycling performances of full-cells incorporating prelithiated NEs are less than or comparable to that of full-cells with pristine NEs [15], which is consistent with the present cycle test results. The capacity fading of the shallow prelithiation HC cell was more restricted than that of the cycling prelithiation HC cell. The capacity fading of prelithiated full-cells is related to the Li-plating at the NE surface, which was derived from excessive Li-ions, as well as the increased utilization of the PE. The discharge specific capacity of 150 mAh gPE−1 of the NCM, measured in the cycling prelithiation HC, was fairly close to the full performance of NCM (170 mAh gPE−1).
3.6. Rate Behaviors
Figure 7 shows the rate behavior of the full-cells with pristine and prelithiated HC NEs before and after the cycle test. Prior to the cycle test, the cycling prelithiation HC cell showed higher charge and discharge specific capacities at a low current density (0.1–1 C-rate). However, the specific capacities at 5 and 10 C-rates were the lowest. Especially at >0.5 C-rate, larger cell voltage drops at the 0-specific capacity axis were observed at the starts of charging and discharging cycles. At the highest current density of 10 C-rate, the cell voltages at the start of charging were 3.35, 3.35, and 3.50 V for the pristine HC, the shallow prelithiation HC, and the cycling prelithiation HC cells, respectively. The increase of internal resistance related to the magnitude of cell voltage drop led to the lowering of the specific capacity at a high current density [28,29]. Although the HC NE prelithiated by the deep cycling of Li-ion insertion and extraction showed the highest CE and specific capacity at the initial charge-discharge cycles, an increased internal resistance and thereby a poor rate capability were also delivered. This was presumably due to the formation of a thicker SEI film on the HC surfaces, resulting from the deeper Li-ion insertion under the CCCV mode. A large cell voltage drop for the shallow prelithiation HC in the rate test was not observed. A higher CE attributed to the shallow Li-ion insertion was responsible for higher specific capacities at all C-rates. In addition to this, the acceptable superior rate capability was also imparted by the shallow prelithiation process.
After 500 charge-discharge cycles, the rate test was carried out again (see Figure 7 again). The charge and discharge specific capacities of both full-cells with the prelithiated HCs were lower than those of the pristine HC cell, which was attributed to the cell aging in the high-rate cycling. Smaller cell voltage drops at the 0-specific capacity axis for the shallow prelithiation HC cell were observed at each C-rate, while those of the cycling prelithiation HC cell were notably enlarged. This result indicates that the shallow Li-ion insertion resulted in not only an increased CE but also the suppression of cell voltage drops. The rate capability of the cycling prelithiation HC cell was prominently decreased by the cycle test.
Figure 8 shows the relationships between the specific power and specific energy of the full-cells with the pristine and prelithiated HC NEs before and after high-rate cycling. Prior to the charge-discharge cycling, the shallow prelithiation HC cell exhibited a higher specific energy than that of the pristine HC cell at all current densities, showing superior energy and power characteristics before the high-rate cycling. A higher energy density was obtained from the cycling prelithiation HC cell at a lower power density of <600 mW gPE&NE−1, while that obtained from the shallow prelithiation HC cell was at a higher power density of >1000 mW gPE&NE−1. All of the full-cells exhibited a decreased energy density after charge-discharge cycling, especially in the high-power density region. The pristine HC cell exhibited the highest energy density, while the shallow prelithiation HC cell showed an acceptable energy density. The energy density of the cycling prelithiation HC cell at the higher power density of >100 mW gPE&NE−1 was considerably reduced.
3.7. XPS for Pristine and Prelithiated HC Electrodes
Figure 9 shows the XPS depth profiles of the pristine and prelithiated HC electrodes obtained by means of Ar ion sputtering. The pristine HC electrode exhibited weak peaks on the O1s spectra at 533.4 eV, which disappeared with the etching time, and strong peaks on the C1s spectra at 288–283 eV. No significant peaks were observed on the F1s and Li1s spectra of the pristine HC electrode. The O1s peak at 533.4 eV was caused by C–O/C–O–C bonds [30], suggesting that the surface layer was subjected to oxidation. The C1s peak at 284.5 eV was due to C–C bonds derived from graphene layer parts of HC [24]. The hump on the C1s spectra at 285.2 eV was attributed to C–H bonds [31], which were related to the residual hydrogen atoms and the binders (sodium carboxymethyl cellulose and styrene-butadiene rubber). The weak peaks owing to C–O bonds were also observed at the skirt of the C1s peaks (286.6 eV) [31].
The shallow prelithiation HC electrode showed strong F1s peaks and weak broad Li1s peaks. The strong peak of F1s at 686.0 eV was ascribed to the LiF formation [32,33]. The main O1s peaks of the shallow prelithiation HC electrode were observed at 532.5 eV, which was due to the overlapping of C–O/C–O–C bonds at 533.4 eV, and C=O bonds and ROCOOLi at 531.8 eV [30]. The main peak observed on the C1s spectra at the shortest etching time (10 s) was ascribed to C–H bonds. The humps due to C–O bonds and C=O bonds were also observed at 286.6 and 287.5 eV, respectively. With increasing the etching time, the peaks due to the C–H, C–O/C–O–C and C=O/ROCOOLi diminished while the peak due to C–C bonds increased. The weak Li1s peaks were mainly composed of the LiF peak at 56.0 eV, secondly the LiPF6 peak at 56.9 eV, and thirdly the Li2CO3 peak at 55.5 eV [34]. The changes in the narrow scan spectra indicated that the intensity of main peaks of F1s, O1s, C1s, and Li1s spectra decreased up to the etching time of 50 s and was maintained at the longer etching time.
The significant changes were observed on the narrow scan spectra of the cycling prelithiation HC electrode. The F1s spectra of the cycling prelithiation HC electrode showed the overlapped peaks which were chiefly caused by LiPF6 and secondary caused by LiF. The strongest peaks due to C–O/C–O–C bonds were observed on the O1s spectra. The peaks resulting from C=O bonds and ROCOOLi at 533.4 eV and those from the formation of Li2CO3 at 530.0 eV [35] were also observed. The C1s spectra of the cycling prelithiation HC electrode subjected to the shallow etching (<150 s) exhibited the strong peaks of C–O bonds at 286.6 eV. The humps due to C=O bonds at 287.5 eV [31], Li2CO3 at 290.5 eV [36] and ROCOOLi at 291.5 eV [35] appeared on the C1s spectra at the shorter etching time (<150 s). The Li1s spectra allowed the overlapping of three peaks mainly attributed to LiPF6, secondary attributed to LiF, and thirdly attributed to Li2CO3. The F1s and Li1s spectra suggested that the peak due to LiPF6 weakened up to the etching time of 150 s. The peak of LiPF6 was indicative of the residual electrolyte at the surface layer exposed to the cycling deep insertion and extraction of Li-ions. Distinct peaks of C–C bonds were observed on the C1s spectra at the longer etching time (>150 s).
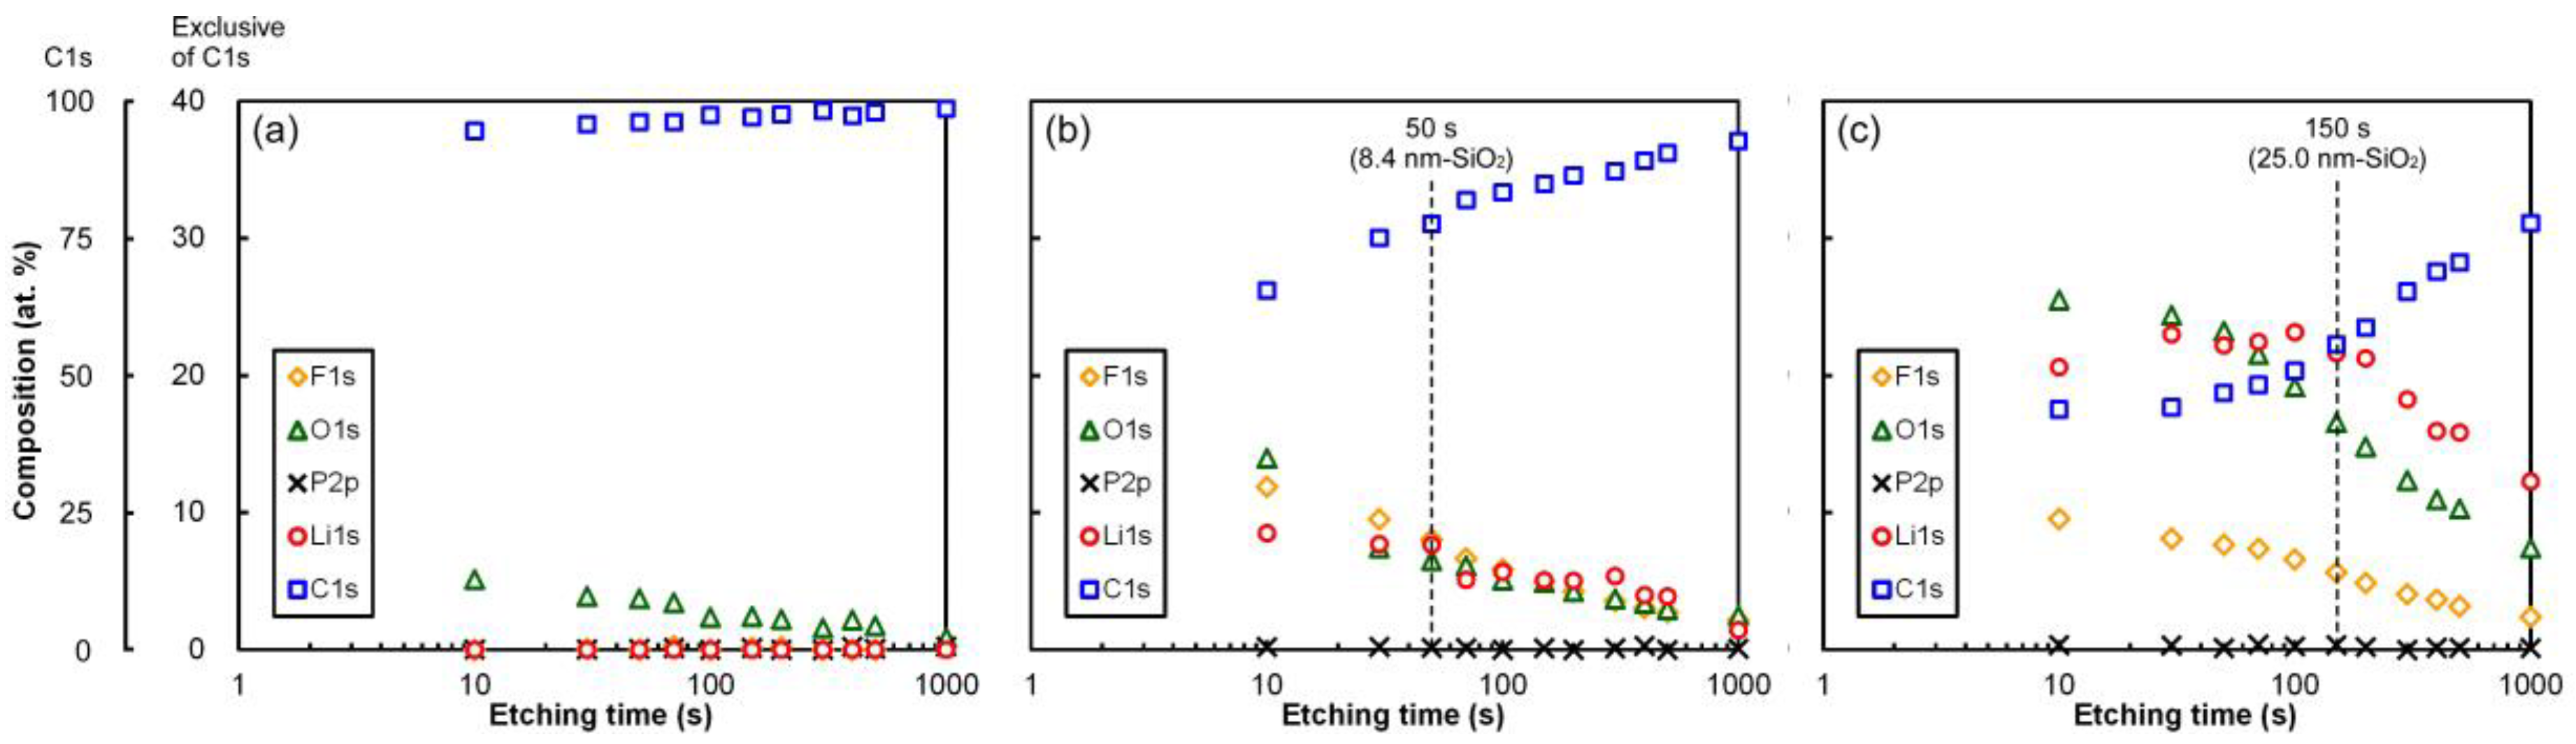
LiF, Li2CO3, ROCOOLi, and the compounds having C–O/C–O–C or C=O bonds detected on the narrow scan spectra at the initial etching stage are typical products of SEI formation [37], meaning that SEI films were produced on the shallow and cycling prelithiation HCs. Compositions of F1s, O1s, C1s, P2p, and Li1s for the pristine and prelithiated HC electrodes were obtained as a function of the etching time (see Figure 10). The pristine HC electrode exhibited quite high C1s concentration of >90 at. %. The concentration of O1s attributed to the residual functional groups inside the HC was low (<5 at. %) and decreased with the etching time. The compositions of the shallow and cycling prelithiation HC electrodes suggested that cycling deep insertion and extraction of Li-ions increased the concentrations of F1s, O1s and Li1s. The P2p concentration was found to be negligible. The cycling prelithiation HC electrode allowed a noticeable increase in the O1s and Li1s concentrations. Flexural changes in the C1s and Li1s concentrations for the shallow and cycling prelithiated HC electrodes appeared at the etching time of 50 and 150 s, respectively. Referring to the results of the XPS depth profiling, the SEI thickness of the shallow and cycling prelithiation HC electrodes were estimated to be 8.4 and 25.0 nm-SiO2, which was based on the SiO2 etching rate of Ar ion sputtering (0.167 nm s−1). The SEI film of the cycling prelithiation HC electrode consisted of LiF, Li2CO3, and ROCOOLi, while that of the shallow prelithiation was mainly composed of LiF. LiF is a reduction product of PF6− and is an inorganic compound which precipitates on the electrode surface. The reduction of solvent is followed by the formation of insoluble Li2CO3 and soluble semi-carbonate and polymers [38]. The XPS results revealed that the thicker and thus stable SEI film involving with the solvent reduction was produced on the cycling prelithiation HC electrode. The shallow prelithiation HC electrode allowed the formation of the thinner SEI film through a reduction of PF6−.
3.8. Effect of Prelithiation Process on Cell Performance
The irreversible specific capacity of the HC NEs was more or less negated by both prelithiation processes. The HC electrode with thrice-repeated deep Li-ion insertion and extraction was shown to have the thicker SEI film than did that with shallow Li-ion insertion. It has been demonstrated that the properties of the SEI film formed on the carbonaceous NE have a significant influence on the charge-discharge performances of LIBs [37]. Although the prelithiation with shallow Li-ion insertion could not completely negate the irreversible specific capacity of the HC electrode, a thinner SEI film (8.4 nm) was formed on the HC electrode surface, which contributed to both the increase in the cell specific capacity and the improvement of the rate capability. However, the prelithiation via cycling deep Li-ion insertion and extraction produced a thicker and stable SEI film (25.0 nm) on the HC electrode surface as well as excessive Li passivation inside the HC electrode. As a result, a high CE and cell-specific capacity were attained in the cycling prelithiation HC cell, but the rate and cycling performances were notably decreased, producing a trade-off relationship between the increased CE (and thereby the induced high cell-specific capacity), and the cycling stability.
The full-cell using the HC prelithiated by thrice-repeated deep Li-ion insertion and extraction was operated with higher utilization rates of both the PE and NE, enhancing the initial battery performances. Elimination of the irreversible capacity of the NE by the deep prelithiation process was responsible for the decrease in the loss of Li-ions provided by the PE, which led to the high utilization rates of the PE and the NE. However, the high utilization of both the PE and NE could promote battery aging. The prelithiation with shallow Li-ion insertion was likely to realize appropriate utilization rates of the PE and NE. Thus, the full-cell with the HC prelithiated by shallow Li-ion insertion alleviated the decrease in the rate and cycling performances, even under high-rate cycling.
4. Conclusions
Two types of prelithiation processes were applied to HC NEs, after which the NCM/prelithiated HC full-cells were assembled with CR2032-type coin cells. One prelithiation method simply involved the insertion of Li-ions, the quantity of which was determined to compensate its consumption in the first charge-discharge cycle. The other method involved thrice-repeated deep Li-ion insertion and extraction to completely negate the irreversible capacity of the HC NE. The former prelithiation process of shallow Li-ion insertion provided a higher CE (79.6% vs. 71.9% of pristine HC cell) in the first charge-discharge cycle as well as a superior rate capability. The latter prelithiation process with thrice-repeated deep Li-ion insertion and extraction offered the highest CE (85.4%), in addition to the highest charge and discharge specific capacities. The SEI films of the prelithiated HC electrodes with shallow Li-ion insertion and thrice-repeated deep Li-ion insertion and extraction exhibited different chemical natures and thickness, which affected the charge-discharge behaviors of the NCM/prelithiated HC full-cells. A trade-off relationship between the increased CE (and thereby the induced high charge-discharge specific capacity), and the rate capability and cycling stability was ascertained. Elimination of the irreversible capacity of the HC alleviated the loss of Li-ions provided from the PE, leading to the improvement of initial battery performances. However, both PE and NE utilization were simultaneously enhanced, which was detrimental to the maintenance of the cell capacity during high-rate cycling. In the present study, simple prelithiation by shallow Li-ion insertion was found to be the most effective way to improve battery performance.
Author Contributions
All the authors designed and performed the experiments and analyzed the results. The manuscript was written by Y.A. and S.K.
Funding
This research received no external funding.
Acknowledgments
The authors are grateful to Sumitomo Bakelite Co., Ltd. for providing samples. We also would like to thank Kohta Tsutsumi of Akita University for his help in the experiments.
Conflicts of Interest
The authors declare no conflict of interest.
References
- Zubi, G.; Dufo-López, R.; Carvalho, M.; Pasaoglu, G. The lithium-ion battery: State of the art and future perspective. Renew. Sustain. Energy Rev. 2018, 89, 292–308. [Google Scholar] [CrossRef]
- Bresser, D.; Hosoi, K.; Howell, D.; Li, H.; Zeisel, H.; Amine, K.; Passerini, S. Perspectives of automotive battery R&D in China, Germany, Japan, and the USA. J. Power Sources 2018, 382, 176–178. [Google Scholar]
- Andwari, A.M.; Pesiridis, A.; Rajoo, S.; Martinez-Botas, R.; Esfahanian, V. A review of battery electric vehicle technology and readiness levels. Renew. Sustain. Energy Rev. 2017, 78, 414–430. [Google Scholar] [CrossRef]
- Andre, D.; Kim, S.J.; Lamp, P.; Lux, S.F.; Maglia, F.; Paschos, O.; Stiaszny, B. Future generations of cathode materials: An automotive industry perspective. J. Mater. Chem. A 2015, 3, 6709–6732. [Google Scholar] [CrossRef]
- Andre, D.; Hain, H.; Lamp, P.; Maglia, F.; Stiaszny, B. Future high-energy density anode materials from an automotive application perspective. J. Mater. Chem. A 2017, 5, 17174–17198. [Google Scholar] [CrossRef]
- Placke, T.; Kloepsch, R.; Dühnen, S.; Winter, M. Lithium ion, lithium metal, and alternative rechargeable battery technologies: The odyssey for high energy density. J. Solid State Electrochem. 2017, 21, 1939–1964. [Google Scholar] [CrossRef]
- Yang, X.; Zuo, Z.; Wang, H.; Chen, Q.; Zhang, H.; Huang, Z.; Wu, B.; Zhou, H. The contradiction between the half-cell and full-battery evaluations on the tungsten-coating LiNi0.5Co0.2Mn0.3O2 cathode. Electrochim. Acta 2015, 180, 604–609. [Google Scholar] [CrossRef]
- Jiao, L.; Liu, Z.; Sun, Z.; Wu, T.; Gao, Y.; Li, H.; Li, F.; Niu, L. An advanced lithium ion battery based on a high quality graphitic graphene anode and a Li[Ni0.6Co0.2Mn0.2]O2 cathode. Electrochim. Acta 2018, 259, 48–55. [Google Scholar] [CrossRef]
- Ding, Y.; Wang, R.; Wang, L.; Cheng, K.; Zhao, Z.; Mu, D.B.; Wu, B. A short review on layered LiNi0.8Co0.1Mn0.1O2 positive electrode material for lithium-ion batteries. Energy Procedia 2017, 105, 2941–2952. [Google Scholar]
- Azuma, H.; Imoto, H.; Yamada, S.; Sekai, K. Advanced carbon anode materials for lithium ion cells. J. Power Sources 1999, 81–82, 1–7. [Google Scholar] [CrossRef]
- Eftekhari, A. Low voltage anode materials for lithium-ion batteries. Energy Storage Mater. 2017, 7, 157–180. [Google Scholar] [CrossRef]
- Zhang, X.; Fan, C.; Han, S. Improving the initial Coulombic efficiency of hard carbon-based anode for rechargeable batteries with high energy density. J. Mater. Sci. 2017, 52, 10418–10430. [Google Scholar] [CrossRef]
- Ni, J.; Huang, Y.; Gao, L. A high-performance hard carbon for Li-ion batteries and supercapacitors application. J. Power Sources 2013, 223, 306–311. [Google Scholar] [CrossRef]
- Yu, H.; Dong, X.; Pang, Y.; Wang, Y.; Xia, Y. High power lithium-ion battery based on spinel cathode and hard carbon anode. Electrochim. Acta 2017, 228, 251–258. [Google Scholar] [CrossRef]
- Holtstiege, F.; Bärmann, P.; Nölle, R.; Winter, M.; Placke, T. Pre-Lithiation strategies for rechargeble energy storage technologies: Concepts, promises and challenges. Batteries 2018, 4, 4. [Google Scholar] [CrossRef]
- Libich, J.; Máca, J.; Vondrák, J.; Cech, O.; Sedlaríková, M. Irreversible capacity and rate-capability properties of lithium-ion negative electrode based on natural graphite. J. Energy Storage 2017, 14, 383–390. [Google Scholar] [CrossRef]
- Wang, Z.; Fu, Y.; Zhang, Z.; Yuan, S.; Amine, K.; Battaglia, V.; Liu, G. Application of Stabilized Lithium Metal Powder (SLMP®) in graphite anode—A high efficient prelithiation method for lithium-ion batteries. J. Power Sources 2014, 260, 57–61. [Google Scholar] [CrossRef]
- Jarvis, C.R.; Lain, M.J.; Yakovleva, M.V.; Gao, Y. A prelithiated carbon anode for lithium-ion battery applications. J. Power Sources 2006, 162, 800–802. [Google Scholar] [CrossRef]
- Son, I.H.; Park, J.H.; Park, S.; Park, K.; Han, S.; Shin, J.; Doo, S.G.; Hwang, Y.; Chang, H.; Choi, J.W. Graphene balls for lithium rechargeable batteries with fast charging and high volumetric energy densities. Nat. Commun. 2017, 8, 1561. [Google Scholar] [CrossRef] [Green Version]
- Sun, H.; He, X.; Ren, J.; Li, J.; Jiang, C.; Wan, C. Hard carbon/lithium composite anode materials for Li-ion batteries. Electrochim. Acta 2007, 52, 4312–4316. [Google Scholar] [CrossRef]
- Wang, H.; Lai, C.; Xiao, Y.; Ai, X. A new lithium-ion battery with LiNi0.80Co0.15Al0.05O2 cathode and lithium pre-doping hard carbon anode. Mater. Lett. 2015, 160, 250–254. [Google Scholar] [CrossRef]
- Zhang, J.; Liu, X.; Wang, J.; Shi, J.; Shi, Z. Different types of pre-lithiated hard carbon as negative electrode material for lithium-ion capacitors. Electrochim. Acta 2016, 187, 134–142. [Google Scholar] [CrossRef]
- Liu, Y.; Yang, B.; Dong, X.; Wang, Y.; Xia, Y. A simple prelithiation strategy to build a high-rate and long-life lithium-ion battery with improved low-temperature performance. Angew. Chem. Int. Ed. 2017, 56, 1–6. [Google Scholar] [CrossRef]
- Hori, H.; Shikano, M.; Kobayashi, H.; Koike, S.; Sakaebe, H.; Saito, Y.; Tatsumi, K.; Yoshikawa, H.; Ikenaga, E. Analysis of hard carbon for lithium-ion batteries by hard X-ray photoelectron spectroscopy. J. Power Sources 2013, 242, 844–847. [Google Scholar] [CrossRef]
- Guan, T.; Sun, S.; Yu, F.; Gao, Y.; Fan, P.; Zuo, P.; Du, C.; Yin, G. The degradation of LiCoO2/graphite batteries at different rates. Electrochim. Acta 2018, 279, 204–212. [Google Scholar] [CrossRef]
- Kasnatscheew, J.; Placke, T.; Streipert, B.; Rothermel, S.; Wagner, R.; Meister, P.; Laskovic, I.C.; Winter, M. A tutorial into practical capacity and mass balancing of lithium ion batteries. J. Electrochem. Soc. 2017, 164, A2479–A2486. [Google Scholar] [CrossRef]
- Loeffler, N.; Zamory, J.V.; Laszczynski, N.; Doberdo, I.; Kim, G.T.; Passerini, S. Performance of LiNi1/3Mn1/3Co1/3O2/graphite batteries based on aqueous binder. J. Power Sources 2014, 248, 915–922. [Google Scholar] [CrossRef]
- Zheng, H.; Li, J.; Song, X.; Liu, G.; Battaglia, V.S. A comprehensive understanding of electrode thickness effects on the electrochemical performances of Li-ion battery cathodes. Electrochim. Acta 2012, 71, 258–265. [Google Scholar] [CrossRef]
- Liu, S.; Xiong, L.; He, C. Long cycle life lithium ion battery with lithium nickel cobalt manganese oxide (NCM) cathode. J. Power Sources 2014, 261, 285–291. [Google Scholar] [CrossRef]
- Rezvani, S.J.; Pasqualini, M.; Witkowska, A.; Gunnella, R.; Birrozzi, A.; Minicucci, M.; Rajantie, H.; Copley, M.; Nobili, F.; Cicco, A.D. Binder-induced surface structure evoluation effects on Li-ion battery performance. Appl. Surf. Sci. 2018, 435, 1029–1036. [Google Scholar] [CrossRef]
- Oswald, S. Binding energy referencing for XPS in alkali metal-based battery materials research (I): Basic model investigations. Appl. Surf. Sic. 2015, 351, 492–503. [Google Scholar] [CrossRef]
- Yen, Y.C.; Chao, S.C.; Wu, H.C.; Wu, N.L. Study on solid-electrolyte-interphase of Si and C-coated Si electrodes in lithium cells. J. Electrochem. Soc. 2009, 156, A95–A102. [Google Scholar] [CrossRef]
- Nie, M.; Demeaux, J.; Young, B.T.; Heskett, D.R.; Chen, Y.; Bose, A.; Woicik, J.C.; Lucht, B.L. Effect of vinylene carbonates and fluoroethylene carbonates on SEI formation on graphite anodes in Li-ion batteries. J. Electrochem. Soc. 2015, 162, A7008–A7014. [Google Scholar] [CrossRef]
- Dedryvere, R.; Martinez, H.; Leroy, S.; Lemordant, D.; Bonhomme, F.; Biensan, P.; Gonbeau, D. Surface film formation on electrode in a LiCoO2/graphite cell: A step by step XPS study. J. Power Sources 2007, 174, 462–468. [Google Scholar] [CrossRef]
- Andersson, A.M.; Henningson, A.; Siegbahn, H.; Jansson, U.; Edstrom, K. Electrochemically lithiated graphite characterised by photoelectron spectroscopy. J. Power Sources 2003, 119–121, 522–527. [Google Scholar] [CrossRef]
- Chan, C.K.; Ruffo, R.; Hong, S.S.; Cui, Y. Surface chemistry and morphology of the solid electrolyte interphase on silicon nanowire lithium-ion battery anodes. J. Power Sources 2009, 189, 1132–1140. [Google Scholar] [CrossRef]
- Verma, P.; Maire, P.; Novák, P. A review of the features and analyses of the solid electrolyte interphase in Li-ion batteries. Electrochim. Acta 2010, 55, 6332–6341. [Google Scholar] [CrossRef]
- Peled, E.; Menkin, S. Review—SEI: Past, present and future. J. Electrochem. Soc. 2017, 164, A1703–A1719. [Google Scholar] [CrossRef]
Figure 1.
Processes of prelithiation for hard carbon (HC) negative electrodes (NEs) and lithium nickel cobalt manganese oxide (NCM)/HC full-cell assembly.
Figure 1.
Processes of prelithiation for hard carbon (HC) negative electrodes (NEs) and lithium nickel cobalt manganese oxide (NCM)/HC full-cell assembly.

Figure 2.
Li-ion extraction-insertion properties of the NCM electrode at various C-rates: (a) the specific capacity and the Coulombic efficiency (CE) at 0.1–10 C-rate; (b) the potential profiles of the first to third cycles at 0.1 C-rate; (c) the potential profiles of the 38th to 40th cycles at 0.1 C-rate. The cut-off potential range was 2.5–4.2 V vs. Li/Li+; 1 C-rate is equal to 160 mA g−1.
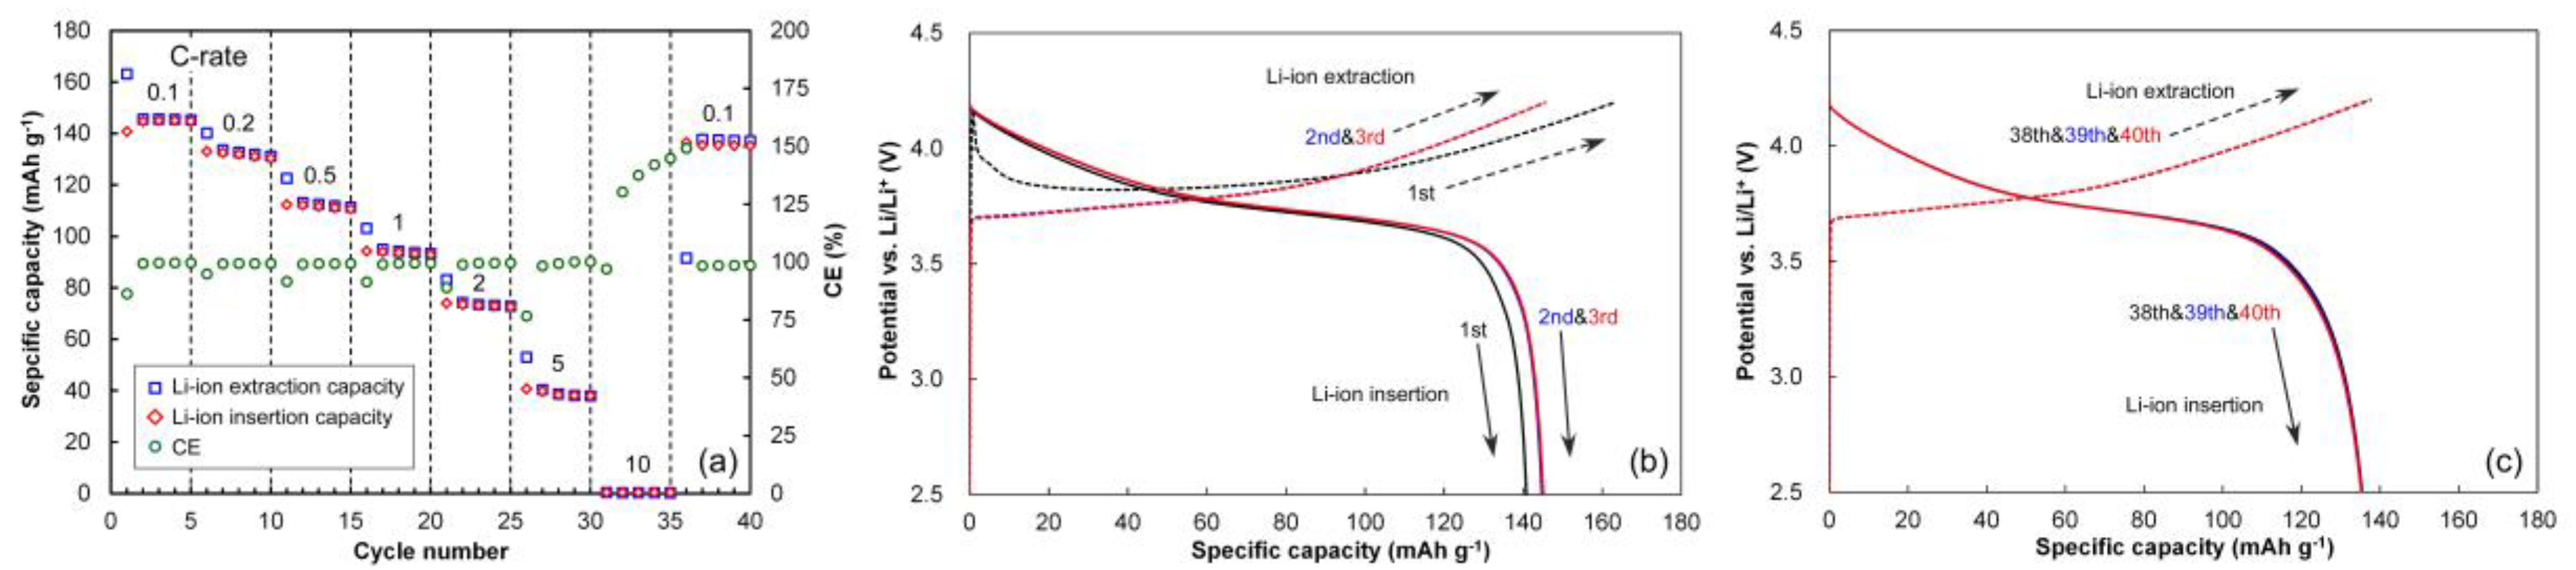
Figure 3.
Li-ion insertion-extraction properties of the HC electrode at various C-rates: (a) the specific capacity and the CE at 0.1–10 C-rate; (b) the potential profiles of the first to third cycles at 0.1 C-rate; (c) the potential profiles of the 38th to 40th cycles at 0.1 C-rate. The cut-off potential range was 0–2.5 V vs. Li/Li+; 1 C-rate is equal to 200 mA g−1.

Figure 4.
The open circuit voltage (OCV) of the half-cells and full-cells just after cell assembly.

Figure 5.
Charge-discharge behaviors of the full-cells with pristine and prelithiated HC NEs during pre-cycling: (a) pristine HC cell; (b) shallow prelithiation HC cell; (c) cycling prelithiation HC cell. The cell voltage was increased from the OCV to 4.2 V for the first charging, and was decreased to 2.5 V for the first discharging. Subsequently, the cells were charged and discharged in the cell voltage range of 2.5–4.2 V. The current density was 0.1 C-rate; 1 C-rate is equal to 170 mA gPE−1.

Figure 6.
Cycling behavior of the full-cells with the pristine and prelithiated HC NEs in the cell voltage range of 2.5–4.2 V at 2 C-rate (340 mA gPE−1).
Figure 6.
Cycling behavior of the full-cells with the pristine and prelithiated HC NEs in the cell voltage range of 2.5–4.2 V at 2 C-rate (340 mA gPE−1).

Figure 7.
Rate behavior of the full-cells before and after charge-discharge cycling: (a) pristine HC cell before cycling; (b) shallow prelithiation HC cell before cycling; (c) cycling prelithiation HC cell before cycling; (d) pristine HC cell after cycling; (e) shallow prelithiation HC cell after cycling; (f) cycling prelithiation HC cell after cycling. The C-rates varied from 0.1 to 10 C-rate, and the cut-off cell voltage range was 2.5–4.2 V; 1 C-rate is 170 mA gPE−1. Results of the third cycle for each C-rate test are shown.

Figure 8.
Relationship between specific power and specific energy of the full-cells with pristine and prelithiated HC NEs: (a) before cycling; (b) after cycling. In the graphs, 1 C-rate is equal to 170 mA gPE−1.
Figure 8.
Relationship between specific power and specific energy of the full-cells with pristine and prelithiated HC NEs: (a) before cycling; (b) after cycling. In the graphs, 1 C-rate is equal to 170 mA gPE−1.

Figure 9.
XPS depth profiles of the pristine and prelithiated HC electrodes obtained by Ar ion etching. The etching rate (SiO2) is 0.167 nm s−1.
Figure 9.
XPS depth profiles of the pristine and prelithiated HC electrodes obtained by Ar ion etching. The etching rate (SiO2) is 0.167 nm s−1.

Figure 10.
Composition of the pristine and prelithiated HC electrodes as a fuction of the etching time: (a) pristine HC; (b) shallow prelithiation HC; (c) cycling prelithiation HC. The etching time (SiO2) is 0.167 nm s−1.
Figure 10.
Composition of the pristine and prelithiated HC electrodes as a fuction of the etching time: (a) pristine HC; (b) shallow prelithiation HC; (c) cycling prelithiation HC. The etching time (SiO2) is 0.167 nm s−1.


Table 1.
Prelithiation processes to prepare the HC NEs used for the NCM/prelithiated HC full-cells.
| Prelithiation | First Cycle | Second Cycle | Third Cycle | ||||||
|---|---|---|---|---|---|---|---|---|---|
| CapLi-in 1 (mAh g−1) | CapLi-ex 2 (mAh g−1) | CE 3 (%) | CapLi-in 1 (mAh g−1) | CapLi-ex 2 (mAh g−1) | CE 3 (%) | CapLi-in 1 (mAh g−1) | CapLi-ex 2 (mAh g−1) | CE 3 (%) | |
| Shallow Li-ion insertion | 52.9 | - | - | - | - | - | - | - | - |
| Thrice-repeated deep Li-ion insertion and extraction | 497 | 361 | 72.6 | 383 | 357 | 93.3 | 375 | 357 | 95.0 |
1 Li-ion insertion specific capacity; 2 Li-ion extraction specific capacity; 3 Coulombic efficiency.
Table 2.
Specific charge and discharge capacities and CE of NCM/HC full-cells in the first to third cycles at 0.1 C-rate (17 mA gPE−1).
Table 2.
Specific charge and discharge capacities and CE of NCM/HC full-cells in the first to third cycles at 0.1 C-rate (17 mA gPE−1).
| Cell | First Cycle | Second Cycle | Third Cycle | ||||||
|---|---|---|---|---|---|---|---|---|---|
| CapC 1 (mAh gPE−1) | CapD 2 (mAh gPE−1) | CE 3 (%) | CapC 1 (mAh gPE−1) | CapD 2 (mAh gPE−1) | CE 3 (%) | CapC 1 (mAh gPE−1) | CapD 2 (mAh gPE−1) | CE 3 (%) | |
| Pristine HC cell | 179 | 129 | 71.9 | 132 | 129 | 97.6 | 131 | 129 | 98.6 |
| Shallow prelithiation HC cell | 179 | 142 | 79.6 | 145 | 142 | 97.6 | 143 | 141 | 98.4 |
| Cycling prelithiation HC cell | 176 | 150 | 85.4 | 151 | 150 | 99.4 | 151 | 150 | 99.4 |
1 Charge specific capacity; 2 Discharge specific capacity; 3 Coulombic efficiency.
© 2018 by the authors. Licensee MDPI, Basel, Switzerland. This article is an open access article distributed under the terms and conditions of the Creative Commons Attribution (CC BY) license (http://creativecommons.org/licenses/by/4.0/).
Share and Cite
MDPI and ACS Style
Abe, Y.; Saito, T.; Kumagai, S. Effect of Prelithiation Process for Hard Carbon Negative Electrode on the Rate and Cycling Behaviors of Lithium-Ion Batteries. Batteries 2018, 4, 71. https://doi.org/10.3390/batteries4040071
AMA Style
Abe Y, Saito T, Kumagai S. Effect of Prelithiation Process for Hard Carbon Negative Electrode on the Rate and Cycling Behaviors of Lithium-Ion Batteries. Batteries. 2018; 4(4):71. https://doi.org/10.3390/batteries4040071
Chicago/Turabian StyleAbe, Yusuke, Tomoaki Saito, and Seiji Kumagai. 2018. "Effect of Prelithiation Process for Hard Carbon Negative Electrode on the Rate and Cycling Behaviors of Lithium-Ion Batteries" Batteries 4, no. 4: 71. https://doi.org/10.3390/batteries4040071
Note that from the first issue of 2016, this journal uses article numbers instead of page numbers. See further details here.