Article

Electrochemical Performance and in Operando Charge Efficiency Measurements of Cu/Sn-Doped Nano Iron Electrodes

1
Department of Chemical Engineering, KTH Royal Institute of Technology, SE-100 44 Stockholm, Sweden
2
Department of Materials and Environmental Chemistry, Stockholm University, SE-106 91 Stockholm, Sweden
3
Material Physics, KTH Royal Institute of Technology, SCI, S-164 40 Kista, Sweden
4
Höganäs AB, SE-263 83 Höganäs, Sweden
5
Division of Physical Chemistry, Department of Chemistry, The Ångström Laboratory, Uppsala University, P.O. Box 523, SE-75120 Uppsala, Sweden
*
Author to whom correspondence should be addressed.
Batteries 2019, 5(1), 1; https://doi.org/10.3390/batteries5010001
Submission received: 19 November 2018 / Revised: 29 November 2018 / Accepted: 6 December 2018 / Published: 21 December 2018
(This article belongs to the Special Issue Electrochemical Battery Lifetime Testing, Analysis and Estimation)

Abstract

:
Fe-air or Ni-Fe cells can offer low-cost and large-scale sustainable energy storage. At present, they are limited by low coulombic efficiency, low active material use, and poor rate capability. To overcome these challenges, two types of nanostructured doped iron materials were investigated: (1) copper and tin doped iron (CuSn); and (2) tin doped iron (Sn). Single-wall carbon nanotube (SWCNT) was added to the electrode and LiOH to the electrolyte. In the 2 wt. % Cu + 2 wt. % Sn sample, the addition of SWCNT increased the discharge capacity from 430 to 475 mAh g−1, and charge efficiency increased from 83% to 93.5%. With the addition of both SWCNT and LiOH, the charge efficiency and discharge capacity improved to 91% and 603 mAh g−1, respectively. Meanwhile, the 4 wt. % Sn substituted sample performance is not on par with the 2 wt. % Cu + 2 wt. % Sn sample. The dopant elements (Cu and Sn) and additives (SWCNT and LiOH) have a major impact on the electrode performance. To understand the relation between hydrogen evolution and charge current density, we have used in operando charging measurements combined with mass spectrometry to quantify the evolved hydrogen. The electrodes that were subjected to prolonged overcharge upon hydrogen evolution failed rapidly. This insight could help in the development of better charging schemes for the iron electrodes.

1. Introduction

Consumption of energy produced through fossil fuels is considered to be one of the major contributors to global warming [1]. To achieve a sustainable energy system, many nations have initiated subsidies to add wind and solar power generation to the electricity grid. The intermittent character of these renewable energy sources requires, however, large-scale energy storage systems to handle the load fluctuations. At present, only 1% of the total energy produced is stored by the pumped hydroelectric storage plants, which offers the lowest cost among the available storage solutions today ($180–200/kWh), and accounts 98% of the installed storage systems [2,3]. On the other hand, electrochemical energy storage systems (EES) have several advantages such as flexibility in design and size, with high efficiency and can be installed either close to the generation or at the consumer sites [3,4].
Among different battery chemistries, only the Fe-air battery meets the performance (80% current efficiency and 5000 cycles) and capital cost requirement ($100/kWh) as prescribed by the United States Department of Energy [5]. The Swedish National Development Corporation and the Westinghouse corporation had been developing this system with an energy density of 80 and 140 Wh kg−1, respectively, for traction application [6,7]. Although the energy and power densities were not enough to meet the performance targets for the traction application, their performance is compelling enough for the grid-scale energy storage requirements such as safety, cost, and performance [7]. However, the Fe-air battery has some problems such as low current efficiency, low material use, and poor discharge rate [6,8,9,10].
Operation of the iron electrode involves two reaction stages during their charge and discharge, as shown in reactions Equations (1) and (2). The first stage involves a two-electron Fe and Fe(OH)2 redox couple, while following this stage, Fe(OH)2 forms Fe(OOH). The conventional iron electrode uses only the first discharge step, corresponding to 962 mAh g−1 of specific discharge capacity. Furthermore, the iron electrode is a good catalyst for the hydrogen evolution reaction. Its reversible thermodynamic potential is −0.93 V vs. Hg/HgO, as shown in Equation (3). Consequently, the iron electrode undergoes self-discharge reaction under open cell configuration resulting in the accumulation of passive iron hydroxides, and also hydrogen evolution during charging [11].
Fe + 2OH↔ Fe(OH)2 + 2e; E0 = −0.975V vs. Hg/HgO
3Fe(OH)2 + 2OH ↔ Fe3O4 . 4H2O + 2e; E0 = −0.756 V vs. Hg/HgO
2H2O + 2e ↔ H2 + 2OH; E0 = −0.93 V vs. Hg/HgO
As a consequence of the self-discharge and hydrogen evolution, the iron electrode presents poor charge efficiency, low charge retention and low discharge capacity with decreased life cycle [12,13]. Additionally, the passive oxide and hydroxide phases gradually build up over time [12]. To overcome hydrogen evolution, sulfur additives are either added to the electrode formulation (e.g., FeS + Bi 2 O 3 , Bi 2 S 3 ) or to the electrolyte by addition of Na 2 S , K 2 S , and organosulfur compounds [14,15,16,17]. The adsorbed sulfur depassivates the iron electrode and thereby it increases the electrode conductivity, rate capability and further poisons the active catalytic surfaces for the hydrogen evolution. Previous studies have shown that bismuth as an additive suppresses the hydrogen evolution by increasing the overpotential [18,19,20].
To circumvent the low active usage of the material as well as passivation inducing capacity decay, nano iron, nano iron-carbon composites and FeS materials have been used as active materials [21,22,23,24,25,26,27,28,29]. Notably, iron with graphene, MWCNT, amorphous carbon composites have shown to be producing increased redox activity and high capacity. However, these materials have presented rapid capacity decay, which is caused by nanoparticle agglomeration and by increased rate of hydrogen evolution [29,30,31,32,33]. Sundar Rajan et al. [18] demonstrated that carbon grafted iron delivered 400 mAh g−1 of specific discharge capacity (discharge rate 100 mA g−1). C.-Y. Kao et al. [10] reported that in the presence of Cu a high discharge capacity (800 mAh g−1) at 3200 mA g−1 was achieved. The results confirm that Cu and amorphous carbon enhances the iron discharge performance. Our recent work on copper substituted core-shell structured iron/iron carbide/carbon active material has also shown to maintain stable discharge capacity (350 mAh g−1) at higher discharge rate 100–350 mA g−1 [34]. Chamoun et al. used stannate electrolyte additive, which resulted in high capacity at 400 mAh g−1 with 85% charge efficiency [35]. Here the thin layer of Sn deposits on the iron electrode is believed to suppress the H2 evolution. Therefore, amorphous carbon, Cu, and Sn have the capability to enhance the iron electrode redox activity.
In this work, we have used and studied nano/iron/carbon/Cu/Sn and nano/iron/carbon/Sn as two type of active materials for the iron electrode. We also investigated the effect of single-wall carbon nanotube (SWCNT) and LiOH on the iron electrode to maintain the performance of the charge and discharge capacities of these materials. This study aims to show that the particle agglomeration is prevented by the carbon layer, while Cu maintains the stable conductivity, whereas Sn suppresses the hydrogen evolution. We have achieved capacity as high as 600 mAh g−1 for the SWCNT with LiOH addition to the electrolyte. Furthermore, we investigated the effect of charge current density on the hydrogen evolution rate for different electrode formulations coupled with mass spectrometry. From this study, we have observed that high charge current density reduces the hydrogen evolution rate.

2. Experimental Method

Nano iron powders doped with copper and tin were obtained from Höganäs AB. In sample 1, denominated as CuSn, the elemental compositions were 2 wt. % Cu, 2 wt. % Sn, 23 wt. % C and 73 wt. % Fe. Sample 2 (Sn), consists of 4 wt. % Sn, 24 wt. % carbon and 72 wt. % Fe. The composition of carbon was based on the thermogravimetric analysis (TGA) and energy-dispersive X-ray spectroscopy (EDX).
The powder samples were analyzed by X-ray diffraction (XRD) (Siemens Bruker D5000), equipped with a Co Kα source (30 mA, 40 kV). The phase identification was made on the EVA software, and the powder diffraction file (PDF 2) was used to identify the plane reflection. The morphologies of the powder samples were analyzed by Zeiss Ultra-55 scanning electron microscope (SEM), and transmission electron microscope (TEM) image was obtained by JEOL JEM-2100F. X-ray photoelectron spectroscopy (XPS) was investigated in a PHI Quantum 2000 scanning XPS microprobe with Al Kα radiation as a source. The spot size was 0.1 × 0.1 µm2, and the energy resolution was set to 0.3 eV. The intensity of the ratio of the peaks were in the integrated area over the background. The fit-XPS software was used for peak positioning. The Raman measurements were carried out using an imaging spectrometer (iHR550, Horiba Jobin Yvon, Longjumeau cedex, France) in confocal geometry, using 532 nm laser light for excitation. Notch filter at ±50 cm−1 around 532 nm was used to filter the scattered light.
The electrodes were prepared by mixing the doped nano iron powder 80 wt. % with high surface area carbon black 5 wt. % (Ketjenblack EC-300J AkzoNobel), Bi 2 S 3 (5 wt. %) and PTFE 10 wt. % (60 wt. % water suspension). In the other two-electrode formulations, 0.1 wt. % SWCNT (TUBALL SWCNT 0.2 wt. % in N-Methyl-2-pyrrolidone (NMP) solution) was added. The composite electrode in the form of paste was prepared by mixing the materials as mentioned above with D-70 Shellsol® (Shell Chemicals, Europe) using an agitation rate of 6000 RPM (Waring® laboratory blender LB20ES, Clarkson Laboratory & Supply Inc., CA, USA). Then, the filtered wet mass was rolled over to a defined thickness of 0.7 mm on a- nickel wire (100 mesh). The electrode was compressed (375 kg cm−2) and dried in N2 atmosphere and sintered at 325 °C for 30 min [36,37]. The tested electrodes are specified as shown in Table 1. The amount of iron in the electrodes was found to vary between 22–29 mg cm−2.
The electrodes in Table 1 were studied in a three-electrode cell compartment, in which a conventional sintered nickel electrode (Ni(OH)2/NiOOH) was used as a counter electrode, Hg/HgO as a reference electrode and the iron composite as a working electrode. In all the experiment 6 M KOH was used as electrolyte. In Li experiment, 6 M KOH + 0.65 M LiOH was used as electrolyte. All the reported potential values were against Hg/HgO reference electrode immersed in the same electrolyte solution.
All the repeated charge (reduction to iron) and discharge (oxidation to iron hydroxide) measurements were done on the Land battery testing system (CT2001-5V2A BTS System). Charge and discharge currents were fixed at 200 and 100 mA g−1, respectively, and the discharge potential was limited to –0.800 V vs. Hg/HgO. All the capacity and current details are based on the amount of iron in the composite. Hydrogen evolution and iron reduction potentials were measured at the end of each charging with the initial hump in the charging plateau. Then this was subtracted from the corresponding equilibrium potential value to get the overpotential.
The in operando charge efficiency measurements have been described in earlier work, where electrochemical water splitting catalysis coupled with mass spectrometry allowed the detection of gaseous products [38]. The cell consisted of two chambers and was separated by a nonwoven cellulose membrane (Freudenberg, 700/18F) and sealed with rubber gaskets (Kuntze, ESO2 425-010 EPDM). Each chamber with a volume of 48 cm2 was constantly purged with argon gas through the inlets at the bottom of the chambers. From each chamber the gas outlets were joined in a single exhaust, which served as a gas sampling point for MS measurements (Pfeiffer, Thermostar GSD320-QMG220). The exhaust was then passed through a gas flow meter (Rota Yokogawa, RAK-D41). The iron electrode samples were evaluated with a potentiostat (BioLogic, SP-50) in a two-electrode setup with an oversized conventional nickel electrode as the counter electrode. The geometrical surface areas of the iron and nickel electrodes were 2.25 and 9 cm2, respectively. The electrodes were formed (30–35 cycles) prior to this experiment. All samples for in operando charge efficiencies were cycled three times with 5, 10 and 15 mA cm−2 of charge and 5 mA cm−2 for discharge.

3. Results and Discussion

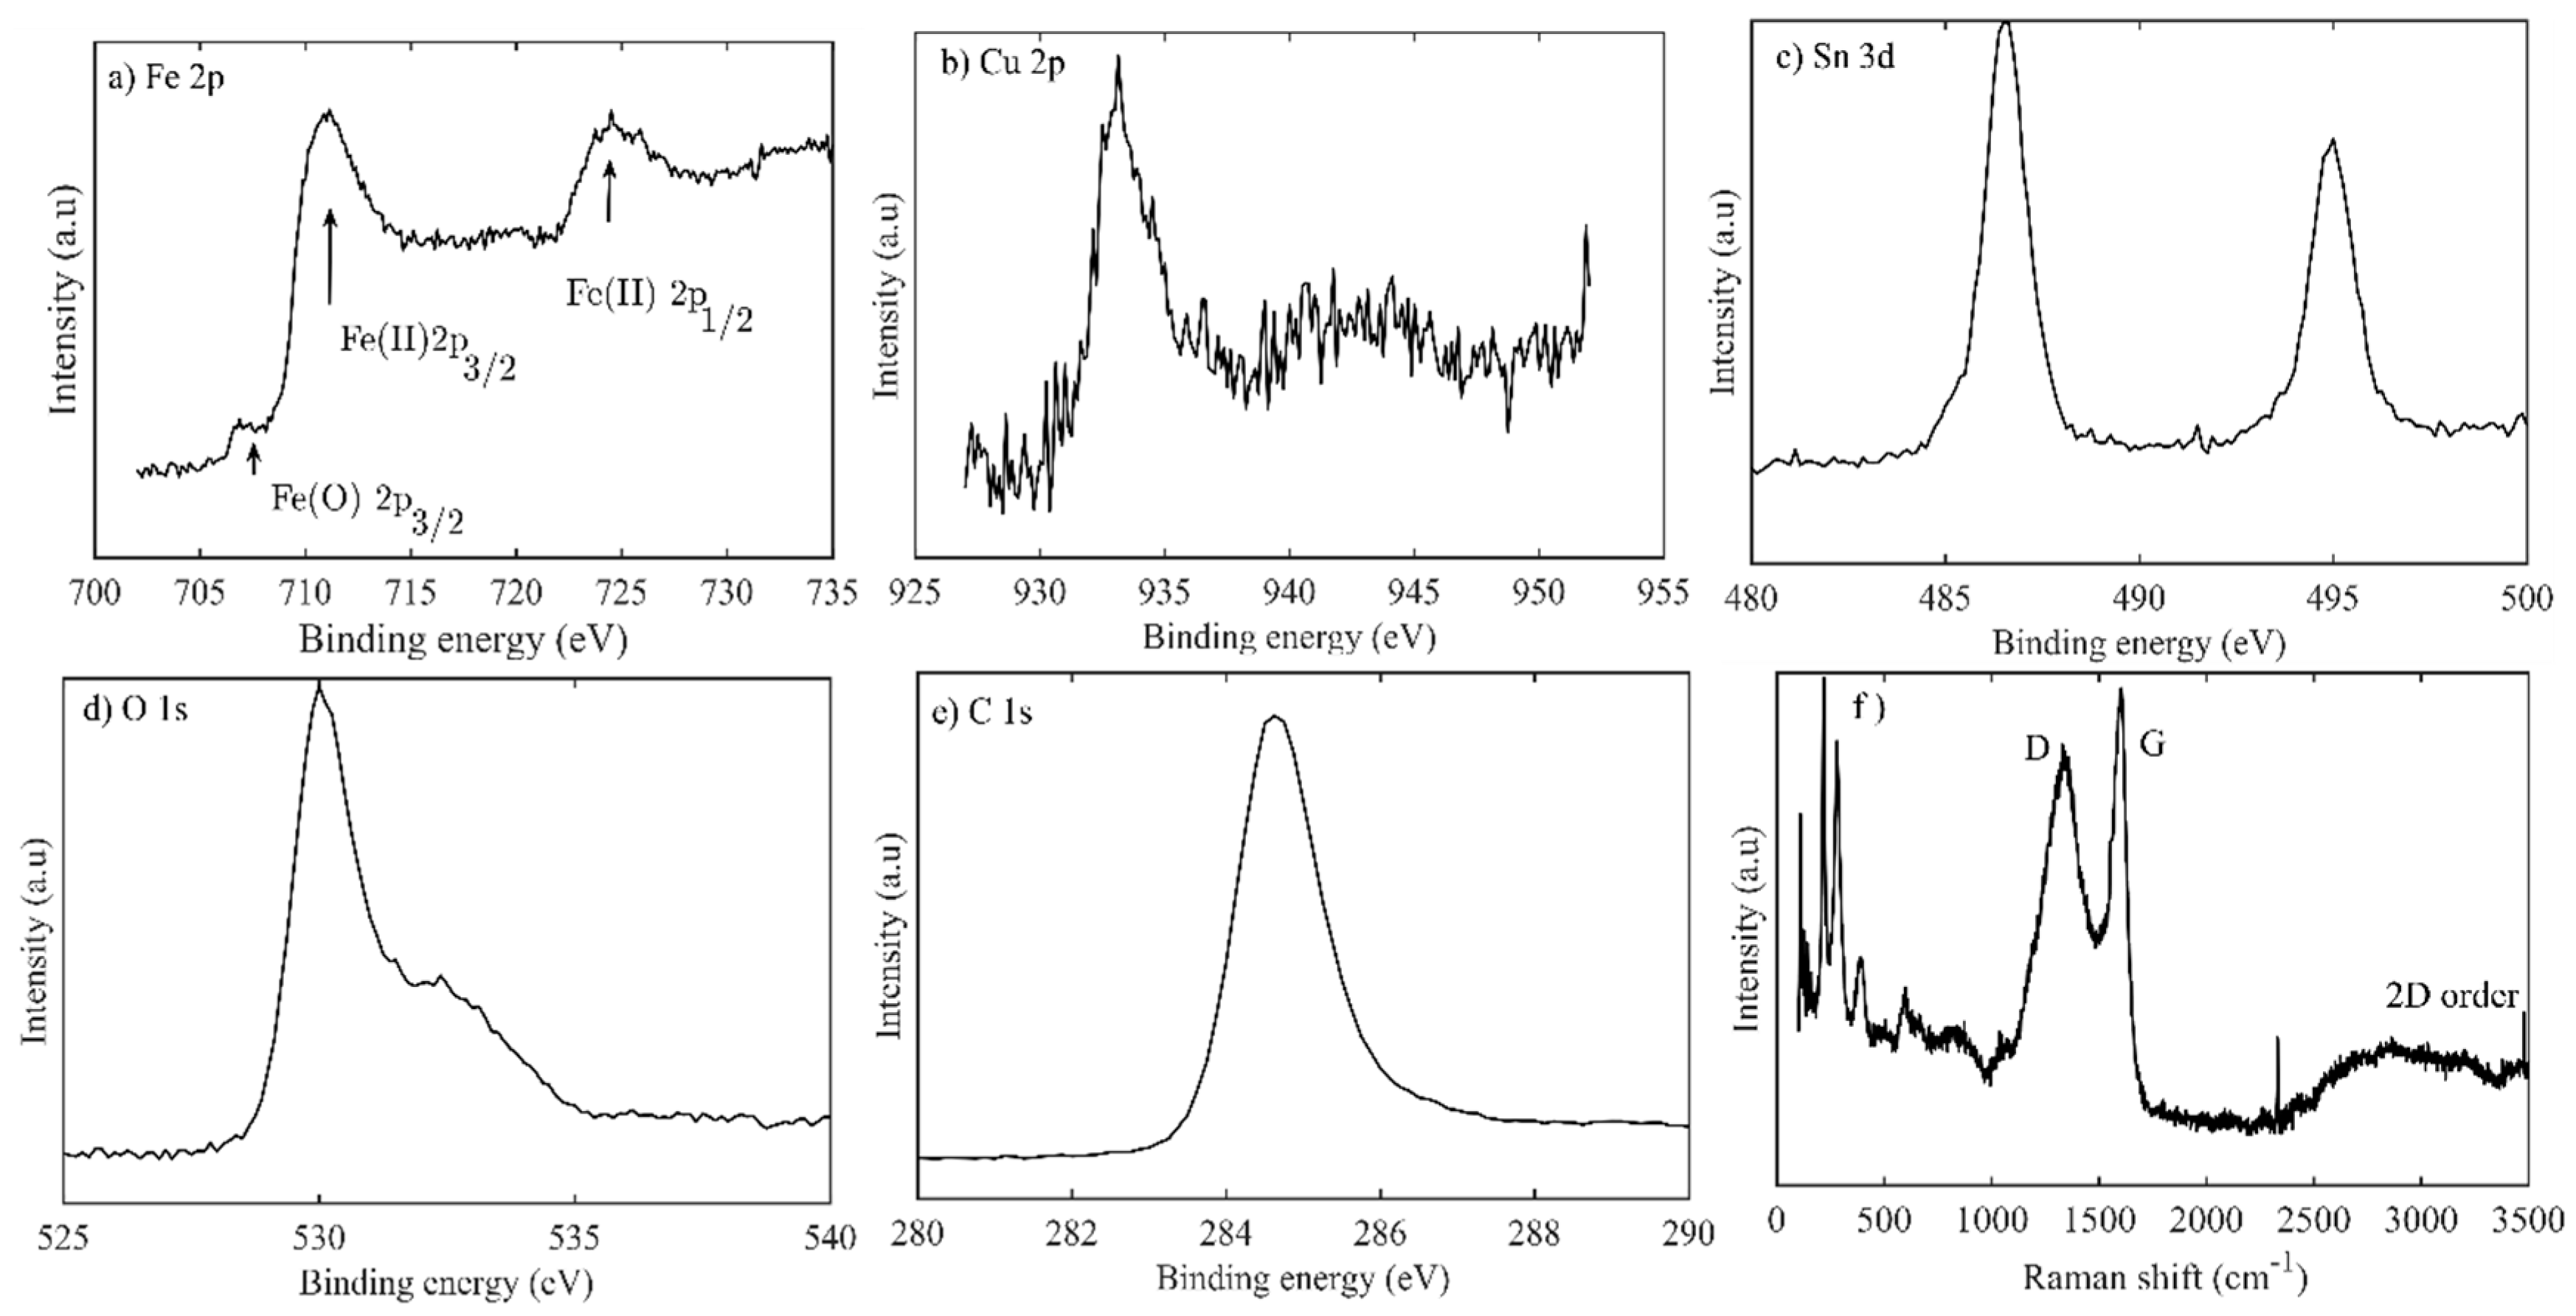
3.1. Material Characterizations

Figure 1 illustrates the crystal phases for the XRD patterns of the two samples: CuSn (a) and Sn (b). In both samples, α-Fe was the dominant phase. In the case of the Sn sample, Fe3SnC was also observed as a minor phase along with the α-Fe phase. However, when 2 wt. % Cu was introduced with 2 wt. % Sn, Fe 3 Sn phases were observed with traces of Fe 3 SnC . Metallic Cu and Sn phases were not detected due to the low concentrations of the respective elements. Even though both samples have more than 20 wt. % carbon, no graphitic phases are observed, which suggest that these carbons are of amorphous in nature, which may improve the electrode conductivity, whereas the porous network will also increase the ionic conductivity [39,40]. A further advantage of the carbon is that it will buffer the volume expansion and maintain stable electrical conductivity of the iron electrode during the electrochemical cycling [41].
Figure 2a,b,d,e shows the SEM micrographs of CuSn- (Figure 2a–c) and Sn- (Figure 2d–f) doped nano iron. As seen from Figure 2, both the samples possess rough spherical structure (5–10 μm) with an internal cavity. Closer inspection of the CuSn-doped sample, (Figure 2b) reveals the existence of smaller spherical particles (250–450 nm) fused together to form a continuous network which enhances the interparticle connectivity. Meanwhile, the Sn-doped sample (Figure 2e) showed irregular shapes viz. rectangular, acicular, and spherical. Figure 2c,f shows the elemental distribution of the CuSn- and Sn-doped samples. In both samples, Fe, Sn, O, and C were uniformly distributed. For the former sample, Cu was evenly distributed with Fe. Interestingly, O and C observed in the elemental mapping were not detected as any phases by the XRD analyses; however, Figure 2c,f display surface enrichment and distribution. Uniform distribution of Cu, Sn, and C in the electrode enhance the electronic conductivity by maintaining a continuous conductive matrix, which could be beneficial for stable iron electrode operation.
Moreover, both samples were analyzed by TEM with the results as shown in Figure 3. Figure 3a presents the morphology of the CuSn sample showing uniform particle sizes (100–300 nm) embedded in the filamentous carbon layer. In the Sn sample shown in Figure 3b, the particles are smaller (30–150 nm), unevenly sized with irregular shapes. From the TEM mass contrast, darker and lighter platelets shaped iron particle are observed. Thus, closely fused interconnected particles tend to decrease the electrode resistance and enhance the electrochemical performance of the CuSn sample [42].
Figure 4 displays the XPS spectra of the CuSn sample. Figure 4a shows the Fe 2p spectrum with characteristic peaks at 706.7 eV of metallic Fe(0) 2 p 2 / 3 , 711 eV of Fe(II) 2 p 2 / 3 and 724.5 eV 2 p 1 / 2 . Figure 4b shows the Cu 2p spectrum, with peaks observed at 932.6 and 933.6 eV corresponding to metallic Cu(0), Cu(I) and Cu(II). The Sn 3 d 2 / 5 spectrum (Figure 4c) has one sharp peak at 486.9 eV. This peak corresponds to SnO or SnO 2 . Moreover, a weak shoulder is observed at 485 eV for metallic Sn(0). Figure 4d illustrates the O 1s spectrum. There are two peaks: one at ca 530 eV corresponding to the metal oxides Fe 2 O 3 , Fe 3 O 4 , FeO and SnO 2 , and the second peak at 532.6 eV related to OH [43]. The C 1s spectrum (Figure 4e) shows one strong peak at 284.8 eV confirming the presence of carbon in the sample. The XPS results further confirm that the copper, iron, and tin species exist either in metallic or oxide form on the sample surface. The intensity ratios with corrected atomic sensitivity factor (ASF) (excluding C) are presented in Table 2. We have set the Cu intensity to 1. The intensity ratio corroborates that the tin species are enriched, and copper is depleted on the surface. Almost all iron at the surface is oxidized in the form of Fe 2 O 3 and Fe 3 O 4 , while the core is maintained in metallic form. There is a weak signal from Fe3SnC in the XRD data. Given the rather small relative amount we can neither confirm nor exclude carbide from our XPS-data.
To discern the type of carbon in the CuSn sample, Raman spectroscopy was carried out as shown in Figure 4f. Several prominent peaks are observed at 216, 277, 401, 1340, 1607 cm−1. The first three of these peaks correspond to Fe 2 O 3 [44], while the remaining two peaks represent the D and G bands in carbon materials. Moreover, another diffuse band around 2700 cm−1 is characteristic for the 2D band. Both the D and G bands originate from the in-plane optical phonons in the graphene layer [45]. The D band is not observed in defect-free Highly Ordered Pyrolytic Graphite (HOPG), but becomes Raman active due to defects within the graphene planes [45]. The deconvoluted intensity ratio (ID/IG) of the D and G bands gives the degree of graphitization in the sample and an ID/IG value of 0.64 was obtained. This (ID/IG) ratio and the weak and broad 2D band suggest that the sample is conductive and partially graphitized [46]. The Raman results confirm that amorphous carbon is present in the CuSn sample. Furthermore, the presence of FeO X peak suggests that carbon layer does not completely coated over the particles.

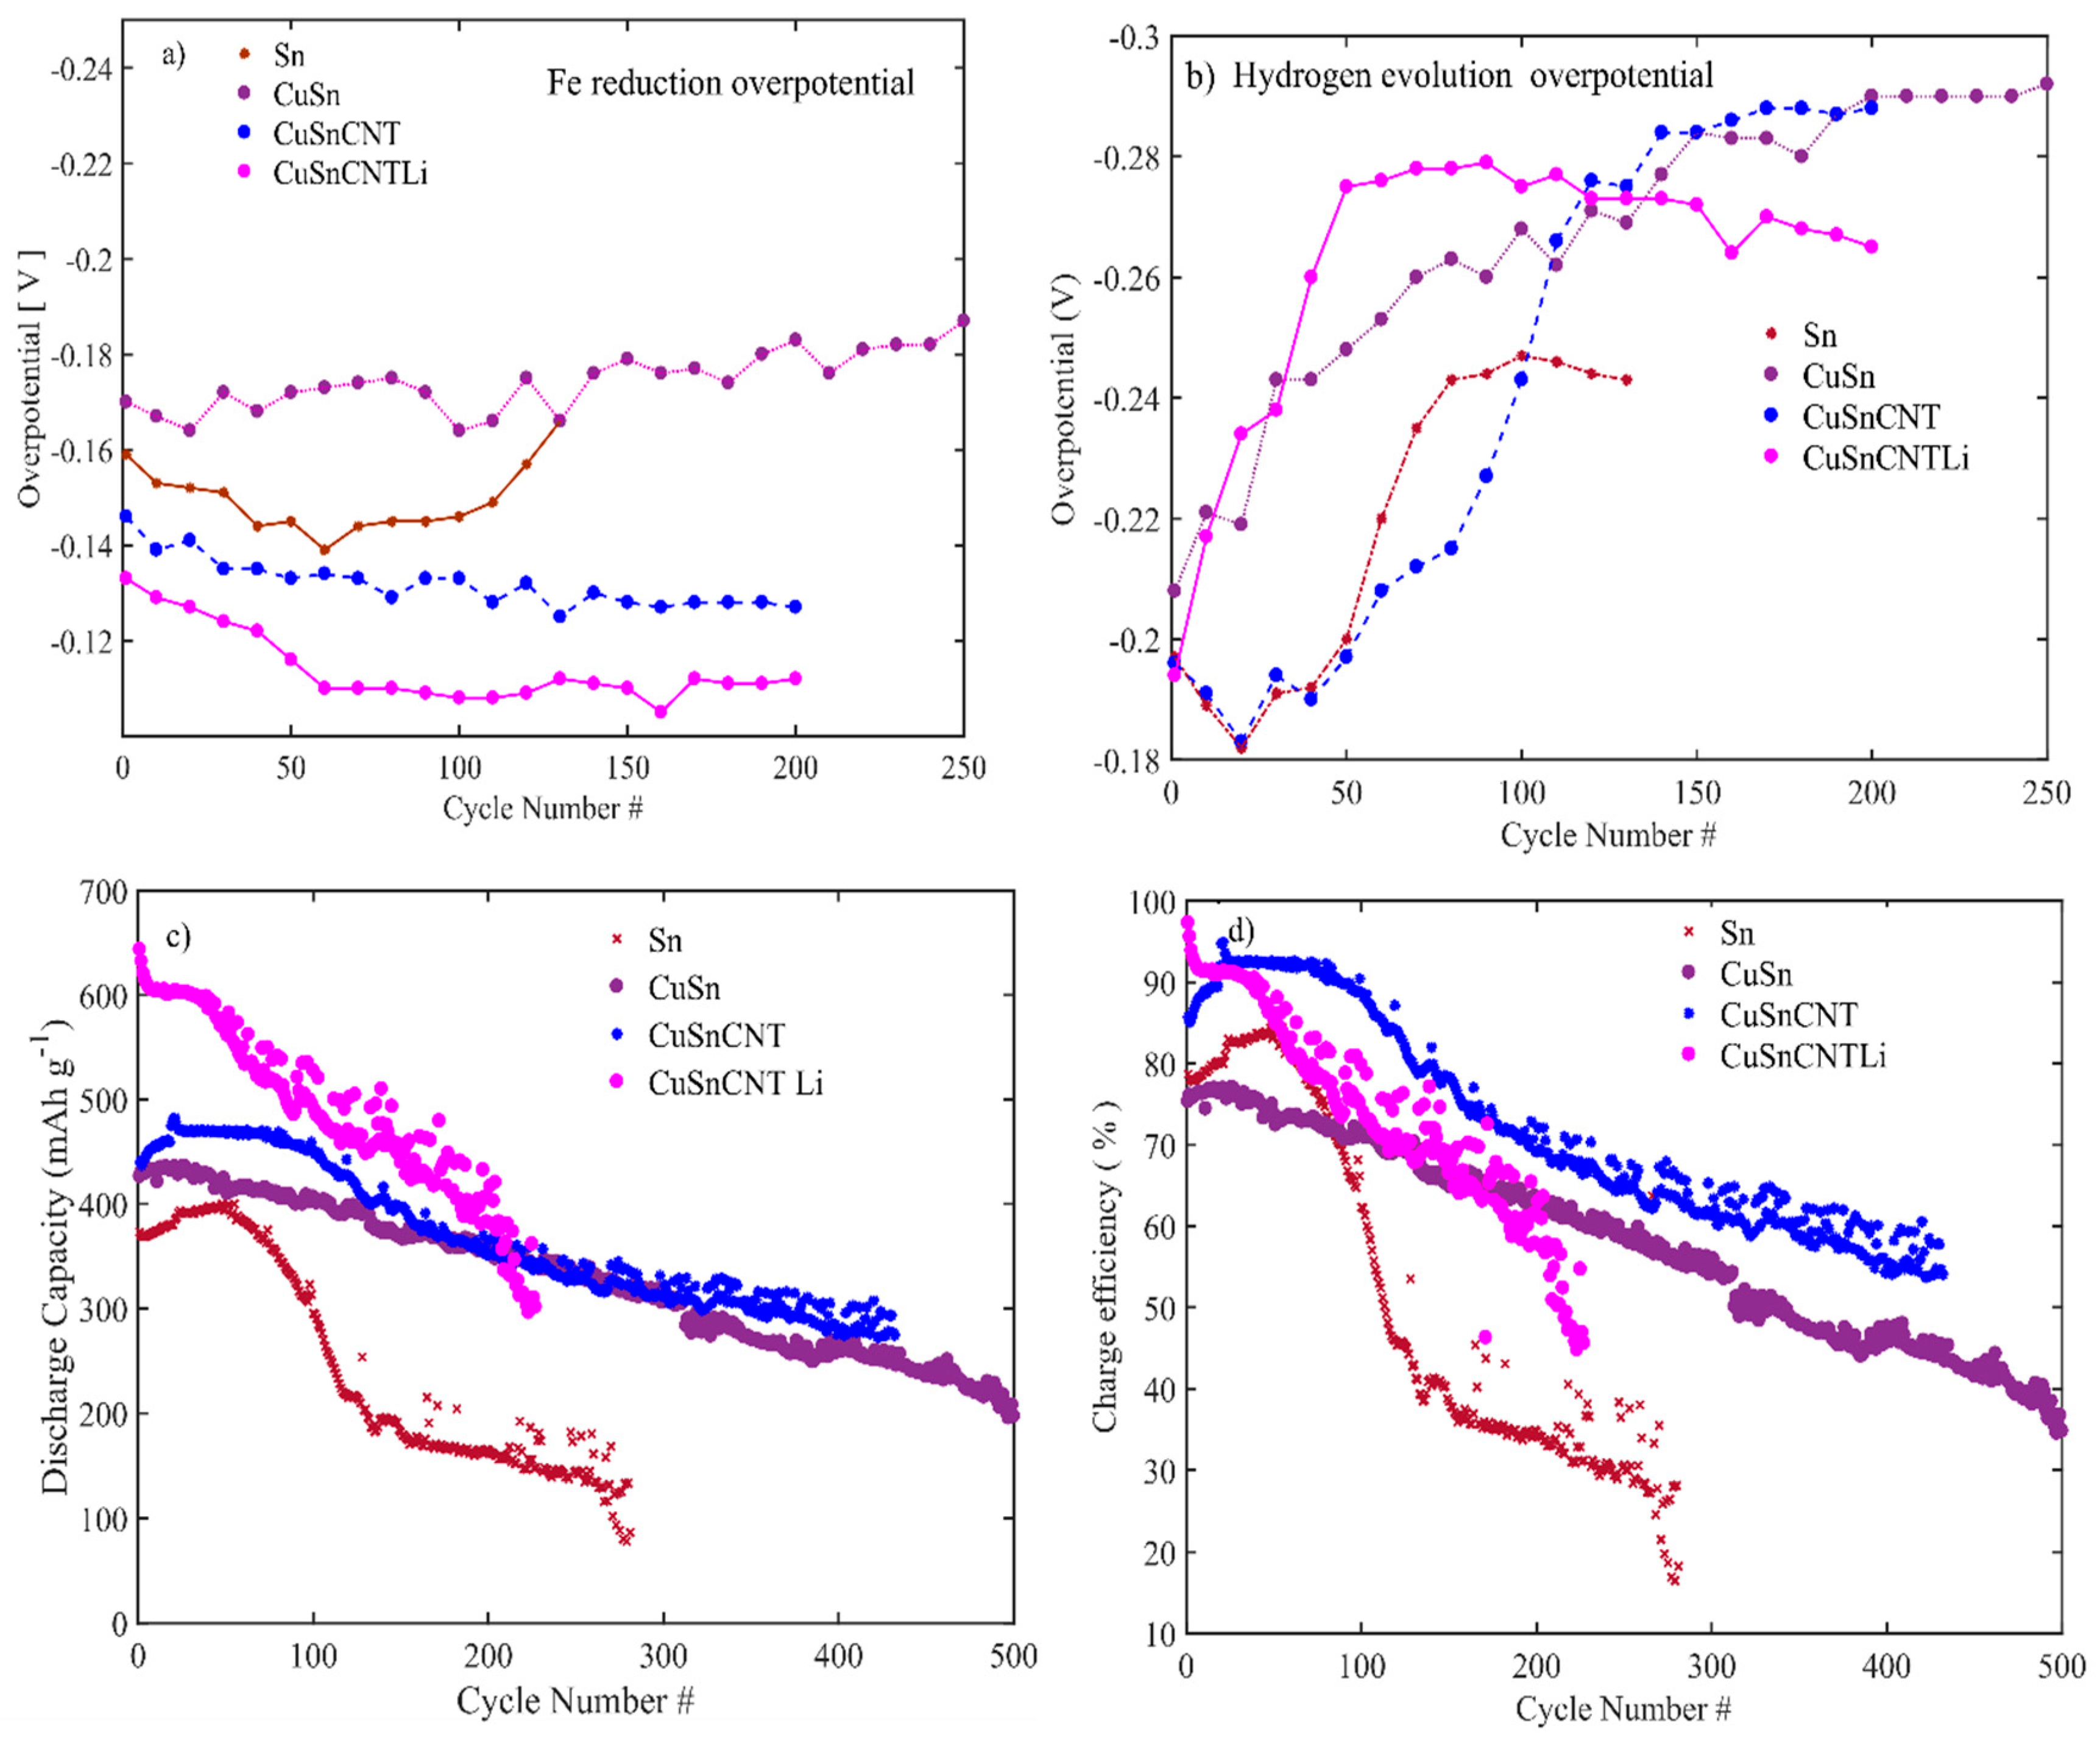
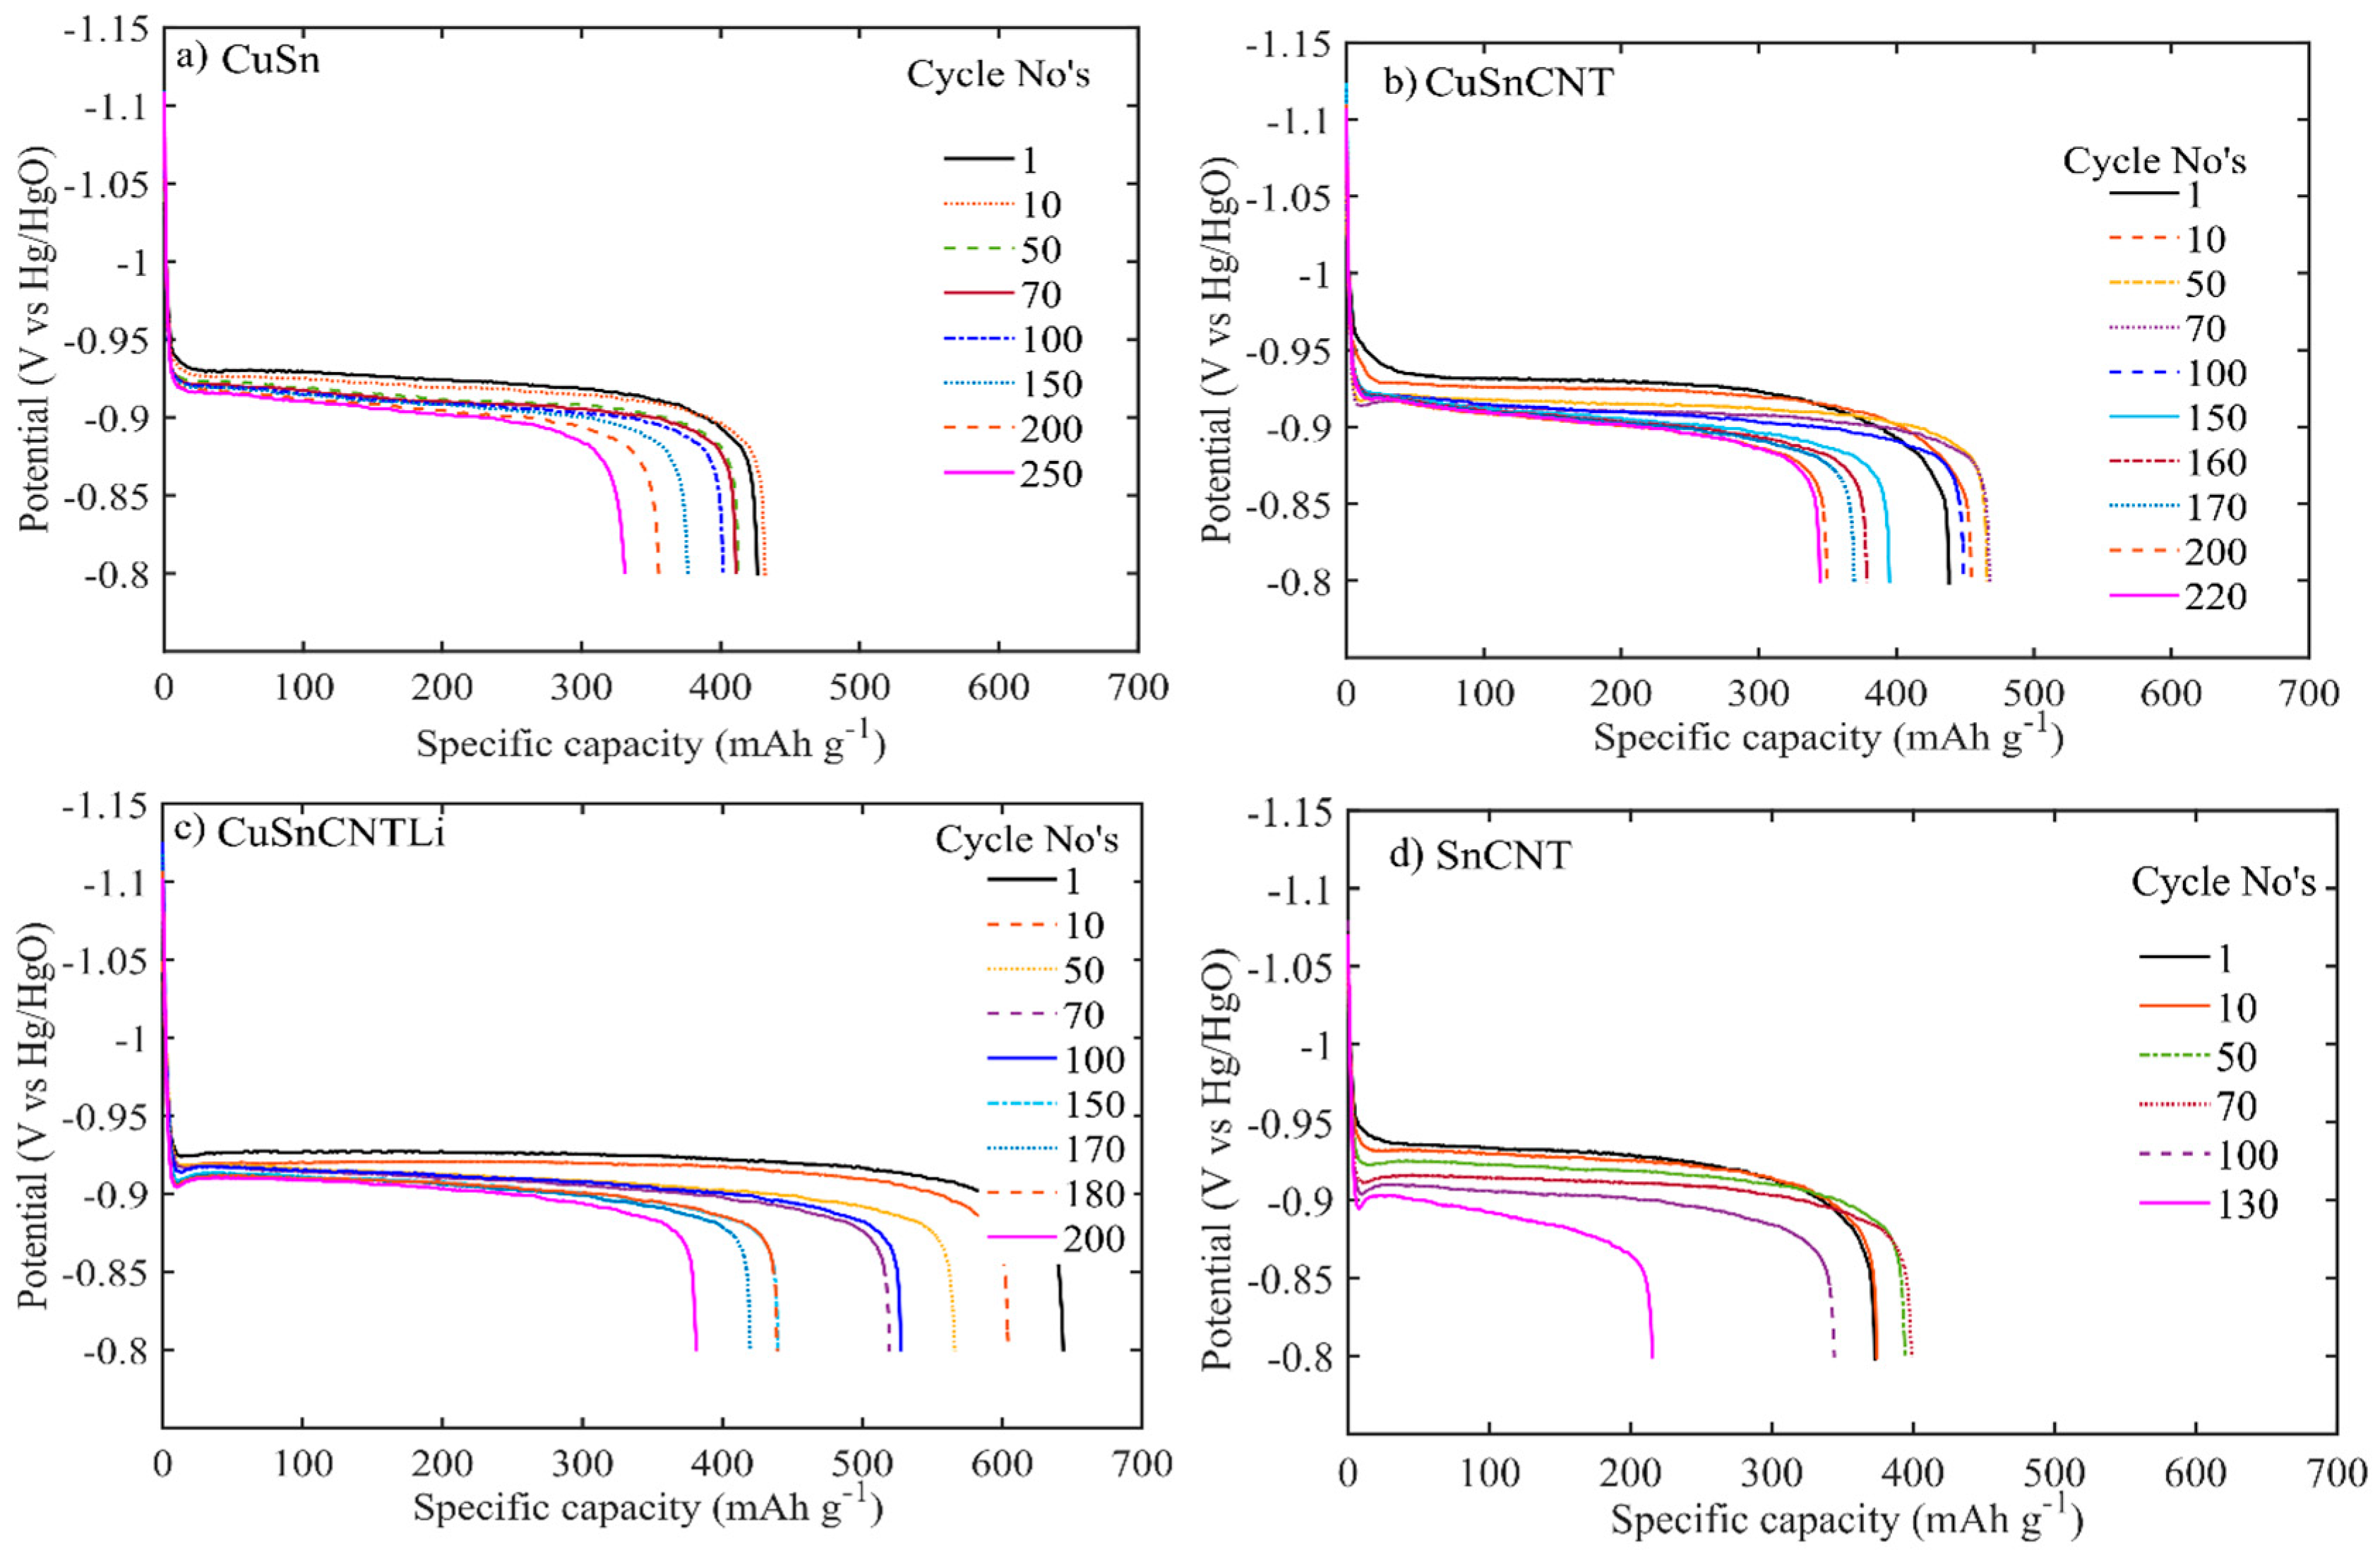
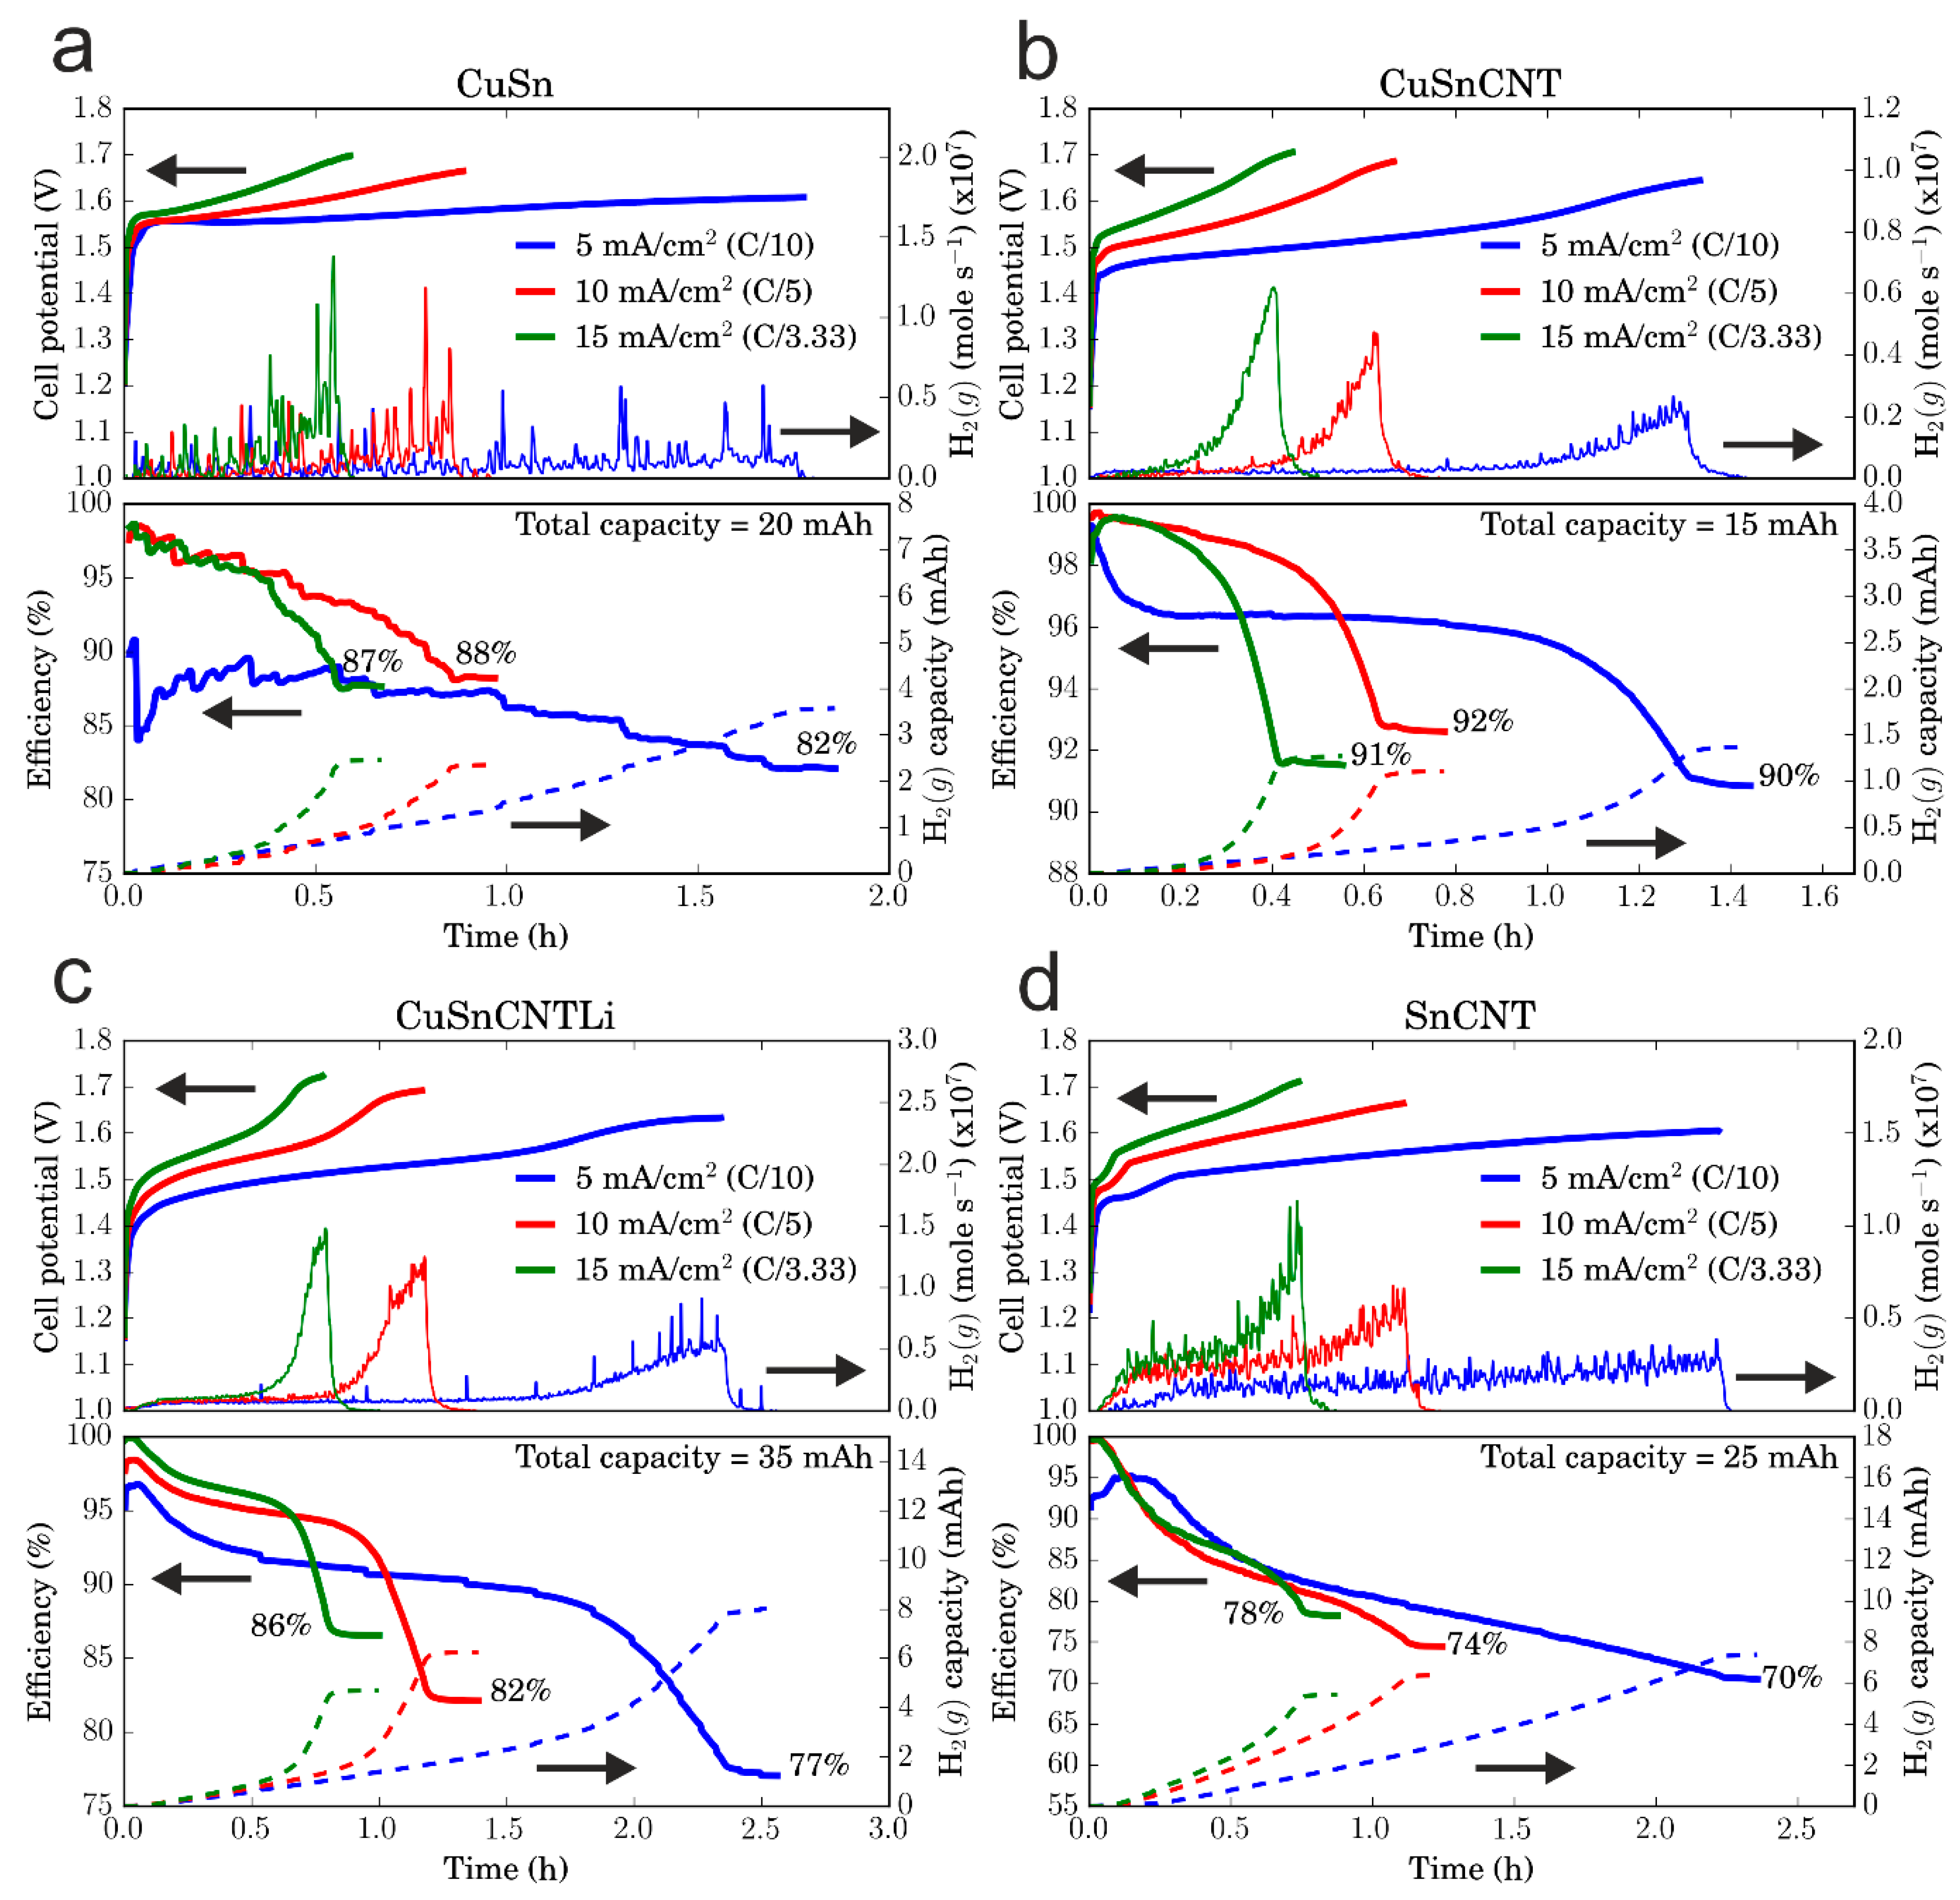
3.2. Electrochemical Performance of the Electrodes

Figure 5 illustrates the discharge profiles of the electrodes at the constant current discharge of 100 mA g−1. All four samples had 5 wt. % Bi 2 S 3 , 10 wt. % PTFE and 5 wt. % Ketjenblack EC-300J. Two of the samples had 0.1 wt. % SWCNT (TUBALL OCSIAL EUROPE, Leudelange, Grand-Duché de Luxembourg). Their initial discharge capacities are shown in Table 3. Among them, sample CuSn with 0.1 wt. % CNT and 0.65 M LiOH demonstrate the highest initial discharge capacity at 603 mAh g−1 with 91 % charge efficiency, while the CuSn sample with CNT and without CNT exhibit 470 and 434 mAh g−1 with 93 and 82% charge efficiency, respectively. This performance increase is due to the enhanced electrode conductivity and porosity created by CNT, Cu, amorphous carbon network, which acts as an electron transport and ion transport pathways. Thus, provides a better interface and the ideal reaction site for charging reaction [47,48]. While the addition of LiOH increase the iron dissolution and form a porous hydroxide, which enhancing the electrolyte access to the active material [29]. In contrast to CuSn containing samples, the Sn sample with CNT shows low discharge capacity of 378 mAh g−1 and 76.7 % efficiency, which indicates that 4 wt. % Sn only could not improve the electrochemical performance as with the CuSn sample. Further observations of discharge plateaus (Figure 5) show that all the electrodes have an initial stable discharge plateau at −0.93 V and when the cycle number increases the discharge plateau potentials decrease to −0.9 V. This potential decay implies that the electrode resistance is increased during cycling, caused by accumulated non-conducting discharge products preventing further oxidation of iron. This effect is more significant on the SnCNT sample, which showed lower performance with the highest overpotential and capacity decay among the four electrodes. In our previous study, 2% Cu doped iron had delivered stable performance at 367 mAh g−1 of discharge capacity and with 80 % of charge efficiency [34]. Comparing the bare Cu and bare Sn-doped samples, Sn performance shows poor performance in terms of capacity and cyclability. Possible reasons for this decay could be tin’s lower conductivity without the presence of Cu and non-uniform nanoparticle size distribution as shown in Figure 2d and Figure 3b.
The charge profiles of the electrodes at 200 mA g−1 are given in Figure 6. The iron hydroxide reduction voltage plateaus appear between −1.1 V to −1.15 V. During the initial cycles all the electrodes have a single charge plateau and after increasing cycle number two distinct plateaus are observed, one for the iron reduction and another for the hydrogen evolution at −1.2 V. The length of these two plateaus varies with cycle numbers. It can be seen from the CNT containing CuSn electrodes that the iron reduction potential is much lower (about 10 mV) than the CuSn sample without CNT. This confirmed that the charge efficiency is improved by the addition of 0.1 wt. % CNT in the CuSn electrode [21]. The other noticeable difference among the electrodes is the potential overshoot at the start of the charging (inset Figure 6). This primarily arises due to the resistance of iron hydroxide nucleation to Fe transformation [11]. In the CNT containing electrodes this overshoot gradually disappeared over cycles. Increase in the overshoot potential was observed for the CuSn as well indicating that the CNT addition favored nucleation. Two overshoot regions are observed with the Sn sample. This could be due to dissolved tin being reduced back to form Sn or Fe-Sn alloys [35,49].
Figure 7 shows the overpotential trends of iron reduction and hydrogen evolution during cycling. The first plateau corresponds to iron reduction as shown in Figure 7a, and the second plateau to hydrogen evolution as shown in Figure 7b. Long iron reduction plateau and a low overpotential results in a higher charge acceptance. The iron reduction overpotential is more positive for the CNT electrodes compared to the CuSn electrode. Without CNT addition the iron reduction overpotential is found to be around −0.17 V while with CNT, the overpotential was reduced to −0.14 V, while the overpotential dropped additionally with LiOH to −0.11 V. On the contrary, the 4 wt. % Sn shows an increasing overpotential (Figure 6d) despite the addition of CNT. Thus, CNT and LiOH addition decrease the iron reduction overpotential only in the CuSn sample. The hydrogen evolution region takes place at lower overpotentials during the initial cycles and increases over subsequent cycles. However, this overpotential increment does not translate into improved performance. Upon the charge/discharge cycles, the iron reduction plateau length gradually decreases while the hydrogen evolution plateau slowly increases to higher potentials. This could be ascribed to the depletion of sulfur and subsequent Bi enrichment on the iron electrode [20,34].
Figure 7c,d illustrates the life cycle assessment of the electrodes at a constant current charge of 200 mA g−1 and discharge of 100 mA g−1. The capacity of the CuSnCNTLi electrode drops to 50% from 600 (at 1st cycle) to 300 mAh g−1 at 225th cycle (loss of 1.3 mAh g−1/cycle). The CuSnCNT electrode is more stable with a capacity of 277 mAh g−1 with an 55% charge efficiency after 450 cycles (loss of 0.41 mAh g−1/cycle). At 450 cycles, the capacity of the CuSn sample drops (loss of 0.47 mAh g−1/cycle) to 250 mAh g−1 with an efficiency of 45 %. Even though LiOH addition remarkably increases the capacity up to 62% of its theoretical value; its long-term stability is found to be poor. The prolonged cycling increases the H2 evolution and the mechanical stability of the electrode worsens because of too high porosity resulting in loss of active material from the electrode [29]. Similarly, the SnCNT (loss of 0.96 mAh g−1/cycle) sample also presents poor long-term stability. As shown in the TEM images in Figure 3, the large particle size distribution and excessive H2 evolution is detrimental to the long cycle performance of the electrode. The high capacities could be realized by using the nano CuSn sample with different additives (LiOH and CNT), which also imply that the CNT addition increases the porosity. The porosities of the electrodes lied in between 55 to 60%. Highly porous electrodes have higher interparticle resistance, compared to a metallic conductor. During cycling, increase in the interparticle contact resistance affects the charge acceptance of the iron reduction and consequently accelerates the capacity decay.
Differential electrochemical mass spectrometry is a useful technique to study the aging of batteries by coupling mass spectrometry with electrochemical techniques [50]. Here, in operando charge efficiency studies were performed when charging the iron electrodes at different current densities and simultaneously quantifying the amount of H2 gas collected in the mass spectrometer. In this study, it was assumed that deviation from 100 % charge efficiency is solely caused by H2 gas evolution originating from charging the iron electrodes. The measurements are based on Faraday’s law:
n = It zF
where n = number of moles (mol), I = current (A), t = time (s), z = electrons transferred per ion (z = 2 for H2) and F = 96,485 C mol−1. Stainless steel (SS) was chosen as a standard to quantify the accumulated H2 gas upon assuming 100% efficiency. A linear potential sweep from 0.3 to 0.55 V vs. Ag/AgCl with a sweeping rate of 0.2 mV s−1 was done to calibrate the accumulated H2 gas on SS and the charge passed was correlated with the recorded counts of H2 from the mass spectrometer. Calibration was done prior to each sample study and quantification factors were calculated according to:
quant .   factor = I EC t I MS t
where I EC = current recorded from the potentiostat (A) and I MS = extracted ion signal from the MS (A). The quantification factors were determined to (12.18 ± 1.32) × 106. The number of H2(g) moles per second evolved during charge of the iron electrodes was calculated by:
n H 2 ( g ) t = quant .   factor · I MS zF
where n H 2 ( g ) = number of H2(g) moles evolved (mol). This is further derived to the cumulative H2(g) capacity:
Q H 2 ( g ) = quant .   factor · I MS t
where Q H 2 ( g ) = charge passed corresponding to H2(g) (C). Lastly, the charge efficiency was defined as:
η charge = Q tot Q H 2 ( g ) Q tot
where Q tot = total capacity of the iron electrode obtained from the potentiostat.
In Figure 8 the charge efficiency at 5, 10 and 15 mA cm−2 is shown for the four samples. For each sample, the top plot shows the cell potential and number of H2(g) moles (Equation (6)) vs. time while the bottom plot shows the charge efficiency (Equation (8)) and cumulative H2(g) capacity (Equation (7)) vs. time. Each charge curve was taken at the last cycle of the specific current density. Also, the H2(g) counts from the MS was extended to ensure that all accumulated gas in the system was considered. The highest efficiencies achieved were in the following order: CuSnCNT > CuSn > CuSnCNTLi > SnCNT. These results are comparable to Table 3, except that the order between CuSn and CuSnCNTLi are on the opposite. The lower efficiency obtained for CuSnCNTLi is due to the prolonged charging at potentials above 1.65 V, evident from Figure 8c. The efficiency evolution during charge in Figure 8 shows three distinguished slopes at potentials: (1) below 1.5 V, (2) between 1.5–1.6 V and (3) above 1.6 V. In the first region, the least H2(g) amount was evolved while nucleation of Fe(OH)2 to Fe took place. In the second, constant rate of H2(g) was released upon iron reduction. Lastly, H2(g) evolution dominated above 1.6 V and led to the overcharging the iron electrode. The highest efficiency of charging iron electrodes occurred at higher current densities, and the efficiency results showed that the electrodes benefited from charging at higher current densities than 10 mA cm−2. Samples with enhanced conductivity, for instance added Cu and CNT, revealed higher charge acceptance of iron reduction, which ultimately suppressed the H2(g) evolution. The efficiencies acquired from the mass spectrometer were compared with the coulombic efficiencies from the potentiostat and are validated with the results as shown in Table 4 with small deviations as a result.
In summary, we have studied two type of nano iron doped electrode materials: one with CuSn and the other one with Sn. Among them, CuSn-doped nano iron samples have delivered high capacities and efficiencies ranging from 434 to 603 mAh g−1 and 83 to 93%, respectively, depending on the additives (CNT, or CNT and LiOH). These performance values are even higher from the reported values in literature [18,23,34]. Based on coupled mass spectrometry and charging iron electrodes, and the galvanostatic cycling profile, CNT containing electrodes have a stable hydrogen evolution plateaus at 1.65 V vs. NiOOH or −1.2 V vs. Hg/HgO. This high rate of hydrogen evolution is not beneficial to the electrode structure. It might destroy the electrode pore structure and interconnectivity of the particles. On the contrary to this, the CuSn does not have pronounced hydrogen evolution plateaus. In the meanwhile, the hydrogen evolution is continuing throughout the charging, not limited to the end charge. MS data (Figure 8a) also confirms this trend. Therefore, inhibiting the high hydrogen evolution could improve the electrode mechanical stability and life cycle, which could be done by constant voltage charging or potential limited constant current charging. High current charging (10 and 15 mA cm−2) improved the electrode efficiency as shown in Table 4.
This study shows that addition of both CuSn, partly amorphous carbon and CNT improve the electrode performance. The Cu, carbon and CNT give a stable interfacial conductivity irrespective of the state of charge. Furthermore, Sn could slow down the hydrogen evolution kinetics [35]. These dopant elements and CNT additive enhance the nano iron cyclability.

4. Conclusions

In our study, CuSn and Sn-doped Nano iron/carbon composites were investigated as negative electrode material for alkaline electrolyte. The best performing CuSn electrode has shown interconnected iron particles, uniformly distributed Cu, Sn and carbon network for effective charge and discharge operation. As a result, of this, CuSn-based electrodes have shown excellent performance. This work also demonstrates the effectiveness of SWCNT and LiOH addition to the electrode on the performance. The CNT addition improves the charge efficiency and capacity to 93% and 470 mAh g−1, respectively. Even though the CNT with LiOH addition increased the performance to 91% and 603 mAh g−1, its cycle stability is compromised. In operando MS analysis quantifies the amount of evolved hydrogen and shows the three different hydrogen evolution rate domains. The higher hydrogen evolution at the end of the charge made the electrodes begin to fail rapidly. The different charge current density vs. performance shows that at higher current density the amount of evolved hydrogen is reduced, and the performance is also improved dramatically. These findings will help to develop suitable charging programs for the iron electrodes. This CuSn nano iron is a suitable negative electrode for the alkaline Ni-Fe or Fe-air battery application.

Author Contributions

A.R.P. and Y.K. conceived and designed the experiments; A.R.P. performed all battery cycling experiments; H.S. designed the GC-MS set-up; M.C. ran the GC-MS of the cell, analyzed and wrote that part. Y.K.; M.G.; D.N.; B.S.; H.V. supervised both A.R.P. and M.C. and were part of the discussion. M.G. and M.B.J. ran the XPS and analyzed that data. A.R.P. wrote the article.

Funding

This work is supported by the Swedish Energy Agency with the project number: 39078-1.

Acknowledgments

This work is supported by the Swedish Energy Agency.

Conflicts of Interest

The authors declare no conflict of interest.

References

  1. Matthews, H.D.; Kirsten, Z.; Reto, K.; Myles, R.A. Focus on cumulative emissions, global carbon budgets and the implications for climate mitigation targets. Environ. Res. Lett. 2018, 13, 010201. [Google Scholar] [CrossRef] [Green Version]
  2. Larcher, D.; Tarascon, J.M. Towards greener and more sustainable batteries for electrical energy storage. Nat. Chem. 2015, 7, 19–29. [Google Scholar] [CrossRef] [PubMed]
  3. Ravikumar, M.K.; Rathod, S.; Jaiswal, N.; Patil, S.; Shukla, A. The renaissance in redox flow batteries. J. Solid State Electrochem. 2016, 1–22. [Google Scholar] [CrossRef]
  4. Akinyele, D.O.; Rayudu, R.K. Review of energy storage technologies for sustainable power networks. Sustain. Energy Technol. Assess. 2014, 8, 74–91. [Google Scholar] [CrossRef]
  5. U.S. Department of Energy. Grid Energy Storage report. 2013. [Google Scholar]
  6. Öjefors, L.; Carlsson, L. An iron—Air vehicle battery. J. Power Sources 1978, 2, 287–296. [Google Scholar] [CrossRef]
  7. Narayanan, S.R.; Prakash, G.K.S.; Manohar, A.; Yang, B.; Malkhandi, S.; Kindler, A. Materials challenges and technical approaches for realizing inexpensive and robust iron–air batteries for large-scale energy storage. Solid State Ion. 2012, 216, 105–109. [Google Scholar] [CrossRef]
  8. Öjefors, L. Self-discharge of the alkaline iron electrode. Electrochim. Acta 1976, 21, 263–266. [Google Scholar] [CrossRef]
  9. Wang, H.; Liang, Y.; Gong, M.; Li, Y.; Chang, W.; Mefford, T.; Zhou, J.; Wang, J.; Regier, T.; Wei, F.; et al. An ultrafast nickel–iron battery from strongly coupled inorganic nanoparticle/nanocarbon hybrid materials. Nat. Commun. 2012, 3, 917. [Google Scholar] [CrossRef]
  10. Kao, C.-Y.; Tsai, Y.-R.; Chou, K.-S. Synthesis and characterization of the iron/copper composite as an electrode material for the rechargeable alkaline battery. J. Power Sources 2011, 196, 5746–5750. [Google Scholar] [CrossRef]
  11. Sundar Rajan, A.; Ravikumar, M.K.; Priolkar, K.R.; Sampath, S.; Shukla, A.K. Carbonyl-Iron Electrodes for Rechargeable-Iron Batteries. Electrochem. Energy Technol. 2015, 1. [Google Scholar] [CrossRef] [Green Version]
  12. Ravikumar, M.K.; Rajan, A.S.; Sampath, S.; Priolkar, K.R.; Shukla, A.K. In Situ Crystallographic Probing on Ameliorating Effect of Sulfide Additives and Carbon Grafting in Iron Electrodes. J. Electrochem. Soc. 2015, 162, A2339–A2350. [Google Scholar] [CrossRef] [Green Version]
  13. Manohar, A.K.; Yang, C.; Malkhandi, S.; Prakash, G.K.S.; Narayanan, S.R. Enhancing the Performance of the Rechargeable Iron Electrode in Alkaline Batteries with Bismuth Oxide and Iron Sulfide Additives. J. Electrochem. Soc. 2013, 160, A2078–A2084. [Google Scholar] [CrossRef]
  14. Yang, C.; Manohar, A.K.; Narayanan, S.R. A High-Performance Sintered Iron Electrode for Rechargeable Alkaline Batteries to Enable Large-Scale Energy Storage. J. Electrochem. Soc. 2017, 164, A418–A429. [Google Scholar] [CrossRef] [Green Version]
  15. Manohar, A.K.; Yang, C.; Narayanan, S.R. The Role of Sulfide Additives in Achieving Long Cycle Life Rechargeable Iron Electrodes in Alkaline Batteries. J. Electrochem. Soc. 2015, 162, A1864–A1872. [Google Scholar] [CrossRef] [Green Version]
  16. Yang, B.; Malkhandi, S.; Manohar, A.K.; Prakash, G.K.S.; Narayanan, S.R. Organo-sulfur molecules enable iron-based battery electrodes to meet the challenges of large-scale electrical energy storage. Energy Environ. Sci. 2014, 7, 2753–2763. [Google Scholar] [CrossRef]
  17. Hang, B.T.; Watanabe, T.; Egashira, M.; Watanabe, I.; Okada, S.; Yamaki, J.-I. The effect of additives on the electrochemical properties of Fe/C composite for Fe/air battery anode. J. Power Sources 2006, 155, 461–469. [Google Scholar] [CrossRef]
  18. Rajan, A.S.; Sampath, S.; Shukla, A.K. An in situ carbon-grafted alkaline iron electrode for iron-based accumulators. Energy Environ. Sci. 2014, 7, 1110–1116. [Google Scholar] [CrossRef]
  19. Balasubramanian, T.S.; Shukla, A.K. Effect of metal-sulfide additives on charge/discharge reactions of the alkaline iron electrode. J. Power Sources 1993, 41, 99–105. [Google Scholar] [CrossRef]
  20. Manohar, A.K.; Malkhandi, S.; Yang, B.; Yang, C.; Surya Prakash, G.K.; Narayanan, S.R. A High-Performance Rechargeable Iron Electrode for Large-Scale Battery-Based Energy Storage. J. Electrochem. Soc. 2012, 159, A1209–A1214. [Google Scholar] [CrossRef] [Green Version]
  21. Lei, D.; Lee, D.C.; Magasinski, A.; Zhao, E.; Steingart, D.; Yushin, G. Performance Enhancement and Side Reactions in Rechargeable Nickel-Iron Batteries with Nanostructured Electrodes. ACS Appl. Mater. Interfaces 2016, 8, 2088–2096. [Google Scholar] [CrossRef]
  22. Jiang, W.; Liang, F.; Wang, J.; Su, L.; Wu, Y.; Wang, L. Enhanced electrochemical performances of FeOx-graphene nanocomposites as anode materials for alkaline nickel-iron batteries. RSC Adv. 2014, 4, 15394–15399. [Google Scholar] [CrossRef]
  23. Ito, A.; Zhao, L.; Okada, S.; Yamaki, J.-I. Synthesis of nano-Fe3O4-loaded tubular carbon nanofibers and their application as negative electrodes for Fe/air batteries. J. Power Sources 2011, 196, 8154–8159. [Google Scholar] [CrossRef]
  24. Shangguan, E.; Guo, L.; Li, F.; Wang, Q.; Li, J.; Li, Q.; Chang, Z.; Yuan, X.-Z. FeS anchored reduced graphene oxide nanosheets as advanced anode material with superior high-rate performance for alkaline secondary batteries. J. Power Sources 2016, 327, 187–195. [Google Scholar] [CrossRef]
  25. Shangguan, E.; Li, F.; Li, J.; Chang, Z.; Li, Q.; Yuan, X.-Z.; Wang, H. FeS/C composite as high-performance anode material for alkaline nickel–iron rechargeable batteries. J. Power Sources 2015, 291, 29–39. [Google Scholar] [CrossRef]
  26. Hang, B.T.; Watanabe, T.; Eashira, M.; Watanabe, I.; Okada, S.; Yamaki, J.-I. Comparative Study of Fe2O3-Nanoloaded Carbon and Fe2O3-Nano/Carbon Mixed Composites for Iron-Air Battery Anodes. Electrochem. Solid-State Lett. 2005, 8, A476–A480. [Google Scholar] [CrossRef]
  27. Hang, B.T.; Watanabe, T.; Eashira, M.; Okada, S.; Yamaki, J.-I.; Hata, S.; Yoon, S.-H.; Mochida, I. The electrochemical properties of Fe2O3-loaded carbon electrodes for iron–air battery anodes. J. Power Sources 2005, 150, 261–271. [Google Scholar] [CrossRef]
  28. Hang, B.T.; Eashira, M.; Watanabe, I.; Okada, S.; Yamaki, J.-I.; Yoon, S.-H.; Mochida, I. The effect of carbon species on the properties of Fe/C composite for metal–air battery anode. J. Power Sources 2005, 143, 256–264. [Google Scholar] [CrossRef]
  29. Kao, C.Y.; Chou, K.S. Iron/carbon-black composite nanoparticles as an iron electrode material in a paste type rechargeable alkaline battery. J. Power Sources 2010, 195, 2399–2404. [Google Scholar] [CrossRef]
  30. Kim, T.; Ohata, Y.; Kim, J.; Rhee, C.K.; Miyawaki, J.; Yoon, S.-H. Fe nanoparticle entrained in tubular carbon nanofiber as an effective electrode material for metal–air batteries: A fundamental reason. Carbon 2014, 80, 698–707. [Google Scholar] [CrossRef] [Green Version]
  31. Huang, K.-C.; Chou, K.-S. Microstructure changes to iron nanoparticles during discharge/charge cycles. Electrochem. Commun. 2007, 9, 1907–1912. [Google Scholar] [CrossRef]
  32. Guo, C.X.; Li, C.M. Molecule-confined FeOx nanocrystals mounted on carbon as stable anode material for high energy density nickel-iron batteries. Nano Energy 2017, 42, 166–172. [Google Scholar] [CrossRef]
  33. Wu, X.; Wu, H.B.; Xiong, W.; Le, Z.; Sun, F.; Liu, F.; Chen, J.; Zhu, Z.; Lu, Y. Robust iron nanoparticles with graphitic shells for high-performance Ni-Fe battery. Nano Energy 2016, 30, 217–224. [Google Scholar] [CrossRef]
  34. Paulraj, A.R.; Kiros, Y.; Skårman, B.; Vidarsson, H. Core/Shell Structure Nano-Iron/Iron Carbide Electrodes for Rechargeable Alkaline Iron Batteries. J. Electrochem. Soc. 2017, 164, A1665–A1672. [Google Scholar] [CrossRef] [Green Version]
  35. Chamoun, M.; Skårman, B.; Vidarsson, H.; Smith, R.I.; Hull, S.; Lelis, M.; Milcius, D.; Noréus, D. Stannate Increases Hydrogen Evolution Overpotential on Rechargeable Alkaline Iron Electrodes. J. Electrochem. Soc. 2017, 164, A1251–A1257. [Google Scholar] [CrossRef] [Green Version]
  36. Kiros, Y.; Pirjamali, M.; Bursell, M. Oxygen reduction electrodes for electrolysis in chlor-alkali cells. Electrochim. Acta 2006, 51, 3346–3350. [Google Scholar] [CrossRef]
  37. Pirjamali, M.; Kiros, Y. Effects of carbon pretreatment for oxygen reduction in alkaline electrolyte. J. Power Sources 2002, 109, 446–451. [Google Scholar] [CrossRef]
  38. Svengren, H.; Chamoun, M.; Grins, J.; Johnsson, M. Water Splitting Catalysis Studied by using Real-Time Faradaic Efficiency Obtained through Coupled Electrolysis and Mass Spectrometry. ChemElectroChem 2018, 5, 44–50. [Google Scholar] [CrossRef]
  39. Li, F.; Pan, Y.; Wang, H.; Huang, X.; Zhang, Q.; Peng, Z.; Tang, Y. Core-Bishell Fe-Ni@Fe3O4@C Nanoparticles as an Advanced Anode for Rechargeable Nickel-Iron Battery. J. Electrochem. Soc. 2017, 164, A1333–A1338. [Google Scholar] [CrossRef]
  40. Wang, B.; Liu, T.; Liu, A.; Liu, G.; Wang, L.; Gao, T.; Wang, D.; Zhao, X.S. A Hierarchical Porous C@LiFePO4/Carbon Nanotubes Microsphere Composite for High-Rate Lithium-Ion Batteries: Combined Experimental and Theoretical Study. Adv. Energy Mater. 2016, 6, 1600426. [Google Scholar] [CrossRef]
  41. Li, R.; Wang, Y.; Zhou, C.; Wang, C.; Ba, X.; Li, Y.; Huang, X.; Liu, J. Carbon-Stabilized High-Capacity Ferroferric Oxide Nanorod Array for Flexible Solid-State Alkaline Battery–Supercapacitor Hybrid Device with High Environmental Suitability. Adv. Funct. Mater. 2015, 25, 5384–5394. [Google Scholar] [CrossRef]
  42. Li, F.; Shangguan, E.; Li, J.; Li, L.; Yang, J.; Chang, Z.; Li, Q.; Yuan, X.-Z.; Wang, H. Influence of annealing temperature on the structure and electrochemical performance of the Fe3O4 anode material for alkaline secondary batteries. Electrochim. Acta 2015, 178, 34–44. [Google Scholar] [CrossRef]
  43. Annamalai, A.; Shinde, P.S.; Jeon, T.H.; Lee, H.H.; Kim, H.G.; Choi, W.; Jang, J.S. Fabrication of superior α-Fe2O3 nanorod photoanodes through ex-situ Sn-doping for solar water splitting. Sol. Energy Mater. Sol. Cells 2016, 144, 247–255. [Google Scholar] [CrossRef]
  44. Xie, K.; Lu, Z.; Huang, H.; Lu, W.; Lai, Y.; Li, J.; Zhou, L.; Liu, Y. Iron supported C@Fe3O4 nanotube array: A new type of 3D anode with low-cost for high performance lithium-ion batteries. J. Mater. Chem. 2012, 22, 5560–5567. [Google Scholar] [CrossRef]
  45. Bokobza, L.; Bruneel, J.-L.; Couzi, M. Raman Spectra of Carbon-Based Materials (from Graphite to Carbon Black) and of Some Silicone Composites. C 2015, 1, 77–94. [Google Scholar] [CrossRef]
  46. Wu, K.-H.; Wang, D.-W.; Su, D.-S. An Extension to the Analytical Evaluation of the Oxygen Reduction Reaction Based On the Electrokinetics on a Rotating Ring–Disk Electrode. ChemElectroChem 2016. [Google Scholar] [CrossRef]
  47. Wang, B.; Xie, Y.; Liu, T.; Luo, H.; Wang, B.; Wang, C.; Wang, L.; Wang, D.; Dou, S.; Zhou, Y. LiFePO4 quantum-dots composite synthesized by a general microreactor strategy for ultra-high-rate lithium ion batteries. Nano Energy 2017, 42, 363–372. [Google Scholar] [CrossRef]
  48. Wang, B.; Al Abdulla, W.; Wang, D.; Zhao, X.S. A three-dimensional porous LiFePO4 cathode material modified with a nitrogen-doped graphene aerogel for high-power lithium ion batteries. Energy Environ. Sci. 2015, 8, 869–875. [Google Scholar] [CrossRef]
  49. Hansal, W.E.G.; Halmdienst, M.; Hansal, S.; Boussaboua, I.; Darchen, A. Influence of pulse plating parameters on morphology and hardness of pure tin deposit. Trans. IMF 2008, 86, 115–121. [Google Scholar] [CrossRef]
  50. Bani Hashemi, A.; La Mantia, F. Cell Design for Electrochemical Characterizations of Metal-Ion Batteries in Organic and Aqueous Electrolyte. Anal. Chem. 2016, 88, 7916–7920. [Google Scholar] [CrossRef]
Figure 1. XRD patterns of the (a) CuSn and (b) Sn samples.
Batteries 05 00001 g001
Figure 2. SEM and elemental mapping for samples of CuSn (ac) and Sn (df).
Batteries 05 00001 g002
Figure 3. TEM images of CuSn (a) and Sn (b).
Batteries 05 00001 g003
Figure 4. (ae) XPS spectra and (f) Raman spectrum for the CuSn sample.
Batteries 05 00001 g004
Figure 5. Specific discharge profiles of electrodes at current density of 100 mA g−1.
Batteries 05 00001 g005
Figure 6. Specific charge profiles of electrodes at current density of 200 mA g−1.(inset figure-Potential overshoot along the cycles). (a) CuSn; (b) CuSnCNT; (c) CuSnCNTLi; (d) SnCNT.
Batteries 05 00001 g006
Figure 7. Change in overpotential over cycles (a) Fe reduction overpotential (first plateau); (b) hydrogen evolution overpotential (second plateau); (c) Specific discharge capacity and (d) Charge efficiency of electrodes vs. cycle number.
Batteries 05 00001 g007
Figure 8. Charge efficiency measurements at 5, 10 and 15 mA cm−2 of CuSn (a), CuSnCNT (b), CuSnCNTLi (c) and SnCNT (d).
Batteries 05 00001 g008
Table 1. Electrode details.
ElectrodeSample IDFe loading (mg cm−2)
2 wt. % Cu + 2 wt. % SnCuSn29
2 wt. % Cu + 2 wt. % Sn + 0.1 wt. % CNTCuSnCNT27
2 wt. % Cu + 2 wt. % Sn + 0.1 wt. % CNT + 0.65 M of LiOHCuSnCNTLi27
4 wt. % Sn + 0.1 wt. % CNTSnCNT22
Table 2. XPS intensity ratio.
ElementASF Corrected XPS Peak Intensity
Fe40
Cu1
O95
Sn20
Table 3. Performance characteristics of the electrodes.
Electrode Initial Discharge Capacity (mAh g−1) Initial Charge Efficiency (%)
CuSn43482.6
CuSnCNT47093.0
CuSnCNTLi60391.3
SnCNT37876.7
Table 4. Efficiency comparison.
Sample a   η c h a r g e   ( 5 / 10 / 15   mA   cm 2 ) b   η C E   ( 5 / 10 / 15   mA   cm 2 )
CuSn82/88/87%81/88/88%
CuSnCNT90/92/91%93/92/90%
CuSnCNTLi77/82/86%77/83/88%
SnCNT70/74/78%70/76/80%
a   η charge = Q tot Q H 2 ( g ) Q tot (note: charge efficiency based on the difference between total and H2(g) capacity); b η CE = Q discharge Q charge (note: coulombic efficiency calculated from the potentiostat software).

