


Effects of Current and Ambient Temperature on Thermal Response of Lithium Ion Battery
by
 , and
, and
Shuping Wang
1,†,
Tangqin Wu
2,3,†,
Heng Xie
4,
Changhao Li
1,
Jiaqing Zhang
1,
Lihua Jiang
2 and
Qingsong Wang
2,* 1
State Grid Anhui Electric Power Research Institute, Anhui Province Key Laboratory of Electric Fire and Safety Protection (State Grid Laboratory of Fire Protection for Transmission and Distribution Facilities), Hefei 230601, China
2
State Key Laboratory of Fire Science, University of Science and Technology of China, Hefei 230026, China
3
Anhui Conch Venture New Energy Materials Co., Ltd., Wuhu 241000, China
4
State Grid Anhui Electric Power Co., Ltd., Hefei 230061, China
*
Author to whom correspondence should be addressed.
†
These authors contributed equally to this work.
Batteries 2022, 8(11), 203; https://doi.org/10.3390/batteries8110203
Submission received: 15 July 2022
/
Revised: 11 August 2022
/
Accepted: 19 August 2022
/
Published: 1 November 2022
(This article belongs to the Topic Batteries, Supercapacitors, Fuel Cells and Combined Energy/Power Supply Systems)
Abstract
:Both operating current and ambient temperature have a great impact on heat generation and the available residual capacity of the lithium ion battery. The thermal response of the lithium ion battery is investigated under isothermal conditions. Six currents from 1 A to 6 A, with a 1 A interval, are investigated in order to discuss the effect of current under 25 °C; four temperatures from 10 °C to 55 °C, with a 15 °C interval, are investigated to study the effect of temperature under the current of 2 A. The heat generation rate increases with the current increasing during both the charge and discharge stage, but the charge capacity remains independent of current, while the discharge capacity decreases with increasing current. Heat generation decreases with increasing temperature in both the charge and discharge stage, while charge capacity and discharge capacity increase. with the temperature increasing from 10 °C to 55 °C. Heat generation of per charge/discharge capacity is also discussed, and in most cases, the heat generation of per charge capacity during the constant voltage charge stage is larger than that during the constant current charge stage. Heat generation increases at the expense of available capacity, during the discharge stage.
1. Introduction
The lithium ion battery is one kind of environmentally friendly electric power carrier, which is widely used in daily life. It is also a good choice of power source for the electric vehicle (EV) and hybrid electrical vehicle (HEV), with its benefits of high theoretical capacity and long life span. Many governments have listed a deadline for the ban of fossil-fuel-powered vehicles, and this has led to a huge increase in EVs. However, limited electric power capacity and safety issues impede the promotion of EV, which is related to the lithium ion battery. As a power source with complicated internal electrochemical reactions, the available residual capacity and heat generation of the lithium ion battery is influenced by ambient temperature [1,2]. Under low temperature, the lithium ion battery shows a larger internal resistance and less available residual capacity, leading to the shrinkage of the battery’s available voltage range, and strongly affecting the charge and discharge acceptance [3,4,5]. At high temperature, the lithium ion battery suffers from ageing problems, which may further trigger safety risks [3,6,7]. Battery temperature depends not only on the environment temperature, but also on internal heat generation during operation [4,5]. Consequently, the heat generation of the lithium ion battery during the charging and discharging process needs to be analyzed in detail, so as to guarantee the accuracy of battery temperature management, which is essential for improving lifespan and maintaining safety [8]. Heat generation was directly related to current and working temperature [8,9]. Bandhauer et al. [8] found that total heat generation is a strong function of current, temperature, depth of discharge (DOD), and that the heat generation rate was shown to increases with both increasing current and decreasing temperature. Du et al. [10] found polarization heat production is the dominating factor of irreversible heat production, which increases rapidly as the discharge rate increases. Reversible heat production dominates at low-rates, and irreversible production dominates at a high-rate [11,12,13]. Irreversible heat is related to over-potential, which is due to ohmic losses, charge transfer resistance, and mass transfer limitations. Reversible heat is related to the entropic temperature coefficient. Temperature variation inside the battery leads to uneven temperature distribution, which leads to inconsistent charge/discharge behavior within the battery and pack [14]. In their research, Zhang et al. [15] identified the safety temperature limits of Li-ion batteries as −10 to 50 °C. Lu et al. [16] stated that Li-ion batteries are adversely affected when the ambient temperature is outside the range of 0 to 60 °C. Choi et al. [17] claimed that the ideal operating temperature of lithium ion batteries was between 20 and 30 °C. Yan et al. [18,19] investigated the thermal performance of phase change material (PCM) based battery management system (BMS) in dynamic cycling by using both experimental [18] and numerical [19] methods, and found that the phase change temperature of 45 °C is the best for BMS. Common thermal issues related to lithium ion batteries include capacity or power fade, self-discharge, thermal runaway, electrical inconsistency of the battery pack and poor cold temperature performance [20].The battery performance was also significantly affected by temperature variation within the battery module [21,22]. Battery capacity and power capability will generally rapidly decline when repeatedly cycled or soaked at a temperature higher than 50 °C [23,24,25,26]. The discharge specific capacity decreases linearly with the discharge rate and operating temperature [9]. The way to keep uniformity of the battery operating temperature is to increase heat dissipation, and decrease heat generation.
In this research, the effects of operating current and ambient temperatures on heat generation, and available residual capacity, are studied. Several currents are taken to study the effect of current on the battery’s performance, and heat generation under isothermal condition of 25 °C, and several temperatures are taken to study the effect of temperature on the battery’s performance and heat generation, with its working current of 2 A. The relationship between battery performance and heat generation is also discussed to find the mechanism of heat generation and available residual capacity.
The temperature difference between internal core and surface of the battery is directly proportional to the heat release rate, which causes a recording of heat generation lower than the real value, because of heat loss absorbed by the battery itself. Therefore, the lithium ion power battery used in EV needs a reliable, thermal management system, which maintains all batteries with minimum temperature differences. Temperature monitoring and uniformity of the battery module are very important for the safety and long running capacity. A battery management system (BMS) is added to manage the battery, which includes temperature, SOC, and SOH, etc. Study of heat generation and the available capacity under different conditions is of great significance for the design of BMS.
2. Results and Discussion
The heat generation rate, available capacity, operating current, working voltage, and ambient temperature were recorded by an isothermal battery calorimeter (IBC, THT Inc., Bletchley, UK) and a charge/discharge cycler, respectively. Figure 1 shows two cases with a 1 A and 5 A operating current under 25 °C ambient temperature, while the heat generation rate is not monotonous during both discharge and charge stage of the 1 A case. The maximum value of the heat generation rate during the charge stage occurs at the end of the constant current (CC) charge of the 5 A case, while the maximum heat generation rate occurs during the middle stage of CC charge, in the 1 A case. The maximum heat generation rate during the discharge stage occurs at the end of discharge, which is found in both 1 A and 5 A cases. The result means that the internal mechanism of heat generation is different under high current and low current. In all tests, a voltage drop is found at the beginning of discharge, and a voltage regen is found at the end of discharge. Both voltage drop and voltage regen are related to the internal resistance; voltage drop is also called over-potential.
The operating current is zero during the rest period after the discharge stage, but the heat generation rate remains at a high value, as experimental results shown. The released heat during the rest period is the absorbed heat stored in the battery. The absorbed heat would totally release during the rest period; the same phenomenon is also observed in another author’s paper [3,27], a phenomenon which is called residual heat generation. Equation (1) shows that the heat generation rate can be divided into four terms: for the first term, heat generation increases linearly with the square of current; for the second term, heat generation increase linearly as the current; and for the third and fourth terms, heat generation shows little relationship with operating currents. The irreversible heat generation rate is a function of current squared, whereas reversible heat generation rate is a linear function of current [28], as shown in Equation (2). The increasing operating current causes a corresponding increase in the proportion of irreversible heat generation. The third and fourth terms of Equation (1) can be neglected when the first and second term is large enough. The low value of irreversible and reversible heat makes the chemical and mixing heat non-negligible; this may be the reason why the heat generation rate curve of the 1 A and 2 A cases are complicated.
2.1. Effects of Current on Thermal Response
Six different currents, from 1 A to 6 A, with a 1 A interval, are used to test the effect of current on thermal response, during both the charge and discharge stage. The isothermal temperature is 25 °C, which keeps the surface temperature of the tested battery at 25 ± 0.1 °C level.
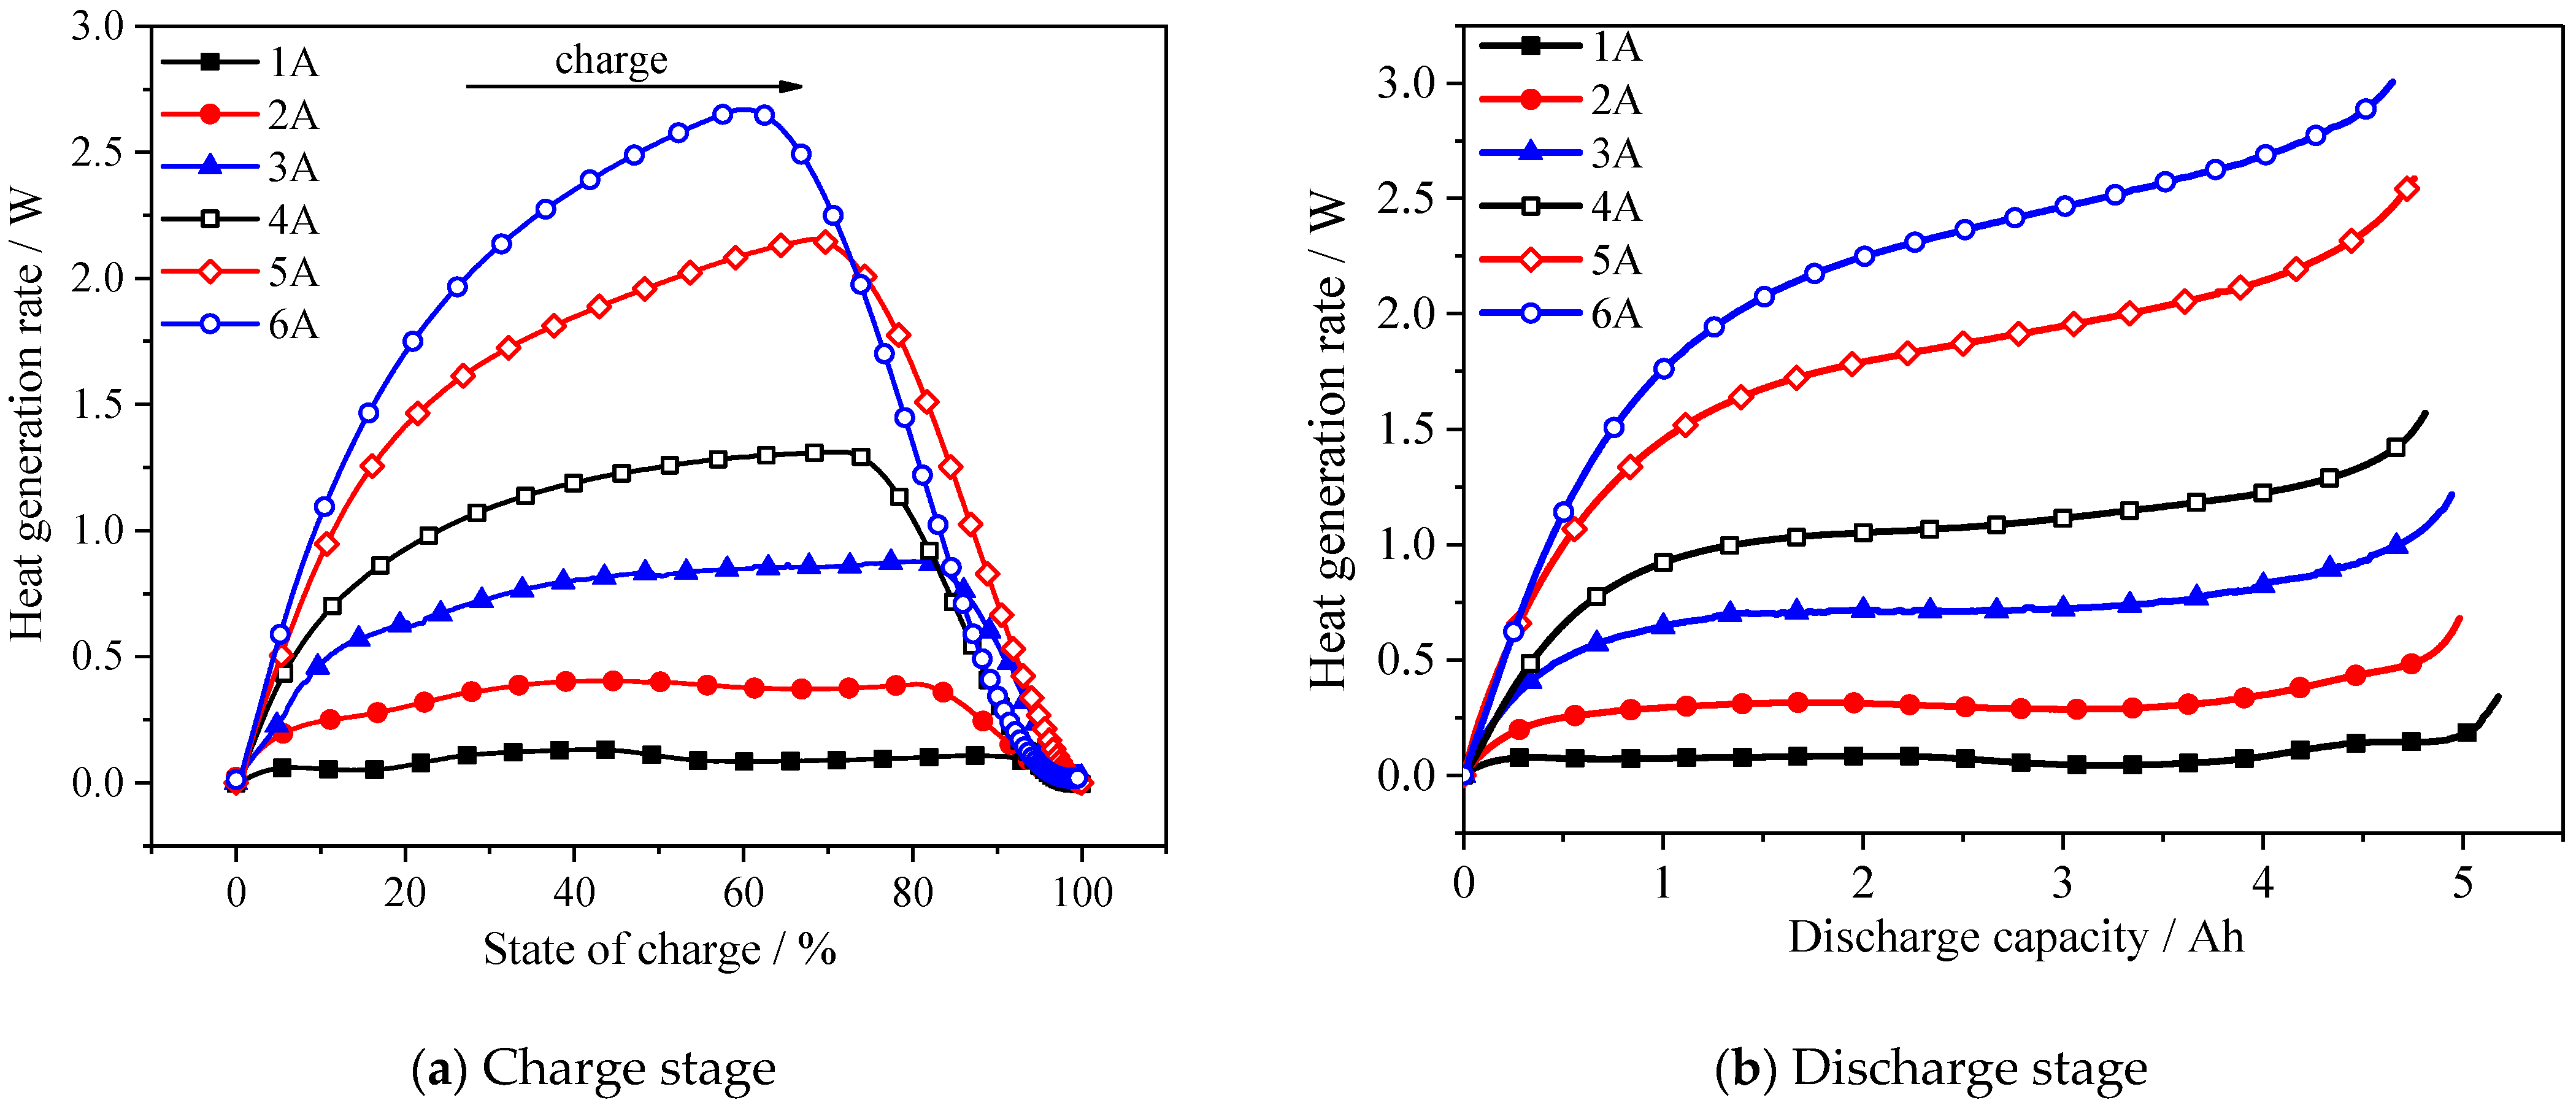
Figure 2a shows the heat generation rates of six different charge currents at 25 °C as a function of state of charge (SOC) during the charge stage. The maximum heat generation rates during the charge stage are 0.131 W, 0.392 W, 0.878 W, 1.311 W, 2.154 W, and 2.669 W, for 1 A, 2 A, 3 A, 4 A, 5 A, and 6 A cases, respectively. The heat generation rates can be divided into two stages of 5 A and 6 A cases, when the curve has a peak, while the heat generation rates show a plateau during the middle of charge at the 3 A and 4 A cases. The heat generation rates during 1 A and 2 A cases are more complicated, with several peaks in the middle of the charge stage. Figure 2b shows the measured heat generation rates of the battery for six tested discharge currents at 25 °C, as a function of DOD (varying from 0 to 1) during the discharge stage. The maximum heat generation rates during the discharge stage are 0.342 W, 0.682 W, 1.216 W, 1.573 W, 2.586 W, and 3.005 W, for 1 A, 2 A, 3 A, 4 A, 5 A, and 6 A cases, respectively. The heat generation rate increases as the DOD increasing for the 5 A and 6 A cases, while a plateau is found during the middle discharge stage of the 3 A and 4 A cases; it was found that the heat generation rates in the 1 A and 2 A cases were complicated with several peaks.
Figure 3 shows heat generations during the charge stage of CC, CV, and the total charge stage changing as the charge currents increase; the contribution of heat generation during the CV stage is shown. Heat generation is calculated by using the heat generation rate integral over time. Heat generation during the CV charge stage is linear, increasing from 0.075 kJ to 3.12 kJ as the charge current increases. The total heat generation during the charge stage increases as the current increases from 1 A to 5 A, while heat generation in the 6 A case is lower than heat generation in the 5 A case. The charge time for 6 A is less than that of the 5 A case, which dilutes the effect of current on the heat generation rate. Figure 4 also shows that the contribution of heat generation during the CV charge stage increases as the charge current increases. The contribution of heat generation during the CV stage is more than 50% during the 6 A case.
Both total heat generation and residual heat generation increase as discharge current, and the contribution of residual heat generation is just 5~6% under the 1 A and 2 A cases, while the value increases to 20% during the 6 A case. This means that as current increases, the heat absorbed by the battery itself is also increasing, which would take more than 1/5 of the total heat generation. The absorbed heat would make a large temperature gradient during battery operation, which causes inhomogeneity and safety problems.
Figure 5 shows the relationship between the charge capacity and charge current during CC, CV, and the total charge stage, respectively. The charge capacities for the six cases are 4.77, 4.41, 4.15, 3.47, 3.46, and 2.78 Ah during the CC charge stage, and 0.34, 0.57, 1.02, 1.41, 1.71. and 2.02 Ah during the CV charge stage, which means that charge capacity during the CC charge stage decreases as current increases, while the charge capacity during the CV charge stage has an opposite tendency. Total charge capacities are 5.11, 4.98, 5.17, 4.88, 5.17, and 4.80 Ah during the total charge stage, which operates independently of the charge currents, as all the cases have the same cutoff current of 40 mA. During the 6 A case, the contribution of charge capacity during the CV stage takes more than 40%, which means the CV stage plays an important role in charge capacity during large current charge cases.
The discharge capacities are 5.18, 4.98, 4.94, 4.81, 4.76, and 4.66 Ah for the six current cases, respectively (Figure 6). The discharge capacity is 103.6% during the 1 A case, and discharge capacity retains only 93.2% during the 6 A case. The discharge capacity decreases as the discharge capacity increases, which is caused by internal resistance. As the current increases, the initial voltage drop increases, making the available voltage range narrow, and causing less discharge capacity. Heat generation increases as the discharge current increases, which means more energy power transferring into thermal energy during large current cases.
2.2. Effects of Temperature on Thermal Response
Figure 7a shows the heat generation rates of four temperatures under operating current of 2 A, as a function of SOC during the charge stage. The heat generation rate of the 10 °C case is different from the other three cases, and the heat generation rate curve has only one peak at 10 °C, while other curves have more than two peaks and two valleys. The maximum heat generation rates during the charge stage are 0.415 W, 0.403 W, 0.375 W, and 0.367 W, for 10 °C, 25 °C, 40 °C, and 55 °C cases, respectively. Figure 7b shows the heat generation rates as a function of DOD during the discharge stage. The heat generation rate curve is not monotonously increasing as the DOD increases; this phenomenon is more significant under 25 °C, 40 °C, and 55 °C cases, in which the valley between DOD from 0.5 to 0.8 is obvious. As the temperature increases, the valley is more significant. In 10 °C cases, the valley is negligible. The maximum heat generation rates during the discharge stage are 0.811 W, 0.0.681 W, 0.564 W, and 0.525 W, for 10 °C, 25 °C, 40 °C, and 55 °C cases, respectively. This phenomenon shows that the mechanism of heat generation at the 10 °C case is different from 25 °C, 40 °C, and 55 °C cases.
The heat generation rate curve increases during the CC charge stage and CC discharge stage at 10 °C, while the heat generation rate curve is more complicated during the other three cases. This phenomenon is caused by the internal resistance. Internal resistance (IR) was affected by both temperature and SOC. At a low temperature case, the effect of SOC on IR is negligible, and the effect of SOC on IR is significant at normal temperatures (25 °C, 40 °C, and 55 °C). This causes different heat generation rate curves during the CC charge and CC discharge stage.
Figure 8 shows that the total heat generation decreases as the ambient temperature increases, during both the charge and discharge stage. Heat generation during both charge and discharge stages decreases as temperature increases, which shows the opposite effect of Equation (2). The entropic heat increases as temperature increases, which is not same as the other results. The internal resistance is also changing, as is the temperature, because of the battery’s chemical characteristics.
Figure 9a shows the relationship between the charge capacity and ambient temperature during CC, CV, and the total charge stage, respectively. The charge capacity for different ambient temperatures are 3.91, 4.21, 4.50, and 4.64 Ah, during the CC charge stage, and 0.61, 0.57, 0.47, and 0.46 Ah, during the CV charge stage. The results show that the charge capacity during the CC charge stage increases as ambient temperature increases, while the charge capacity during the CV charge stage decreases as ambient temperature increases. The total charge capacities are 4.52, 4.78, 4.97, and 5.10 Ah, for 10, 25, 40, and 55 °C, respectively. This result means that the storage of electric power increases with ambient temperature increasing from 10 °C to 55 °C. As the temperature increases, the contribution of the CC charge capacity increases from 86.5% to 91.0%, which means the CC charge stage becomes more effective during high temperatures. Figure 9b shows the heat generation during the charge stage of CC, CV, and the total charge stage changing as the ambient temperature increases. The heat generations are 2.488, 2.453, 2.425, and 2.342 kJ, during the CC charge stage, and 0.455, 0.447, 0.447, and 0.357 kJ, during the CV charge stage, with the charge current of 2 A for 10 °C, 25 °C, 40 °C, and 55 °C, respectively. As temperature increases, the contribution of heat generation during the CC charge stage increases from 84.5% to 86.8%. The total heat generations during the charge stage are 2.944, 2.900, 2.872, and 2.699 kJ, for 10 °C, 25 °C, 40 °C, and 55 °C. Heat generation during the charge stage decreases as the ambient temperature increases, under the operating current of 2 A.
Figure 10 shows the relationship between charge capacities and ambient temperature during the discharge stage. The total discharge capacity increases as temperature increases, while heat generation decreases. Residual heat takes about 7~12% of the total heat under 2 A cases, with the temperature under 10 °C to 55 °C. The results show the effect of temperature on available capacity is important, while the effect of temperature on heat generation is less than the effect of current.
2.3. Relationship between Heat Generation and Capacity Variation
During the charge stage, heat generation and capacity are all from an external source, while during discharge stage heat generation and available capacity are all from battery’s stored energy. The available capacity and heat generation during the discharge stage were shown as follows.
Figure 11 shows heat generation of per available capacity changing as discharge current. The heat generation of per available capacity during the CV stage is larger than that during the CC stage. The heat generation of per available capacity is 0.3 kJ/Ah during the 1 A charge case, which increases to 1.2 kJ/Ah during the 6 A charge case. The result shows that the quick charge is not safe because of a large amount of heat generation, which needs to find a new material in order to decrease the internal resistance to solve the heat generation problem. The heat generation of per available capacity is 0.332 kJ/Ah during the 1 A discharge case, which increases to 1.605 kJ/Ah during the 6 A discharge case. The large current charge and discharge current makes heat generation approximately linear in growth, and increases the internal temperature gradient during battery operation, which may accelerate battery ageing.
Figure 12 shows heat generation for per capacity changing as ambient temperatures increase under the operating current of 2 A. Heat generation of per available capacity during the CV stage is also larger than that during the CC stage. Heat generation for per charge capacity during both the charge stage and discharge stage decreases as temperature increases.
The results show that the heat generation increases with both increasing rate and decreasing temperature for NCM batteries, which is similar to LFP batteries [8], while the discharge capacity was shown to increase with both increasing rate and decreasing temperature for NCM batteries, which is different to LFP batteries, where the discharge capacity decreases linearly as cell operating temperature [9]. The discharge capacity is related to the voltage drop, which is caused by internal resistance, while heat generation is also related to internal resistance.
2.4. Internal Resistance
Internal resistance (IR) is a key factor influencing heat generation and available capacity, under different cases. IR is linearly related to voltage drop under the discharge stage. The voltage drop increases as operating currents increase, which makes the available voltage range narrow and causes less discharge capacity under high operating current.
Figure 13 shows the direct current resistance (DCR) measured by HPPC. The IR increases as the SOC decreases during the discharge stage, which creates more heat generation and less available discharge capacity.
Figure 14a shows that the IR under 100% SOC decreases from 60.6 mΩ under 25 °C to 49.6 mΩ under 55 °C, which causes the available broad voltage range under high temperature, causing less heat generation and more available capacity. Figure 14b shows the IR impedance under three different ambient temperatures. The results show that the IR decreases as temperature increases from 25 °C to 55 °C, as the charge transfer impedance and diffusion impedance are lower under high temperature.
3. Materials and Methods
3.1. Experimental
The Commercial 26,650 battery (Infor Battery Inc., Shenzhen China) of 5 Ah was used to study the effect of temperature and current on heat generation during different isothermal conditions. The cathode and anode materials are nickel-cobalt-manganese-oxide (NCM) and graphite, respectively. The available voltage range of the tested battery was from 2.75 V to 4.2 V, and the applicable temperature ranges from −20 °C to 55 °C, due to the specification of battery. The isothermal environmental was provided by the Isothermal Battery Calorimeter (IBC, THT Inc., Bletchley, UK), which could be used for in situ measurement of the heat generation rate of the battery during the charge or discharge stage, from −10 °C to 80 °C. Effects of both current and temperature on the battery characteristic were taken into account. Four experiments, with temperatures from 10 °C to 55 °C, with a 15 °C interval, were considered to study the effect of temperature on available capacity and heat generation of the lithium ion battery. Six operating currents, from 1 A to 6 A, with a 1 A interval, were used to study the effect of current on available capacity and heat generation under an isothermal ambient temperature of 25 °C. Prior to the experimental measurements, two charge and discharge cycles with 0.2 C (1 A) were performed on the tested batteries using a charge-discharge cycler (Neware Inc., Shenzhen China) under 25 °C, and the batteries were discharged to 0% SOC before testing. The charge stage was a constant current I with the cutoff voltage of 4.2 V, and a constant voltage 4.2 V with the cutoff current of 40 mA (CC-CV charge). The discharge stage was a constant current I with the cutoff voltage of 2.75 V (CC discharge). To analyze the mechanism of temperature on heat generation and available capacity, tests of internal resistance were added. A fully charged fresh cell was used to study the effect of temperature on direct-current resistance (DCR) by using the Hybrid Pulse Power Characteristic (HPPC) method. The battery was heated in an oven from 25 °C to 55 °C, with the internal resistance recorded every 5 min. A fully charged fresh cell was used to study the alternating-current (AC) impedance, which was put into the oven. The AC-impedance was recorded at three temperatures of 25 °C, 40 °C, and 55 °C.
3.2. Theoretical Analysis of Heat Generation
Electric energy turns into chemical energy stored in the battery during charge, and the stored chemical energy turns into electric energy during discharge for providing power. Heat generation is inevitable during both the charge and discharge stage. Heat generation can be divided into four parts, and it can be written by:
The first term, on right side, is the heat generated from resistive dissipation, which is called irreversible heat, and always positive. The second term is the entropic heat, which is reversible heat, and remains exothermic during discharge and endothermic during charge. The third term represents the heat produced, or consumed, by any chemical reaction. The last term accounts for the heat of mixing [29]. The reversible heat source term is of the same order of magnitude as the irreversible term [30]. Compared to the first and second terms, the third and last terms can be neglected under normal operating, and the following simplified expression of the heat generation rate is given as follows [8,29].
where I means operating current, and it is positive during discharge and negative during charge, U means the open voltage, V means the operating voltage, T represents ambient temperature, and represents voltage temperature coefficient. The over-potential of the battery is crucial to the internal heat generation during charge and discharge, which is showed in Equation (3), and can be showed as the multiplication of operating current I and internal resistance R. The internal resistance is the overall resistance of the battery, including joule resistance, polarizable resistance, and contact resistance. The equation of heat generation rate can be simplified as Equation (4). If both internal resistance and voltage temperature coefficient were assumed as a function of temperature, the heat generation rate is a quadratic function of the current under isothermal condition. The effect of temperature on heat generation is more complicated, because both internal resistance and the voltage temperature coefficient were changed as temperature changed.
Greater increase in direct current (DC) resistance after 50 °C storage is mainly caused by an increase in the solution resistance, and degradation of the electrolyte [31]. In addition to ohmic loss, the loss due to surface kinetics becomes important at a low temperature regime [30]. Resistance due to both surface phenomena and concentration limitation are also significant in a high rate regime [32].
As Equation (3) shows, the over-potential will increase as the operating current increases. The voltage temperature coefficient is shown in the reversible term of heat generation. Forgez et al. [29] found the voltage temperature coefficient is negative up to SOC 35%, and becomes positive for higher SOC values with the positive electrode of LiFePO4 (LFP). Doris et al. [33] concluded that cell potential increases for LFP and decreases for LiCoO2 (LCO), with an increase in temperature.
4. Conclusions
This work reveals the relationship between the operating current and ambient temperature on the heat generation and available capacity of the Commercial 26,650 cylinder cell. The heat generation rate under isothermal condition changes as a function of temperature and operating current. Heat generation increases during both the charge and discharge stage as the operating current increases under the same temperature, which would increase linearly as square of the operating current, because of resistive dissipation. Heat generation increases as the operating temperature decreases under same current, because the higher temperature makes lower internal resistance. Available capacity is a function of temperature and operating current. The discharge capacity increases as the operating temperature increases from 10 °C to 55 °C, and decreases as the operating current increasing from 1 A to 6 A, as the available voltage range is related to internal resistance and current. Total energy during the discharge stage, of both discharge capacity and heat generation, are all translated from the electric power stored in batteries, which makes the discharge capacity and heat generation have an opposite effect as the current or temperature changes. During the charge stage, both heat generation and charge capacity come from the external power source, and the relationship between heat generation and charge capacity is not strong. However, the variation of internal resistance may be the reason why heat generation and available capacity changes with the temperature. In addition, heat generation is closely related to the safety of the lithium ion battery; therefore, the quantitative relationship between heat generation and discharge capacity, as well as the aging mechanism of the battery under high temperature, will be investigated in our next work.
Author Contributions
Conceptualization, S.W. and Q.W.; data curation, T.W.; funding acquisition, H.X.; investigation, S.W., T.W. and L.J.; project administration, H.X., C.L. and J.Z.; supervision, Q.W.; writing—original draft, T.W. All authors have read and agreed to the published version of the manuscript.
Funding
This work was supported by the Science and Technology Project of State Grid Corporation of China (Development of high-performance special extinguishing agent for lithium-ion battery fire, No. 521205220021).
Institutional Review Board Statement
Not applicable.
Informed Consent Statement
Not applicable.
Data Availability Statement
All collected data are presented in the manuscript.
Conflicts of Interest
The authors declare no conflict of interest.
References
- Balakrishnan, P.; Ramesh, R.; Kumar, T.P. Safety mechanisms in lithium-ion batteries. J. Power Sources 2006, 155, 401–414. [Google Scholar] [CrossRef]
- Kumaresan, K.; Sikha, G.; White, R.E. Thermal model for a Li-ion cell. J. Electrochem. Soc. 2008, 155, A164–A171. [Google Scholar] [CrossRef]
- Liu, G.; Ouyang, M.; Lu, L.; Li, J.; Han, X. Analysis of the heat generation of lithium-ion battery during charging and dis-charging considering different influencing factors. J. Therm. Anal. Calorim. 2014, 116, 1001–1010. [Google Scholar] [CrossRef]
- Yang, K.; An, J.J.; Chen, S. Temperature characterization analysis of LiFePO4/C power battery during charging and dis-charging. J. Therm. Anal. Calorim. 2010, 99, 515–521. [Google Scholar] [CrossRef]
- Fang, K.; Chen, S.; Mu, D.; Liu, J.; Zhang, W. The heat generation rate of nickel-metal hydride battery during charg-ing/discharging. J. Therm. Anal. Calorim. 2013, 112, 977–981. [Google Scholar] [CrossRef]
- Lu, T.-Y.; Chiang, C.-C.; Wu, S.-H.; Chen, K.-C.; Lin, S.-J.; Wen, C.-Y.; Shu, C.-M. Thermal hazard evaluations of 18650 lithium-ion batteries by an adiabatic calorimeter. J. Therm. Anal. 2013, 114, 1083–1088. [Google Scholar] [CrossRef]
- Lu, L.; Han, X.; Li, J.; Hua, J.; Ouyang, M. A review on the key issues for lithium-ion battery management in electric vehi-cles. J. Power Sources 2013, 226, 272–288. [Google Scholar] [CrossRef]
- Bandhauer, T.M.; Garimella, S.; Fuller, T.F. Temperature-dependent electrochemical heat generation in a commercial lithium-ion battery. J. Power Sources 2014, 247, 618–628. [Google Scholar] [CrossRef]
- Song, L.; Li, X.; Wang, Z.; Guo, H.; Xiao, Z.; Zhang, F.; Peng, S. Thermal behaviors study of LiFePO 4 cell by electrochemi-cal-calorimetric method. Electrochim. Acta 2013, 90, 461–467. [Google Scholar] [CrossRef]
- Du, S.; Lai, Y.; Ai, L.; Ai, L.; Cheng, Y.; Tang, Y.; Jia, M. An investigation of irreversible heat generation in lithium ion bat-teries based on a thermo-electrochemical coupling method. Appl. Therm. Eng. 2017, 121, 501–510. [Google Scholar] [CrossRef]
- Du, S.; Jia, M.; Cheng, Y.; Tang, Y.; Zhang, H.; Ai, L.; Zhang, K.; Lai, Y. Study on the thermal behaviors of power lithium iron phosphate (LFP) aluminum-laminated battery with different tab configurations. Int. J. Therm. Sci. 2015, 89, 327–336. [Google Scholar] [CrossRef]
- Jeon, D.H.; Baek, S.M. Thermal modeling of cylindrical lithium ion battery during discharge cycle. Energy Convers. Manag. 2011, 52, 2973–2981. [Google Scholar] [CrossRef]
- Jiang, F.; Peng, P.; Sun, Y. Thermal analyses of LiFePO4/graphite battery discharge processes. J. Power Sources 2013, 243, 181–194. [Google Scholar] [CrossRef]
- Markel, T.; Zolot, M.; Wipke, K.B.; Pesaran, A.A. Proceedings of the Advanced Automotive Battery Conference, Las Vegas, NV, USA, 5–8 February 2001.
- Zhang, X.; Kong, X.; Li, G.; Li, J. Thermodynamic assessment of active cooling/heating methods for lithium-ion batter-ies of electric vehicles in extreme conditions. Energy 2014, 64, 1092–1101. [Google Scholar] [CrossRef]
- Al Hallaj, S.; Maleki, H.; Hong, J.; Selman, J. Thermal modeling and design considerations of lithium-ion batteries. J. Power Sources 1999, 83, 1–8. [Google Scholar] [CrossRef]
- Choi, S.S.; Lim, H.S. Factors that affect cycle-life and possible degradation mechanisms of a Li-ion cell based on LiCoO2. J. Power Sources 2002, 111, 130–136. [Google Scholar] [CrossRef]
- Yan, J.; Li, K.; Chen, H.; Wang, Q.; Sun, J. Experimental study on the application of phase change material in the dynamic cycling of battery pack system. Energy Convers. Manag. 2016, 128, 12–19. [Google Scholar] [CrossRef]
- Yan, J.; Wang, Q.; Li, K.; Sun, J. Numerical study on the thermal performance of a composite board in battery thermal management system. Appl. Therm. Eng. 2016, 106, 131–140. [Google Scholar] [CrossRef]
- Alavi-Soltani, S.; Ravigururajan, T.; Rezac, M. Thermal Issues in Lithium-Ion Batteries, in: ASME 2006 International Mechanical Engineering Congress and Exposition. Am. Soc. Mech. Eng. 2006, 10, 383–395. [Google Scholar]
- Ismail, N.H.F.; Toha, S.F.; Azubir, N.A.M.; Ishak, N.H.M.; Hassan, I.D.M.K.; Ibrahim, B.S.K. Simplified heat generation model for lithium ion battery used in electric vehicle. In Proceedings of the IOP Conference Series: Materials Science and Engineering, Bandung, Indonesia, 9–13 March 2013; p. 012014. [Google Scholar] [CrossRef]
- Karimi, G.; Li, X. Thermal management of lithium-ion batteries for electric vehicles. Int. J. Energy Res. 2012, 37, 13–24. [Google Scholar] [CrossRef]
- Ramadass, P.; Haran, B.; White, R.; Popov, B.N. Capacity fade of Sony 18650 cells cycled at elevated temperatures: Part I. Cycling performance. J. Power Sources 2002, 112, 606–613. [Google Scholar] [CrossRef] [Green Version]
- Ramadass, P.; Haran, B.; White, R.; Popov, B.N. Capacity fade of Sony 18650 cells cycled at elevated temperatures: Part II. Capacity fade analysis. J. Power Sources 2002, 112, 614–620. [Google Scholar] [CrossRef] [Green Version]
- Amine, K.; Liu, J.; Belharouak, I. High-temperature storage and cycling of C-LiFePO4/graphite Li-ion cells. Electrochem. Commun. 2005, 7, 669–673. [Google Scholar] [CrossRef]
- Liu, P.; Wang, J.; Hicks-Garner, J.; Sherman, E.; Soukiazian, S.; Verbrugge, M.; Tataria, H.; Musser, J.; Finamore, P. Aging mechanisms of LiFePO4 batteries deduced by electrochemical and structural analyses. J. Electrochem. Soc. 2010, 157, A499–A507. [Google Scholar] [CrossRef]
- Chen, K.; Unsworth, G.; Li, X. Measurements of heat generation in prismatic Li-ion batteries. J. Power Sources 2014, 261, 28–37. [Google Scholar] [CrossRef]
- Bernardi, D.M.; Pawlikowski, E.M.; Newman, J. A General Energy Balance for Battery Systems. J. Electrochem. Soc. 1985, 132, 5–12. [Google Scholar] [CrossRef] [Green Version]
- Forgez, C.; Do, D.V.; Friedrich, G.; Morcrette, M.; Delacourt, C. Thermal modeling of a cylindrical LiFePO4/graphite lithium-ion battery. J. Power Sources 2010, 195, 2961–2968. [Google Scholar] [CrossRef]
- Thomas, K.E.; Newman, J. Thermal Modeling of Porous Insertion Electrodes. J. Electrochem. Soc. 2003, 150, A176–A192. [Google Scholar] [CrossRef]
- Saito, Y.; Shikano, M.; Kobayashi, H. Heat generation behavior during charging and discharging of lithium-ion batteries after long-time storage. J. Power Sources 2013, 244, 294–299. [Google Scholar] [CrossRef]
- Gao, L.; Liu, S.; Dougal, R.A. Dynamic lithium-ion battery model for system simulation. IEEE Trans. Compon. Packag. Technol. 2002, 25, 495–505. [Google Scholar]
- Britton, D.L.; Miller, T.B.; Bennett, W.R. Thermal Characterization Study of Lithium-Ion Cells. In Proceedings of the 10th Electrochemical Power Sources Symposium, Williamsburg, VA, USA, 20–23 August 2007. [Google Scholar]
Figure 1.
The functions of heat generation rate, operating current, and voltage changing with time, increasing under 25 °C.
Figure 1.
The functions of heat generation rate, operating current, and voltage changing with time, increasing under 25 °C.

Figure 2.
Effect of operating current on the heat generation rate during the charge and discharge stage of a NCM battery, at isothermal ambient temperature of 25 °C.
Figure 2.
Effect of operating current on the heat generation rate during the charge and discharge stage of a NCM battery, at isothermal ambient temperature of 25 °C.

Figure 3.
Effect of operating current on heat generation during the charge stage.

Figure 4.
Effect of operating current on heat generation during the discharge stage.

Figure 5.
Effect of operating current on charge capacity.

Figure 6.
Effect of operating current on discharge capacity.

Figure 7.
Effect of temperature on the heat generation rate during the charge and discharge stage of a NCM battery, under the same charge and discharge current of 2 A.
Figure 7.
Effect of temperature on the heat generation rate during the charge and discharge stage of a NCM battery, under the same charge and discharge current of 2 A.

Figure 8.
Heat generation curve changing with temperature under the operating current of 2 A.

Figure 9.
Effect of ambient temperature on the battery during the charge stage.

Figure 10.
Effect of ambient temperature on the battery during the discharge stage.

Figure 11.
Heat generation of per available capacity change as operating currents increase under an isothermal environment of 25 °C.
Figure 11.
Heat generation of per available capacity change as operating currents increase under an isothermal environment of 25 °C.

Figure 12.
Heat generation for per capacity changing as ambient temperatures increase under the operating current of 2 A.
Figure 12.
Heat generation for per capacity changing as ambient temperatures increase under the operating current of 2 A.

Figure 13.
Internal resistance measured by hybrid pulse power characteristic (HPPC), under different ambient temperatures.
Figure 13.
Internal resistance measured by hybrid pulse power characteristic (HPPC), under different ambient temperatures.

Figure 14.
IR measured by electrochemical impedance spectroscopy (EIS) and HPPC (100% SOC), under different temperatures.
Figure 14.
IR measured by electrochemical impedance spectroscopy (EIS) and HPPC (100% SOC), under different temperatures.

Publisher’s Note: MDPI stays neutral with regard to jurisdictional claims in published maps and institutional affiliations. |
© 2022 by the authors. Licensee MDPI, Basel, Switzerland. This article is an open access article distributed under the terms and conditions of the Creative Commons Attribution (CC BY) license (https://creativecommons.org/licenses/by/4.0/).
Share and Cite
MDPI and ACS Style
Wang, S.; Wu, T.; Xie, H.; Li, C.; Zhang, J.; Jiang, L.; Wang, Q. Effects of Current and Ambient Temperature on Thermal Response of Lithium Ion Battery. Batteries 2022, 8, 203. https://doi.org/10.3390/batteries8110203
AMA Style
Wang S, Wu T, Xie H, Li C, Zhang J, Jiang L, Wang Q. Effects of Current and Ambient Temperature on Thermal Response of Lithium Ion Battery. Batteries. 2022; 8(11):203. https://doi.org/10.3390/batteries8110203
Chicago/Turabian StyleWang, Shuping, Tangqin Wu, Heng Xie, Changhao Li, Jiaqing Zhang, Lihua Jiang, and Qingsong Wang. 2022. "Effects of Current and Ambient Temperature on Thermal Response of Lithium Ion Battery" Batteries 8, no. 11: 203. https://doi.org/10.3390/batteries8110203
Note that from the first issue of 2016, this journal uses article numbers instead of page numbers. See further details here.