


An Experimentally Parameterized Equivalent Circuit Model of a Solid-State Lithium-Sulfur Battery
by
 ,
,
Timothy Cleary
1,*,
Zahra Nozarijouybari
2,
Daiwei Wang
1,
Donghai Wang
1,
Christopher Rahn
1 and
Hosam K. Fathy
2 1
Department of Mechanical Engineering, The Pennsylvania State University, University Park, PA 16801, USA
2
Department of Mechanical Engineering, The University of Maryland, College Park, MD 20742, USA
*
Author to whom correspondence should be addressed.
Batteries 2022, 8(12), 269; https://doi.org/10.3390/batteries8120269
Submission received: 19 October 2022
/
Revised: 22 November 2022
/
Accepted: 27 November 2022
/
Published: 3 December 2022
(This article belongs to the Special Issue Feature Papers to Celebrate the First Impact Factor of Batteries)
Abstract
:This paper presents and parameterizes an equivalent circuit model of an all-solid-state lithium-sulfur battery cell, filling a gap in the literature associated with low computational intensity models suitable for embedded battery management applications. The paper addresses this gap by parameterizing a three-state equivalent circuit model using experimental pulse power characterization data from a laboratory-fabricated lithium-sulfur cell. The cell is mechanically loaded during electrical cycling to achieve maximum ionic conductivity and consistent capacity. A nested combination of linear and nonlinear least squares regression is used to estimate the model parameters. The model captures slow cycling and fast pulse charge/discharge dynamics within 34 mV RMS error. The series resistance changes significantly at high/low states of charge and low C-rates. A sensitivity analysis determines that accurately modeling the dependence of resistance on C-rate and state of charge is important for model fidelity.
1. Introduction
Lithium-Sulfur (Li-S) batteries have the potential for five times higher specific capacity/energy densities relative to current commercially available lithium-ion cells with theoretical values of 1675 mAh/g and 2600 Wh/kg. Experimental testing of liquid and solid-state cells demonstrated energy densities of more than 1800 Wh/kg [1,2,3,4]. Sulfur is the 10th most abundant element on earth [5], making it an inexpensive alternative to nickel, magnesium, aluminum, and cobalt used in current lithium-ion cells. Sulfur is also a good insulator, providing intrinsic safety mechanisms [6,7]. However, the Li-S cathode undergoes several molecular and phase changes [7] and experiences an 80% change in volume when cycled [8] introducing cathode pulverization as a significant degradation mechanism.
Solid-state Li-S cells do not include flammable liquid electrolytes so they are safer than liquid electrolyte cells. Moreover, solid electrolytes inhibit lithium dendrite penetration and eliminate the polysulfide shuttling effect [9,10,11,12,13]. Solid-state Li-S cathodes and separators present a promising pairing with pure solid lithium metal anodes, further increasing theoretical cell energy density.
The main goal of this work is to develop a low-order, experimentally parameterized dynamic model that can accurately predict the dynamic response of solid-state Li-S batteries. This will enable the development and optimization of battery management systems (BMS) functionalities for this chemistry, including state of charge (SOC) estimation, state of health (SOH) estimation, model-based battery pack balancing, optimal charging, optimal pack power/energy management, fault detection/diagnosis, and fault-tolerant control.
The Li-S battery modeling literature focuses primarily on liquid electrolyte Li-S cells. Physics-based liquid electrolyte models [14,15,16] capture the oxidation-reduction reaction, diffusion, precipitation, and self-discharge dynamics to various degrees of complexity ranging from one-dimensional to full electrochemical characterizations. These models often result in a large number of coupled partial differential algebraic Equations (PDAEs). They achieve high levels of fidelity in describing the underlying battery physics, often at the expense of greater complexity and computational cost [17]. Zero-dimensional physics-based models, in contrast, use the laws of electrochemistry to model the underlying battery reactions while neglecting the diffusion of species in Li-S battery cells. These simplifications result in lower-order models, fewer parameters to identify, and reduced computational complexity [18,19]. Finally, equivalent circuit models (ECMs) often offer an acceptable trade-off between fidelity and complexity and can be well-suited for real-time execution to support BMS functions. There is significant work in the literature on developing ECMs for liquid electrolyte Li-S cells using electrochemical impedance spectroscopy (EIS), the galvanostatic intermittent titration test (GITT), and the hybrid pulse power characterization test (HPPC) [20,21,22,23,24,25,26].
Physics-based solid-state models of non Li-S cells focus mainly on characterizing Lithium Cobalt Oxide (LCO) cathodes [27,28,29,30,31]. The literature also presents a few studies on the ECM and/or transmission line modeling of solid-state Li-S cells, using EIS for cell characterization [32,33,34].
In the literature, various techniques are used to parameterize ECMs of liquid electrolyte Li-S cells. These models result in a root mean square (RMS) voltage error of 32 mV, sum-square error of 23 mV, and average error of 20 mV [20,24,35]. This work will show a modeling and parameterization technique that results in less than 10mV RMS error. In addition to reduced modeling error, the novelty of this paper lies in its focus on fitting an equivalent circuit model to time-domain solid-state Li-S battery cycling data at multiple time scales Specifically, 10 mm single-layer Li-S coin cells were fabricated and pulse power tested to enable system identification of an ECM. The anode material is a lithium-indium alloy, selected because of its potential to reduce lithium dendrite growth and improve Coulombic efficiency [36,37,38,39,40,41]. These cells were cycled using a modified form of HPPC, and an equivalent circuit model was fit to the resulting data, for both slow cycling and fast pulse data. Furthermore, the sensitivity of the model fidelity to the number of parameters used was examined.
2. Cell Fabrication
Figure 1 shows the configuration of the solid-state Li-S cell used for testing. The cell consists of two stainless steel rod current collectors, a lithium-indium anode, solid electrolyte membrane, and sulfur composite cathode. The cell is housed in a commercial split cell holder (MTI corporation, 10 mm diameter) that is placed in a screw press to mechanically apply pressure.
2.1. Preparation of Solid Electrolytes
LiS (99.98%) and PS (99%) purchased from Sigma-Aldrich were used as precursors. 75LiS-25PS (LPS) solid electrolyte was prepared following a previously reported method employing mechanical ball-milling [2].
2.2. Preparation of Sulfur Cathode Composite
Sulfur and conductive carbon (Ketjenblack EC-600 JD, (KB), Nouryon) were mixed using an agate mortar and pestle at a weight ratio of 50:20. The mixture was then heated at 160 °C for 6 h in a sealed glass container. Finally, the obtained sulfur-carbon composite powders were mixed with LPS at a weight ratio of 70:30 by mechanical ball milling (Planetary Micro Mill PULVERISETTE 7, FRITSCH) for 6 h at 300 RPM.
Note, LiPSCl (LPSCl, ∼4 mS cm at room temperature) possesses higher ionic conductivity than 75LiS-25PS (LPS, ∼0.3 mS cm at room temperature). Leading to the use of LPSCl for fabricating the membrane (solid electrolyte), and employment of LPS solid electrolyte in the cathode.
2.3. Solid-State Li-S Cell Fabrication
To prepare solid-state Li-S cells, first, 60 mg LiPSCl (LPSCl, MSE Supplies) was weighed and pressed at 1 ton for 1 min in a 10 mm diameter die to form a pellet. Next, 4∼5 mg of sulfur cathode composite cathode powders (2∼2.5 mg sulfur cm) were pressed onto one side of the pellet at 3.5 tons for 3 min. Then, ∼3 mg lithium (Lithium Foil, China Energy Lithium Co., Ltd.) and indium alloy foil (0.127 mm, 99.99%, Indium foil, Sigma-Aldrich) in a 70:30 ratio was pressed onto the other side of the LPSCl pellet at 0.5 ton for 1 min. Finally, the fabricated Li-S battery pellet was loaded into the split cell.
3. Cell Characterization
Multiple Li-S cells were fabricated and characterized experimentally starting at beginning of life. The modeling and parameterization results described in this paper focus on a representative cell from this fabrication and testing work. Note, cells and their fabrication methods are similar to the previously referenced work including a scanning electron microscope (SEM) analysis of the cathode and demonstrating a capacity retention of 91.9% after 100 cycles [2]. The cell was mechanically and electrically loaded over a fifty-two-hour period in a fixed volume press while current and voltage were recorded. Initial pressure was set by adjusting a screw press. The split cell enclosure was constrained radially by its radially-stiff and non-conductive die sleeve, in turn, radial force resulted in uniform cell pressure. The screw press was locked during testing, resulting in a constant volume experiment with the cell pressure changing as the electrodes expanded and contracted during battery cycling. When Li-S cathodes are unconstrained, they experience sizeable volumetric expansion during discharge [42]. In this constrained configuration, internal pressure changed significantly as a function of battery SOC [43]. After setting the initial volume and associated force/pressure (20 MPa), the cell was allowed to rest for 4 h in an open circuit configuration.
Figure 2 shows the testing data set, with the current loading and cell voltage response. Following a profile similar to the Hybrid Pulse Power Characterization Test [44] the cell was cycled using an ARBIN test machine at a (+/−) 0.1 C-rate (where, 1 C = 1675 mAh/g) in a 60 °C environment. This cycle was repeated 3 times and then immediately followed by a series of higher C-rate pulse sets designed to capture the voltage response of the cell under its full range of power capability. The 0.1 C-rate loading captured slower dynamics, including ionic conductivity and diffusion. Then, higher C-rate loading started with a discharge pulse, rest, and then a charge pulse of the same C-rate. This was repeated with 0.5, 1, 3, and 5 C rate pulses with short rest periods in between. Finally, a 0.1 C rate discharge and 1-h rest completed the pulse set to lower the initial SOC for the next pulse set. This pattern started with a fully charged cell and was repeated at approximately every 5% SOC until the cell was depleted.
4. Equivalent Circuit Model
Figure 3 shows the proposed equivalent circuit model for the Li-S cell. The model consists of a nonlinear relationship between open-circuit potential and SOC, in series with an Ohmic resistor plus multiple (two shown in Figure 3) linear RC pairs. Thus, the equivalent circuit captures the open circuit, series resistance and transient behavior of the cell. The governing equations are:
where t denotes time, is the battery current input (positive in the charge direction), is the state of charge in the cell, p is the number of RC pairs, represents the charge stored in each capacitor , Q is the total capacity of the cell, and are the time constants for the parallel RC circuits (where = ). The output is the terminal voltage of the cell where and are OCV and series resistance, respectively. In addition, the measured (or commanded) input current is assumed to be equal to the true current, , plus an unknown constant measurement bias, b.
The goal of the paper is to estimate the charge capacity Q, time constants , capacitances , OCV-SOC curve, resistance , initial SOC, and bias b in the experimental measurement of input current, .
The fact that the above model’s differential (i.e., state) equations are linear makes it possible to solve for the output variable, , analytically. This, in turn, has the potential to simplify the process of identifying the model’s parameters. Specifically, one can use integration with respect to time plus convolution integrals to solve for and , respectively, as shown below:
where is equal to the measured input current minus an estimate of the bias, b, and is assumed to be an accurate estimate of the true current .
The remainder of this section approximates both the battery cell’s open-circuit voltage and series resistance as piecewise-linear functions of SOC, and u. This approximation can be written as follows:
where and are the values of and at specific values of SOC used for linear interpolation, and the family of functions enables interpolation between these values. In the remainder of this section, these functions will be used specifically for linear interpolation in terms of SOC, as illustrated in Figure 4 and Equation (4).
Given the above definitions, the model’s output equation becomes:
5. Model Parameterization
The structure of Equation (5) makes it possible to estimate the model parameters using a nested linear/nonlinear approach. A linear regression inner loop simplifies model parameterization by reducing the dimensionality of the nonlinear regression outer loop. Linear regression estimates parameters that appear linearly in the output equation, thereby reducing overall computational complexity.
Two different variants of this nested approach were employed: a variant based on Equation (5) and a variant where the series cell resistance is approximated as a function of input current, as opposed to SOC, as shown in the output equation below:
The battery cell’s series resistance can, in general, be a function of both SOC and input current. However, each variant of the nested optimization approach captures dependence on either SOC or input current, for simplicity. In the above output equation, the functions are interpolation functions used for computing overall resistance based on the input current , and are the coefficients associated with interpolation.
5.1. Outer Loop: Nonlinear Regression
The outer regression loop estimates the current bias, b, the RC pair time constants, , and the RC pair initial conditions, . Note that because the time constants, , do not appear linearly in Equation (5), they cannot be estimated using linear regression. Constrained nonlinear particle swarm optimization is used in the outer loop for nonlinear regression, where the optimization objective is to minimize the sum of the voltage prediction error squared over the time duration of interest. Solving this nonlinear least-squares problem uses estimates of the remaining battery model parameters from the inner loop algorithm.
In transitioning between the outer and inner loop optimization routines, we make the simplifying assumption that the battery cycle used for parameter estimation covers the full range of battery SOC. This makes it possible to determine the values of initial SOC, , and the charge capacity, Q, such that SOC is actively bounded between 0 and 100% during the course of the test cycle, while this step is not strictly required by the nested optimization approach, it is consistent with the broad range of SOC values visited during this article’s battery cycling. Additionally, this approach has the benefit of eliminating the need for optimally estimating and Q. The approach relies on pre-computing the integral of the current measurement versus time, starting from a zero initial condition, as follows:
where the expression represents the measured battery current, including the current bias, b. Battery charge capacity, Q, and battery SOC can be computed as follows:
5.2. Inner Loop: Linear Regression
The output voltage in Equation (5) is linear in all the model parameters that are not included in outer loop optimization. Therefore, this output can be expressed as , where the vector of remaining unknown parameters, , includes , , and . The vector can then be estimated using the standard linear least squares formula, . To apply this formula, one needs to construct the matrix, , of regressors ( for low and for high C-rate. Each column of this matrix will contain a history of the regressor associated with the corresponding unknown parameter. For instance:
- The regressor associated with is , evaluated at every sampling time.
- The regressor associated with is , evaluated at every sampling time.
- The regressor associated with is , evaluated at every sampling time, for the variant of the estimation algorithm where battery series resistance is assumed to be a function of SOC.
- The regressor associated with is , evaluated at every sampling time, for the variant of the estimation algorithm where battery series resistance is assumed to be a function of input current.
6. Parameterization Results
The above, nested regression procedure, was used for fitting the proposed equivalent circuit model to both the slow and fast cycling datasets. Significant differences in series battery resistance between these two datasets precluded the accurate fitting of a single ECM to both datasets simultaneously. This section, therefore, focuses on fitting the ECM to each dataset independently. Series battery resistance is approximated as a function of SOC for the slow cycling dataset and as an SOC-independent function of input current for the fast cycling dataset. This is consistent with the degree to which the slow cycling dataset covered a broad SOC range at one charge/discharge C-rate, while the fast cycling data included multiple C-rates.
Figure 5 shows the fitted versus measured battery voltage profiles for both the slow cycling and fast pulse portions of the overall battery test. The fit is quite accurate in both cases. For instance, the root mean square battery voltage prediction errors are 34.2 mV and 11.5 mV during the slow cycling and fast pulse portions of the overall battery experiment, respectively. This suggests that the use of a simple ECM for fitting the dynamics of the all-solid Li-S cell described in this work is reasonable, at least for the range of operating conditions in which the ECM was parameterized.
The accuracy with which the proposed ECM fits the measured voltage data is partly a reflection of the accuracy of the model’s parameters, including the parameterization of both OCV and . Figure 6 compares the model’s estimate of OCV vs. SOC, obtained using nested regression for the slow cycling data, to the average of the battery terminal voltages corresponding to 0.1 C charge and discharge, respectively. Good accuracy is achieved in fitting OCV vs. SOC, highlighting the effectiveness of the nested parameterization approach. Figure 6 also plots the estimated battery series resistance, , versus SOC for the slow cycling tests. This estimate is compared to an empirical approximation of computed by subtracting battery OCV at every moment in time from terminal voltage, then dividing the resulting voltage difference by the input current. Again, a good match is obtained between the empirical approximation of series resistance versus the optimized estimate of this resistance, at various SOC values. Finally, Figure 7 shows an estimate for versus in terms of cell c-rate for the fast pulse tests. This estimate of versus C-rate provides an attractive level of accuracy in capturing fast cycling data, with an RMS voltage prediction error of 11.5 mV. However, there is a strong discrepancy between the range of values of estimated for slow cycling versus fast pulse data, with much higher series resistance values seen in association with slow cycling.
The fact that the estimated series resistance, , is much larger for slow cycling warrants investigation in future research and its impact can be seen in the cycling history plot in Figure 8. Three large loops are seen in this plot, where measured battery voltage during charge is substantially different compared to discharge, even though the slow charge/discharge currents are small in magnitude. Superimposed on the same plot, the discrepancies between battery voltage during charge versus discharge for fast pulses consistently points to much smaller series resistance values, regardless of SOC. This suggests that battery polarization effects are strong functions of the type, magnitude, and/or duration of cycling used: an interesting open topic for future investigation.
6.1. Sensitivity Analysis
The accuracy of the proposed battery model depends on the model’s complexity. This depends, in turn, on the settings of the model, such as the number of RC pairs modeled and the number of discretizations used for representing OCV and in terms of SOC and/or input current. A full factorial sensitivity analysis was performed covering a range of breakpoints for SOC and mapping as well as the number of RC pairs in the ECM. The objective is to minimize model complexity while maintaining reasonable accuracy. Table 1 shows a subset of the results from this sensitivity analysis, focusing on the key insights generated by this analysis. The RMS voltage prediction errors in this table pertain to the fast cycling test, with similar insights obtained for the slow cycling data. The reduction in RMS voltage error by varying the number of SOC breakpoints and RC pairs was relatively low but followed the expected profile, with increasing complexity resulting in a decrease in modeling error. However, the mapping as a function of or c-rate proved to be most beneficial, with a higher number of discretizations resulting in roughly a 50% reduction in RMS voltage prediction error. Table 1 lists a summary of RMS voltage errors for individual parameter studies, holding all else constant.
6.2. Model Parameters
In addition to the previously presented SOC and OCV maps, Table 2 details the estimated ECM parameters. They represent a 2 RC pair ECM with 5 breakpoints for both and SOC. Where R1 and C1 represent the faster and R2 and C2 the slower time constant of the cells’ response. The value of b is an estimate of current sensor bias and Q the charge energy of the cell.
7. Summary and Conclusions
Li-S is a promising conversion-type cathode that offers significant potential energy density benefits compared to more traditional lithium-ion batteries. As with any new chemistry, the solid-state Li-S chemistry is better understood through the development of a simple ECM. All-solid-state Li-S cells were fabricated, mechanically loaded, and electrically cycled in support of the characterization and system identification of a dual-polarization ECM. Parameters were measured and estimated from two data sets, low rate constant C-rate cycles and pulse sets. The method of using least square error and a nested linear regression with non-linear particle swarm optimization was able to fit measured data well and provided robust parameter estimates.
Author Contributions
Cell fabrication D.W. (Daiwei Wang) and D.W. (Donghai Wang); Conceptualization, methodology, software, validation, formal analysis, investigation, data curation, T.C., Z.N., C.R. and H.K.F.; writing—original draft preparation, T.C. and Z.N.; writing—review and editing, D.W. (Daiwei Wang), D.W. (Donghai Wang), C.R. and H.K.F. All authors have read and agreed to the published version of the manuscript.
Funding
This research received no external funding.
Data Availability Statement
Data sets analyzed during this study are archived and publicly available at the following link: http://personal.psu.edu/tdc142/files/LiS-SN005-RAW.mat.
Conflicts of Interest
The authors declare no conflict of interest.
References
- Yan, J.; Liu, X.; Li, B. Capacity Fade Analysis of Sulfur Cathodes in Lithium–Sulfur Batteries. Adv. Sci. 2016, 3, 1600101. [Google Scholar] [CrossRef] [PubMed]
- Alzahrani, A.S.; Otaki, M.; Wang, D.; Gao, Y.; Arthur, T.S.; Liu, S.; Wang, D. Confining Sulfur in Porous Carbon by Vapor Deposition to Achieve High-Performance Cathode for All-Solid-State Lithium–Sulfur Batteries. ACS Energy Lett. 2021, 6, 413–418. [Google Scholar] [CrossRef]
- Zheng, J.; Lv, D.; Gu, M.; Wang, C.; Zhang, J.G.; Liu, J.; Xiao, J. How to Obtain Reproducible Results for Lithium Sulfur Batteries? J. Electrochem. Soc. 2013, 160, A2288–A2292. [Google Scholar] [CrossRef]
- Zhang, Y.; Zhang, X.; Silva, S.R.P.; Ding, B.; Zhang, P.; Shao, G. Lithium–Sulfur Batteries Meet Electrospinning: Recent Advances and the Key Parameters for High Gravimetric and Volume Energy Density. Adv. Sci. 2022, 9, 2103879. [Google Scholar] [CrossRef] [PubMed]
- Thomas Jefferson National Accelerator Facility—Office of Science Education The Element Sulfur, 2022. Available online: https://education.jlab.org/itselemental/ele016.html (accessed on 6 June 2022).
- Ohno, S.; Zeier, W.G. Toward Practical Solid-State Lithium–Sulfur Batteries: Challenges and Perspectives. Acc. Mater. Res. 2021, 2, 869–880. [Google Scholar] [CrossRef]
- Ji, X.; Nazar, L.F. Advances in Li–S batteries. J. Mater. Chem. 2010, 20, 9821–9826. [Google Scholar] [CrossRef]
- Ohno, S.; Rosenbach, C.; Dewald, G.F.; Janek, J.; Zeier, W.G. Linking Solid Electrolyte Degradation to Charge Carrier Transport in the Thiophosphate-Based Composite Cathode toward Solid-State Lithium-Sulfur Batteries. Adv. Funct. Mater. 2021, 31, 2010620. [Google Scholar] [CrossRef]
- Mikhaylik, Y.V.; Akridge, J.R. Polysulfide Shuttle Study in the Li/S Battery System. J. Electrochem. Soc. 2004, 151, A1969. [Google Scholar] [CrossRef]
- Busche, M.R.; Adelhelm, P.; Sommer, H.; Schneider, H.; Leitner, K.; Janek, J. Systematical electrochemical study on the parasitic shuttle-effect in lithium-sulfur-cells at different temperatures and different rates. J. Power Sources 2014, 259, 289–299. [Google Scholar] [CrossRef]
- Zhang, S.S. Liquid electrolyte lithium/sulfur battery: Fundamental chemistry, problems, and solutions. J. Power Sources 2013, 231, 153–162. [Google Scholar] [CrossRef]
- Li, S.; Zhang, W.; Zheng, J.; Lv, M.; Song, H.; Du, L. Inhibition of Polysulfide Shuttles in Li–S Batteries: Modified Separators and Solid-State Electrolytes. Adv. Energy Mater. 2021, 11, 2000779. [Google Scholar] [CrossRef]
- Zhang, Y.; Zhang, P.; Zhang, S.; Wang, Z.; Li, N.; Silva, S.R.P.; Shao, G. A flexible metallic TiC nanofiber/vertical graphene 1D/2D heterostructured as active electrocatalyst for advanced Li–S batteries. InfoMat 2021, 3, 790–803. [Google Scholar] [CrossRef]
- Abdulkadiroglu, B.; Bektas, H.; Eroglu, D. How to Model the Cathode Area in Lithium-Sulfur Batteries? ChemElectroChem 2022, 9, e202101553. [Google Scholar] [CrossRef]
- Kumaresan, K.; Mikhaylik, Y.; White, R.E. A Mathematical Model for a Lithium–Sulfur Cell. J. Electrochem. Soc. 2008, 155, A576. [Google Scholar] [CrossRef]
- Brieske, D.M.; Hassan, A.; Warnecke, A.; Sauer, D.U. Modeling of the temporal evolution of polysulfide chains within the lithium-sulfur battery. Energy Storage Mater. 2022, 47, 249–261. [Google Scholar] [CrossRef]
- Danner, T.; Latz, A. On the influence of nucleation and growth of S8 and Li2S in lithium-sulfur batteries. Electrochim. Acta 2019, 322, 134719. [Google Scholar] [CrossRef]
- Marinescu, M.; Zhang, T.; Offer, G.J. A zero dimensional model of lithium–sulfur batteries during charge and discharge. Phys. Chem. Chem. Phys. 2016, 18, 584–593. [Google Scholar] [CrossRef] [PubMed] [Green Version]
- Xu, C.; Cleary, T.; Li, G.; Wang, D.; Fathy, H. Parameter Identification and Sensitivity Analysis for Zero-Dimensional Physics-Based Lithium-Sulfur Battery Models. ASME Lett. Dyn. Syst. Control 2021, 1, 041001. [Google Scholar] [CrossRef]
- Knap, V.; Stroe, D.I.; Teodorescu, R.; Swierczynski, M.; Stanciu, T. Comparison of parametrization techniques for an electrical circuit model of Lithium-Sulfur batteries. In Proceedings of the 2015 IEEE 13th International Conference on Industrial Informatics (INDIN), Cambridge, UK, 22–24 July 2015; pp. 1278–1283. [Google Scholar] [CrossRef] [Green Version]
- Deng, Z.; Zhang, Z.; Lai, Y.; Liu, J.; Li, J.; Liu, Y. Electrochemical Impedance Spectroscopy Study of a Lithium/Sulfur Battery: Modeling and Analysis of Capacity Fading. J. Electrochem. Soc. 2013, 160, 553–558. [Google Scholar] [CrossRef]
- Cañas, N.A.; Hirose, K.; Pascucci, B.; Wagner, N.; Friedrich, K.A.; Hiesgen, R. Investigations of lithium–sulfur batteries using electrochemical impedance spectroscopy. Electrochim. Acta 2013, 97, 42–51. [Google Scholar] [CrossRef]
- Jiang, J.; Liang, Y.; Ju, Q.; Zhang, L.; Zhang, W.; Zhang, C. An Equivalent Circuit Model for Lithium-sulfur Batteries. Energy Procedia 2017, 105, 3533–3538. [Google Scholar] [CrossRef]
- Fotouhi, A.; Auger, D.J.; Propp, K.; Longo, S.; Purkayastha, R.; O’Neill, L.; Waluś, S. Lithium–Sulfur Cell Equivalent Circuit Network Model Parameterization and Sensitivity Analysis. IEEE Trans. Veh. Technol. 2017, 66, 7711–7721. [Google Scholar] [CrossRef] [Green Version]
- Yen, Y.J.; Chung, S.H. Lean-electrolyte lithium–sulfur electrochemical cells with high-loading carbon nanotube/nanofiber–polysulfide cathodes. Chem. Commun. 2021, 57, 2009–2012. [Google Scholar] [CrossRef] [PubMed]
- Qiu, X.; Hua, Q.; Zheng, L.; Dai, Z. Study of the discharge/charge process of lithium–sulfur batteries by electrochemical impedance spectroscopy. RSC Adv. 2020, 10, 5283–5293. [Google Scholar] [CrossRef] [PubMed]
- Upreti, K.; Oyewole, I.; Lin, X.; Kim, Y. On Simplification of a Solid-State Battery Model for State Estimation. In Proceedings of the 2019 IEEE Conference on Control Technology and Applications (CCTA), Hong Kong, China, 19–21 August 2019; pp. 487–492. [Google Scholar] [CrossRef]
- Zhang, D.; Tang, S.X.; Couto, L.D.; Viswanathan, V. PDE Observer for All-Solid-State Batteries via an Electrochemical Model. In Proceedings of the 2021 IEEE Conference on Control Technology and Applications (CCTA), San Diego, CA, USA, 9–11 August 2021; pp. 51–56. [Google Scholar] [CrossRef]
- Sultanova, L.; Figiel, Ł. Microscale diffusion-mechanics model for a polymer-based solid-state battery cathode. Comput. Mater. Sci. 2021, 186, 109990. [Google Scholar] [CrossRef]
- Song, X.; Lu, Y.; Wang, F.; Zhao, X.; Chen, H. A coupled electro-chemo-mechanical model for all-solid-state thin film Li-ion batteries: The effects of bending on battery performances. J. Power Sources 2020, 452, 227803. [Google Scholar] [CrossRef]
- Kim, Y.; Lin, X.; Abbasalinejad, A.; Kim, S.U.; Chung, S.H. On state estimation of all solid-state batteries. Electrochim. Acta 2019, 317, 663–672. [Google Scholar] [CrossRef]
- Wang, Y.; Liu, T.; Estevez, L.; Kumar, J. Kinetics of all-solid-state sulfur cathodes. Energy Storage Mater. 2020, 27, 232–243. [Google Scholar] [CrossRef]
- Fan, B.; Guan, Z.; Wang, H.; Wu, L.; Li, W.; Zhang, S.; Xue, B. Electrochemical processes in all-solid-state Li-S batteries studied by electrochemical impedance spectroscopy. Solid State Ion. 2021, 368, 115680. [Google Scholar] [CrossRef]
- Kobayashi, T.; Imade, Y.; Shishihara, D.; Homma, K.; Nagao, M.; Watanabe, R.; Yokoi, T.; Yamada, A.; Kanno, R.; Tatsumi, T. All solid-state battery with sulfur electrode and thio-LISICON electrolyte. J. Power Sources 2008, 182, 621–625. [Google Scholar] [CrossRef]
- Propp, K.; Marinescu, M.; Auger, D.J.; O’Neill, L.; Fotouhi, A.; Somasundaram, K.; Offer, G.J.; Minton, G.; Longo, S.; Wild, M.; et al. Multi-temperature state-dependent equivalent circuit discharge model for lithium-sulfur batteries. J. Power Sources 2016, 328, 289–299. [Google Scholar] [CrossRef] [Green Version]
- Bi, C.X.; Zhao, M.; Hou, L.P.; Chen, Z.X.; Zhang, X.Q.; Li, B.Q.; Yuan, H.; Huang, J.Q. Anode Material Options Toward 500 Wh/kg Lithium–Sulfur Batteries. Adv. Sci. 2021, 9, 2103910. [Google Scholar] [CrossRef]
- Xu, W.; Wang, J.; Ding, F.; Chen, X.; Nasybulin, E.; Zhang, Y.; Zhang, J.G. Lithium metal anodes for rechargeable batteries. Energy Environ. Sci. 2014, 7, 513–537. [Google Scholar] [CrossRef]
- Ware, S.; Hansen, C.; Jones, J.P.; Hennessy, J.; Bugga, R.; See, K. Fluoride in the SEI Stabilizes the Li Metal Interface in Li-S Batteries with Solvate Electrolytes. ACS Appl. Mater. Interfaces 2021, 13, 18865–18875. [Google Scholar] [CrossRef] [PubMed]
- Jin, Q.; Zhang, X.; Gao, H.; Li, L.; Zhang, Z. Novel LixSiSy/Nafion as an artificial SEI film to enable dendrite-free Li metal anodes and high stability Li–S batteries. J. Mater. Chem. A 2020, 8, 8979–8988. [Google Scholar] [CrossRef]
- Wu, H.; Wu, Q.; Chu, F.; Hu, J.; Cui, Y.; Yin, C.; Li, C. Sericin protein as a conformal protective layer to enable air-endurable Li metal anodes and high-rate Li-S batteries. J. Power Sources 2019, 419, 72–81. [Google Scholar] [CrossRef]
- Kim, J.H.; Lee, Y.H.; Cho, S.J.; Gwon, J.G.; Cho, H.J.; Jang, M.; Lee, S.Y.; Lee, S.Y. Nanomat Li–S batteries based on all-fibrous cathode/separator assemblies and reinforced Li metal anodes: Towards ultrahigh energy density and flexibility. Energy Environ. Sci. 2019, 12, 177–186. [Google Scholar] [CrossRef]
- Li, L.; Zhou, G.; Yin, L.; Koratkar, N.; Li, F.; Cheng, H.M. Stabilizing sulfur cathodes using nitrogen-doped graphene as a chemical immobilizer for LiS batteries. Carbon 2016, 108, 120–126. [Google Scholar] [CrossRef] [Green Version]
- Zhang, W.; Schröder, D.; Arlt, T.; Manke, I.; Koerver, R.; Pinedo, R.; Weber, D.A.; Sann, J.; Zeier, W.G.; Janek, J. (Electro)chemical expansion during cycling: Monitoring the pressure changes in operating solid-state lithium batteries. J. Mater. Chem. A 2017, 5, 9929–9936. [Google Scholar] [CrossRef]
- Christophersen, J.P. Battery Test Manual For Electric Vehicles, Revision 3; Idaho National Lab. (INL): Idaho Falls, ID, USA, 2015. [Google Scholar] [CrossRef]
Figure 1.
Mechanical screw press with commercial split cell housing.
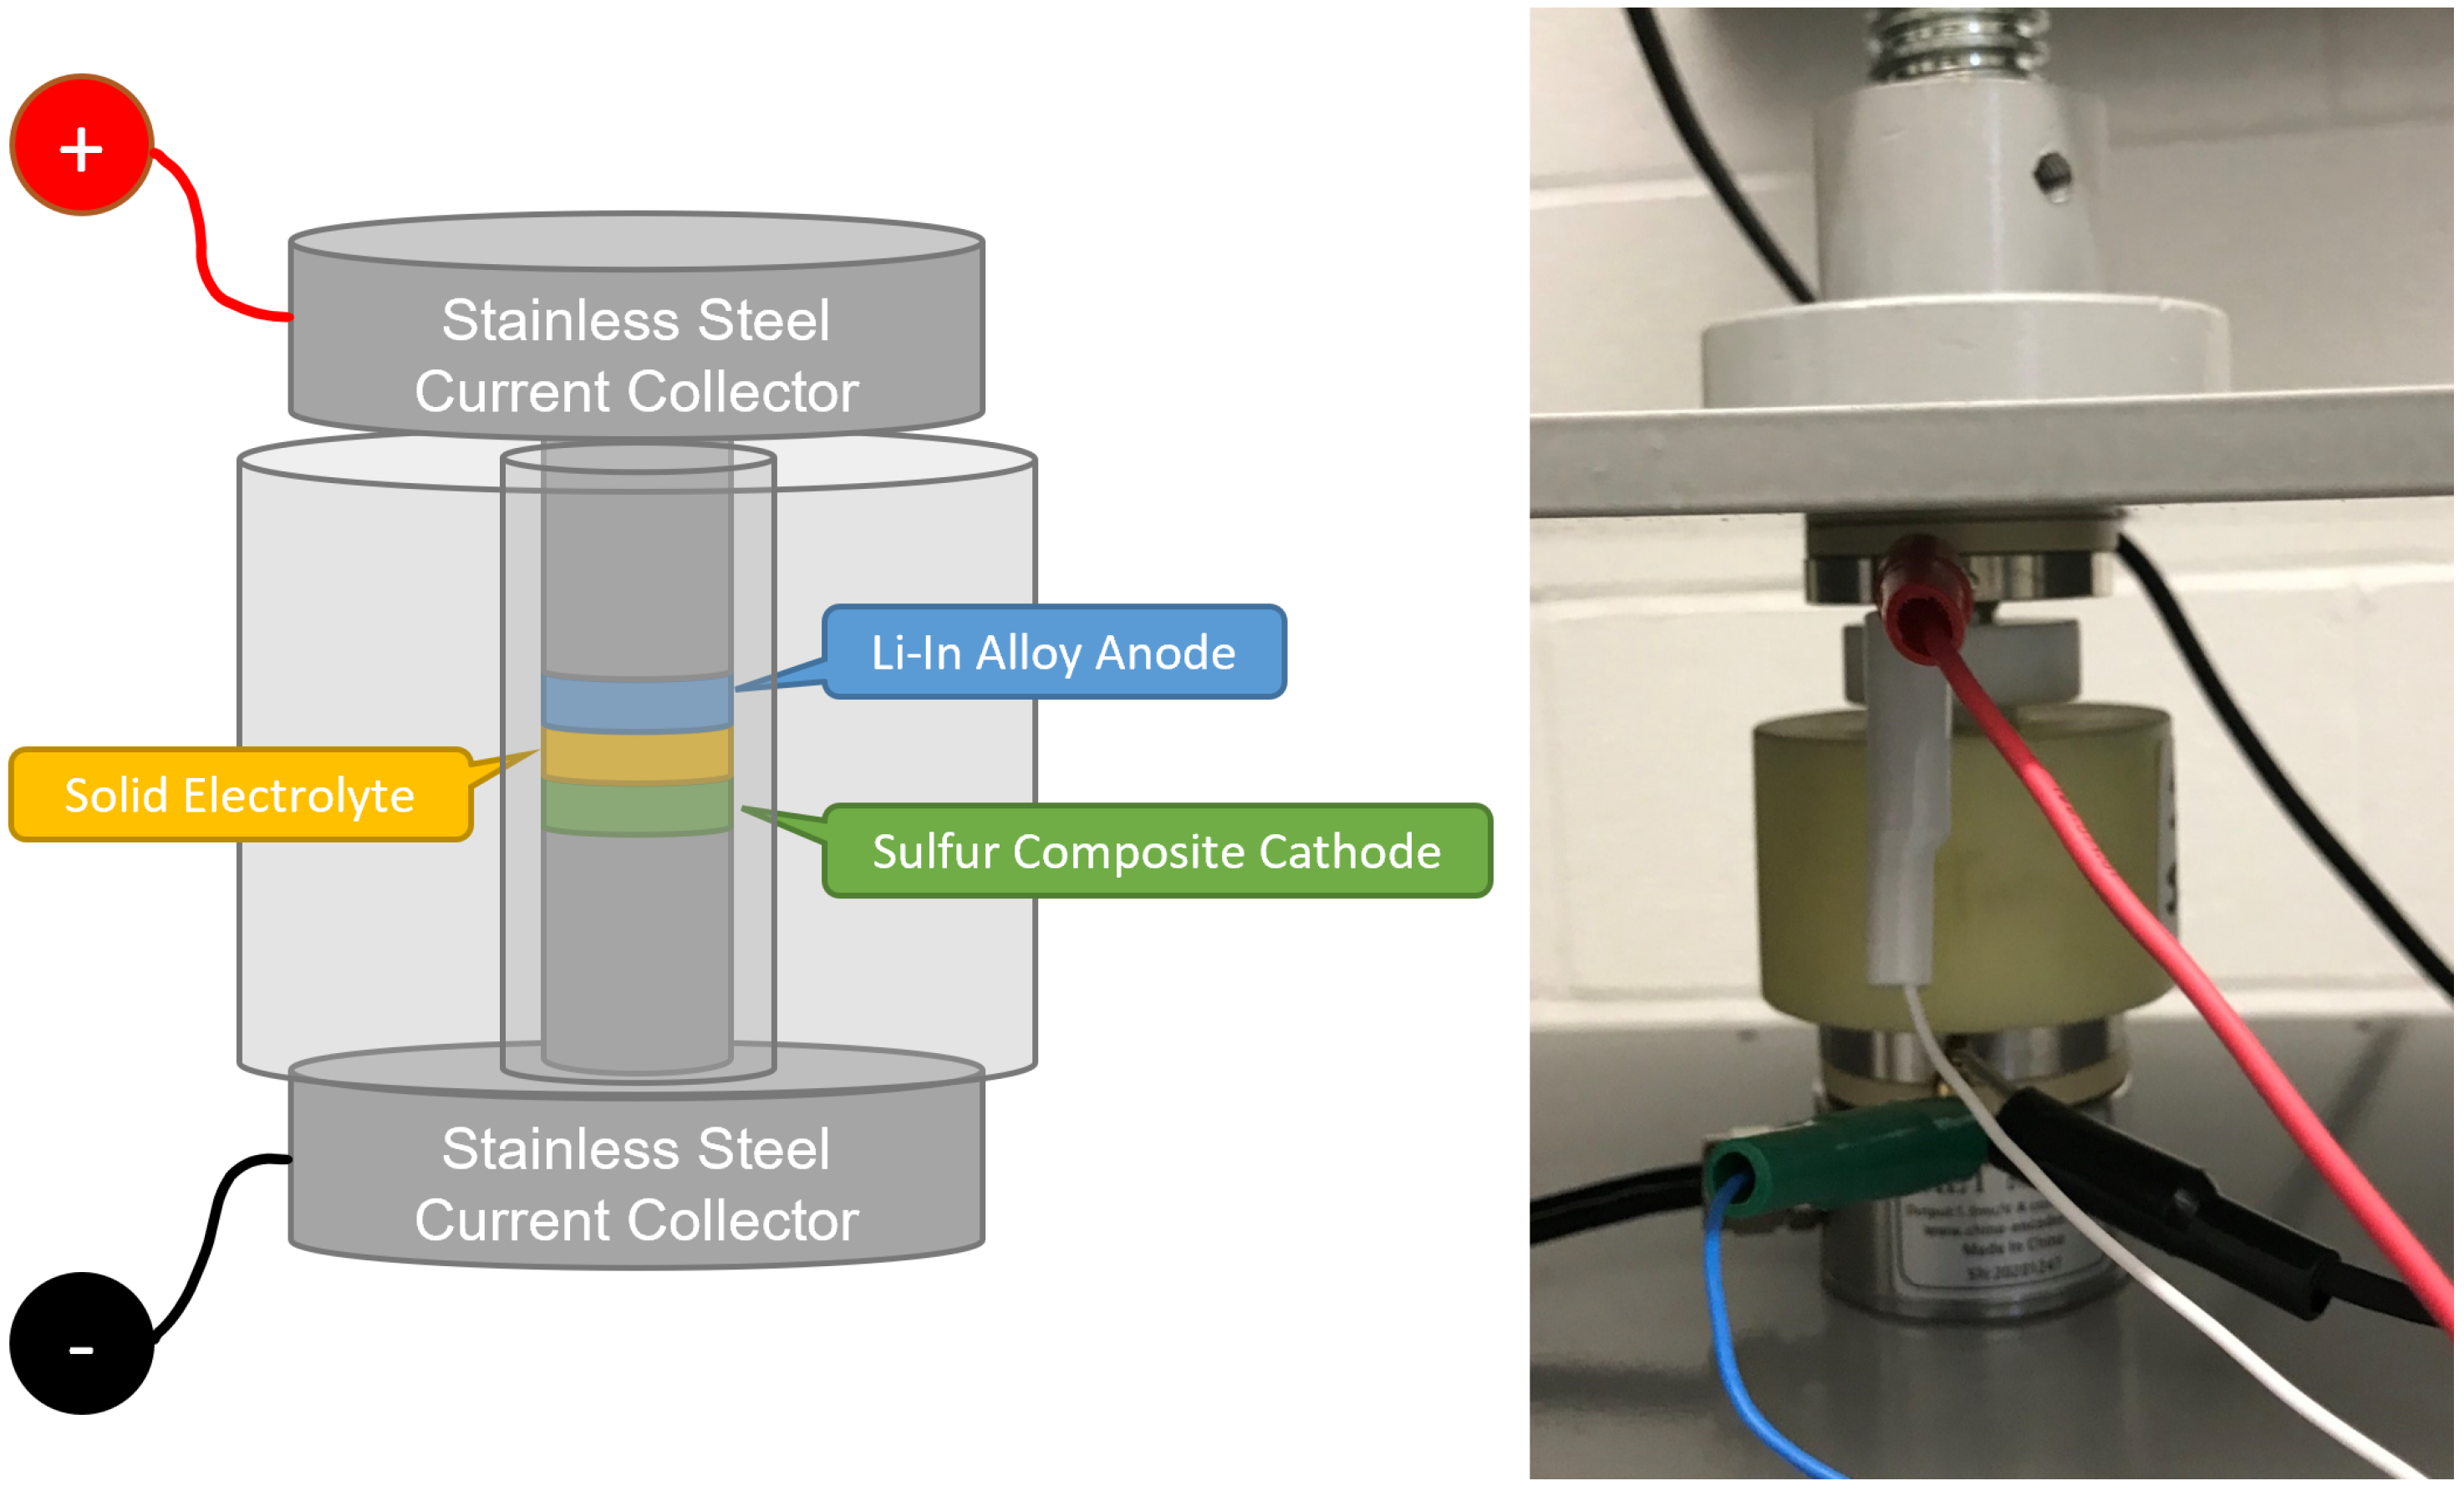
Figure 2.
Data set showing current and voltage during both low (0.1) and high (0.5, 1, 3 and 5) C-rate loading: (a) Current input, (b) High C-rate current input, (c) Voltage response, (d) High C-rate voltage response.
Figure 2.
Data set showing current and voltage during both low (0.1) and high (0.5, 1, 3 and 5) C-rate loading: (a) Current input, (b) High C-rate current input, (c) Voltage response, (d) High C-rate voltage response.
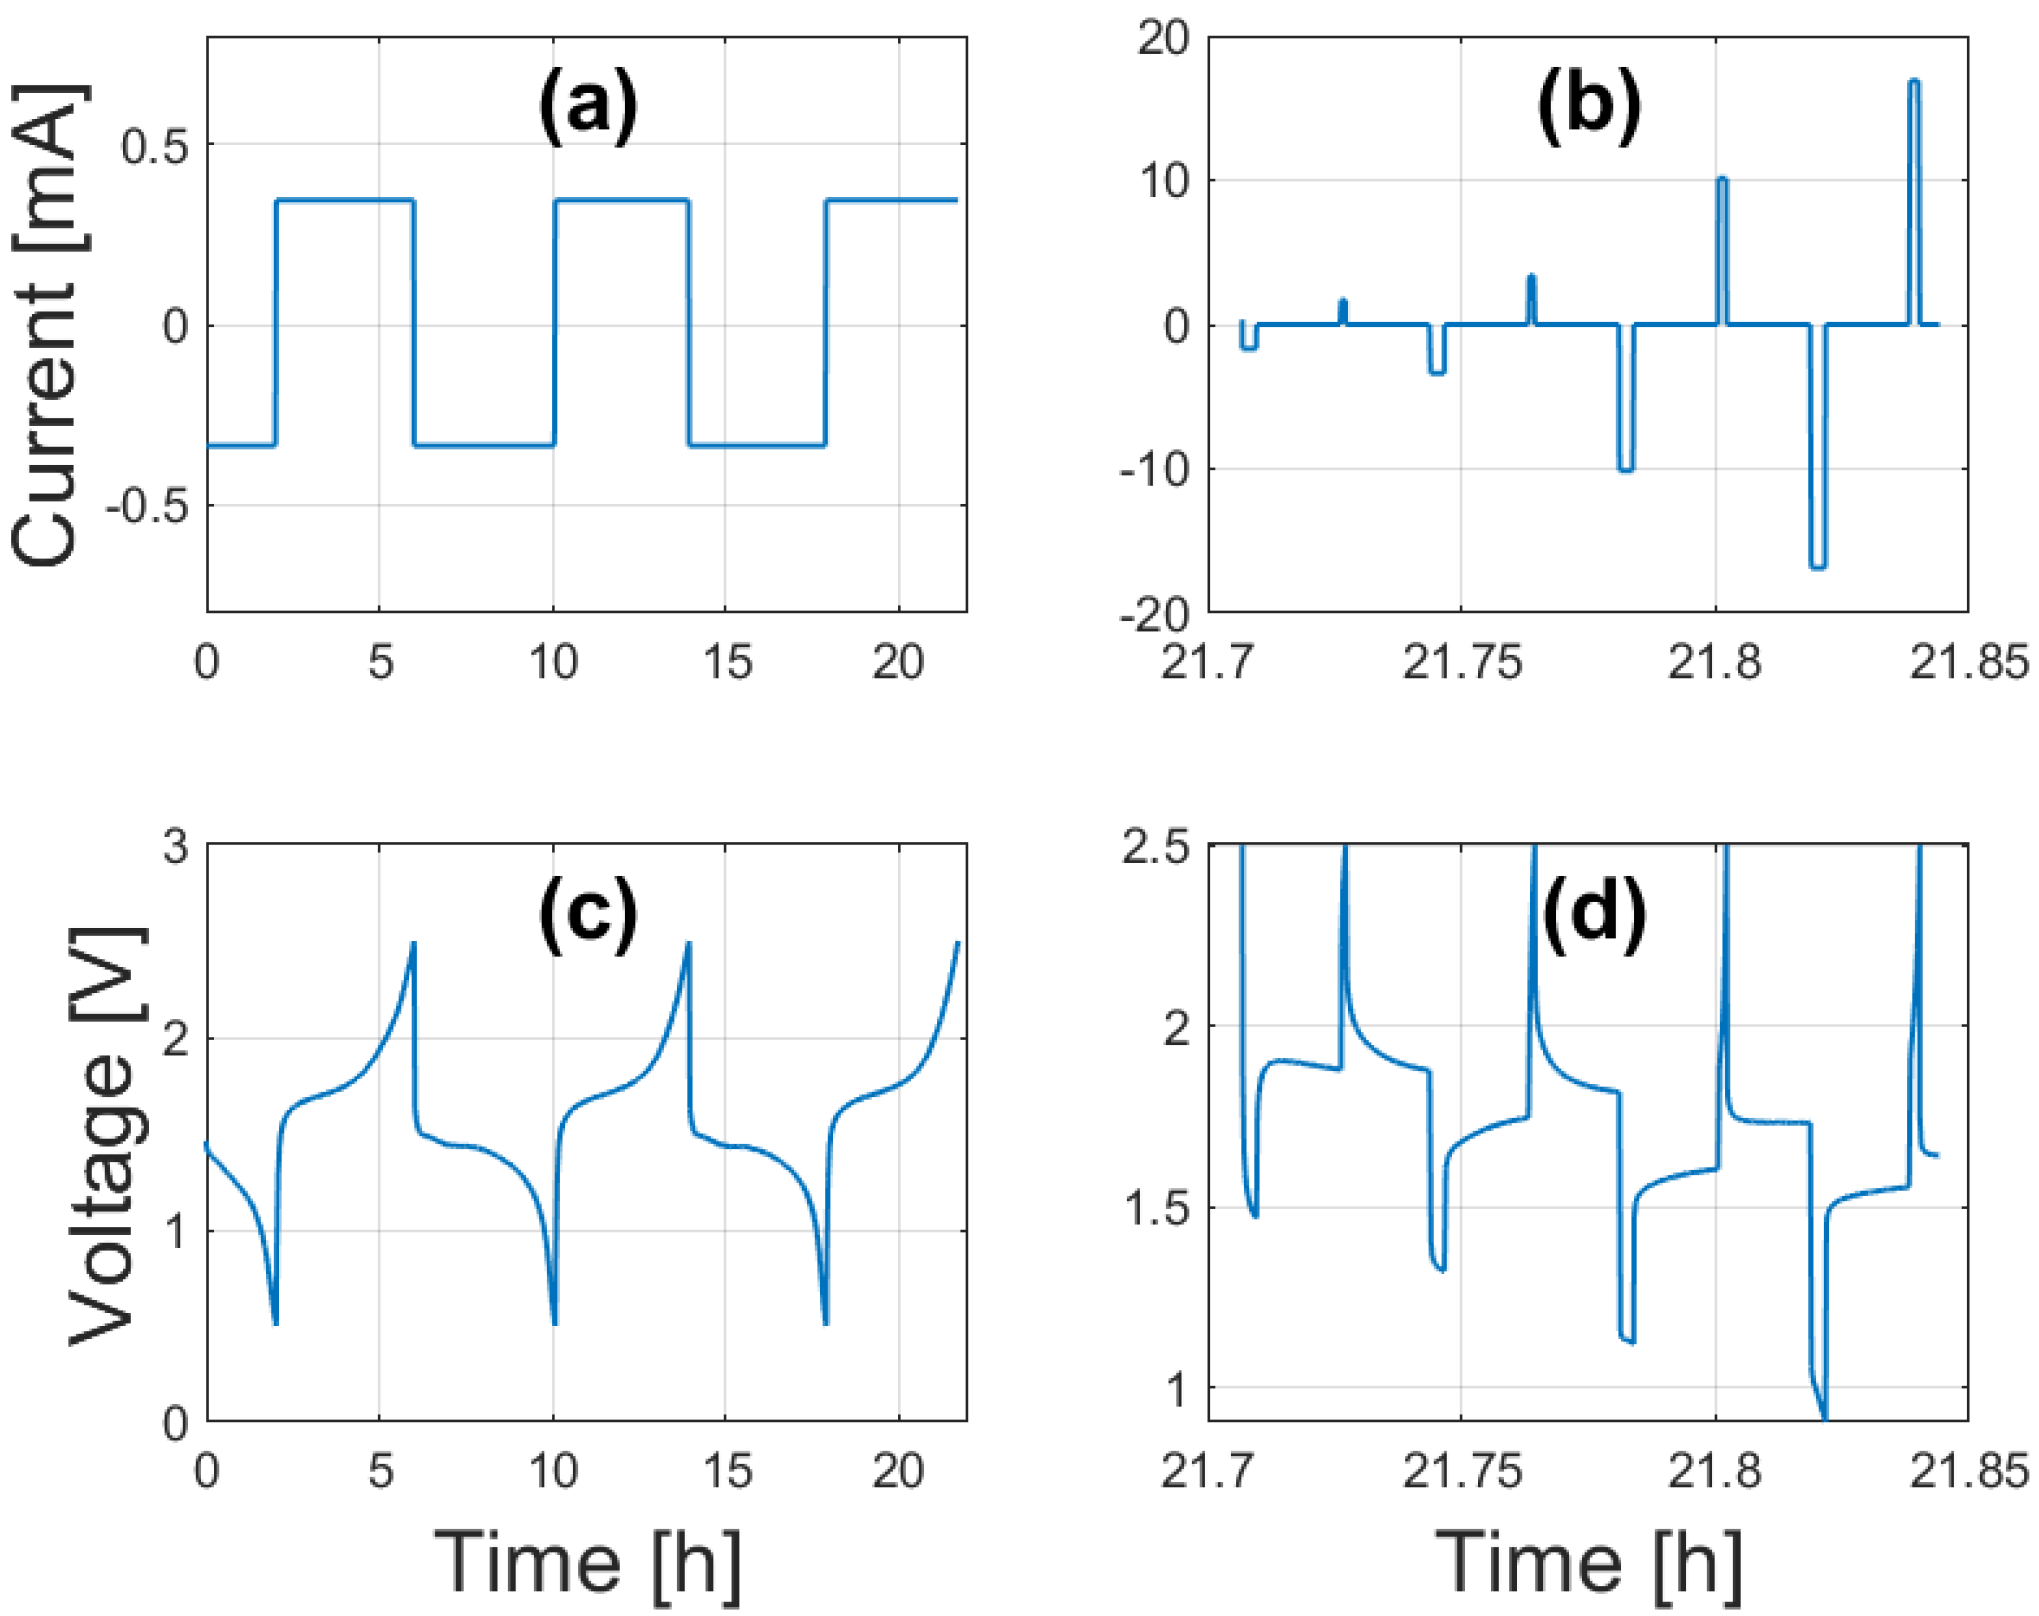
Figure 3.
Equivalent circuit model with two RC pairs.

Figure 4.
Linear interpolation functions for .
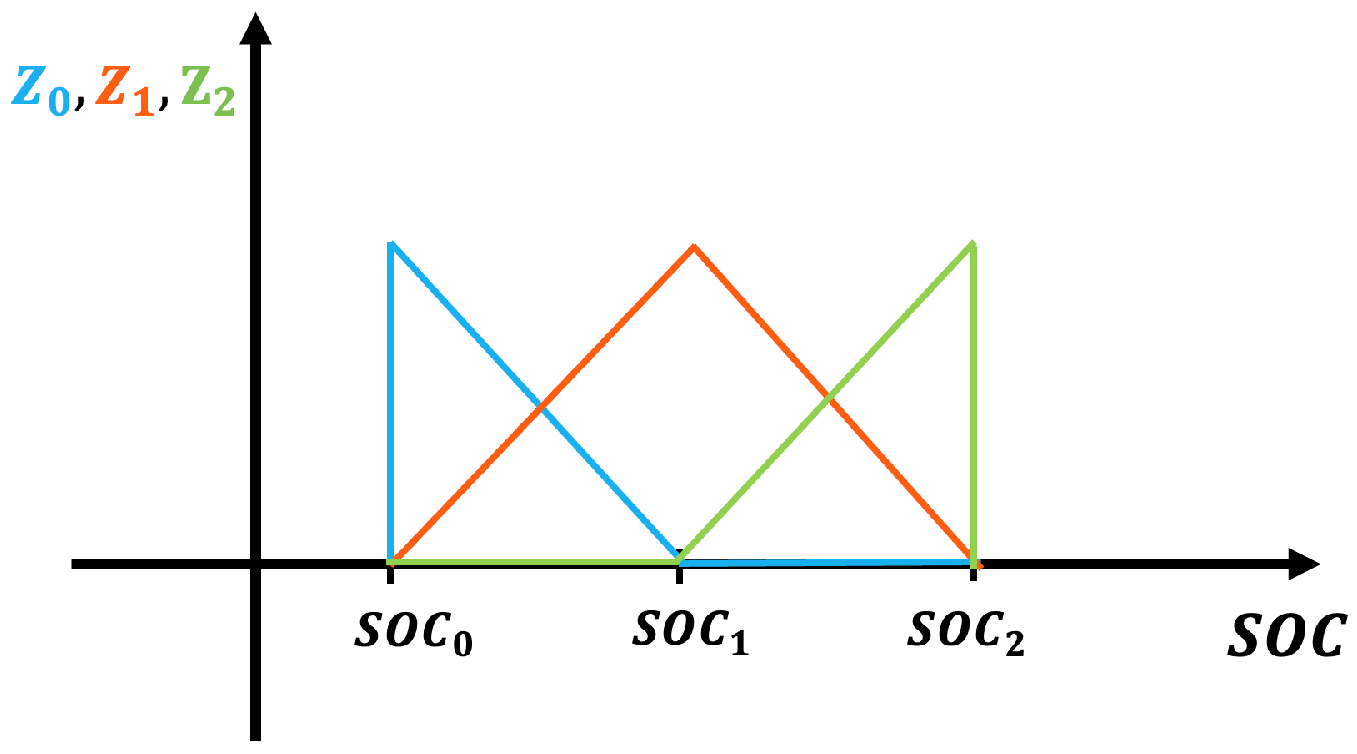
Figure 5.
Low and high C-rate measured vs. modeled data: (a) Low C-rate Voltage, (b) High C-rate Voltage, (c) Low C-rate Current, (d) High C-rate Current.
Figure 5.
Low and high C-rate measured vs. modeled data: (a) Low C-rate Voltage, (b) High C-rate Voltage, (c) Low C-rate Current, (d) High C-rate Current.
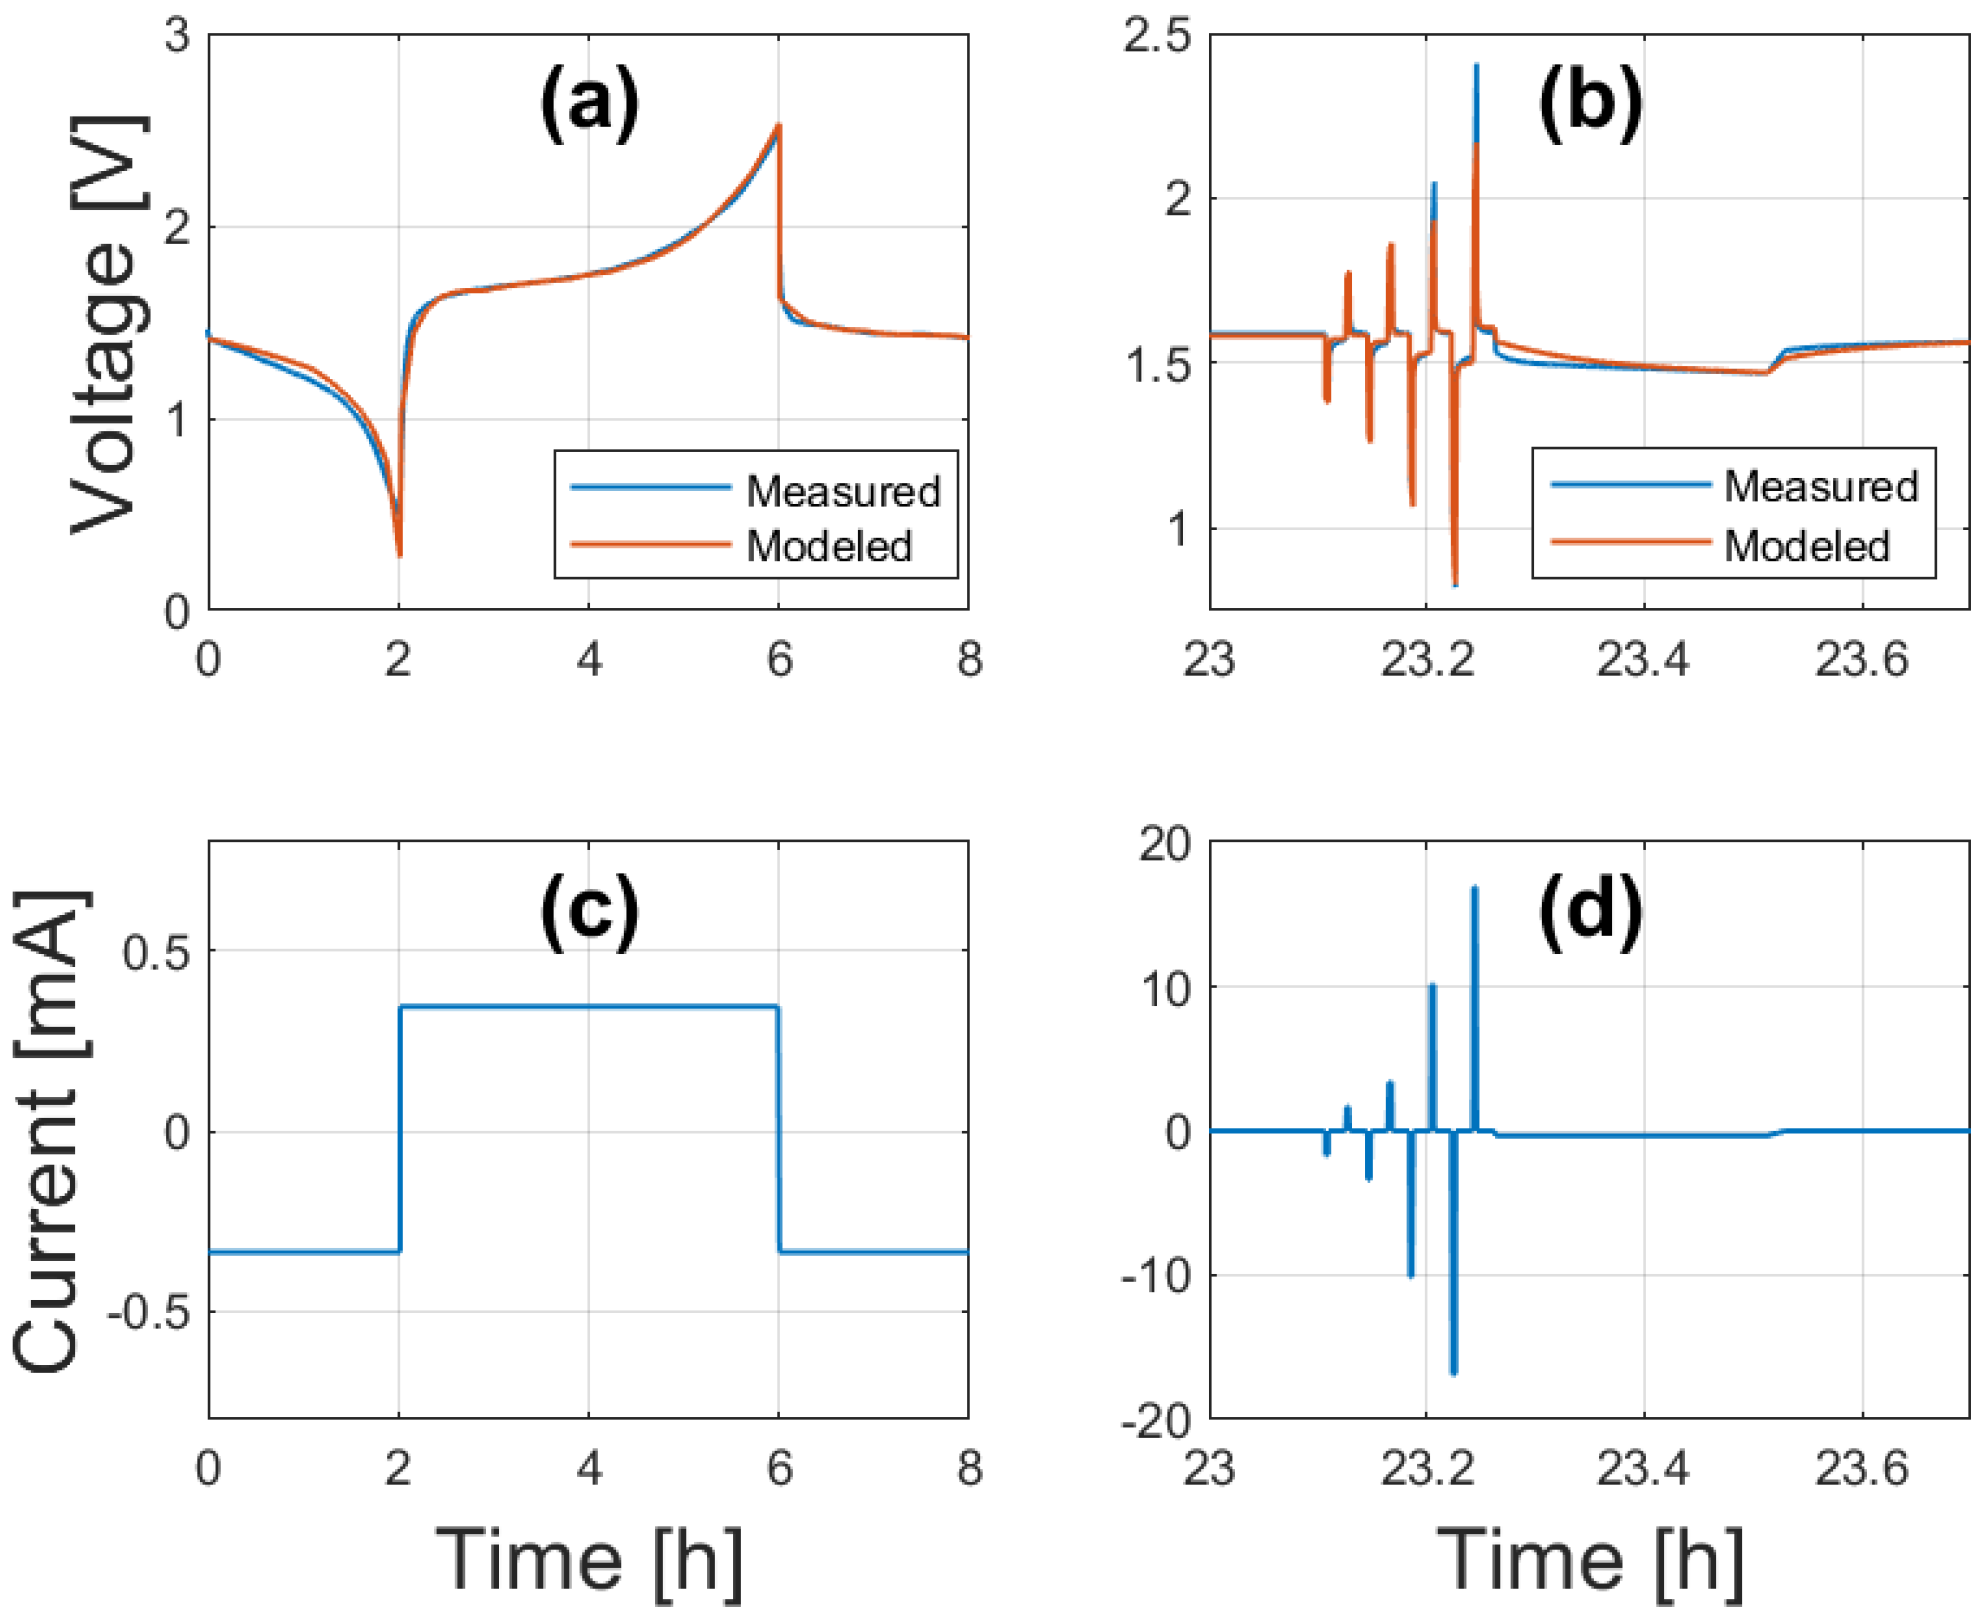
Figure 6.
Measured and estimated OCV (a) and ESR (b) vs. SOC at 0.1 C-rate.
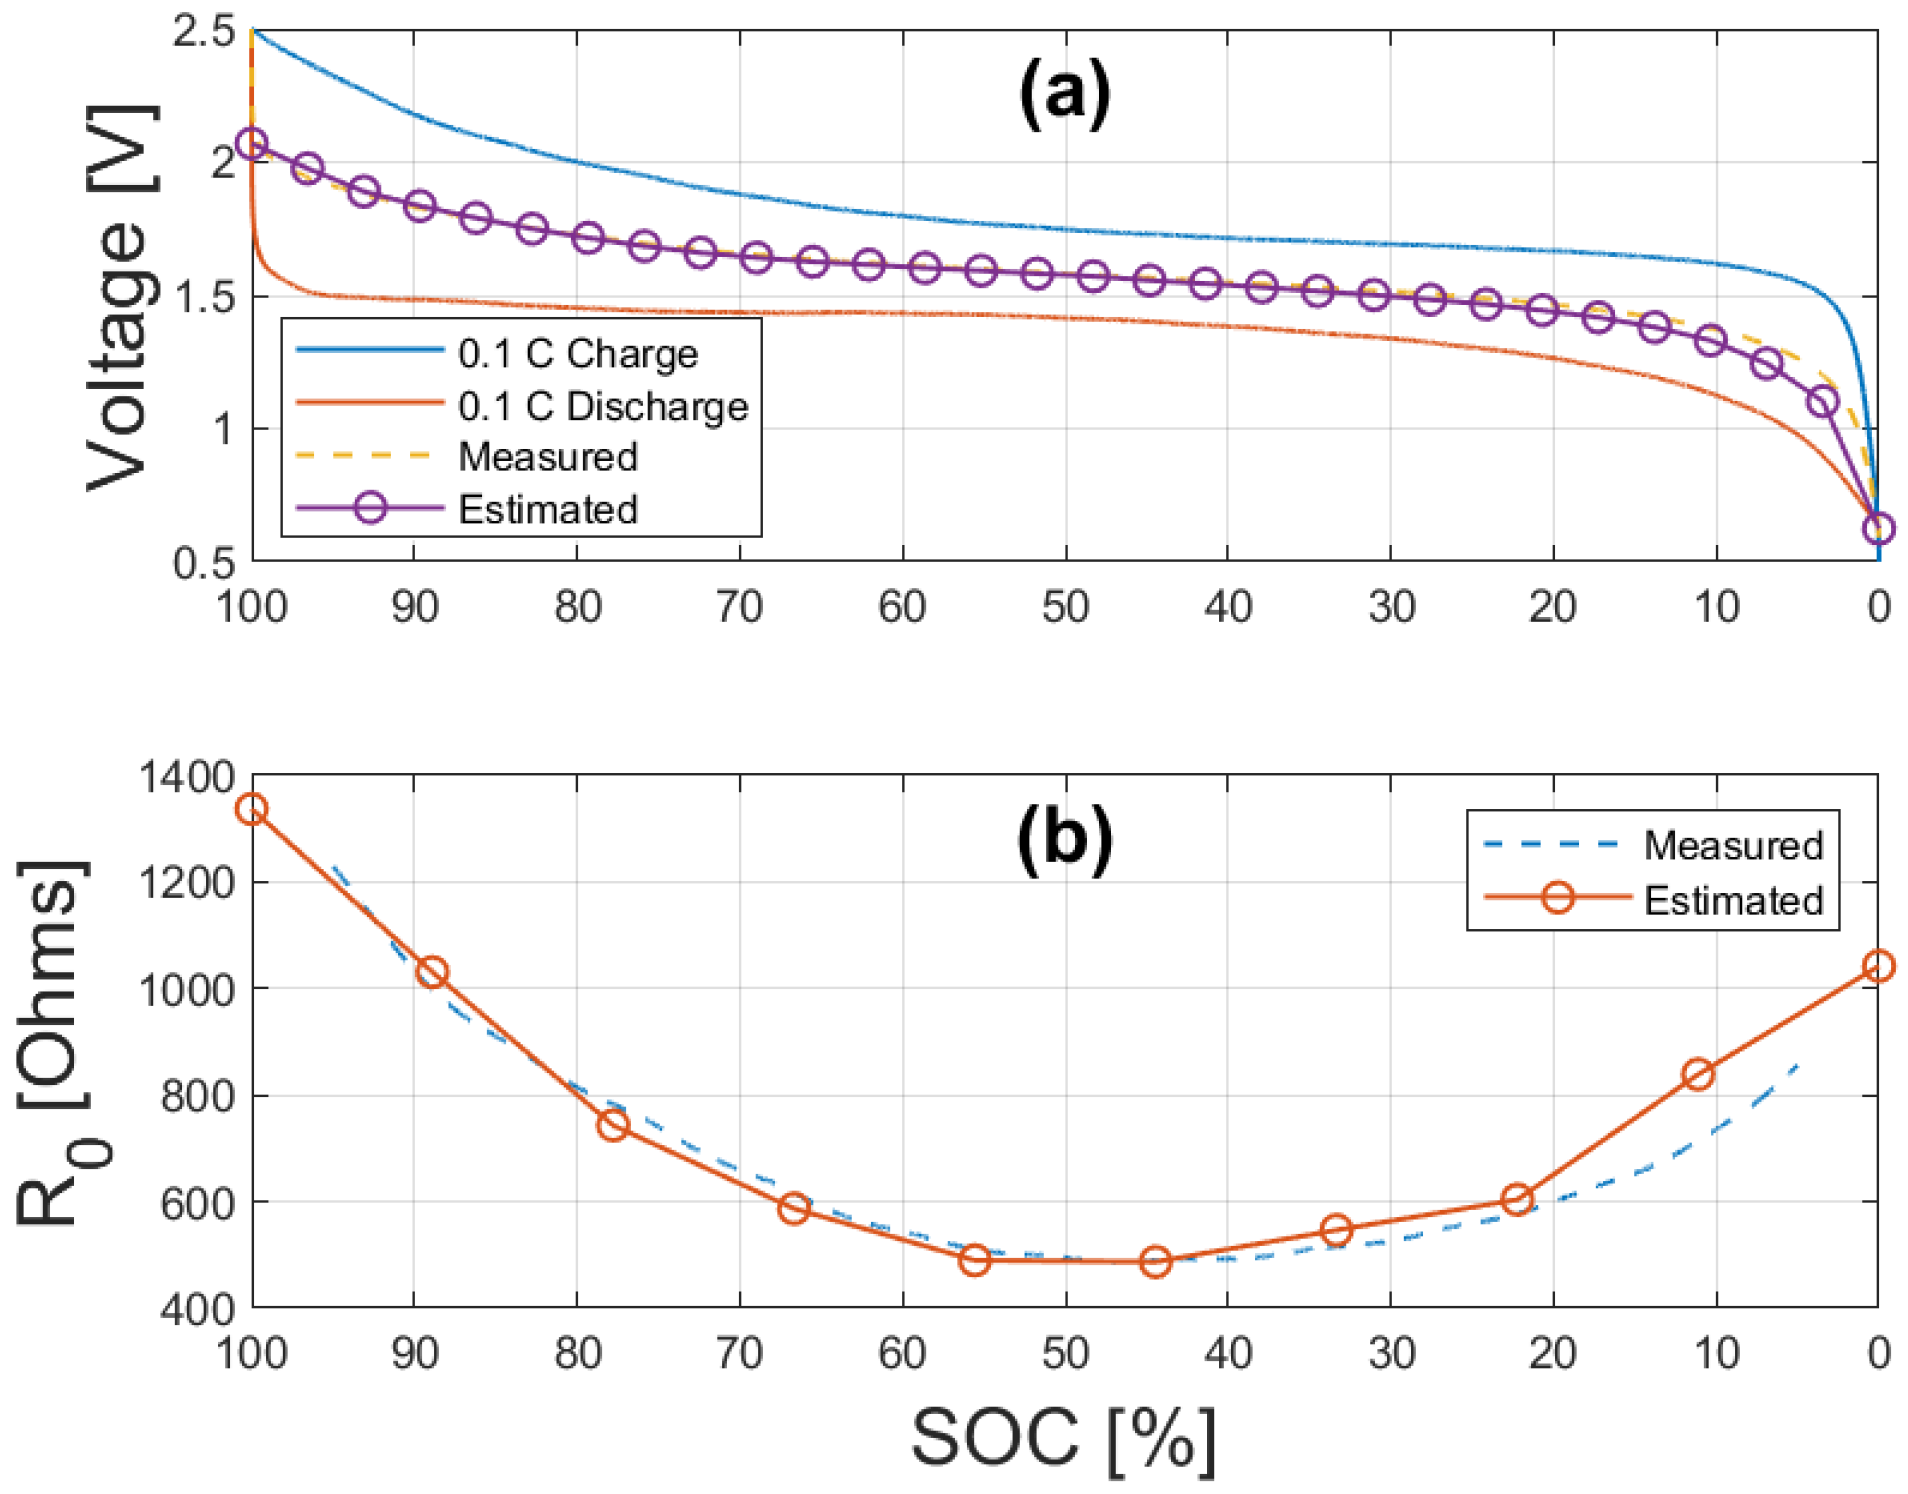
Figure 7.
as a function of /C-Rate.

Figure 8.
Voltage vs. SOC for the full data set.


Table 1.
Sensitivity Analysis Results.
| Avg. Sensitivity | |||||
|---|---|---|---|---|---|
| [mV/Order] | |||||
| RC Pairs | 1 | 2 | 3 | 4 | 0.375 |
| RMS Voltage Error [mV] | 12.40 | 11.50 | 11.40 | 10.90 | |
| Parameters | 1 | 3 | 5 | 7 | 1.25 |
| RMS Voltage Error [mV] | 18.73 | 15.12 | 11.47 | 9.98 | |
| SOC Breakpoints | 2 | 5 | 10 | 15 | 0.158 |
| RMS Voltage Error [mV] | 11.55 | 11.47 | 9.716 | 9.498 |
Table 2.
Estimated ECM Parameters.
| [Ohms] | [Ohms] | [F] | [F] | b [mA] | Q [mAh] |
|---|---|---|---|---|---|
| 8.760 | 194.690 | 0.372 | 1.658 | 4.942 |
Publisher’s Note: MDPI stays neutral with regard to jurisdictional claims in published maps and institutional affiliations. |
© 2022 by the authors. Licensee MDPI, Basel, Switzerland. This article is an open access article distributed under the terms and conditions of the Creative Commons Attribution (CC BY) license (https://creativecommons.org/licenses/by/4.0/).
Share and Cite
MDPI and ACS Style
Cleary, T.; Nozarijouybari, Z.; Wang, D.; Wang, D.; Rahn, C.; Fathy, H.K. An Experimentally Parameterized Equivalent Circuit Model of a Solid-State Lithium-Sulfur Battery. Batteries 2022, 8, 269. https://doi.org/10.3390/batteries8120269
AMA Style
Cleary T, Nozarijouybari Z, Wang D, Wang D, Rahn C, Fathy HK. An Experimentally Parameterized Equivalent Circuit Model of a Solid-State Lithium-Sulfur Battery. Batteries. 2022; 8(12):269. https://doi.org/10.3390/batteries8120269
Chicago/Turabian StyleCleary, Timothy, Zahra Nozarijouybari, Daiwei Wang, Donghai Wang, Christopher Rahn, and Hosam K. Fathy. 2022. "An Experimentally Parameterized Equivalent Circuit Model of a Solid-State Lithium-Sulfur Battery" Batteries 8, no. 12: 269. https://doi.org/10.3390/batteries8120269
Note that from the first issue of 2016, this journal uses article numbers instead of page numbers. See further details here.