
Life Cycle Assessment of a Lithium-Ion Battery Pack Unit Made of Cylindrical Cells
by
 , ,
, ,
Morena Falcone
1,* ,
,
Nicolò Federico Quattromini
2,* ,
,
Claudio Rossi
2,* and
Beatrice Pulvirenti
1,*
1
Department of Industrial Engineering, Alma Mater Studiorum Università di Bologna, Viale Risorgimento, 2, 40136 Bologna, Italy
2
Department of Electrical, Electronic and Information Engineering “Guglielmo Marconi”, Alma Mater Studiorum Università di Bologna, Viale Risorgimento, 2, 40136 Bologna, Italy
*
Authors to whom correspondence should be addressed.
Batteries 2022, 8(8), 76; https://doi.org/10.3390/batteries8080076
Submission received: 13 June 2022
/
Revised: 15 July 2022
/
Accepted: 20 July 2022
/
Published: 25 July 2022
(This article belongs to the Special Issue Circular Battery Technologies)
Abstract
:Saving energy is a fundamental topic considering the growing energy requirements with respect to energy availability. Many studies have been devoted to this question, and life cycle assessment (LCA) is increasingly acquiring importance in several fields as an effective way to evaluate the energy demand and the emissions associated with products’ life cycles. In this work, an LCA analysis of an existent lithium-ion battery pack (BP) unit is presented with the aim to increase awareness about its consumption and offering alternative production solutions that are less energy intensive. Exploiting the literature data about cradle-to-grave and cradle-to-gate investigations, and after establishing reasonable approximations, the main BP sub-elements were considered for this study, such as the plastic cells support, the Li-ion cells brick, the PCBs for a battery management system (BMS), the liquid-based battery thermal management system (BTMS) and the BP container. For each of these components, the impacts of the extraction, processing, assembly, and transportation of raw materials are estimated and the partial and total values of the energy demand (ED) and global warming potential (GWP) are determined. The final interpretation of the results allows one to understand the important role played by LCA evaluations and presents other possible ways of reducing the energy consumption and emissions.

1. Introduction
In a society where the energy demand is constantly growing hand in hand with technological development and, at the same time, awareness of environmental issues is rising, studies of life cycle assessment (LCA) have become fundamental. Before 2015, when the EU Circular Economy Action Plan had not yet come into play [1], the LCA was already a discussion topic but mainly in research environments. The outdated and most common way of approaching goods production was mainly focused on performances and costs in “linear life thinking”, which caused dramatic results in terms of raw material usage. The United Nations Environment Programme (UNEP) stated that, in the last 40 years, raw material consumption tripled, going from 27 billion tons in 1970 to 98 billion tons in 2018 [2]. In the last decade, the LCA has generated more and more interest not only in the academic world but also among industry stakeholders who have begun to change their mindset, switching to the new “circular life thinking” or life cycle thinking (LCT) [3]. Both private realities (industries, companies) and public ones (governments) have started to embrace green economy principles, establishing and regulating business models so that both materials and products can keep their highest value throughout their whole life cycles [4,5]. This new way of thinking about the product impact does not only consider its disposal stages [6] but also all the production phases from the extraction of raw materials to the manufacturing processes, including the use of energy and water [7,8], wastes and transportation emissions [9]. Finally, the disposal of the product is investigated, taking into account the possibility of recycling all or part of it [10,11]. This last consideration is the key-point that allows distinguishing two different approaches to the product impact: the cradle-to-grave (CTG) and the cradle-to-cradle (CTC).
The CTG approach dates from the 1990s [6] and takes into account the whole life cycle of a product up to the disposal stage. It has increased producers’ awareness of the real consumption related to their production, teaching the LCT and motivating them not to waste resources. Regarding the CTC approach, it does not consider the analysis impact of a real final disposal phase as what is considered waste in CTG studies is “food” for CTC ones. It was in 2002 that the definition of CTC was given by the chemist Michael Braungart and the architect William McDonough: drawing a parallel with nature where “the waste of one system becomes food for another” [12], they suggested a product impact approach where the products which arrived at the end of their lives would have become a sort of raw material to produce something of equal or even better quality. This innovative LCT implied recycling processes which, in recent decades, have been significantly developed and improved in every field. The International Organization for Standardization (ISO) includes widely recognized procedures to conduct valid and extensive LCA studies [13]. In particular, ISO 14040 and ISO 14044 represent the basis of the International Reference Life Cycle Data System (ILCD), a technical guideline to carry on accurate LCAs considering product-specific criteria [3].
To complete a detailed and useful LCA, ISO 14040 and ISO 14044 suggest to proceed by following four different phases which are often dependent on each other. Nevertheless, none of these stages should be considered as concluded until the entire study is complete. The aforementioned stages are the following: goal and scope; life cycle inventory (LCI); life cycle impact assessment (LCIA); and interpretation. During the goal and scope stage, the intended application and audience, the reason for the study and whether the results will be used in a comparative dissertation intended for public release must be defined. This is a fundamental preliminary phase which saves time during the following ones by focusing the attention on the real core of the investigation. The LCI is the data collecting phase resulting from an input and output analysis and quantification: this is the moment when a real inventory is compiled [14] considering raw materials, energy and water requirements, atmospheric emissions, resource usage and all the other flows involved in a product or process life cycle. Flow charts, such as the Sankey diagram, are very helpful during this phase [15]. Knowing the methods to extract or machine the materials, it is possible to work on the impact assessment. First, it is necessary to classify the kind of impact associated with the considered material (climate change, ozone depletion, or toxicity related to anthropogenic activity). Then, all the inventory items (flows) have to be characterized: this means that every flow related to a certain impact has to be classified under a common unit of comparison [13]. For instance, considering the global warming potential (GWP) as the impact, the unit is the equivalent weight which has to be assigned to all the items in the inventory. This procedure is usually performed with the help of databases. Finally, there is the interpretation of the collected data: the LCI and the LCIA are checked, evaluated and all the issues coming from the investigation of these two previous phases are identified and faced by choosing among a broad repertoire of methodological alternatives [16]. A series of limitations and recommendations represents the final result of the interpretation phase.
Nowadays, LCA studies focus on extremely varied fields of services and products, such as packaging [17], tourism [18], textile industry [19,20], food processes [21,22,23,24], drink consumption [25,26], electronics [27], and materials [28]. Transportation is another huge sector in which LCA analysis is applied [29], and particularly when considering the issue of sustainable urban and commercial development, many studies have investigated the benefits brought by the electrification of the public means compared to the impacts of more ordinary thermal-engine-powered vehicles [30,31,32]; on the other hand, other studies have analyzed the positive environmental and economic impacts resulting from a ships electrification campaign, considering factors, such as the kind of fuel/propulsion, the chemistry of the BPs, and the average cruise speed [33,34,35,36]. A great deal of effort is also focused on the automotive field, studying the effects of car lightening [37], the benefits of using recycled natural materials [38], and, when it talks about green mobility [39,40,41], the attention is often focused on the Li-ion BP. Several researches deal with the environmental impact of a whole electric vehicle (EV) BP [42], other studies focus on the constituent materials [43] or components [44,45,46].
In this paper, LCA literature results are used to carry on a cradle-to-gate analysis regarding the LiBER [47] BP based on the modular integration of lithium-ion cylindrical cells. This prototype is based on an international patent [48], whose main innovations are the modularity of the system, the thermal control of each cell in order to prevent thermal runaway events and some novel processes for the assembling of the cells and the bricks which avoid the use of wires. A custom-made battery pack based on the concept of the LiBER group has been installed on Emilia 4 [49], the solar car of the University of Bologna built by the sport association Onda Solare. Emilia 4 is a 4-seats competitive vehicle, fully made of carbon fibers, whose main characteristics are: two rear in-wheel electric motors, 5 m2 of monocrystalline silicon solar panels and a 32 kWh Li-ion battery pack. Several studies have already been devoted to design, environmental, mechanical, and electrical aspects related to Onda Solare solar cars [50,51,52,53,54,55,56,57,58]. Taking into account Emilia 4, the aim of this work is to deepen the knowledge regarding the environmental impact of its BP. This study deals with the raw materials extraction, their processing, the assembly of the components, and the products transportation. All these stages are evaluated in terms of energy demand (ED) and GWP impact. A final interpretation of the results proposes several energy saving solutions to lower the ED and GWP values.
2. Materials and Methods
Figure 1 shows the Li-ion battery (LIB) considered for this analysis, which is made of 2 modules, both of them composed of a stack of 15 bricks which, in turn, contains 48 cells each. Figure 2 shows a detailed view of the LiBER brick: the 48 cells are inserted into the slots of the support structure, which is made of acrylonitrile butadiene styrene (ABS).
In the brick, as shown in Figure 2, the cells are separated from the ABS by means of thin aluminum liners, locked in the right position by two bus-bar plates and electrically connected to the positive and negative bus-bars by means of laser welded tabs. Additional holes in the support structure host the cooling piping. A printed circuit board called BMS-brick is installed on the side of each brick and it is used for the acquisition of the cells voltage and temperature. The bus-bars host the power connections which allow the direct connection in series of the bricks forming a stack of bricks. At the two ends, the stack is completed with electrical terminations, BMS control boards, and ancillaries. The module is formed by inserting the complete stack into a container made of composite material. The container is closed at the two sides with two metal plates to guarantee mechanical protection and to seal the modules. Finally, the two modules are connected either in series or in parallel by using external power wiring to form the BP. The LiBER battery design for simple disassembling and reassembly operations, combined with a distributed State of Health (SOH) estimator, allows an easy reuse of the bricks in second life applications. This analysis regarding the LCA over a longer life time that includes disassembly, reassembly, and reuse will be addressed in a next work.
The analysis is divided into five main research macro-topics usually taken into consideration in this genre of studies [59]: the cells support, the Li-ion cells, the BMS system, the liquid-based BTMS and the container. The other parts of the BP, such as the electrical components (fuses, switches, connectors) are not considered in this LCA analysis. The LCA is conducted as a cradle-to-gate analysis (a partial cradle-to-grave without the study of the product disposal) and, concerning the kind of resultant impact, the ED and the GWP values are considered.
2.1. Cells Support
In Figure 2, a section of the LiBER cells support is shown: it is a plastic structure with 48 holes for the Li-ion cells arranged in a 6 × 8 configuration and one aluminum liner in each hole to better dissipate the heat generated by the cells. About the aluminum, it is assumed to be all primary aluminum as the majority of the literature data about the impact evaluations (ED and GWP) deal with that kind of metal. The LCA about the plastic part of the support involves the analysis of two different materials: the polyoxymethylene (POM) usually used in the manual production line and the ABS common in the automatic production line.
2.2. Li-Ion Cells
The cells chosen for this LCA analysis are the cylindrical INR 21700 P42A produced by Molicel [60] and based on cathode. This kind of cells is a quite common choice in the BP mass production when frequent charging/discharging cycles are required (energy storage, automotive): the reason is that the low cobalt content brings to lower costs [61]. The LiBER BP concept and assembly processes do not depend on the cells used. Then, the study presented in this paper is designed so that the section concerning the cradle-to-gate analysis of the Li-ion cells can be replaced with a new one focused on a different type of cells instead of the ones analyzed in this work, with the other sections remaining the same. It has to be specified that the following analysis does not take into account the environmental impacts coming from the use of the Li-ion cells (charging/discharging phases), as well as the battery post-processing. In addition to the anode and the cathode components, the study of a cell deals with many other materials: the constituents of the binder, the separator ones, the electrolyte salt and its additives, and, enclosing the whole assembly, the nickel-plated steel cell casing. Before starting with the impact evaluation some assumptions are completed: the binder is considered as made of polyvinylidene fluoride (PVDF) and represents a negligible mass percentage (<1%) [60] in the selected NMC cells [59]; among the data found in the literature, a separator composition equal to 50% of polypropylene (PP) and 50% of polyethylene (PE) is selected; the electrolyte solvent is considered as 50% dimethyl carbonate (DMC) made and 50% ethylene carbonate (EC) made as the other carbonates which usually compose the NMC cell solvent are in much lower and negligible percentages. Furthermore, the cell casing is not taken into account as in the overall emissions balance its impact is lower than 1% [59]. The resulting inventory includes: the anode (graphite coating on a copper foil), the cathode (cobalt(III) lithium oxide (), , coating on an foil), the electrolyte salt (lithium hexafluorophosphate), and the electrolyte solvent (50% DMC, 50% EC) [60]. Studies demonstrate that the ED and emissions related to the cell assembly are much lower than the those coming from the cell processing (in particular, the processes involving the anode and the cathode) [45]. Other studies highlight how reasonable this thesis is compared to the extremely low emissions for the entire BP assembly and those associated with the overall LCA (GWPASSEM ≃ 0.7 · GWPTOT) [62]. Finally, in this study the manufacturing phase is evaluated only concerning the Li-ion cells, instead this contribution is considered irrelevant regarding the cells support and the liquid-cooled BTMS.
2.3. BMS
Each brick is realized with a 1.8 mm thick FR4 layer and a 35 μm copper thick sheet.
2.4. Liquid-Cooled BTMS
The BTMS considered in this study is based on the real liquid cooling system installed on the LiBER BP prototype: it is a water-based BTMS with a coolant circuit made of a silicone rubber tube passing through the holes of the brick. As seen in the brick scheme (Figure 2), among the bigger holes for the cells there are smaller ones for the cooling circuit which passes through 12 of them while the coolant flows along it. The liquid duct holes have a diameter dhole = 10 mm, so the chosen silicone rubber tube has an external and an internal diameter equal to dtube,ext = 10 mm and dtube,int = 8 mm, respectively, resulting in a thickness stube = 1 mm. The LCA regarding the BTMS is here facilitated just considering the silicon rubber tube in terms of raw materials extraction, processing and transportation.
2.5. Container
The battery pack container is made of pultruded composite materials and it has also a structural function. The container cap is not considered as it gives a negligible contribution with modules composed of a high number of bricks.
2.6. LCA Approach
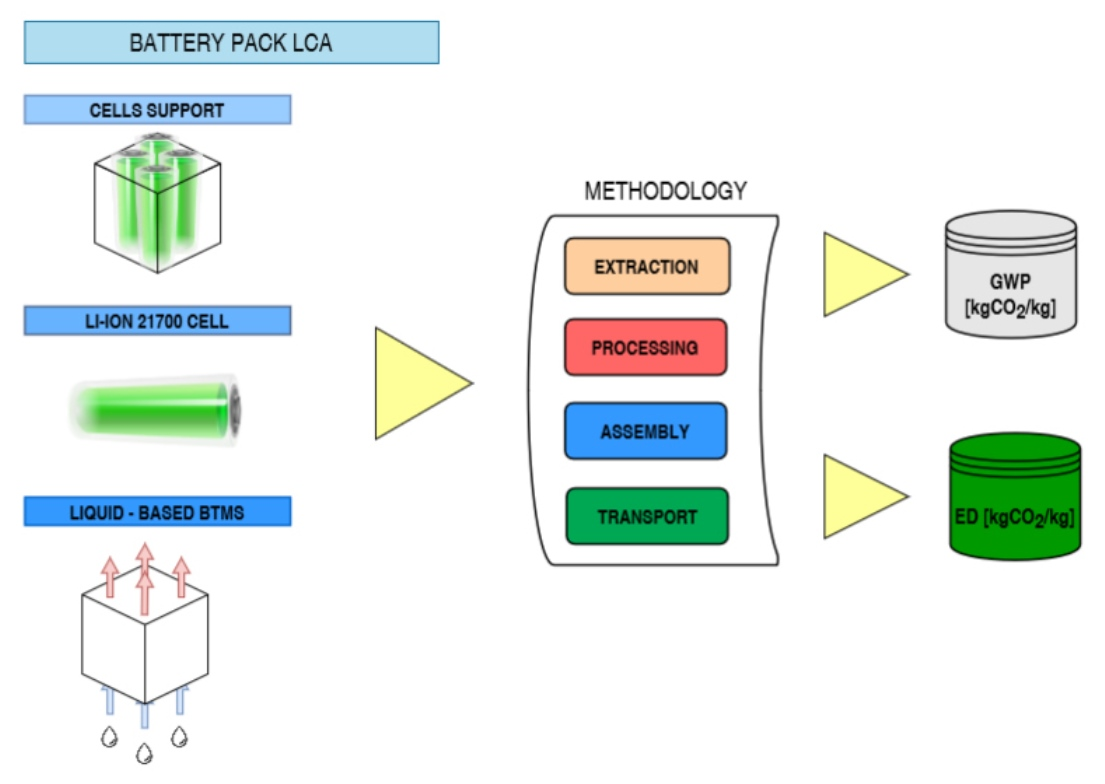
The system boundary of the study comes from a cradle-to-gate approach: it starts with the extraction of the raw materials and ends with the assembly of the BP module. Figure 3 depicts the system boundary and shows the details of the sections present in this work.
3. Results
3.1. Cell Support
3.1.1. Cell Support: Raw Material Extraction and Processing
Aluminum The production processes involving the primary aluminum are the bauxite extraction, the Bayer (the conversion from bauxite to alumina), and the Hall–Héroult process (the smelting of the alumina into molten cryolite, followed by the electrolysis of the molten salt bath) [63]. Then comes the T6 temper, a heat treatment which consists of two phases: the quenching (a heating process followed by a sudden cooling) and the artificial ageing [64]. The related to the aluminum cutting process is considered negligible.
POM A block of 4 kg of material is obtained starting from the coarse powder, thanks to a molding process [65]. Then, the block is machined with a CNC miller, removing the chips. During the machining process there is an 80% volume reduction: in order to obtain a realistic analysis, the overall machining process is split into a coarse machining for the 85% of the removed volume, and a fine machining for the 15% of it, resulting in a matrix of 0.8 kg.
ABS The UL 94 V0 is chosen according to the Standard for Safety of Flammability of Plastic Materials: this kind of ABS shows great performances in case of fire emergency, succeeding in stopping the burning process on a vertical specimen within 10 s [66]. The ABS processes deal with a coarse powder molding phase carried on with a hot chamber injection molding method [65]: this means that the ABS gross mass before the process is equal to the ABS net mass after the injection.
3.1.2. Cells Support: Material Transportation
The transportation impact is evaluated considering a diesel powered IVECO ECOSTRALIS Active AS truck for the road transport (whose maximum payload is 10,200 kg) and a HFO powered MAN S90ME-C9.2-GI ship for the sea transport, a 8000 TEU (Twenty-foot Equivalent Unit) cargo provided with a two-stroke marine engine [72]. The 1 TEU represents the dimension of an ordinary container whose maximum payload is 24,000 kg. As the LiBER headquarter is based in Bologna (Emilia-Romagna, Italy), this has influenced the choice of where stocking up the materials, aiming to obtain as low transport emissions as possible. The data related to the impact of the transportation means are shown in Table 2 and Table 3.
Regarding the aluminum transportation impact, two options are considered. The first one involves the transport of the Al6065: this kind of metal is that selected for the real LiBER brick but it is expected that it gives a remarkably negative contribution to the emissions due to the distance of the current stocking up site (Jiangsu, China). The second option is the Al6063: with almost the same mechanical and physical characteristics of the Al6065, this metal can be a possible substitute as it is available in Italy (San Colombano al Lambro). Regarding the plastic materials, both the ABS and the POM are available in Italy at a relatively short distance from Bologna. The calculations for the transport emissions are shown step by step into the Supplementary Materials, to be taken as example for all the other transport contributions.
Aluminum 6065 Choosing the Al6065 it is necessary to use both the cargo ship and the truck to import the material from China (total distance = 19,535 km). The calculations for the transport evaluation impact are reported in the Supplementary Materials. The overall and specific values for the Al6065 are the sum of the cargo and the truck contributions: GWPs,Al6065 = 0.366 kgCO2/kgAl, EDs,Al6065 = 2.579 MJ/kgAl.
Aluminum 6063 With the same logic, the and values are calculated for the Al6063, considering a travel distance struck = 175 km. In this case GWPs,Al6063 = 0.013 kgCO2/kgAl, EDs,Al6063 = 0.196 MJ/kgAl.
POM Studying the most common trade routes, it is assumed that the POM comes from Brescia (Italy) and travels along the Brescia–Minerbio–Bologna route (sPOM = 238 km). Considering this, the specific and the overall and values are calculated obtaining: GWPTOT,POM = 189 kgCO2, GWPs,POM = 0.018 kgCO2/kgPOM, CEDPOM = 2723.4 MJ, EDs,POM = 0.267 MJ/kgPOM.
ABS Brescia is chosen as stocking up site for the ABS too but, this time, following the route Brescia–Ravenna–Bologna (sABS = 353 km). For the ABS it is found: GWPTOT,ABS = 280.63 kgCO2, GWPs,ABS = 0.028 kgCO2/kgABS, CEDABS = 3978 MJ, EDs,ABS = 0.390 MJ/kgABS.
3.2. Li-Ion Cells
3.2.1. Li-Ion Cells: Raw Material Extraction
Aluminum For the aluminum extraction it is found that GWPs,Al = 0.078 kgCO2/kgAl; EDs,Al = 1.040 MJ/kgAl [68].
Copper The copper extraction process first involves sulphide ores which, then, are processed to become pure copper (Section 3.2.2). For the copper (sulphide ores) extraction, it is estimated that GWPs,Cu = 1.20 kgCO2/kgCu; EDs,Cu = 28.3 MJ/kgCu [74].
Lithium Lithium is usually obtained via brine evaporation or it is extracted mining a pegmatite rock (spodumene or petalite) [75]. A brine extraction is possible in presence of saline lakes, seawater, saline sedimentary basins, and wherever high--concentration solutions are available. This extraction method is based on the natural ores leaching from the Andes mountain range, accumulated underground as brines [76] and then pumped to the surface [77]. The brine is stored inside open pools under the sun, so that the salt concentration increases thanks to the evaporation. The Chilean brines located in the Atacama desert are natural water solutions characterized by the highest content of and P and represent the largest lithium extraction site in the world [76] (from 70% up to 80% of lithium is recovered from brines located in the so-called South America’s lithium triangle of Chile, Argentina and Bolivia [78,79]).
In Figure 6, this geographical area is shown and the most important extraction sites are put in evidence. The exploitation of spodumene or petalite ores happens in open-pit mines and it is more common in countries, such as Bolivia, Zimbawe, Australia, Canada, and Portugal. Both of these extraction methods lead to obtain lithium carbonate (Li2CO3) and are not so different in terms of environmental impact [75,80] considering favorable weather conditions. On the contrary, Stamp et al. [80] demonstrates that unfavorable conditions, such as the solar discontinuity and the consequent inefficient evaporation, make the ore extraction choice the best one. In this LCA study, a brine extraction carried on with favorable conditions is considered and it is found GWPs,Li = 4.50 kgCO2/kgLi [77,81]; EDs,Li = 31.15 MJ/kgLi [80]. The choice of the Atacama desert as lithium extraction site represents an important contribution in terms of transportation impact (Section 3.2.4). To minimize the emissions coming from the transport of the other raw materials for the cells it is considered that these elements are all available in Chile. This is a reasonable hypothesis considering how rich is the Chilean land in terms of ores and metals [82,83,84,85].
Cobalt This element is produced worldwide as a byproduct of copper, nickel and silver, and copper-cobalt ores are the most common source where it is possible to extract this material [86]. Cobalt is never used alone but it is needed to produce NMC powder, starting from cobalt(II) sulfate () which is then mixed with nickel(II) sulfate (), manganese(II) sulfate () and other chemical compounds present in lower quantities. For the cobalt extraction it is found GWPs,Co = 38 kgCO2/kgCo; EDs,Co = 653 MJ/kgCo [87].
Manganese This is a very abundant element on Earth, available in more than 30 countries. The manganese is extracted from open-pit mines where there is usually a mixture of several manganese oxides, such as pyrolusite, romanechite, manganite: considering the battery cells, the manganese is used as , that is the pyrolusite composition. After the extraction, several steps follow (beneficiation, smelting, refining [75]) before obtaining the manganese. The final results for the extraction are: GWPs,Mn = 6.20 kgCO2/kgMn [75]; EDs,Mn = 16.5 MJ/kgMn [88].
Nickel Nickel is the most important material in terms of cathode mass: as a matter of fact, a NMC cathode is 80% nickel made [89]. Further, it is a natural source and so fully recyclable, not showing quality and performance decrease issues. For the nickel extraction there is GWPs,Ni = 8.84 kgCO2/kgNi; EDs,Ni = 155 MJ/kgNi [90].
Graphite This is the most stable form of coal (in standard conditions) and it is possible to extract it from open-pit mines or from the underground. There are two kind of graphite, the natural and the synthetic one: both produce almost the same emissions [91]. Considering the Molicel datasheet [60], synthetic graphite is chosen as anode constituent for this study. For the synthetic graphite extraction it is found GWPs,C = 1.80 ÷ 8.20 kgCO2/kgC [75]; EDs,C = 4.80 ÷ 5.20 MJ/kgC [86].
All the results regarding the extraction impact related to the materials needed for the cells are collected in Table 5 which shows the values of both and .
3.2.2. Li-Ion Cells: Material Processing
Lithium carbonate Once the brine is stored in the open pools (Section 3.2.1) the purification occurs (it takes about one year): this is the phase when the lithium concentration increases [77]. Then, a carbonation process follows [80]: this chemical reaction involves lithium () and sodium carbonate (Na2CO3), producing lithium carbonate (Li2CO3) whose production chain proceeds with the compound filtration and washing and, finally, it ends with the packaging phase. For the Li2CO3 processing it is: GWPs,Li2CO3 = 2.02 kgCO2/kgLi2CO3; EDs,Li2CO3 = 28.43 MJ/kgLi2CO3 [80]. Li2CO3 is then used in the chemical processes to obtain the cathode powders.
Anode graphite powder The synthetic graphite preparation deals with several phases, such as the initial petroleum coke grinding and sizing, and the following mixing where the coke is blended with pitch in the desired proportion. After an extrusion process, the mixture is heated at 800 ÷ 1000 °C in a natural-gas-fired furnace. This baking phase is often doubled, putting in the middle a further impregnation phase: the mixture is blended with more pitch to improve the final graphite properties. Finally, the graphitization occurs: this fully electricity powered phase slowly brings the product to 3000 °C, so the graphite crystal formation can start [86]. For the anode graphite processing it is: GWPs,gr = 4.86 kgCO2/kggr; EDs,gr = 89.87 MJ/kggr [91].
Copper anode current collector After the extraction of the sulphide ores, several processing stages occur: the beneficiation to transform the ores into a slurry [75], the drying and the smelting. Then, for the copper anode collector a refining phase is fundamental. All the aforementioned stages and the related impacts are discussed more in detail in the Supplementary Materials. For the copper current collector processing it is found: GWPs,Cuanod = 4.1 kgCO2/kgCuanod; EDs,Cuanod = 47 MJ/kgCuanod [92].
Cathode Ni–Mn–Co powders The most common cathode composition in NMC batteries is that of the NMC111 cells (also called NMC333) which means that the –– blend is in the ratio 1:1:1 [93,94]. Regarding the impact evaluation of the cathode powder, discordant results are present in the literature if considering analytical [95] or experimental investigations [91]: experimental results are taken into account in this paper and the detailed reactions to obtain these powders are discussed in the Supplementary Materials. For the –– cathode powders processing it is GWPs,Ni–Mn–Co = 16.11 kgCO2/kgNi–Mn–Co; EDs,Ni–Mn–Co = 231.28 MJ/kgNi–Mn–Co [91].
Aluminum cathode current collector The raw aluminum is processed (see Section 3.1.1) till reaching the ingot casting [75]. Then, the ingot has to be processed too as the thickness of the final product has to decrease until about 10 ÷ 20 μm [96]. To do this, multiple rolling stages are necessary. The aluminum rolling exploits steel rolls to dramatically reduce the ingot thickness which usually ranges from 0.46 m to 0.76 m [68]. All the aluminum rolling operations are deepened into the Supplementary Materials. Considering all the processes after the mining until the rolling (included), results are: GWPs,Alcath = 8.86 kgCO2/kgAlcath; EDs,Alcath = 137.06 MJ/kgAlcath [68].
PP and PE separators As the separator is 50% PP and 50% PE made, both kinds of plastic processes are considered so that GWPs,PP = 2.53 kgCO2/kgPP; EDs,PP = 78.59 MJ/kgPP; GWPs,PE = 2.93 kgCO2/kgPE; EDs,PE = 80.96 MJ/kgPE [91].
Electrolyte salt The electrolyte salt is made of lithium hexafluorophosphate (): it is the reaction product between the phosphorous pentafluoride () and the lithium fluoride () previously dissolved in hydrogen fluoride () [97]. For the electrolyte salt processing it is: GWPs,LiPF6 = 12.15 kgCO2/kgLiPF6; EDs,LiPF6 = 179.07 MJ/kgLiPF6 [91].
DMC and EC electrolyte solvents Mixing DMC and EC with allows increasing the permittivity of the electrolyte salt [98]. For the electrolyte solvent processing it is found: GWPs,DMC = 1.72 kgCO2/kgDMC; EDs,DMC = 37.44 MJ/kgDMC; GWPs,EC = 0.47 kgCO2/kgEC; EDs,EC = 10.19 MJ/kgEC [91].
All the results regarding the processing impact related to the material transformations needed for the cells are collected in Table 5.
3.2.3. Li-Ion Cells: Product Assembly
The manufacturing of the cells is carried out in a large scale and fully automated production site. The process consists of several operations, such as the manufacturing of the electrodes, and the assembly and the finishing of the cells [99]. Independently from the shape of the cells (cylindrical, pouch, prismatic) the electrodes manufacturing always includes the following steps: the mixing of the powders with additives using intensive mixers and dispersers; the coating of the and electrode foils (the collectors) with the powder mixture already obtained (Section 3.2.2); the drying of the resulting collectors, a thermal cycle (50 ÷ 180 °C) useful to improve the quality of the coating and the finishing of the surface; the calendering (compression and cleaning) and the slitting (cutting, cleaning and winding) stages. In a NMC111 cell with a graphite anode, the higher active mass of the cathode with respect to the anode one results in lower values for the anode manufacturing stages. The subsequent steps are specific for cylindrical cells and deal with the assembly of the cells: the winding of the electrodes with the separator (realization of the jelly roll); the packing during which the jelly roll is inserted into the nickel plated steel casing, welded to its top and bottom and sealed in it; the vacuum and the under-pressure filling processes to inject a precise amount of electrolyte into the cell by means of vibrating tables; the final cell sealing. Regarding the finishing operations for cylindrical cells there are the SEI (solid electrolyte interphase) formation; the ageing process at high (30 ÷ 50 °C) or environmental temperatures which lasts 1.5–3 weeks; the quality control (tests about the cell characterization); and other possible complementary steps to manage the air conditions inside the clean rooms used for the assembly process. Considering literature results [45,99] normalized for 1 Wh cells and scaling them for this case study about INR 21700 P42A cells (15.12 Wh/cell), it is possible to estimate the values in terms of Wh and then converting them into to know how much energy per cell (MJ/cell) is used. Among all the contributions it has to be highlighted that the drying one is the less precise as strongly influenced by the environmental conditions and the machines used. As a matter of fact, literature data related to this process greatly differ from each other. The estimation of the values is much more difficult due to the lack of papers which deepen the assembly emissions. The reason is that it is hard to obtain reasonable average values which take into account all the different existent technologies used for these stages. Further, the complexity in evaluating the power needed by all the machines (mixers, centrifuges, ovens) and the fact that they rarely work at standard conditions and/or continuously (sometimes they are in standby) make the evaluations even harder. Results in Table 6 are referred to by a single cell, the weight of which is wcell = 70 g [100], so the approximated and values related to 1 kg of cells are EDassem = 28.84 MJ/kgcell GWPassem = 0.9929 kgCO2/kgcell. For the same reason as is explained in Section 3.2.1, to lower the transportation impact the whole cell assembly process is intended as completely carried out in Chile. In this way, it is possible not to consider transportation impacts related to the routes from the assembly sites (different from Chile) to the purchaser location (Bologna). The assumption of a single geographical site as an extraction, processing, and assembling place is reasonable considering the increasing amount of companies and institutions which commission investigations about the economical benefits coming from this strategy [79]. Results related to the impact of the electrode manufacturing (EM), the cells assembly (CA), and cells finishing (CF) are shown in Table 6.
3.2.4. Li-Ion Cells: Product Transportation
In this evaluation, the same logic used for the cells support transportation impact (Section 3.1.2) is followed. Among the most common existing trade routes, the chosen one is Santiago de Compostela (Chile) to Rio Grande do Sul (Brasil) to Antwerp (Belgium) to Bologna (Italy), with the first and the third road stages and one sea stage in the middle. The and values related to the transportation impact of the cells are collected in Table 7 considering all the travelled stages by truck or cargo: the first road stage T1, the second sea stage C and the third road stage T2 (see Supplementary Materials for the all the partial and contributions).
The overall results related to the cells raw materials extraction and processing, to the product assembly and transportation are shown in Figure 7.
3.3. BMS
3.3.1. BMS: Raw Material Extraction and Processing
The circuits and components of the electronic boards are made of copper, aluminum, silicon, and ceramic (X7R) and the boards are realized with glass-reinforced laminate material (FR4). For the evaluations of the copper and the aluminum extraction and processing, the discussion presented in Section 3.2.1 and Section 3.2.2 is taken as reference. The X7R is a multi-layer material used for the capacitors electrodes. It is composed of barium carbonate (), titanium (IV) oxide (), dysprosium(III) oxide (Dy2O3), and borosilicate glass. There is also the usage of a solvent (methyl ethyl ketone), a cationic polymeric dispersant (Hypermer KD1), a plasticizer (PEG-400), and a binder (Butvar). The total carbon footprint is GWPs,BMS,X7R = 4.19 kgCO2/kgX7R [101]. The process for the X7R production involves a drying and a sintering stage, with a correspondent energy demand value of EDs,BMS1,X7R = 79.56 MJ/kgX7R. To produce X7R capacitors some auxiliary processes are needed, such as milling and tape-casting: their contribution is equal to EDs,BMS2,X7R = 12.24 MJ/kgX7R. All the results regarding the raw material extraction and processing impacts related to the BMS are collected in Table 8.
3.3.2. BMS: Product Transportation
The city of Regensburg (Germany) is chosen as a FR4 production site as it represents the headquarter of one of the biggest factories in Europe. The distance from Regensburg to Bologna is equal to 692 km and for this route it is found: EDs,BMS = 0.76 MJ/kgBMS and GWPs,BMS = 0.054 kgCO2/kgBMS. As links and BMS boards contain 129 g and 20 g of FR4, respectively, (the 1.31 × 10 −3% and the 2 × 10 −4% of the truck payload) and considering th transportation of some other additional components (1.5 × 10 −3% of the payload), the emissions related to the transportation of each brick are summarized in Table 9.
3.4. BTMS
3.4.1. BTMS: Raw Material Extraction and Processing
The state of the art about the silicone rubber production impact does not provide any information about the and values which regard the transformation of the raw materials alone: the majority of the papers propose data related to the extraction of the raw materials and their processing together. There are lots of stages before arriving at the silicone rubber tube production: the whole process starts with a thermal phase which involves the silicon(IV) oxide () and allows to obtain silicon metal; then, several other chemical and mechanical processes occur with a descending energy requirement [102]. One of the final products is the silicone rubber, the material used to produce the silicone rubber tubes by extrusion. In the Supplementary Materials the attention is focused on the reaction as it is the most energy-intensive process due to the exploitation of a submerged arc furnace (SAF). The overall and values reported in Table 10 regard the entire silicone rubber tube production. Thanks to openLCA (an open source software useful to conduct LCA studies) [103] and exploiting the ELCD and the Idemat databases, for the final silicone rubber tube it is found: GWPs,tube = 3.745 kgCO2/kgtube; EDs,tube = 118.920 MJ/kgtube (Table 10).
3.4.2. BTMS: Product Transportation
The selected silicone rubber supplier is located in Milan (Italy) so the transport impact concerns just a road travel (216 km). For the route Milano-Bologna it is found: GWPs,tube = 0.017 kgCO2/kgtube; EDs,tube = 0.237 MJ/kgtube (Table 10).
High values of and are shown in Table 10 regarding the material extraction and processing to realize the silicone rubber tube of the BTMS. In this case energy-intensive thermal and chemical processes are exploited to obtain the final product, so the aim of reducing the energy demand represents a hard challenge. Further, the use of the SAF does not help in lowering the : to face this problem, some effectiveness cutting-edge filters [104] can be used both to reduce emissions and to recycle it, transforming this end-of-life (EoL) product in feeding material for the life cycle of a new product.
3.5. Container
3.5.1. Container: Raw Material Extraction and Processing
Composites are made of two or more different materials (fibers and reinforcements), their production techniques are different from the more ordinary ones (metal or polymer processes) and the production rates are not so high. Energy-intensive chemical processes are necessary to realize thermosetting and thermoplastic polymer matrices (the reinforcements) for composite structures, such as the container one. However there are some thermosetting polymers, including polyester and epoxy resins (often used in fiber-reinforced composites), which present relatively low energy intensity values [105]. Once prepared the matrices and after obtaining the fibers there are further stages, such as the textile manufacturing and the pre-preg preparation needed before the fibers are reinforced with the matrix. The impacts related to the raw materials extraction and processing for the BP container results to be: GWPs,cont = 9.104 kgCO2/kgcont and EDs,cont = 169.69 MJ/kgcont (Table 11).
3.5.2. Container: Product Transportation
The selected poltruded composite structure supplier is located in Milan (Italy), so the results found in Section 3.4.2 for the BTMS transportation impact are valid for the container transportation impact, too (Table 11).
3.6. Module Assembly
The LiBER BP module is assembled according to a semi-automatic procedure. In the first automated line, the cells are captured by a Delta robot and placed in the cells support. The electrodes are then laser welded on the PCB. The more energy-intensive stages are those related to the cells placement and to the electrodes welding but the overall of these processes is negligible if compared with the contributions assessed in the previous sections. The brick obtained with this automated process is then moved by an operator and inserted into the module container. The whole process is highly innovative and does not require any wires welding. The bricks are easily removable from the final assembly as the entire product is designed with a circular economy approach.
4. Discussion
The results presented in the previous sections can be referred to the whole BP, visualizing the contributions of the five sub-systems, and then discussing the possible strategies to reduce the overall environmental impact. The results related to the entire BP are collected in Table 12 and shown in Figure 8 per unit of energy.
The contribution of the cells is the most relevant due to the results obtained for the extraction of the raw materials (Table 5). For instance, cobalt extraction has a deep impact in terms of both and , followed by the nickel which has a high value, too. These are two fundamental elements to produce the cathode powder for the NMC111 cells, so it is not possible to lower this contribution if the use of this kind of cells is mandatory for the application. However, when it is possible to use another type of NMC cells, the more innovative NMC622 or NMC811 batteries represent a better choice. The NMC622 cathode is composed of 60% of , 20% of , and 20% of ; the NMC811 cathode is composed of 80% of , 10% of , and 10% of . Both of them have a lower weight (lower transport impact) and a higher energy density with respect to the NMC111. The extremely reduced quantity of in NMC811 cells, their lowest weight and highest energy density may suggest that this is the best choice. However, on the other hand, the high percentage is responsible for a more sensitive chemistry and, consequently, the need of additional post-processing phases and a more expensive manufacturing process [94]. Plus, NMC811 cells are sensitive to moisture and air so, in an automotive application, a further sealed structure would be necessary to insulate them from the outside. All these additional processes and components would increase the and values, nullifying the benefits brought by the lower percentage. From this point of view, the NMC622 represent a good compromise and this is the reason why the Molicel cells have been chosen for the LiBER BP.
About the processing of the cells materials (Table 5), results show high values of and for several processed materials, but it is possible to lower only some of them. One of the initial assumptions is considering the separator as 50% PP-made and 50% PE-made, but looking at the related and , the results show that the use of a 100% PP-made separator brings to a decrease in both energy demand () and emissions (). A similar evaluation can be completed regarding the electrolyte solvent which is considered 50% DMC-made and 50% EC-made. The use of a 100% EC-made electrolyte solvent brings to a great decreasing of both energy demand () and emissions (). The processes regarding the anode and the cathode powders and collectors, as well as the electrolyte salt production are very energy-intensive as they include several thermal, chemical, and electrochemical phases. As these treatments are fundamental for the quality of the final components, the only possible choice to lower the energy demand is the exploitation of the most efficient available industrial plants. Although during the assembly phase there are stages with a higher impact than others, the final and values do not deeply influence the overall results of the LCA study. For this reason, and also because the assembly impact is extremely dependant from several hardly predictable factors, a more effective strategy to lower the whole cycle and is focusing on the other more manageable production steps. Considering the assumption of the cells assembled in Chile, the transportation impact includes both truck and cargo stages. As seen before, the sea transport is a better choice than the road one: although the total distance travelled by the truck (3694 km) represents the 50.68% of the distance travelled by the cargo (7289 km), the sea transport results in great and decreases equal to and . So, the more it is possible to exploit the sea transport, the better is in terms of impact. Figure 7 shows that the impact of the cells support is about the 20% of the total ED.
Looking at the results obtained for the extraction and production of the aluminum needed to realize the cells support (Table 1) it is clear that innovative technologies to process the aluminum could represent an efficient solution to lower the value instead of proceeding with the ordinary and energy-intensive methods (Bayer and Hall–Héroult processes, Section 3). Cutting-edge technologies would be also promising to reduce the emissions. Regarding the plastic material for the cells support, the choice is driven by both the and the value. As a matter of fact, comparing for POM and ABS in Table 1, results show the values 18.17 kgCO2/brick for POM and 4.25 kgCO2/brick for ABS, with a percentage decreasing choosing ABS. Considering in Table 1, the obtained values 415.52 MJ/brick for POM and 99.08 MJ/brick result in a percentage decreasing with ABS. The ABS is definitely the best choice in terms of both and . Analyzing the transportation impact for the materials of the cells support, regarding the aluminum it clearly appears that choosing Al6063 instead of Al6065 represents the more convenient option considering both the energy demand and the emissions. Indeed, the overall Al6063 results to be 0.2 MJ/kgAl6063 instead of 2.58 MJ/kgAl6065 for Al6065, with a percentage decrease and the overall Al60603 results to be 0.01 kgCO2/kgAl6063 instead of 0.36 kgCO2/kgAl6065 for Al6065, with a percentage decrease . However, it has to be highlighted how convenient is the cargo transport with respect to the truck one. Focusing on the Al6065 impact values, the results show that the for the cargo stage is higher by 50% than that related to the truck stage but the distance travelled by the truck is just the 8.01% of the cargo distance. Further, the for the cargo stage is lower by 50% than that related to the truck stage. Hence, if it is possible to choose between a road or a sea transportation, it should be better to go for the second option. Finally, also the module composite container shows a relevant impact (see Figure 7). To lower the environmental impact coming from the composite goods production, EoL recycling stages are fundamental and increasingly adopted as effective strategy [106]. However, there is still a lot to do in the energy saving direction for composite materials. In particular, considering lower energy-intensive composites processes and the production of more sustainable matrices, such as bio-based resins, further investigation needs to be performed to optimize this production field, trying to overcome the existent drawbacks [107].
5. Conclusions
The whole life cycle of a LiBER BP unit has been studied, carrying on a LCA evaluation with a cradle-to-gate approach whose result is a series of estimations and suggestions useful to lower both the and the of the entire product chain supply. Five main research macro-topics are considered: the cells support, the Li-ion cells, the BMS, the liquid cooling BTMS and the BP container. After discussing about reasonable assumptions useful for the assessment, the environmental impacts are evaluated focusing on the raw materials extraction and the processing, the assembly of the components and the transportation of the final products. The resulting interpretation proposes alternative methods and choices that can be performed to lower the energy demand and the emissions, such as using the ABS instead of the POM as material for the cells support, preferring the sea transport with respect to the road one, choosing low-cobalt cells, using the PP instead of the PE for the separator and the EC instead of the DMC for the electrolyte salt. Finally, good practices would be trying to avoid the extraction and processing of the materials by means of obsolete machines and installing a recycling line in the production plants. The majority of the thermal, chemical, and processes electrochemical are characterized by energy-intensive phases but the choice of cutting-edge technologies could represent a key against the high values of and . The analysis highlights the importance of extending the life span of battery components through the reuse of parts. In this perspective, there are not only possible technological changes but also a mindset switch towards a new cycle of thinking, considering the EoL products as feedstock for the life cycle of the new products.
Supplementary Materials
The following supporting information can be downloaded at: https://www.mdpi.com/article/10.3390/batteries8080076/s1.
Author Contributions
Conceptualization, M.F. and N.F.Q.; methodology, M.F. and N.F.Q.; software, M.F. and N.F.Q.; investigation, M.F. and N.F.Q.; resources, M.F. and N.F.Q.; data curation, M.F., N.F.Q. and B.P.; writing, M.F.; editing, M.F. and N.F.Q.; review, M.F., N.F.Q., B.P. and C.R. All authors have read and agreed to the published version of the manuscript.
Funding
This research has received funding in the frame of the Emilia-Romagna Regional development fund POR-FESR 2014-2020 Program under the LiBER project.
Institutional Review Board Statement
Not applicable.
Informed Consent Statement
Not applicable.
Acknowledgments
The authors would like to thank Davide Pontara, Matteo Marano, Luca Frigerio, and Tommaso Brugo for their support.
Conflicts of Interest
The authors declare no conflict of interest.
Abbreviations
The following abbreviations are used in this manuscript:
| ABS | Acrylonitrile butadiene styrene |
| BP | Battery pack |
| BTMS | Battery thermal management system |
| CA | Cells assembly |
| CED | Cumulative energy demand |
| CF | Cells finishing |
| CTC | Cradle-to-cradle |
| CTG | Cradle-to-grave |
| DMC | Dimethyl carbonate |
| ED | Energy demand |
| EC | Ethylene carbonate |
| EM | Electrode manufacturing |
| EoL | End of life |
| EV | Electric vehicle |
| GWP | Global warming potential |
| HFO | Heavy fuel oil |
| ILCD | International Reference Life Cycle Data System |
| ISO | International Organization for Standardization |
| LCA | Life cycle assessment |
| LCI | Life cycle inventory |
| LCIA | Life cycle impact assessment |
| LCT | Life cycle thinking |
| LIB | Lithium-ion battery |
| LiBER | Lithium Battery for Emilia–Romagna |
| NMC | Nickel Manganese Cobalt oxide |
| PCB | Printed circuit board |
| PE | Polyethylene |
| POM | Polyoxymethylene |
| PP | Polypropylene |
| PVDF | Polyvinylidene fluoride |
| SAF | Submerged arc furnace |
| SEI | Solid electrolyte interface |
| TEU | Twenty-foot Equivalent Unit |
| UNEP | United Nations Environment Programme |
References
- European Commission. Communication from the Commission to the European Parliament, the Council, the European Economic and Social Committee and the Committee of the Regions; Towards a Comprehensive Climate Change Agreement in Copenhagen; Additional Background Information; European Commission: Brussels, Belgium, 2009. [Google Scholar]
- Economia Circolare—Perché “Circolare”; Circular Economy Network: Rome, Italy, 2018.
- JCR. ILCD Handbook: General Guide for Life Cycle Assessment—Provisions and Action Steps; Publications Office of the European Union: Luxembourg, 2010. [Google Scholar]
- Ellen MacArthur Foundation. Towards a Circular Economy: Business Rationale for an Accelerated Transition; Ellen MacArthur Foundation: Cowes, UK, 2015. [Google Scholar]
- Schulz, M.; Bey, N.; Niero, M.; Hauschild, M. Circular economy considerations in choices of LCA methodology: How to handle EV battery repurposing? Procedia CIRP 2020, 90, 182–186. [Google Scholar] [CrossRef]
- Ashkin, S. Cradle to Grave vs. Cradle to Cradle; ClearLink: Salt Lake City, UT, USA, 2008. [Google Scholar]
- Li, J.; Xiong, F.; Chen, Z. An integrated life cycle and water footprint assessment of nonfood crops based bioenergy production. Sci. Rep. 2021, 11, 3912. [Google Scholar]
- Gerbens-Leenes, W.; Berger, M.; Allan, J.A. Water footprint and life cycle assessment: The complementary strengths of analyzing global freshwater appropriation and resulting local impacts. Water 2021, 13, 803. [Google Scholar] [CrossRef]
- Trevisan, L.; Bordignon, M. Screening Life Cycle Assessment to compare CO2 and Greenhouse Gases emissions of air, road, and rail transport: An exploratory study. Procedia CIRP 2020, 90, 303–309. [Google Scholar] [CrossRef]
- Corti, A.; Lombardi, L. End life tyres: Alternative final disposal processes compared by LCA. Energy 2004, 29, 2089–2108. [Google Scholar] [CrossRef]
- Laitala, K.; Klepp, I. Clothing disposal habits and consequences for life cycle assessment (LCA). In Handbook of Life Cycle Assessment (LCA) of Textiles and Clothing; Elsevier: Amsterdam, The Netherlands, 2015; pp. 345–365. [Google Scholar]
- McDonough, W.; Braungart, M. Cradle to Cradle: Remaking the Way We Make Things; North Point Press: New York, NY, USA, 2002. [Google Scholar]
- Matthews, H.; Hendrickson, C.; Matthews, D. Life Cycle Assessment: Quantitative Approaches for Decisions That Matter; CRC Press: Boca Raton, FL, USA, 2018. [Google Scholar]
- Khoo, H.H.; Isoni, V.; Sharratt, P.N. LCI data selection criteria for a multidisciplinary research team: LCA applied to solvents and chemicals. Sustain. Prod. Consum. 2018, 16, 68–87. [Google Scholar] [CrossRef]
- Lupton, R.C.; Allwood, J.M. Hybrid Sankey diagrams: Visual analysis of multidimensional data for understanding resource use. Resour. Conserv. Recycl. 2017, 124, 141–151. [Google Scholar] [CrossRef]
- Baumann, H.; Tillman, A.M. The Hitch Hiker’s Guide to LCA: An Orientation in Life Cycle Assessment Methodology and Application; Studentlitteratur AB: Lund, Sweden, 2004. [Google Scholar]
- Sazdovski, I.; Bala, A.; Fullana-i Palmer, P. Linking LCA literature with circular economy value creation: A review on beverage packaging. Sci. Total Environ. 2021, 771, 145322. [Google Scholar] [CrossRef] [PubMed]
- Scheepens, A.; Vogtländer, J.; Brezet, J. Two life cycle assessment (LCA) based methods to analyse and design complex (regional) circular economy systems. Case: Making water tourism more sustainable. J. Clean. Prod. 2016, 114, 257–268. [Google Scholar] [CrossRef]
- Henry, B.; Russell, S.; Ledgard, S.; Gollnow, S.; Wiedemann, S.; Nebel, B.; Maslen, D.; Swan, P. LCA of wool textiles and clothing. In Handbook of lIfe Cycle Assessment (LCA) of Textiles and Clothing; Elsevier: Amsterdam, The Netherlands, 2015; pp. 217–254. [Google Scholar]
- Linhares, T.; de Amorim, M.T.P. LCA of textile dyeing with Acacia Dealbata tree bark: A case study research. Procedia Eng. 2017, 200, 365–369. [Google Scholar] [CrossRef]
- Lamnatou, C.; Ezcurra-Ciaurriz, X.; Chemisana, D.; Plà-Aragonés, L. Life Cycle Assessment (LCA) of a food-production system in Spain: Iberian ham based on an extensive system. Sci. Total Environ. 2022, 808, 151900. [Google Scholar] [CrossRef] [PubMed]
- Notarnicola, B.; Tassielli, G.; Nicoletti, G. Life cycle assessment (LCA) of wine production. Environ.-Friendly Food Process. 2003, 306, 326. [Google Scholar]
- Aganovic, K.; Smetana, S.; Grauwet, T.; Toepfl, S.; Mathys, A.; Van Loey, A.; Heinz, V. Pilot scale thermal and alternative pasteurization of tomato and watermelon juice: An energy comparison and life cycle assessment. J. Clean. Prod. 2017, 141, 514–525. [Google Scholar] [CrossRef]
- Andersson, K.; Ohlsson, T.; Olsson, P. Screening life cycle assessment (LCA) of tomato ketchup: A case study. J. Clean. Prod. 1998, 6, 277–288. [Google Scholar] [CrossRef]
- Amienyo, D.; Camilleri, C.; Azapagic, A. Environmental impacts of consumption of Australian red wine in the UK. J. Clean. Prod. 2014, 72, 110–119. [Google Scholar] [CrossRef]
- Amienyo, D.; Azapagic, A. Life cycle environmental impacts and costs of beer production and consumption in the UK. Int. J. Life Cycle Assess. 2016, 21, 492–509. [Google Scholar] [CrossRef]
- André, H.; Söderman, M.L.; Nordelöf, A. Resource and environmental impacts of using second-hand laptop computers: A case study of commercial reuse. Waste Manag. 2019, 88, 268–279. [Google Scholar] [CrossRef]
- Samani, P.; van der Meer, Y. Life cycle assessment (LCA) studies on flame retardants: A systematic review. J. Clean. Prod. 2020, 274, 123259. [Google Scholar] [CrossRef]
- Spreafico, C.; Russo, D. Exploiting the scientific literature for performing life cycle assessment about transportation. Sustainability 2020, 12, 7548. [Google Scholar] [CrossRef]
- Jakub, S.; Adrian, L.; Mieczysław, B.; Ewelina, B.; Katarzyna, Z. Life cycle assessment study on the public transport bus fleet electrification in the context of sustainable urban development strategy. Sci. Total Environ. 2022, 824, 153872. [Google Scholar] [CrossRef]
- Ercan, T.; Tatari, O. A hybrid life cycle assessment of public transportation buses with alternative fuel options. Int. J. Life Cycle Assess. 2015, 20, 1213–1231. [Google Scholar] [CrossRef]
- Nordelöf, A.; Romare, M.; Tivander, J. Life cycle assessment of city buses powered by electricity, hydrogenated vegetable oil or diesel. Transp. Res. Part D Transp. Environ. 2019, 75, 211–222. [Google Scholar] [CrossRef]
- Perčić, M.; Vladimir, N.; Fan, A. Techno-economic assessment of alternative marine fuels for inland shipping in Croatia. Renew. Sustain. Energy Rev. 2021, 148, 111363. [Google Scholar] [CrossRef]
- Perčić, M.; Vladimir, N.; Fan, A.; Jovanović, I. Holistic Energy Efficiency and Environmental Friendliness Model for Short-Sea Vessels with Alternative Power Systems Considering Realistic Fuel Pathways and Workloads. J. Mar. Sci. Eng. 2022, 10, 613. [Google Scholar] [CrossRef]
- Perčić, M.; Frković, L.; Pukšec, T.; Ćosić, B.; Li, O.L.; Vladimir, N. Life-cycle assessment and life-cycle cost assessment of power batteries for all-electric vessels for short-sea navigation. Energy 2022, 251, 123895. [Google Scholar] [CrossRef]
- Park, C.; Jeong, B.; Zhou, P.; Jang, H.; Kim, S.; Jeon, H.; Nam, D.; Rashedi, A. Live-Life cycle assessment of the electric propulsion ship using solar PV. Appl. Energy 2022, 309, 118477. [Google Scholar] [CrossRef]
- Del Pero, F.; Delogu, M.; Pierini, M. The effect of lightweighting in automotive LCA perspective: Estimation of mass-induced fuel consumption reduction for gasoline turbocharged vehicles. J. Clean. Prod. 2017, 154, 566–577. [Google Scholar] [CrossRef]
- dos Santos Pegoretti, T.; Mathieux, F.; Evrard, D.; Brissaud, D.; de França Arruda, J.R. Use of recycled natural fibres in industrial products: A comparative LCA case study on acoustic components in the Brazilian automotive sector. Resour. Conserv. Recycl. 2014, 84, 1–14. [Google Scholar] [CrossRef]
- Verma, S.; Dwivedi, G.; Verma, P. Life cycle assessment of electric vehicles in comparison to combustion engine vehicles: A review. Mater. Today Proc. 2021, 49, 217–222. [Google Scholar] [CrossRef]
- Candelaresi, D.; Valente, A.; Bargiacchi, E.; Spazzafumo, G. Life cycle assessment of hybrid passenger electric vehicle. In Hybrid Technologies for Power Generation; Elsevier: Amsterdam, The Netherlands, 2022; pp. 475–495. [Google Scholar]
- Vilaça, M.; Santos, G.; Oliveira, M.S.; Coelho, M.C.; Correia, G.H. Life cycle assessment of shared and private use of automated and electric vehicles on interurban mobility. Appl. Energy 2022, 310, 118589. [Google Scholar] [CrossRef]
- Arshad, F.; Lin, J.; Manurkar, N.; Fan, E.; Ahmad, A.; Tariq, M.-u.-N.; Wu, F.; Chen, R.; Li, L. Life Cycle Assessment of Lithium-ion Batteries: A Critical Review. Resour. Conserv. Recycl. 2022, 180, 106164. [Google Scholar] [CrossRef]
- Engels, P.; Cerdas, F.; Dettmer, T.; Frey, C.; Hentschel, J.; Herrmann, C.; Mirfabrikikar, T.; Schueler, M. Life cycle assessment of natural graphite production for lithium-ion battery anodes based on industrial primary data. J. Clean. Prod. 2022, 336, 130474. [Google Scholar] [CrossRef]
- Zackrisson, M.; Fransson, K.; Hildenbrand, J.; Lampic, G.; O’Dwyer, C. Life cycle assessment of lithium-air battery cells. J. Clean. Prod. 2016, 135, 299–311. [Google Scholar] [CrossRef]
- Degen, F.; Schütte, M. Life cycle assessment of the energy consumption and GHG emissions of state-of-the-art automotive battery cell production. J. Clean. Prod. 2022, 330, 129798. [Google Scholar] [CrossRef]
- Raugei, M.; Winfield, P. Prospective LCA of the production and EoL recycling of a novel type of Li-ion battery for electric vehicles. J. Clean. Prod. 2019, 213, 926–932. [Google Scholar] [CrossRef]
- LiBER—Lithium Battery Emilia Romagna. 2021. Available online: www.liberbattery.it (accessed on 12 June 2022).
- Rossi, C.; Pilati, A.; Marano, M. Electric Power Module and Method for Assembling It. U.S. Patent 17/255,176, 12 August 2021. [Google Scholar]
- Ragoni, E. L’auto Solare Emiliana che ha Conquistato l’America, Descritta da chi l’ha Progettata. Forbes. 8 June 2018. Available online: https://forbes.it/2018/08/06/lauto-solare-emiliana-che-ha-conquistato-lamerica-descritta-da-chi-lha-progettata/ (accessed on 12 June 2022).
- Rossi, C.; Bertoldi, M.; Fabbri, G.; Pontara, D.; Rizzoli, G. Experimental temperature modelization for solar racing vehicle. In Sustainable Design and Manufacturing 2017, Proceedings of the International Conference on Sustainable Design and Manufacturing, Bologna, Italy, 26–28 April 2017; Springer: Berlin, Germany, 2017; pp. 829–846. [Google Scholar]
- Fragassa, C. Progettare e costruire un auto solare. Il Progettista Industriale 2015, 2015, 50–54. [Google Scholar]
- Fragassa, C.; Pavlovic, A.; Minak, G. On the structural behaviour of a CFRP safety cage in a solar powered electric vehicle. Compos. Struct. 2020, 252, 112698. [Google Scholar] [CrossRef]
- Pavlović, A.; Sintoni, D.; Minak, G.; Fragassa, C. On the modal behaviour of ultralight composite sandwich automotive panels. Compos. Struct. 2020, 248, 112523. [Google Scholar] [CrossRef]
- Pavlovic, A.; Sintoni, D.; Fragassa, C.; Minak, G. Multi-objective design optimization of the reinforced composite roof in a solar vehicle. Appl. Sci. 2020, 10, 2665. [Google Scholar] [CrossRef]
- Minak, G.; Brugo, T.M.; Fragassa, C. Ultra-High-Molecular-Weight Polyethylene Rods as an Effective Design Solution for the Suspensions of a Cruiser-Class Solar Vehicle. Int. J. Polym. Sci. 2019, 2019, 8317093. [Google Scholar] [CrossRef]
- Sorrentino, S.; De Felice, A.; Grosso, P.; Minak, G. First assessment on suspension parameter optimization for a solar–powered vehicle. In IOP Conference Series: Materials Science and Engineering; IOP Publishing: Bristol, UK, 2019; Volume 659, p. 012080. [Google Scholar]
- Fragassa, C.; Minak, G.; Lukovic, M.; Maglio, S. Innovation in solar vehicles: From the idea to the prototype in less than 24 months. Eng. Sci. 2019, 1, 727–730. [Google Scholar] [CrossRef]
- Pavlovic, A.; Fragassa, C.; Minak, G.; Lukovic, M. Toward a sustainable mobility: A solar vehicle for a new quality of life. In IOP Conference Series: Materials Science and Engineering; IOP Publishing: Bristol, UK, 2019; Volume 659, p. 012075. [Google Scholar]
- Melin, H.E. Analysis of the Climate Impact of Lithium-Ion Batteries and How to Measure It; Circular Energy Storage: London, UK, 2019. [Google Scholar]
- Molicel®. Safety Data Sheet; E-One Moli Energy (Canada) Ltd.: Maple Ridge, BC, Canada, 2019. [Google Scholar]
- NMC Battery Material (LiNiMnCoO2); TARGAY: Kirkland, QC, Canada, 2022.
- Ellingsen, L.A.W.; Majeau-Bettez, G.; Singh, B.; Srivastava, A.K.; Valøen, L.O.; Strømman, A.H. Life cycle assessment of a lithium-ion battery vehicle pack. J. Ind. Ecol. 2014, 18, 113–124. [Google Scholar] [CrossRef]
- Encyclopaedia Britannica, T.E. Paul-Louis-Toussaint Héroult; Britannica: Chicago, IL, USA, 2022. [Google Scholar]
- Kapranos, P.; Brabazon, D.; Midson, S.; Naher, S.; Haga, T. Advanced Casting Methodologies: Inert Environment Vacuum Casting and Solidification, Die Casting, Compocasting, and Roll Casting; Elsevier: Amsterdam, The Netherlands, 2014. [Google Scholar]
- Eco-Profiles for Determining Environmental Impacts of Plastics; Plastics Europe: Brussels, Belgium, 2022.
- Omnexus—The Material Selection Platform. Flammability UL94—Preliminary Screening of Plastics for Fire Performance; Boedeker Plastics, Inc.: Shiner, TX, USA, 2022. [Google Scholar]
- Kabata; Skorek; Rajagopalan. Calculation of the direct energy consumption in heat treatment processes. In Proceedings of the Canadian Conference on Electrical and Computer Engineering, Halifax, NS, Canada, 25–28 September 1994; Volume 1, pp. 89–92. [Google Scholar]
- The Aluminum Association. The Environmental Footprint of Semi-Finished Aluminum Products in North America; The Aluminum Association: Arlington County, VA, USA, 2013. [Google Scholar]
- ecoinvent Database. ei—Ecoinvent. Available online: https://ecoinvent.org/the-ecoinvent-database/ (accessed on 12 June 2022).
- Das, S.; Liang, C.; Dunn, J.B. Life Cycle Assessment of Polymers and Their Recycling. In Circular Economy of Polymers: Topics in Recycling Technologies; ACS Publications: Cambridge, MA, USA, 2021; pp. 143–170. [Google Scholar]
- von der Assen, N.; Lampe, M.; Müller, L.; Bardow, A. Life-Cycle Assessment Principles for the Integrated Product and Process Design of Polymers from CO2. In Computer Aided Chemical Engineering; Elsevier: Amsterdam, The Netherlands, 2015; Volume 37, pp. 1235–1240. [Google Scholar]
- Turbo, M.D. Propulsion of 8000–10000 TEU Container Vessel; MAN—MAN Energy Solutions: Augsburg, Germany, 2012. [Google Scholar]
- Guidelines for Measuring and Managing CO2 Emission from Freight Transport Operations; ECTA —European Chemical Transport Association: Schaerbeek, Belgium, 2011.
- Life Cycle Inventory Data; CMP—Center for Environmental Assessment of Product and Material Systems. Available online: https://www.chalmers.se/en/about-chalmers/environmental-science-and-sustainable-development/Pages/center-for-environmental-assessment-of-product-and-material-systems-cpm.aspx (accessed on 12 June 2022).
- Manjong, N.B.; Usai, L.; Burheim, O.S.; Strømman, A.H. Life Cycle Modelling of Extraction and Processing of Battery Minerals—A Parametric Approach. Batteries 2021, 7, 57. [Google Scholar] [CrossRef]
- Natural Resources—Brines; SQM—Solution for Human Progress: Santiago, Chile, 2018.
- Ambrose, H.; Kendall, A. Understanding the future of lithium: Part 2, temporally and spatially resolved life-cycle assessment modeling. J. Ind. Ecol. 2020, 24, 90–100. [Google Scholar] [CrossRef]
- Xu, S.; Song, J.; Bi, Q.; Chen, Q.; Zhang, W.M.; Qian, Z.; Zhang, L.; Xu, S.; Tang, N.; He, T. Extraction of lithium from Chinese salt-lake brines by membranes: Design and practice. J. Membr. Sci. 2021, 635, 119441. [Google Scholar] [CrossRef]
- External Affairs, E.D.D.M. Survey of Lithium Market—Chile. 2019. Available online: https://www.indianembassysantiago.gov.in/pdf/Survey%20on%20Lithium%20sector%20in%20Chile_compressed.pdf (accessed on 12 June 2022).
- Stamp, A.; Lang, D.J.; Wäger, P.A. Environmental impacts of a transition toward e-mobility: The present and future role of lithium carbonate production. J. Clean. Prod. 2012, 23, 104–112. [Google Scholar] [CrossRef]
- Jiang, S.; Zhang, L.; Li, F.; Hua, H.; Liu, X.; Yuan, Z.; Wu, H. Environmental impacts of lithium production showing the importance of primary data of upstream process in life-cycle assessment. J. Environ. Manag. 2020, 262, 110253. [Google Scholar] [CrossRef]
- Encyclopaedia Britannica, T.E. Mineral Resources, Noncarboniferous. Britannica. Available online: https://www.britannica.com/place/Chile/Mineral-resources-noncarboniferous (accessed on 12 June 2022).
- Chile Set to Revive Its Dormant Cobalt Sector. Resource World. 2019. Available online: https://resourceworld.com/chile-set-to-revive-its-dormant-cobalt-sector/ (accessed on 12 June 2022).
- Majumder, R. Chile’s Export of Aluminium Foil during 2018–20 Marks a Sharp Rise with a Minimal Drop; AICircle: Kolkata, India, 2021. [Google Scholar]
- Ossa, A.C. Genesis of manganese deposits in northern Chile. Econ. Geol. 1970, 65, 681–689. [Google Scholar] [CrossRef]
- Dunn, J.; James, C.; Gaines, L.; Gallagher, K.; Dai, Q.; Kelly, J.C. Material and Energy Flows in the Production of Cathode and Anode Materials for Lithium Ion Batteries; Argonne National Laboratory: Lemont, IL, USA, 2014. [Google Scholar]
- Life Cycle Assessment (LCA) of Cobalt and Cobalt Compounds; Cobalt Institute: Guildford, UK, 2015.
- Vega, R.A.D. Exergy Cost Assessment in Global Mining. Ph.D. Thesis, Universidad de Zaragoza, Zaragoza, Spain, 2014. [Google Scholar]
- Nickel Energizing Batteries; Nickel Institute: Toronto, ON, Canada, 2021.
- Nickel Metal Life Cycle Data; Nickel Institute: Toronto, ON, Canada, 2020.
- Dai, Q.; Kelly, J.C.; Gaines, L.; Wang, M. Life cycle analysis of lithium-ion batteries for automotive applications. Batteries 2019, 5, 48. [Google Scholar] [CrossRef]
- Copper Environmental Profile; International Copper Alliance: San Marcos, CA, USA, 2022.
- NMC Powder for Battery Manufacturers. TARGAY. Available online: https://www.targray.com/li-ion-battery/cathode-materials/nmc (accessed on 12 June 2022).
- What Do We Know about Next-Generation NMC 811 Cathode? Research Interfaces: Montreal, QC, Canada, 2018.
- Ahmed, S.; Nelson, P.A.; Gallagher, K.G.; Susarla, N.; Dees, D.W. Cost and energy demand of producing nickel manganese cobalt cathode material for lithium ion batteries. J. Power Sources 2017, 342, 733–740. [Google Scholar] [CrossRef]
- Nakanishi, S.; Suzuki, T.; Qi, C.; Akikusa, J.; Nakamura, K. Effect of surface treatment for aluminum foils on discharge properties of lithium-ion battery. Trans. Nonferr. Met. Soc. China 2014, 24, 2314–2319. [Google Scholar] [CrossRef]
- Susarla, N.; Ahmed, S. Estimating Cost and Energy Demand in Producing Lithium Hexafluorophosphate for Li-Ion Battery Electrolyte. Ind. Eng. Chem. Res. 2019, 58, 3754–3766. [Google Scholar] [CrossRef]
- Dunn, J.B.; Gaines, L.; Barnes, M.; Sullivan, J.L.; Wang, M. Material and Energy Flows in the Materials Production, Assembly, and End-of-Life Stages of the Automotive Lithium-Ion Battery Life Cycle; Technical Report; Argonne National Lab. (ANL): Argonne, IL, USA, 2014. [Google Scholar]
- Jinasena, A.; Burheim, O.S.; Strømman, A.H. A Flexible Model for Benchmarking the Energy Usage of Automotive Lithium-Ion Battery Cell Manufacturing. Batteries 2021, 7, 14. [Google Scholar] [CrossRef]
- Molicel® Product Data Sheet. Available online: https://www.molicel.com/products-applications/explore-by-product/ (accessed on 12 June 2022).
- Smith, L.; Ibn-Mohammed, T.; Koh, L.; Reaney, I.M. Life cycle assessment of functional materials and devices: Opportunities, challenges, and current and future trends. J. Am. Ceram. Soc. 2019, 102, 7037–7064. [Google Scholar] [CrossRef]
- Silicon-Chemistry Carbon Balance—An assessment gas emissions and reductions. CES—Silicones Europe. Available online: https://www.silicones.eu/wp-content/uploads/2019/05/SIL_exec-summary_en.pdf (accessed on 12 June 2022).
- The World’s Leading, High Performance, Open Source Life Cycle Assessment Software. openLCA. Available online: https://www.openlca.org/ (accessed on 12 June 2022).
- Senatore, V.; Buonerba, A.; Zarra, T.; Oliva, G.; Belgiorno, V.; Boguniewicz-Zablocka, J.; Naddeo, V. Innovative membrane photobioreactor for sustainable CO2 capture and utilization. Chemosphere 2021, 273, 129682. [Google Scholar] [CrossRef]
- Song, Y.S.; Youn, J.R.; Gutowski, T.G. Life cycle energy analysis of fiber-reinforced composites. Compos. Part A Appl. Sci. Manuf. 2009, 40, 1257–1265. [Google Scholar] [CrossRef]
- Yang, Y.; Boom, R.; Irion, B.; van Heerden, D.J.; Kuiper, P.; de Wit, H. Recycling of composite materials. Chem. Eng. Process. Process. Intensif. 2012, 51, 53–68. [Google Scholar] [CrossRef]
- Giorgini, L.; Benelli, T.; Brancolini, G.; Mazzocchetti, L. Recycling of carbon fiber reinforced composite waste to close their life cycle in a cradle-to-cradle approach. Curr. Opin. Green Sustain. Chem. 2020, 26, 100368. [Google Scholar] [CrossRef]
Figure 1.
A scheme of the LiBER modular approach.

Figure 2.
A scheme of the LiBER brick (left) and a section of the LiBER brick plastic support (right).
Figure 2.
A scheme of the LiBER brick (left) and a section of the LiBER brick plastic support (right).

Figure 3.
A scheme of the LCA analysis carried on in the paper.

Figure 4.
Average and per unit of mass related to the ABS, POM, and aluminum extraction and primary production processes.
Figure 4.
Average and per unit of mass related to the ABS, POM, and aluminum extraction and primary production processes.

Figure 5.
Average and per unit of energy related to the ABS, POM, and aluminum extraction and primary production processes.
Figure 5.
Average and per unit of energy related to the ABS, POM, and aluminum extraction and primary production processes.

Figure 6.
The South America’s lithium triangle holds the most important lithium extraction sites: Salar de Atacama (SDA), Salar del Hombre Muerto (SDHM), Salar de Uyuni (SDU), Salar de Olaroz (SDO), and Salar del Rincon (SDR).
Figure 6.
The South America’s lithium triangle holds the most important lithium extraction sites: Salar de Atacama (SDA), Salar del Hombre Muerto (SDHM), Salar de Uyuni (SDU), Salar de Olaroz (SDO), and Salar del Rincon (SDR).

Figure 7.
Average and related to the raw materials extraction and processing, and the assembly and transportation of the cells.
Figure 7.
Average and related to the raw materials extraction and processing, and the assembly and transportation of the cells.

Figure 8.
ED and per unit of energy related to the entire LiBER battery pack.


| ED [MJ/Brick] | GWP [kgCO2/Brick] | ||
|---|---|---|---|
| Al | Extraction | ||
| Processing and heat treatments | |||
| Coarse machining | − | ||
| Total | |||
| POM | Primary production | ||
| Block molding | |||
| Coarse machining | |||
| Fine machining | |||
| Total | |||
| ABS | Primary production | ||
| Injection molding | |||
| Total |
Table 2.
Impact evaluation data of a diesel powered IVECO ECOSTRALIS Active AS truck considering a payload of 10,200 kg.
Table 2.
Impact evaluation data of a diesel powered IVECO ECOSTRALIS Active AS truck considering a payload of 10,200 kg.
| Unit | Value | |
|---|---|---|
| Emissions | [kgCO2/L] | |
| Fuel consumption | [L/km] | |
| Fuel calorific value | [MJ/kg] | 45 |
| Fuel density | [kg/L] |
Table 3.
Impact evaluation data of a HFO powered MAN S90ME-C9.2-GI cargo ship considering an average speed = 23.5 kn = 43.6 km/h [73].
Table 3.
Impact evaluation data of a HFO powered MAN S90ME-C9.2-GI cargo ship considering an average speed = 23.5 kn = 43.6 km/h [73].
| Unit | Value | |
|---|---|---|
| Emissions | [gCO2/km t] | |
| Fuel consumption | [t/d] | |
| Fuel calorific value | [MJ/kg] |
Table 4.
Average and related to the transportation impact of the cells support materials.
| ED [MJ/kgmaterial] | GWP [kgCO2/kgmaterial] | ||||
|---|---|---|---|---|---|
| TRUCK | CARGO | TRUCK | CARGO | ||
| Materials | Al6065 | ||||
| Al6063 | − | − | |||
| POM | − | − | |||
| ABS | − | − | |||
Table 5.
Average and related to the extraction and processing of the raw materials for one cell.
| Materials | ED [MJ/Cell] | GWP [kgCO2/Cell] | |
|---|---|---|---|
| Extraction | Al | ||
| Cu | |||
| Li | |||
| Co | |||
| Mn | |||
| Ni | |||
| Graphite | |||
| Total | |||
| Processing | Li2CO3 | ||
| Anode graphite powder | |||
| Cu anode collector | |||
| Cathode Ni–Mn–Co powder | |||
| Al cathode collector | |||
| PP separator | |||
| PE separator | |||
| Electrolyte salt | |||
| DMC electrolyte solvent | |||
| EC electrolyte solvent | |||
| Total |
Table 6.
Average and related to the assembly stages of the cells.
| Assembly Stages | ED [MJ/Cell] | GWP [kgCO2/Cell] | ||
|---|---|---|---|---|
| EM | Anode | Mixing | ||
| Coating | ||||
| Drying | ||||
| Calendering | ||||
| Slitting | ||||
| Cathode | Mixing | |||
| Coating | ||||
| Drying | ||||
| Calendering | ||||
| Slitting | ||||
| CA | Winding | |||
| Filling and packing | ||||
| Washing | ||||
| CF | SEI formation | |||
| Aging | ||||
| Testing | ||||
| Total |
Table 7.
Average and related to the transportation of the cells considering all the travelled stages.
Table 7.
Average and related to the transportation of the cells considering all the travelled stages.
| Route | ED [MJ/Cell] | GWP [kgCO2/Cell] |
|---|---|---|
| T1 | ||
| C | ||
| T2 | ||
| Total |
Table 8.
Average and related to the extraction and processing of the raw materials for the BMS of one brick.
Table 8.
Average and related to the extraction and processing of the raw materials for the BMS of one brick.
| Materials | ED [MJ/Brick] | GWP [kgCO2/Brick] | |
|---|---|---|---|
| Extraction | Al | ||
| Cu | |||
| Ni | |||
| Si | |||
| X7R | |||
| FR4 | |||
| Total | |||
| Processing | Al | ||
| Cu | |||
| Ni | |||
| Si | |||
| X7R | |||
| FR4 | |||
| Total |
Table 9.
Average and related to the extraction, processing and transportation for the BMS of one brick.
Table 9.
Average and related to the extraction, processing and transportation for the BMS of one brick.
| Impact | ED [MJ/Brick] | GWP [kgCO2/Brick] |
|---|---|---|
| Extraction and processing | ||
| Transportation | ||
| Total |
Table 10.
Average and related to the extraction, processing, and transportation for the silicone rubber tube of the BP liquid cooling system.
Table 10.
Average and related to the extraction, processing, and transportation for the silicone rubber tube of the BP liquid cooling system.
| Impact | ED [MJ/kgmaterial] | GWP [kgCO2/kgmaterial] |
|---|---|---|
| Extraction + processing | ||
| Transportation | ||
| Total |
Table 11.
Average and related to the extraction, processing and transportation of the container.
| Impact | ED [MJ/kgmaterial] | GWP [kgCO2/kgmaterial] |
|---|---|---|
| Extraction and processing | ||
| Transportation | ||
| Total |
Table 12.
and related to the battery pack.
| Impact | ED [(MJ/kWh) · 10−9] | GWP [(kgCO2/kWh) · 10−9] |
|---|---|---|
| Cells support | ||
| Cells | ||
| BMS | ||
| BTMS | ||
| Container | ||
| Total |
Publisher’s Note: MDPI stays neutral with regard to jurisdictional claims in published maps and institutional affiliations. |
© 2022 by the authors. Licensee MDPI, Basel, Switzerland. This article is an open access article distributed under the terms and conditions of the Creative Commons Attribution (CC BY) license (https://creativecommons.org/licenses/by/4.0/).
Share and Cite
MDPI and ACS Style
Falcone, M.; Quattromini, N.F.; Rossi, C.; Pulvirenti, B. Life Cycle Assessment of a Lithium-Ion Battery Pack Unit Made of Cylindrical Cells. Batteries 2022, 8, 76. https://doi.org/10.3390/batteries8080076
AMA Style
Falcone M, Quattromini NF, Rossi C, Pulvirenti B. Life Cycle Assessment of a Lithium-Ion Battery Pack Unit Made of Cylindrical Cells. Batteries. 2022; 8(8):76. https://doi.org/10.3390/batteries8080076
Chicago/Turabian StyleFalcone, Morena, Nicolò Federico Quattromini, Claudio Rossi, and Beatrice Pulvirenti. 2022. "Life Cycle Assessment of a Lithium-Ion Battery Pack Unit Made of Cylindrical Cells" Batteries 8, no. 8: 76. https://doi.org/10.3390/batteries8080076
Note that from the first issue of 2016, this journal uses article numbers instead of page numbers. See further details here.