


Coating Defects of Lithium-Ion Battery Electrodes and Their Inline Detection and Tracking

1
Institute for Particle Technology, Technische Universität Braunschweig, Volkmaroder Str. 5, 38104 Braunschweig, Germany
2
Battery LabFactory Braunschweig, Technische Universität Braunschweig, Langer Kamp 19, 38106 Braunschweig, Germany
3
ISRA Surface Vision GmbH, Albert-Einstein-Allee 36-40, 45699 Herten, Germany
*
Authors to whom correspondence should be addressed.
Batteries 2023, 9(2), 111; https://doi.org/10.3390/batteries9020111
Submission received: 29 November 2022
/
Revised: 27 January 2023
/
Accepted: 29 January 2023
/
Published: 3 February 2023
(This article belongs to the Special Issue Feature Papers to Celebrate the First Impact Factor of Batteries)
Abstract
:In order to reduce the cost of lithium-ion batteries, production scrap has to be minimized. The reliable detection of electrode defects allows for a quality control and fast operator reaction in ideal closed control loops and a well-founded decision regarding whether a piece of electrode is scrap. A widely used inline system for defect detection is an optical detection system based on line scan cameras and specialized lighting. The cameras scan the electrode, and brightness differences on the surface are detected and processed inline. The characteristics of the defect image are used for automated classification of the defects based on image features. Furthermore, the detailed detection of defects allows for the identification of causes. This paper describes the working principle of such an inline detection system, the catalog of typical defects, and the image features used to classify them automatically. Furthermore, we propose and discuss causes and effects of the different defect types on the basis of the literature and expert experience. In combination with tracking and tracing, this enables the manufacturer to reduce scrap by detecting defects early in the production chain.
1. Introduction
Lithium-ion batteries are an integral part of today’s portable consumer electronics, such as laptops, smartphones, cameras, headphones, and many more. Starting from these rather small applications, the interest and demand for lithium-ion batteries in the automobile and stationary energy storage sectors have significantly grown in the last decade. However, these large-size applications demand higher power density, energy density, and a longer lifespan for lithium-ion batteries. Multiple aspects to fulfil these demands have been investigated in the research community. These include, but are not limited to, the investigation of new active materials, new additives, higher areal loadings of the electrodes, or variations of electrode composition and structure [1,2,3]. Another way of increasing the cell and, especially, the module energy and power density is to scale up. Larger electrodes and cells need less periphery compared with smaller cells, decreasing the inactive mass in the systems [4,5,6]. However, larger electrodes demand a higher production quality regarding coating uniformity and defect density. Usually, larger electrodes increase the waste ratio because of the increased complexity of excluding defects in the continuous coating from the final electrodes [6,7]. To decrease the scrap rate of larger electrodes, the reason and the severity of defects must be understood to differentiate critical and non-critical defects and prevent as many critical defects as possible [8].
Critical electrode defects would be defects that severely damage the cell performance during cycling or pose a safety risk, such as a short circuit. Another aspect would be the subsequent processability of electrodes. Defects that hinder the processability by increasing the fragility or are intensified during later production steps are critical defects.
Often the severity of defects depends not only on the defect type but also on their size and frequency. David et al. [9] showed that a small quantity of pinholes with a size of approximately 100 to 200 µm has no effect on the performance of multilayer pouch cells. Such defects can even improve ionic conductivity as publications regarding the structuring of electrodes by lasers have shown [10,11,12]. However, at the same time larger uncoated areas lead to a local cascading effect of rapid electrode degradation due to inadequate balancing and severe overcharging of the cathode coating near the defect. Tests in small coin cells show that pinholes lead to severe capacity fading as well as a decrease in C-rate performance because of their higher areal fraction [13]. This shows that not only the defect type but also the defect size and frequency must be taken into account to allow for an accurate estimation of the impact of coating defects on the electrode and cell performance [14,15,16].
Automatic defect detection is an industrial standard in many areas of mass production, for example, in glass and fabric production [17,18] or an ongoing research topic for other battery components, such as separators [19]. To identify defects, optical identification systems are often used, which allow for an easy, hazard-free, and fast defect detection. The concept behind the detection is based on analyzing the brightness of the product with cameras. A fluctuation in the brightness detected by the camera, whether it is light shining through the product or light reflected by the product, indicates a defect in the product. Automated categorization algorithms enable real-time automatic quality control based on this brightness distribution as well as automated inline waste disposal or recycling. To qualify an automated defect detection for battery electrode production as well as to gain as much insight as possible into the processes leading to these defects and their influence on electrode performance, the best parameters for the detection as well as a good defect categorization must be developed. Furthermore, it must be ensured that the recorded defects can also be assigned to the respective cells. In this way, the severity of the defect can be used to decide whether the respective electrode section can be considered directly as scrap and must be rejected. On the other hand, by tracing the defects back to the cell level, the influence can be better described. A traceability system as part of the quality management system offers the right opportunity for this [20,21]. For this reason, this publication addresses the automated defect detection and classification of coating defects. Furthermore, the severity of the defects for the cell performance is classified on the basis of the literature, and the causes of the defects are described. Moreover, the article shows how errors can be traced back to the cell level.
2. Experimental Section
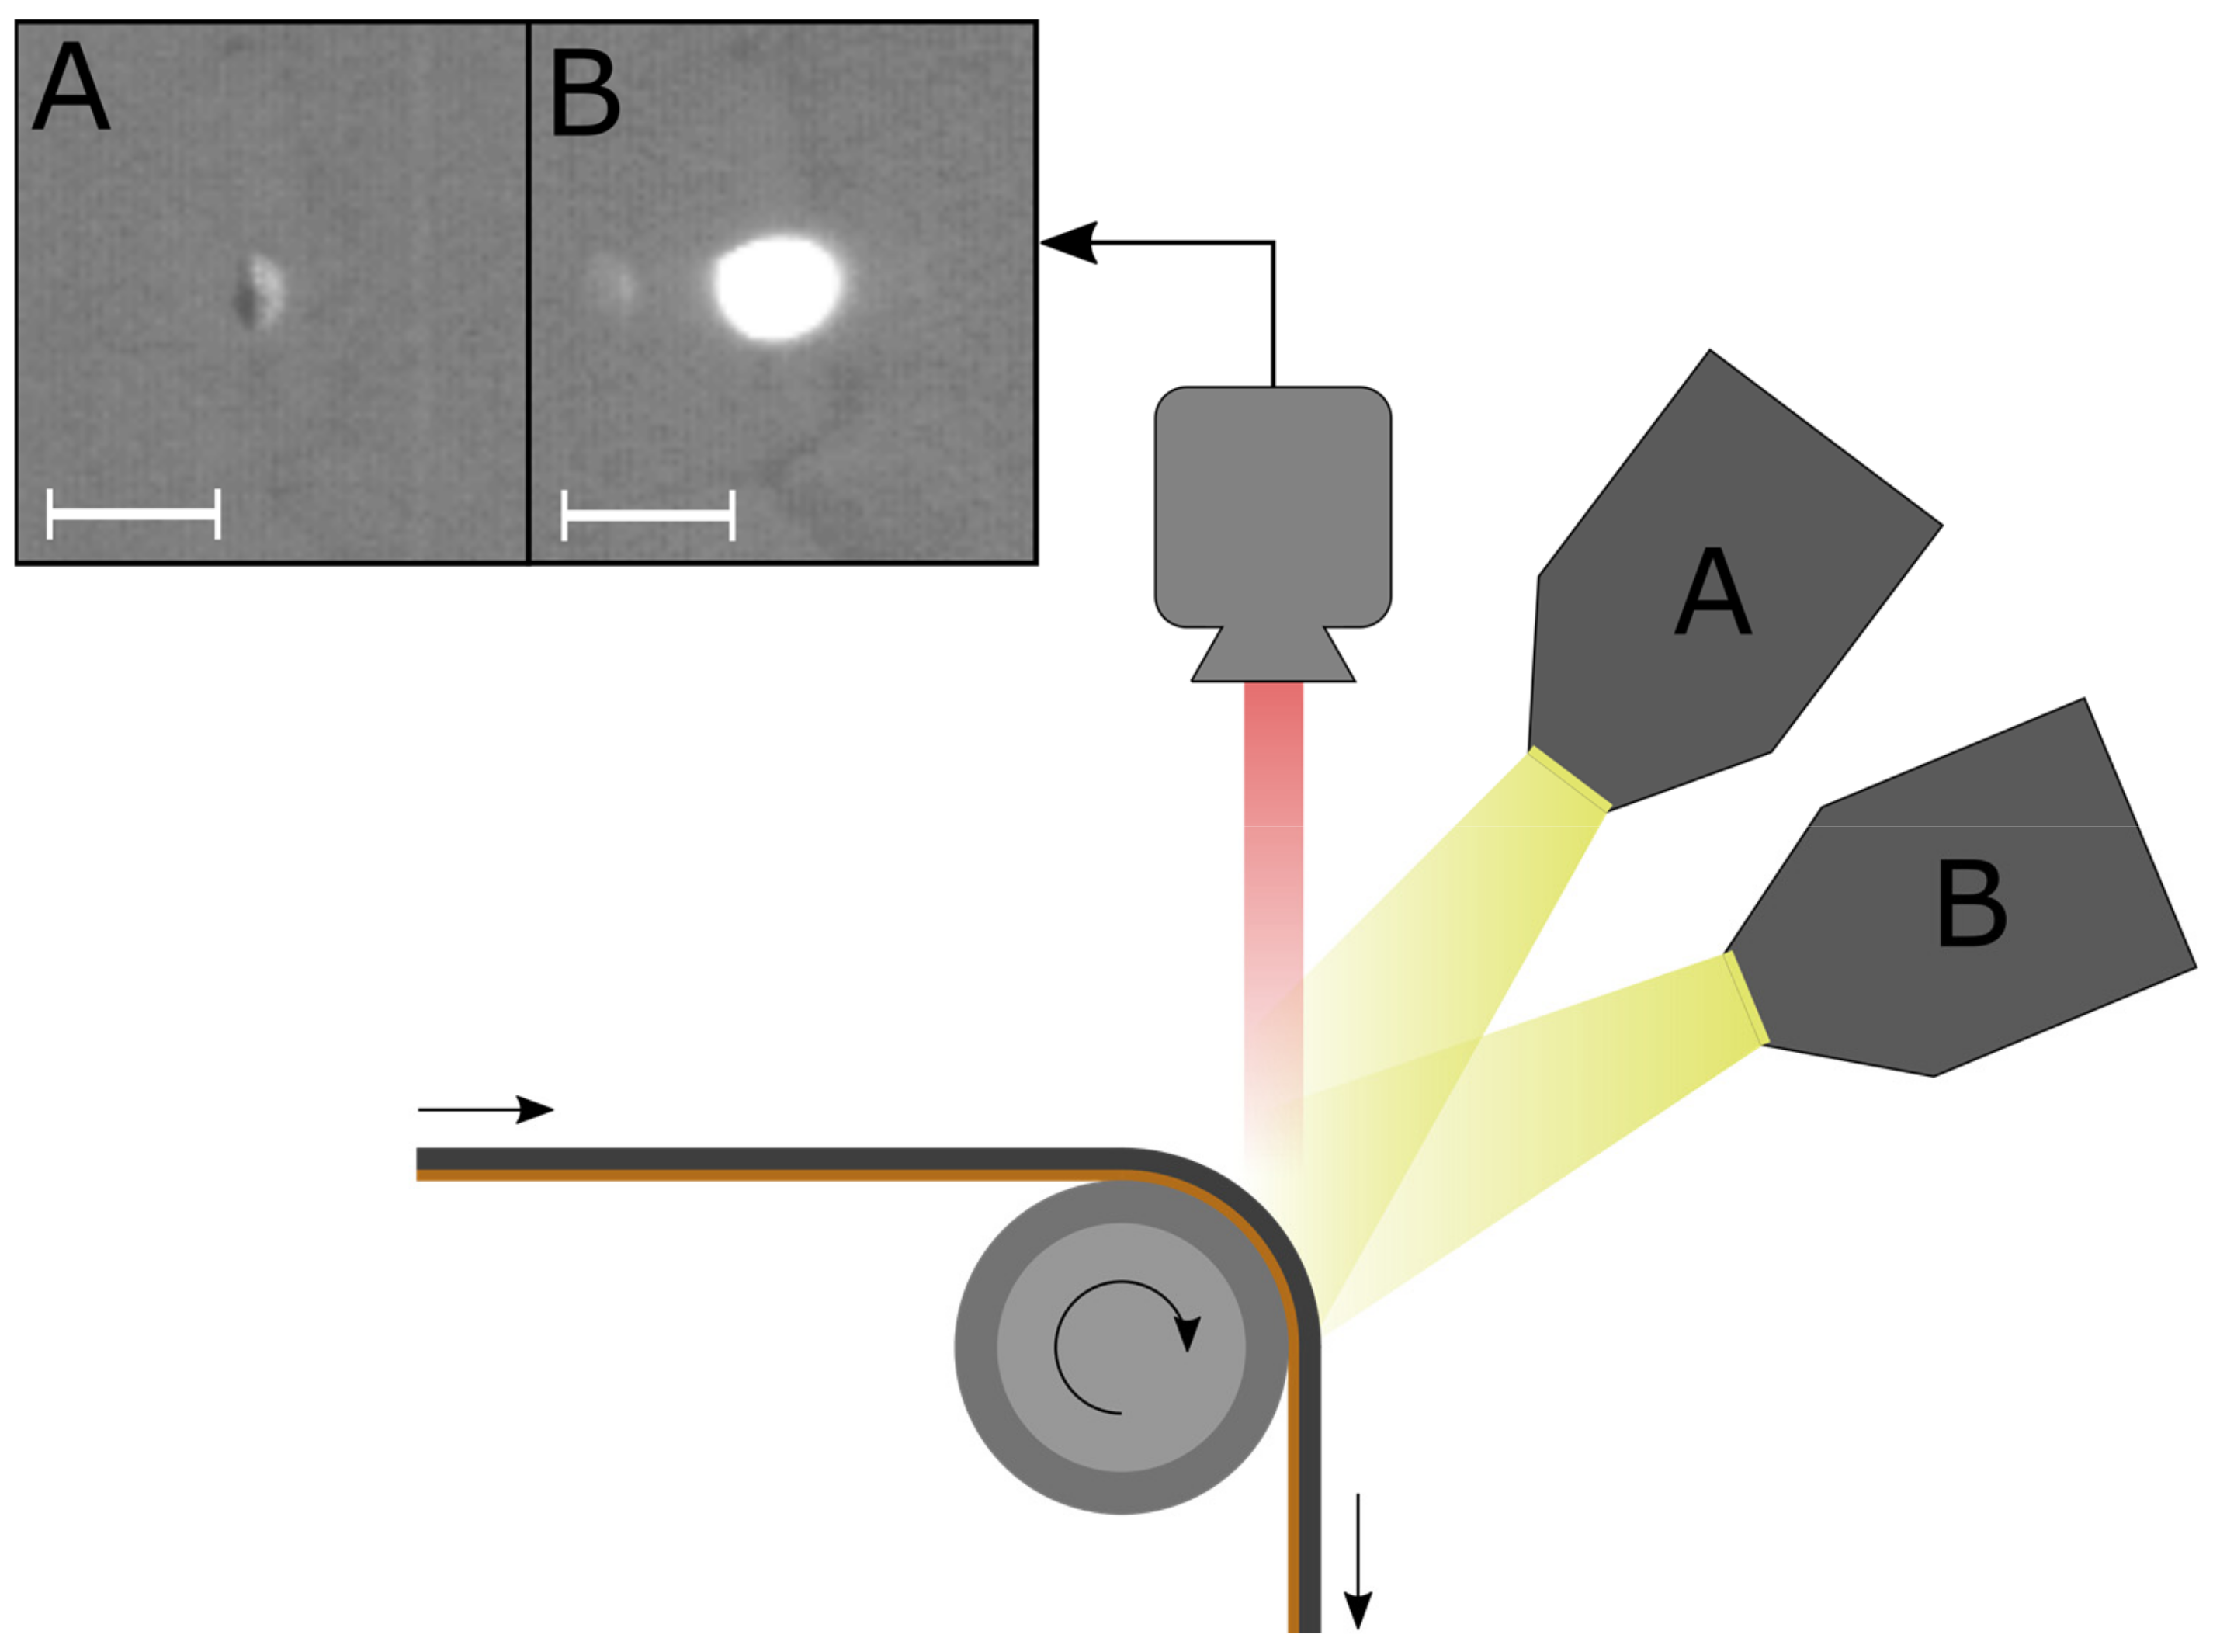
In order to identify electrode coating defects, an automated optical defect detection system (type ISRA Vision SMASH) was used. This system consists of two LED arrays and two line scan cameras with 8192 pixels each to inspect the entire coating width with a real pixel size of 35 µm × 37.5 µm. The system allows for the simultaneous inspection in bright field mode (LED B is in reflection angle of the camera) and in dark field mode (LED A is not in reflection angle), as shown in Figure 1. The general detection concept is based on brightness differences in the pictures of the coating, which are filtered by the detection algorithm. The defects are categorized automatically on the basis of multiple parameters, such as aspect ratio, brightness, size, form, orientation, position, and many more.
Multiple different electrodes, including NMC cathodes, graphite anodes, and sulfur cathodes of varying types, production chains, and areal loadings were used to build the defect catalogue discussed in this paper. Different filter setups were created to allow for an inspection of the anodes and cathodes. The difference between the two setups was the brightness range that was considered normal to account for the different colors of graphite anodes as well as NMC and sulfur cathodes. Regarding anodes, the normal brightness range was set to 95–180 for the dark and for the bright field. Regarding cathodes, this range was set to 105–150 for the dark field and 95–150 for the bright field on an 8-bit scale (256 steps, 0 = minimum brightness, 255 = maximum brightness). In general, the color of the materials has an influence on the set detection limits. Therefore, the inspection system must be re-parameterized for each material used. The setup used for this research allowed for a maximum detection speed of 11 m/min for anodes and 11.6 m/min for cathodes based on LED flash times of 200 µs for anode and 190 µs for cathode inspection, with 40% and 30% of the maximum LED brightness used, respectively. However, the maximum technical inspection speed of the cameras is approximately 1000 m/min or 100 defects per second and camera, provided that a sufficiently powerful light source is available to reduce the flash time.
The inspection system was installed at the end of the continuous pilot coating and drying line LabCo from Kroenert GmbH (Hamburg, Germany) using a slot die or comma-bar reverse-roll coating system and three 2 m long convective drying sections [22]. The production speed varied between 0.75 and 2 m/min depending on areal loading, solvent type, and solid content. For all these different electrodes and production chains, similar defects could be identified. The user then categorized some defects, taking the optical impression of the defect into account, to train the integrated machine learning algorithm. Furthermore, the change of defects due to calendering was performed manually without a detection system. In general, the detection of defects after calendering is possible, but it is much more complicated. The reason for this is the increase in electrode gloss and the occurrence of ripples in the electrode [14]. In order to exclude measurement artifacts created by the cameras and the setup, the brightness was averaged by the algorithm first and then analyzed. This filter was 2 by 2 pixels for the dark field and 4 by 4 pixels for the bright field for both electrode types. Experiments showed that these filter setups are best suited for defect detection, as no filtering leads to intensive noise and the increased detection of phantom defects, which are just brightness differences on the electrodes surface, as shown in Figure 2. On the other hand, choosing a filter that is too large leads to decreased sensitivity of the detection system towards small defects [23]. The filter size was larger for the bright field because most defects are reflective. The high reflectivity led to an overestimation of the defect size. Therefore, it allowed for a lower sensitivity, which was also necessary because electrode surfaces usually show more intense noise in the bright field.
3. Results
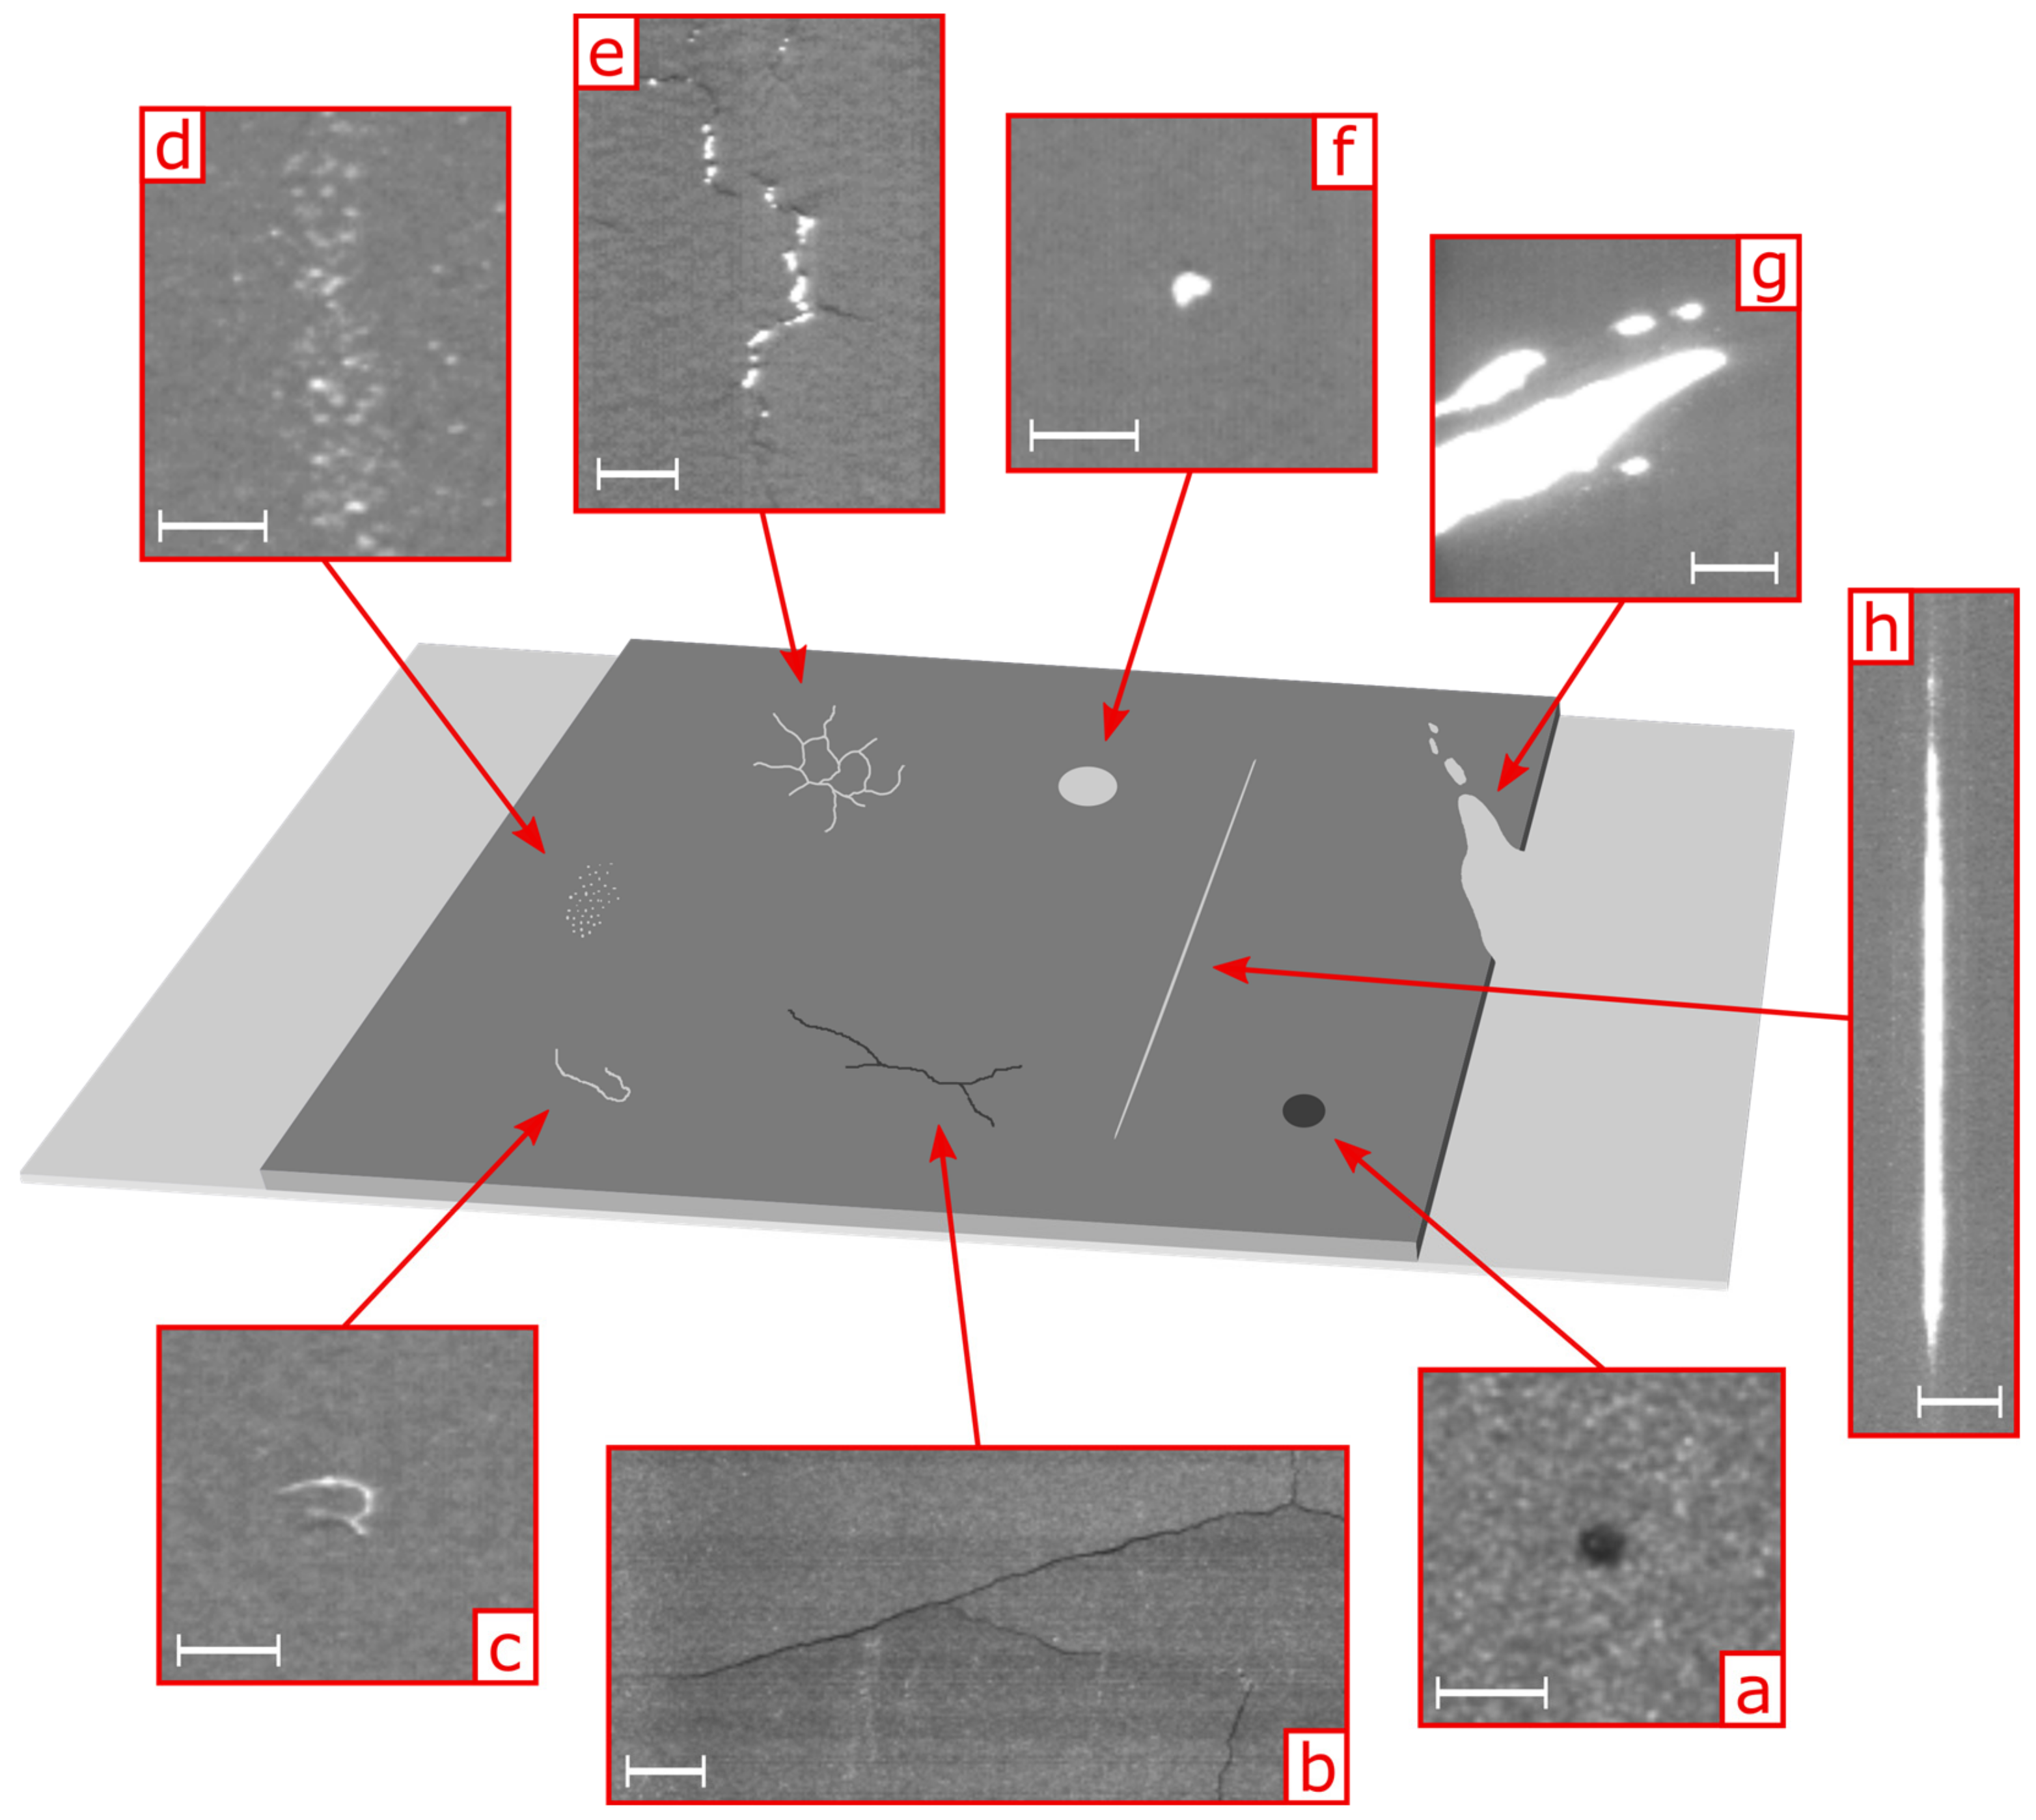
During the investigation of a high number of different electrodes, a catalogue of eight different electrode defect categories was derived, examples are shown in Figure S1. The defects in this catalogue had different causes and effects and differed in their frequency depending on a large array of production and material parameters. In this paper, we present these categories and share some expert experience regarding the cause of the defects (shown in Figure 3) and their impact on the electrode handling and electrode performance (shown in Table 1).
Agglomerates often derive from insufficient dispersion of the solid components in the slurry mixing step [24]. Another source may be dried slurry at the coating device, present mainly in batch production after a bit of shelf life. Agglomerates often consist of densely packed clusters of conductive agent and binder and can have a size in the area of 100 to 500 µm [13]. Therefore, within an agglomerate, the electrical and ionic conductivity is reduced, leading to a local increase in impedance and a loss of capacity [9,25]. In the calendering step, agglomerates can be the reason for a foil tear or damage of the calender rolls due to their dense structure—especially in the case of NMC cathodes [14]. The second threat is in regard to the separator integrity in a cell. Coarse agglomerates in a cell, especially if combined with pressure, can lead to a mechanical failure of the separator and induce a short circuit, which can be a serious safety risk on top of the significantly decreased cell performance [26]. Agglomerates pose multiple threats for the electrode performance and further processing. Therefore, agglomerates should be considered as critical defects. Introduced into the coating, these agglomerates are either visible as dark dots in the case of carbon black agglomerates or as local heights on the electrode surface. The detection system detects this height in two different ways: in the dark field, the agglomerate casts a shadow detected by the cameras. In the bright field, however, the agglomerate can be visible also as a micro-compression, which is discussed in detail later. This is because the electrode is produced in a roll-to-roll process, which leads to a small compression of this height, increasing the reflective behavior. The dark field picture of the defect is needed to identify agglomerates and to differentiate them from normal micro-compressions or kinks.
Coating cracks are often the result of small radius redirection of thick electrodes (mainly water-based anodes) or a too-intense drying procedure, leading to substrate binder depletion and bad adhesion [27,28,29,30]. At this point, it must be taken into account that direct-drying-induced cracks are very unlikely [31]. These are caused by a combination of stress-inducing layer shrinkage with poor adhesion and subsequent deflection of the web [27,31,32]. On the cathode side, drying-induced defects occur in the form of mud cracks, which are explained in a later section [1]. They can be identified as fine dark lines on the electrode surface, especially in the dark field because of their shadow casting, and can be several centimeters in length. On the one hand, the identification of cracks on the coating surface can be an indicator of bad adhesion or too-thick electrodes, which can hinder the consecutive processing of the electrodes and lead to bad cell performance due to delamination. On the other hand, the crack on its own is not a critical defect. The compression and particle rearrangement during the following calendering step can lead to the vanishing of these defects so they do not have a significant impact on the cell performance.
Contaminations include all foreign substances that can be introduced into the coating. Due to the different properties, these can have varying degrees of impact on the subsequent cell and different defect features. Contaminants, such as fluff, can be easily avoided by a drying air conditioning and/or by producing the electrodes in a cleanroom since they are introduced mainly through sedimentation during the coating and drying step. Fluff, as shown in Table 1, does not significantly impact cell performance because it is flexible, usually non-conductive, and small. In the case of metal dust, this changes drastically. Metal particles can easily lead to short circuits or significantly damage cell performance [33,34]. Metal impurities in LIB electrodes should be avoided at all times, whereas normal dust and fluff is usually not a critical defect. Mohanty et al. [13] investigated the influence of cobalt and aluminum metal particle impurities within the cathode. They found that this resulted in unstable cell performance at high C-rates. Furthermore, significantly faster capacity losses occurred during cycling. Hoffmann et al. [26] showed that impurities in the form of metal contaminations, which can arise from laser cutting, are able to damage the separator during cell production and, thus, cause short circuits. Usually, contaminations can be detected as bright spots on the electrode, especially in the bright field due to their different reflective properties compared with the electrode surface. However, the form of these bright spots can be largely different among contamination types and individual contaminations. Fluff, for example, is usually very obvious because of its fine and interloped structure. However, the varying form can make it difficult to separate this defect distinctly from the others. In combination with its vastly varying influence on the cell performance, defects of this type should be reviewed by the user [35].
Micro-compressions are very small reflective spots but are usually part of a larger cluster. These defects are caused by local compression of the coating. One reason for this defect is a contaminated or damaged deflection roller, deflecting the substrate on the coating side. This leads to a smoother and more reflective surface at the tips of the irregular coating surface, which looks a bit like a starry sky in the bright field detection. The density differences caused by this defect are usually minimal and very local, so they are entirely superimposed by the calendering step. Furthermore, micro-compressions can occur when the electrode is scraping on fixed machine parts on the coating side during production or wound inhomogeneously into a coil. The reason can be previous defects pushing through to the next layer or irregular surfaces of winding rolls. In this case, the defect consists of a large number of micro-compressions. While micro-compressions are not critical defects, they can help to identify other defects or their causes. Periodically recurring micro-compressions, for example, allow one to trace the roller causing the defect. They usually have no significant influence on the cell performance due to the following calendering step but can be used to detect problems with or contaminations on the equipment.
Mud cracks show a lack of cohesion and adhesion in the coating. Too-intense drying in combination with a too-low binder content, a too-low overall solid content, or a bad cohesion leads to fast shrinking of the coating during the drying step [1,24,36,37]. The wet coating cracks open in the dryer, forming interconnected cracks with visible foil. Due to the reflection of the blank foil, this defect is especially visible in the bright field. The impact of this defect on the electrode quality is very critical. Usually, the defect area spans over the entire electrode due to general problems with unsuitable production parameters or additive contents. Due to the defect size and their negative impact on electrode structure and properties, this defect must be considered critical and leads to direct scrap of the electrode.
Pinholes are one of the most well-known electrode defects. They are caused mainly by air bubbles in the suspension. In the coating gab, these bubbles open up and leave a free circular area on the substrate, the pinhole. The size of these holes usually ranges in the area of a few 100 µm and is clearly visible in the bright field detection because of the reflecting blank foil. David et al. [9] investigated the influence of a small quantity of pinholes on the performance of multilayer pouch cells. They found no disadvantage, whereas Mohanty et al. [13] showed the negative impact by investigating small size coin cells. Thus, pinholes do have a negative impact on the coating directly around it because of the missing material. Still, this impact is not relevant for a small frequency and/or larger electrodes. Therefore, pinholes should not be considered as critical defects in small amounts. It is possible that pinholes even favor the overall electrode performance of electrodes. Various research groups have investigated the impact of laser structuring on the performance of thick LIB electrodes and found that these artificial pinholes do increase the C-rate performance because of an easier lithium-ion diffusion [11,38,39,40,41,42].
Slips are caused by inhomogeneous substrate tension or wrinkles and lead to coating defects, mostly vertical to the coating direction, as shown in Figure 3. This is due to inconsistent web speed in the coating device, leading to a massively inhomogeneous areal loading distribution up to completely blank web in some spaces. Inspecting the blank substrate, wrinkles are often visible as irregular reflections. With applied coating, the defects are often visible as bright areas or stripes of blank foil vertical to the web direction, especially in the bright field. Wrinkles/slips often are large defects that can significantly impact the cell performance and, therefore, should be considered as critical, i.e., result in production scrap.
Stripes are elongated areas without coating and, therefore, are highly reflective in the bright field. These defects often appear as a line in the coating direction caused by agglomerates or other contaminants clogging the coating gab [24]. Such defects are to be prevented because they can seriously impact the cell performance, as they usually have a high frequency and can have a length of several meters if not detected early, i.e., can lead to a very large amount of scrap production. David et al. [9] showed that such line defects can decrease the long-term performance of LIBs significantly due to a cascading increased degradation starting in the area of the defect. Thus, these coating defects should be considered as critical.
3.1. Defect Causes
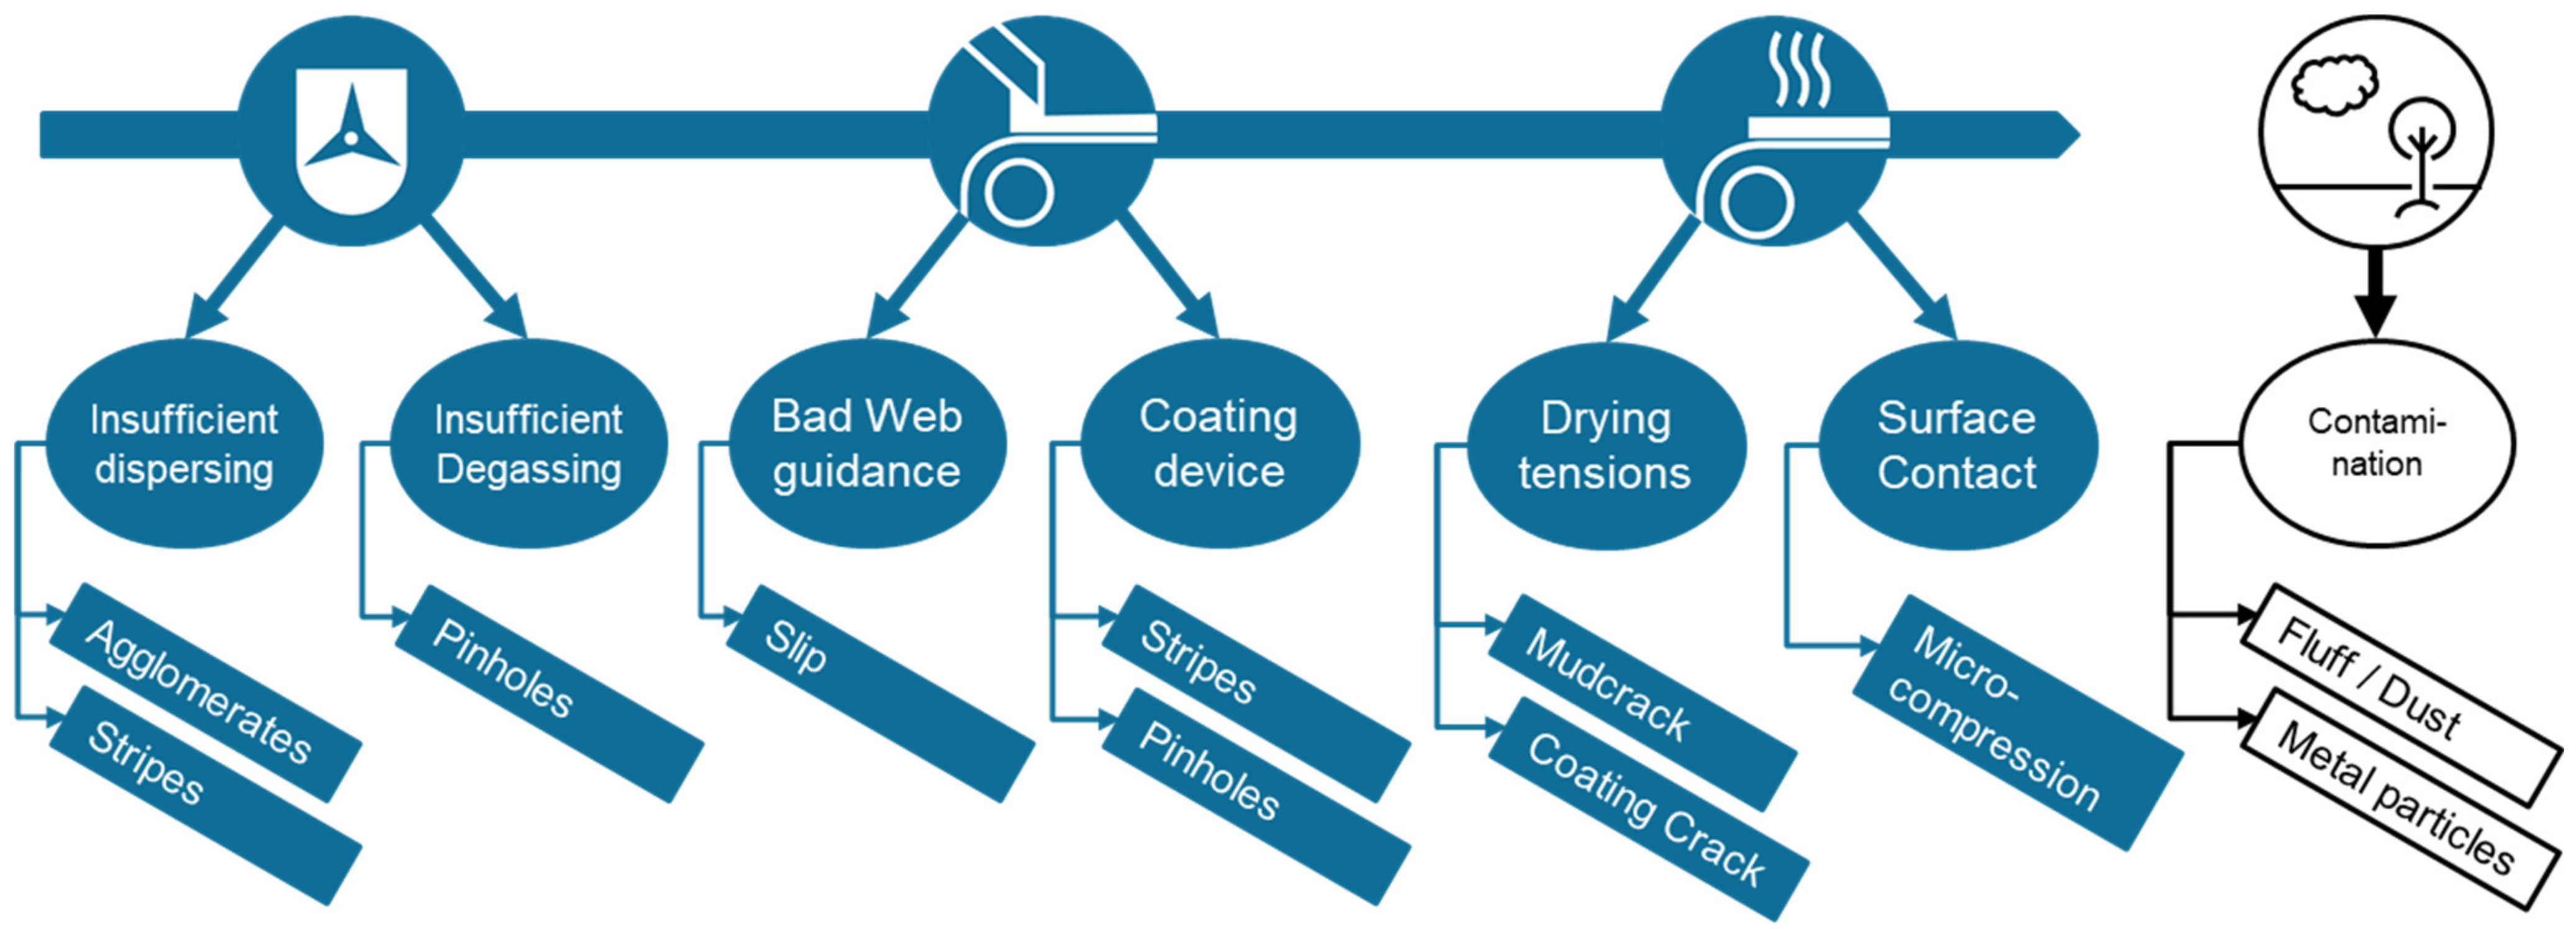
In addition to the detection and classification of the detected defects, the assignment to the respective cause and its avoidance is of great importance. Generally, coating defects occur for a variety of reasons [42]. Nevertheless, many detected defects can be traced back to the previous process steps. An overview of the defect classes and the process steps causing them is shown in Figure 4. For example, pinholes usually originate from an insufficiently degassed suspension. However, they can also occur due to wetting problems, but they could not be observed during the recording of the data of this work [42]. Furthermore, agglomerates arise due to insufficient dispersion and, thus, incomplete deagglomeration of large carbon black agglomerates. These can be avoided by installing a suspension filter before the slot die. At the same time, this prevents the slot die from being blocked by an agglomerate, which also minimizes the probability of stripes appearing on the coating. Furthermore, foreign particles in the form of metal contamination, which may be caused by abrasive effects within the mixing devices, can be filtered out. In this way, the cause of pinholes, agglomerates, and stripes can be traced back to the previously manufactured intermediate product suspension and are, thus, the result of inadequate quality management. It should be considered that agglomerates and stripes can also be caused by dried suspension on the container walls. Other defects, such as mud cracks, coating cracks, slip or edge defects, result from incorrectly set process parameters or insufficient equipment capability. The defect at the edge of the electrode was not defined as a separate defect class. The reason for this is that there is no consistent occurrence of this type of defect; therefore, a classification can be designated only on the basis of the positioning of the defects. They are caused by non-optimal slurry transfer to the substrate in the edge area, for example, due to decreasing coating thickness on the edges [43]. This leads to occasional or periodical dewetting of the substrate. Depending on the frequency and size of these defects, they can be problematic in the calendering step or cause problems for double-sided coating and cell cutting. Occasional small edge defects can be ignored or excluded; however, periodical or large edge defects are critical.
3.2. Defect Classification by Selected Image Features
As already mentioned above, the detected defects are classified by the system automatically. This process is based on a machine learning algorithm called “QuickTeach”. Several electrode defects are taught into the system with user-defined classification. We taught approximately 70 to 120 defects for each class (edge defects excluded) leading to a total of 820 taught defects to allow for a stable and diverse data set. The error images used can be made available on request. After teaching, the system determines the combination of image features best suited to reproduce the defect assignment made by the user.
For each detected defect, 44 defect features (selection listed in Table 2) are calculated by the system and compared with the above-mentioned defect classes by means of an algorithm in order to determine their class affiliation. Since some of the image features used were created artificially and, thus, have no relation to reality, only selected image features are discussed below. After training the system with the provided defects, the algorithm correctly reclassified 95.0% of these. As can be seen in Table 3, the remaining 5% are distributed among defect classes that have a similar appearance. Especially, contaminations, pinholes, and agglomerates reach a comparatively low reclassification accuracy. For example, the algorithm falsely classified nearly 6% of contaminations as mud cracks. This is because of the sometimes very similar defect features.
The features used by the system for the defect classification are sometimes quite complex but can be grouped into three main features at a closer look: defect shape, defect compactness, and defect brightness. The defect shape is very distinctive for some defect classes, and some defects can, thus, already be classified very well by their shape. For example, pinholes are usually almost round, while stripes are elongated and narrow, as shown in Figure 5a,b. Other defects, such as micro-compressions, however, do not have a fixed shape. Due to their path of formation as a result of slight surface compaction of the electrode, their shape is highly dependent on how this compaction occurs. Micro-compressions can have an elongated shape similar to a stripe if they are caused by dragging on a stationary component. They can be point-shaped if they are caused by point-shaped contamination on a substrate-carrying roll. Thus, by their shape alone, micro-compressions cannot be distinguished from pinholes, contamination, or stripes.
What is striking about micro-compressions, however, is their compactness. Viewed from a distance, a micro-compression’s appearance is similar to a starry sky. This appearance is due to minimal height differences in the coating so that higher surface areas are slightly compressed and, therefore, are more reflective, while lower surface areas remain uncompressed. Defects, such as contaminations or dewetting, also often have a lower compactness than pinholes or stripes, as seen in Figure 5c for percent fill.
As a third aspect, the brightness of the defect can be considered. Defects such as agglomerates or cracks are usually dark defects and, thus, can be easily distinguished from the bright defects. However, there are also differences in the bright defects. Pinholes or slips, for example, are extremely bright due to the high reflection of the substrate film. Micro-compressions, on the other hand, show brightness values above the tolerance limits but which are comparatively lower, as seen in the lower right diagram of Figure 5d.
The transitions of the individual defect features among the different defect types are sometimes blurry, as shown in Figure 5 as well. Stripes, for example, have a very high moment relationship, in some cases making them unique in this aspect. The moment relationship takes into account the direction of the defect for the calculation of the aspect ratio/defect form and is independent of the web direction and is, thus, defined as a real aspect ratio. In other features, such as the percent fill, they are in line with other defect classes, such as agglomerates and pinholes. In the case of percent fill, it can be observed that this defect feature can be used very well to separate the very dense defects where the defect area is very concentrated, such as pinholes, stripes, or agglomerates, from less dense defects which are quite fractal, such as coating cracks or micro-compressions. On the basis of these four exemplary defect features, it can be seen that the classification of defects with only one or a few features is not possible with sufficient accuracy. However, it becomes obvious that certain defect features for certain defect classes show clear differences. Therefore, the inline classification uses the total of 44 defect features to classify. The 44 features are enough to separate the defect classes from one another sufficiently and to analyze and classify a detected defect afterwards.
However, it is not able to classify every single defect correctly, especially if the class features overlap somewhat. During multiple system operations, it was obvious that contaminations, pinholes, and mud cracks are difficult to discern in some cases, as are pinholes, micro-compressions, and slips. Examples of such challenges to classify and discern defects can be seen in Figure 6. Looking at defect (Figure 6a) with an experienced human eye, it can be classified as a mud crack, but looking at the bare optical features of defects (Figure 6a,b), they have much in common and look very much alike. They both show an irregular, elongated structure with excellent bright areas, resulting in a low percent fill. The inline detection system with no expert experience can have difficulty discerning these similar-looking defects. However, defects can also be challenging to classify, even for an expert looking at the taken pictures. Defect (Figure 6c) is likely still a contamination with small fluff, but looking at defect (Figure 6d), it becomes almost impossible to decide whether this is a small contamination or a small pinhole. In addition, it is difficult to set a clear transition point regarding pinholes (Figure 6e) and stripes (Figure 6g). At what aspect ratio is a defect to be classified as a stripe, for example, by looking at defect (Figure 6f)? These differentiations are, in some cases, significant to assess the defect’s criticality and influence on the electrode and cell performance and safety: whether defect (Figure 6d) is a metal particle or a small pinhole has a significantly different impact on the cell performance. In other cases, the impact of the classification is much smaller; for example, whether defect (Figure 6f) is classified as a pinhole or a stripe has no significant impact on its influence on the electrode performance because regardless of this, it is clear that this defect is a free substrate area with missing coating. In this case, the amount of free area is more important for the impact than its classification. This does not mean that the differentiation between pinholes and stripes is unnecessary, because these two defect types have very different causes. The classification can help to tackle those. More examples for the different defect classes can be seen in Figure S1.
3.3. Defect Classification by a Deep Learning Image Classifier
Classification of images by deep learning neural networks boosted the performance of real-world image recognition tasks in the past decade [44]. In industrial applications and especially in quality assurance tasks, such as the classification of surface defects, engineered and feature-based classifiers are still in frequent use today [45,46]. Often those solutions are built from decades of experience and handpicked datasets. A feature-based solution has excellent traceability and relates well to human knowledge: An engineer can see in detail why a classifier has chosen the defect class for a defect. Even for machine learning classification, the detail of the algorithmic decision is easily accessible. Additionally, feature-based approaches can much better handle small datasets with few examples per class [47]. The additional abstraction of the feature extraction moves the problem complexity to a space of much lower dimensionality compared with the image’s pixels in the deep learning scenario. The drawback of the feature-based techniques is that the accessible properties of the image are limited to the predefined feature set. It can happen that a certain property of the defect’s texture, e.g., roughness, is clearly visible to the human eye but does not translate to a significant feature. Of course, the feature set can be extended with results from an image processing algorithm that aims for the desired property, but this is a retrospective approach.
With a deep learning neural network, the properties which can be learned from the images are limited only by the structure and size of the network. In the described industrial quality assurance scenario, good results are achieved on different materials, e.g., by Ren et al. [48], Badmos et al. [49], or Bhatt et al. [50]. However, the performance still greatly depends on the given training data and the nature of the images or the material, respectively. For this investigation, we used a standard residual neural network, a ResNet [51]. For this investigation, the implementation was carried out using PyTorch to generate a prototype software and evaluate the approach with state-of the-art methods [52] but is not specific to this software package, i.e., could also be implemented on TensorFlow [53] or Keras [54].
Specifically, a non-pre-trained ResNet-18 is suitable for this type of data: Pre-training with real world images, e.g., ImageNet data, does not help with these images, as they are different in nature. The choice of a rather simple deep learning network is adequate for these data, as the complexity is well below scenes from the real world. This allows for training on this dataset in only 6 h on a single state-of-the-art GPU. We used the same dataset as was used for the feature-based approach and performed a fivefold cross validation. For training, a dataset augmentation, which is specific to the image properties, is used to provide enough samples. In Table 4, the performance of this approach is shown in detail. The overall accuracy is 96.3% and, thus, similar to the machine learning result. Some details of the misclassifications differ between the two approaches: All contaminations are classified as what they actually are. The QuickTeach approach performs better in classifying the coating cracks. The difficulty of classifying micro-compressions is the same with both approaches. Contaminations are difficult for the feature-based approach to classify, as they are more random in their appearance and sometimes not easy to tell apart. Here the strength of the deep learning network shows, as it can learn properties of such contaminations without being restricted to certain pre-engineered properties.
In conclusion, we have no clear winner performance-wise. The two approaches are very different in the secondary properties, such as engineering and traceability. For the task at hand, the deep learning approach shows more strength on a much bigger dataset and is, thus, relevant for future large-scale industrial applications.
3.4. Enhancement of Defect Detection through Tracking and Tracing
With the help of the detection system, it is possible to detect defects inline and to classify them directly. This allows for quality control of the electrode coating and drying with direct assessment of the coating defects. Furthermore, a statement can be made regarding the number and frequency of defects and their sizes that occur in an electrode batch. On the basis of this data and the knowledge of the respective severity of the defect, the quality of the batch and scrap can be defined, and a quality grading can be implemented. However, since a decision on the definition of rejects is not meaningful based on the total number of defects, it is necessary to assign the detected defects to the individual electrode sections and trace them back to the electrode sheet level. At this point, the tracking and tracing system is suitable for tracing the electrode defects down to the cell level [20,32]. The defect detection system was equipped with an inkjet printer and a data matrix code (DMC) reader to provide more than just a statement regarding the number and frequency of a particular defect per batch. With the help of the printer, DMCs are applied to the side of the electrode at regular intervals. Due to the known offset among print position, code reading, and defect detection, the detected defects are automatically assigned to the respective codes. By that, the knowledge of which defects are found on a specific electrode sheet, and where this defect can be found in the subsequent cell is not completely lost. As shown in Figure 7, by linking the defect detection system to the tracking system (TS), it is possible to define not only which defect number is to be found in which cell but also the total defect area as the sum of the individual defects. This allows the influences of defects on the electrochemical performance to be identified and described more easily and quickly in future work. Areas with critical defects can be rejected or grading of the electrode sheets can be performed.
4. Conclusions
On the basis of experience with different electrode types and mixing, coating, and drying devices, we have defined eight defect classes for the battery electrode production. These eight classes are detected by the inline defect detection system on the basis of their brightness value compared with the surrounding electrode surface. After the detection is completed, different feature values are calculated for each defect image and used for automated classification through machine learning. We showed that approximately 800 defects were taught to lay a basis for the algorithm with a reclassification accuracy by the algorithm of 95%. The detection system automatically uses forty-four defect image features to classify the detected electrode defects, including features such as aspect ratio, contrast, percent fill, and many more. Except for only minor differences among the defect classes for single features, the number of features used allows for a robust and reliable defect classification. We discussed that the detection and classification of electrode defects in combination with tracking and tracing lead to the possibility of reducing scrap because of a direct connection of individual defects to single electrode sheets. In the future, we will investigate more closely the effect of certain defects, their sizes, and their quantities on certain aspects of the performance of lithium-ion battery cells, such as cycling stability, internal resistance, impedance, and safety. Furthermore, the continuous detection of the defects on the electrode, including data on the position in and orthogonal to the web direction, could be used for tracking the electrode without code using fingerprint tracking. Inline defect detection is a commonly used quality assurance technique in many production processes, such as those for paper or glass. In this paper, we showed that by using the correct defect catalogue, this system could also be used for the defect detection in electrode production either after the drying step or after the calendering with industrial production speeds. However, the defect detection after the calendering shows some challenges due to the electrode’s high reflectivity—which also depends on the calendering pressure—and the ripply behavior of the band afterward.
Supplementary Materials
The following supporting information can be downloaded at: https://www.mdpi.com/article/10.3390/batteries9020111/s1, Figure S1. Exemplary defect pictures of all defined classes.
Author Contributions
Conceptualization, A.S. and R.M.; methodology, A.S., R.M. and J.H.; software, J.H.; validation, A.S. and R.M.; formal analysis, A.S., R.M. and J.H.; investigation, A.S. and R.M.; resources, A.S. and R.M.; data curation, A.S., R.M. and J.H.; writing—original draft preparation, A.S., R.M., J.H. and A.K.; writing—review and editing, A.S., R.M., J.H. and A.K.; visualization, R.M. and A.S.; supervision, A.K.; project administration, A.K.; funding acquisition, A.K. All authors have read and agreed to the published version of the manuscript.
Funding
The authors gratefully acknowledge the German - Federal Ministry of Economic Affairs and Climate Action (BMWK) and the Project Management Agency Jülich (PTJ) for their support and funding within the projects “DaLion 4.0—Data Mining as Basis for cyber-physical Systems in Production of Lithium-ion Battery Cells (03ETE017A)”, “EVOLi2S—Evaluation of the technical economic advantages of the open cell module for lithium ion and lithium sulphur batteries with regard to stationary and mobile application (03ETE009A)” and the BMBF—Federal Ministry of Education and Research for funding the project TrackBatt — Tracking and Tracing in Battery Production (03XP0310C).
Data Availability Statement
Data can be provided by the authors.
Acknowledgments
We would like to thank Alexander Neuberger and Jan-Michael Kröhnke for their assistance with electrode production and the defect detection system.
Conflicts of Interest
The authors declare no conflict of interest.
References
- Li, J.; Fleetwood, J.; Hawley, W.B.; Kays, W. From Materials to Cell: State-of-the-Art and Prospective Technologies for Lithium-Ion Battery Electrode Processing. Chem. Rev. 2022, 122, 903–956. [Google Scholar] [CrossRef] [PubMed]
- Hawley, W.B.; Li, J. Electrode manufacturing for lithium-ion batteries—Analysis of current and next generation processing. J. Energy Storage 2019, 25, 100862. [Google Scholar] [CrossRef]
- Ravikumar, V.R.; Schröder, A.; Köhler, S.; Çetinel, F.A.; Schmitt, M.; Kondrakov, A.; Eberle, F.; Eichler-Haeske, J.-O.; Klein, D.; Schmidt-Hansberg, B. γ-Valerolactone: An Alternative Solvent for Manufacturing of Lithium-Ion Battery Electrodes. ACS Appl. Energy Mater. 2021, 4, 696–703. [Google Scholar] [CrossRef]
- Kim, H.-K.; Choi, J.H.; Lee, K.-J. A Numerical Study of the Effects of Cell Formats on the Cycle Life of Lithium Ion Batteries. J. Electrochem. Soc. 2019, 166, A1769–A1778. [Google Scholar] [CrossRef]
- Quinn, J.B.; Waldmann, T.; Richter, K.; Kasper, M.; Wohlfahrt-Mehrens, M. Energy Density of Cylindrical Li-Ion Cells: A Comparison of Commercial 18650 to the 21700 Cells. J. Electrochem. Soc. 2018, 165, A3284–A3291. [Google Scholar] [CrossRef]
- Kwade, A.; Haselrieder, W.; Leithoff, R.; Modlinger, A.; Dietrich, F.; Droeder, K. Current status and challenges for automotive battery production technologies. Nat. Energy 2018, 3, 290–300. [Google Scholar] [CrossRef]
- Kornas, T.; Daub, R.; Karamat, M.Z.; Thiede, S.; Herrmann, C. Data-and Expert-Driven Analysis of Cause-Effect Relationships in the Production of Lithium-Ion Batteries. In Proceedings of the 2019 IEEE 15th International Conference on Automation Science and Engineering (CASE), Vancouver, BC, Canada, 22–26 August 2019; IEEE: Piscataway, NJ, USA, 2019; pp. 380–385, ISBN 978-1-7281-0356-3. [Google Scholar]
- Reynolds, C.D.; Slater, P.R.; Hare, S.D.; Simmons, M.J.; Kendrick, E. A review of metrology in lithium-ion electrode coating processes. Mater. Des. 2021, 209, 109971. [Google Scholar] [CrossRef]
- David, L.; Ruther, R.E.; Mohanty, D.; Meyer, H.M.; Sheng, Y.; Kalnaus, S.; Daniel, C.; Wood, D.L. Identifying degradation mechanisms in lithium-ion batteries with coating defects at the cathode. Appl. Energy 2018, 231, 446–455. [Google Scholar] [CrossRef]
- Habedank, J.B.; Endres, J.; Schmitz, P.; Zaeh, M.F.; Huber, H.P. Femtosecond laser structuring of graphite anodes for improved lithium-ion batteries: Ablation characteristics and process design. J. Laser Appl. 2018, 30, 32205. [Google Scholar] [CrossRef]
- Habedank, J.B.; Kriegler, J.; Zaeh, M.F. Enhanced Fast Charging and Reduced Lithium-Plating by Laser-Structured Anodes for Lithium-Ion Batteries. J. Electrochem. Soc. 2019, 166, A3940–A3949. [Google Scholar] [CrossRef]
- Habedank, J.B.; Kraft, L.; Rheinfeld, A.; Krezdorn, C.; Jossen, A.; Zaeh, M.F. Increasing the Discharge Rate Capability of Lithium-Ion Cells with Laser-Structured Graphite Anodes: Modeling and Simulation. J. Electrochem. Soc. 2018, 165, A1563–A1573. [Google Scholar] [CrossRef]
- Mohanty, D.; Hockaday, E.; Li, J.; Hensley, D.K.; Daniel, C.; Wood, D.L. Effect of electrode manufacturing defects on electrochemical performance of lithium-ion batteries: Cognizance of the battery failure sources. J. Power Sources 2016, 312, 70–79. [Google Scholar] [CrossRef]
- Günther, T.; Schreiner, D.; Metkar, A.; Meyer, C.; Kwade, A.; Reinhart, G. Classification of Calendering-Induced Electrode Defects and Their Influence on Subsequent Processes of Lithium-Ion Battery Production. Energy Technol. 2020, 8, 1900026. [Google Scholar] [CrossRef]
- Kai Peter, B.; Max, W.; Michael, O. Handbook on Smart Battery Cell Manufacturing: The Power of Digitalization; World Scientific Pub Co. Inc.: Hackensack, NJ, USA, 2022; ISBN 9789811245619. [Google Scholar]
- Yang, L.; Chen, H.-S.; Song, W.-L.; Fang, D. Effect of Defects on Diffusion Behaviors of Lithium-Ion Battery Electrodes: In Situ Optical Observation and Simulation. ACS Appl. Mater. Interfaces 2018, 10, 43623–43630. [Google Scholar] [CrossRef]
- Akdemir, B.; Öztürk, Ş. Glass Surface Defects Detection with Wavelet Transforms. IJMMM 2015, 3, 170–173. [Google Scholar] [CrossRef]
- Ngan, H.Y.; Pang, G.K.; Yung, N.H. Automated fabric defect detection—A review. Image Vis. Comput. 2011, 29, 442–458. [Google Scholar] [CrossRef]
- Huber, J.; Tammer, C.; Krotil, S.; Waidmann, S.; Hao, X.; Seidel, C.; Reinhart, G. Method for Classification of Battery Separator Defects Using Optical Inspection. Procedia CIRP 2016, 57, 585–590. [Google Scholar] [CrossRef]
- Wessel, J.; Schoo, A. Traceability in Battery Cell Production. Energy Technol. 2022, 5, 762–793. [Google Scholar] [CrossRef]
- Riexinger, G.; Doppler, J.P.; Haar, C.; Trierweiler, M.; Buss, A.; Schöbel, K.; Ensling, D.; Bauernhansl, T. Integration of Traceability Systems in Battery Production. Procedia CIRP 2020, 93, 125–130. [Google Scholar] [CrossRef]
- Westphal, B.G.; Kwade, A. Critical electrode properties and drying conditions causing component segregation in graphitic anodes for lithium-ion batteries. J. Energy Storage 2018, 18, 509–517. [Google Scholar] [CrossRef]
- Tsneg, Y.-H.; Tsai, D.-M. Defect detection of uneven brightness in low-contrast images using basis image representation. Pattern Recognit. 2010, 43, 1129–1141. [Google Scholar] [CrossRef]
- Xu, J.; Liu, Y.; Xie, H.; Luo, F. Surface Quality Assurance Method for Lithium-Ion Battery Electrode Using Concentration Compensation and Partiality Decision Rules. IEEE Trans. Instrum. Meas. 2020, 69, 3157–3169. [Google Scholar] [CrossRef]
- Kraytsberg, A.; Ein-Eli, Y. Conveying Advanced Li-ion Battery Materials into Practice the Impact of Electrode Slurry Preparation Skills. Adv. Energy Mater. 2016, 6, 1600655. [Google Scholar] [CrossRef]
- Hoffmann, L.; Kasper, M.; Kahn, M.; Gramse, G.; Ventura Silva, G.; Herrmann, C.; Kurrat, M.; Kienberger, F. High-Potential Test for Quality Control of Separator Defects in Battery Cell Production. Batteries 2021, 7, 64. [Google Scholar] [CrossRef]
- Lim, S.; Kim, S.; Ahn, K.H.; Lee, S.J. Stress Development of Li-Ion Battery Anode Slurries during the Drying Process. Ind. Eng. Chem. Res. 2015, 54, 6146–6155. [Google Scholar] [CrossRef]
- Westphal, B.; Bockholt, H.; Gunther, T.; Haselrieder, W.; Kwade, A. Influence of Convective Drying Parameters on Electrode Performance and Physical Electrode Properties. ECS Trans. 2015, 64, 57–68. [Google Scholar] [CrossRef]
- Hagiwara, H.; Suszynski, W.J.; Francis, L.F. A Raman spectroscopic method to find binder distribution in electrodes during drying. J. Coat. Technol. Res. 2014, 11, 11–17. [Google Scholar] [CrossRef]
- Baunach, M.; Jaiser, S.; Schmelzle, S.; Nirschl, H.; Scharfer, P.; Schabel, W. Delamination behavior of lithium-ion battery anodes: Influence of drying temperature during electrode processing. Dry. Technol. 2016, 34, 462–473. [Google Scholar] [CrossRef]
- Kumberg, J.; Müller, M.; Diehm, R.; Spiegel, S.; Wachsmann, C.; Bauer, W.; Scharfer, P.; Schabel, W. Drying of Lithium-Ion Battery Anodes for Use in High-Energy Cells: Influence of Electrode Thickness on Drying Time, Adhesion, and Crack Formation. Energy Technol. 2019, 7, 1900722. [Google Scholar] [CrossRef]
- Sahore, R.; Wood, D.L.; Kukay, A.; Grady, K.M.; Li, J.; Belharouak, I. Towards Understanding of Cracking during Drying of Thick Aqueous-Processed LiNi 0.8 Mn 0.1 Co 0.1 O 2 Cathodes. ACS Sustain. Chem. Eng. 2020, 8, 3162–3169. [Google Scholar] [CrossRef]
- Fink, K.E.; Polzin, B.J.; Vaughey, J.T.; Major, J.J.; Dunlop, A.R.; Trask, S.E.; Jeka, G.T.; Spangenberger, J.S.; Keyser, M.A. Influence of metallic contaminants on the electrochemical and thermal behavior of Li-ion electrodes. J. Power Sources 2022, 518, 230760. [Google Scholar] [CrossRef]
- Wang, H.; Tan, H.; Luo, X.; Wang, H.; Ma, T.; Lv, M.; Song, X.; Jin, S.; Chang, X.; Li, X. The progress on aluminum-based anode materials for lithium-ion batteries. J. Mater. Chem. A 2020, 8, 25649–25662. [Google Scholar] [CrossRef]
- Kurfer, J.; Westermeier, M.; Tammer, C.; Reinhart, G. Production of large-area lithium-ion cells—Preconditioning, cell stacking and quality assurance. CIRP Ann. 2012, 61, 1–4. [Google Scholar] [CrossRef]
- Du, Z.; Rollag, K.M.; Li, J.; An, S.J.; Wood, M.; Sheng, Y.; Mukherjee, P.P.; Daniel, C.; Wood, D.L. Enabling aqueous processing for crack-free thick electrodes. J. Power Sources 2017, 354, 200–206. [Google Scholar] [CrossRef]
- Jaiser, S.; Funk, L.; Baunach, M.; Scharfer, P.; Schabel, W. Experimental investigation into battery electrode surfaces: The distribution of liquid at the surface and the emptying of pores during drying. J. Colloid Interface Sci. 2017, 494, 22–31. [Google Scholar] [CrossRef]
- Kriegler, J.; Hille, L.; Stock, S.; Kraft, L.; Hagemeister, J.; Habedank, J.B.; Jossen, A.; Zaeha, M.F. Enhanced performance and lifetime of lithium-ion batteries by laser structuring of graphite anodes. Appl. Energy 2021, 303, 117693. [Google Scholar] [CrossRef]
- Park, J.; Song, H.; Jang, I.; Lee, J.; Um, J.; Bae, S.; Kim, J.; Jeong, S.; Kim, H.-J. Three-dimensionalization via control of laser-structuring parameters for high energy and high power lithium-ion battery under various operating conditions. J. Energy Chem. 2022, 64, 93–102. [Google Scholar] [CrossRef]
- Pfleging, W.; Gotcu, P. Femtosecond Laser Processing of Thick Film Cathodes and Its Impact on Lithium-Ion Diffusion Kinetics. Appl. Sci. 2019, 9, 3588. [Google Scholar] [CrossRef]
- Hille, L.; Xu, L.; Keilhofer, J.; Stock, S.; Kriegler, J.; Zaeh, M.F. Laser structuring of graphite anodes and NMC cathode—Proportionate influence on electrode characteristics and cell performance. Electrochim. Acta 2021, 392, 139002. [Google Scholar] [CrossRef]
- Gutoff, E.B. Coating and Drying Defects: Troubleshooting Operating Problems, 2nd ed.; Wiley-Interscience: Hoboken, NJ, USA, 2006; ISBN 9780471713685. [Google Scholar]
- Spiegel, S.; Heckmann, T.; Altvater, A.; Diehm, R.; Scharfer, P.; Schabel, W. Investigation of edge formation during the coating process of Li-ion battery electrodes. J. Coat. Technol. Res. 2022, 19, 121–130. [Google Scholar] [CrossRef]
- Zheng, X.; Zheng, S.; Kong, Y.; Chen, J. Recent advances in surface defect inspection of industrial products using deep learning techniques. Int. J. Adv. Manuf. Technol. 2021, 113, 35–58. [Google Scholar] [CrossRef]
- Zhu, X.; Kundu, S.K.; Bangalore Ramaiah, N.K. Automatic Surface Defect Inspection System Using Convolutional Neural Networks. IOP Conf. Ser. Mater. Sci. Eng. 2020, 999, 12012. [Google Scholar] [CrossRef]
- Czimmermann, T.; Ciuti, G.; Milazzo, M.; Chiurazzi, M.; Roccella, S.; Oddo, C.M.; Dario, P. Visual-Based Defect Detection and Classification Approaches for Industrial Applications-A SURVEY. Sensors 2020, 20, 20051459. [Google Scholar] [CrossRef] [PubMed]
- O’Mahony, N.; Campbell, S.; Carvalho, A.; Harapanahalli, S.; Hernandez, G.V.; Krpalkova, L.; Riordan, D.; Walsh, J. Deep Learning vs. Traditional Computer Vision. In Advances in Computer Vision; Arai, K., Kapoor, S., Eds.; Springer International Publishing: Cham, Switzerland, 2020; pp. 128–144. ISBN 978-3-030-17794-2. [Google Scholar]
- Ren, R.; Hung, T.; Tan, K.C. A Generic Deep-Learning-Based Approach for Automated Surface Inspection. IEEE Trans. Cybern. 2018, 48, 929–940. [Google Scholar] [CrossRef]
- Badmos, O.; Kopp, A.; Bernthaler, T.; Schneider, G. Image-based defect detection in lithium-ion battery electrode using convolutional neural networks. J. Intell. Manuf. 2020, 31, 885–897. [Google Scholar] [CrossRef]
- Bhatt, P.M.; Malhan, R.K.; Rajendran, P.; Shah, B.C.; Thakar, S.; Yoon, Y.J.; Gupta, S.K. Image-Based Surface Defect Detection Using Deep Learning: A Review. J. Comput. Inf. Sci. Eng. 2021, 21, 4049535. [Google Scholar] [CrossRef]
- He, K.; Zhang, X.; Ren, S.; Sun, J. Deep Residual Learning for Image Recognition. arXiv 2016, arXiv:1512.03385. [Google Scholar] [CrossRef]
- Paszke, A.; Gross, S.; Massa, F.; Lerer, A.; Bradbury, J.; Chanan, G.; Killeen, T.; Lin, Z.; Gimelshein, N.; Antiga, L.; et al. PyTorch: An Imperative Style, High-Performance Deep Learning Library. arXiv 2019, arXiv:1912.01703. [Google Scholar] [CrossRef]
- Abadi, M.; Agarwal, A.; Barham, P.; Brevdo, E.; Chen, Z.; Citro, C.; Corrado, G.S.; Davis, A.; Dean, J.; Devin, M.; et al. TensorFlow: Large-Scale Machine Learning on Heterogeneous Distributed Systems. 2016. Available online: http://arxiv.org/pdf/1603.04467v2 (accessed on 26 January 2023).
- Konovalov, D.A.; Saleh, A.; Domingos, J.A.; White, R.D.; Jerry, D.R. Estimating Mass of Harvested Asian Seabass Lates calcarifer from Images. WJET 2018, 6, 15–23. [Google Scholar] [CrossRef] [Green Version]
Figure 1.
Measurement setup of the optical detection system with a camera and two lights in different angles to the camera. LED A and B are turned on alternatingly allowing for simultaneous detection with scattered light (LED A turned on) and direct reflection (LED B turned on). The scale shown represents 1 mm.
Figure 2.
Detection filters and their effect on noise (phantom defects) and real defects.

Figure 3.
Set defect types for the electrode production on a continuous pilot scale coater: (a) Agglomerate, (b) Coating Crack, (c) Contamination, (d) Micro-compression, (e) Mud Crack, (f) Pinhole, (g) Slip, and (h) Stripe. The scale shown represents 1 mm. More defect pictures are shown in the Supplementary Information.
Figure 4.
Typical defect types caused by different process steps and environmental conditions.

Figure 5.
Examples of defect picture features for different defect classes: (a) Moment Relationship, (b) Roundness, (c) Percent Fill, (d) Average Intensity.
Figure 5.
Examples of defect picture features for different defect classes: (a) Moment Relationship, (b) Roundness, (c) Percent Fill, (d) Average Intensity.

Figure 6.
Exemplary defect pictures of different classes: (a) mud crack; (b,c) contamination (fluff); (d–f) pinhole and (g) stripe. The scale shown represents 1 mm.
Figure 6.
Exemplary defect pictures of different classes: (a) mud crack; (b,c) contamination (fluff); (d–f) pinhole and (g) stripe. The scale shown represents 1 mm.

Figure 7.
Assignment of certain defect to the respective electrode ID.


Table 1.
Impact level of different defects on handling in consecutive process steps and on the electrochemical electrode performance: 0 = none, 1 = low, 2 = medium, and 3 = high.
Table 1.
Impact level of different defects on handling in consecutive process steps and on the electrochemical electrode performance: 0 = none, 1 = low, 2 = medium, and 3 = high.
| Defect | Impact Level Handling | Impact Level Electrode Performance |
|---|---|---|
| Agglomerate | 1–2 | 2 |
| Coating cracks | 2 | 1–2 |
| Contaminations | 1 | 1–3 |
| Micro-compressions | 0 | 0–1 |
| Mud cracks | 2–3 | 3 |
| Pinholes | 0 | 1–2 |
| Slips | 2 | 3 |
| Stripes | 0 | 2–3 |
Table 2.
Selected investigated defect features used by the algorithm for automated defect classification.
Table 2.
Selected investigated defect features used by the algorithm for automated defect classification.
| Feature | Short Description | Main Feature |
|---|---|---|
| Dark field | ||
| Aspect ratio | Ratio of length to width of the defect (according to web direction) | Shape |
| Roundness | Defect circumference divided by real defect area (values = 1 equals circle) | Shape |
| Percent fill | Real defect area divided by area of the enveloping rectangle | Compactness |
| Moment relationship | Real aspect ratio, also suitable for diagonal defects | Shape |
| Maximum brightness | Maximum brightness in defect area | Brightness |
| Maximum contrast | Maximum defect contrast compared with background | Brightness |
| Minimal contrast | Minimal defect contrast compared with background | Brightness |
| Average contrast | Average contrast of the defect area against background | Brightness |
| Mean defect-to-area ratio | Ratio of the average size of defect parts in composite defects to the total defect area (similar to compactness). | Compactness |
| Number dark | Sum of dark defect pixels | Brightness |
| Number bright | Sum of bright defect pixels | Brightness |
| Brightness 75 | x75 of the defect brightness distribution | Brightness |
| Brightness 90 | x90 of the defect brightness distribution | Brightness |
| Bright field | ||
| Aspect ratio | Ratio of length to width of the defect (according to web direction) | Shape |
| Roundness | Defect circumference divided by real defect area (values = 1 equals circle) | Shape |
| Moment relationship | Real aspect ratio, also suitable for diagonal defects | Shape |
| Average intensity | Average brightness of defect area | Brightness |
| Defect standard deviation | Standard deviation of the brightness of the defect pixels | Brightness |
| Maximum contrast | Maximum defect contrast compared with background | Brightness |
| Mean sharpness 2 | Average contrast at defect edge between defect and background based on 2 pixels each | Brightness |
| Maximum defect-to-area ratio | Ratio of the average size of defect parts in composite defects to the total defect area (similar to compactness). | Compactness |
Table 3.
Reclassification accuracy of taught defects (lines) by machine learning algorithm (columns) with selected defect features (lines add up to 100%).
Table 3.
Reclassification accuracy of taught defects (lines) by machine learning algorithm (columns) with selected defect features (lines add up to 100%).
| Classification Accuracy (%) | Agglome-rate | Coating Crack | Contami-nation | Micro-Compression | Mud Crack | Pinhole | Slip | Stripe |
|---|---|---|---|---|---|---|---|---|
| Agglomerate | 92.73 | 1.82 | 2.73 | 1.82 | 0.91 | |||
| Coating crack | 0.99 | 99.01 | ||||||
| Contamination | 1.94 | 90.29 | 0.97 | 5.83 | 0.97 | |||
| Micro-compression | 0.96 | 2.88 | 96.15 | |||||
| Mud crack | 2.56 | 95.73 | 1.71 | |||||
| Pinhole | 0.95 | 1.90 | 93.33 | 2.86 | 0.95 | |||
| Slip | 1.39 | 1.39 | 97.22 | |||||
| Stripe | 0.93 | 0.93 | 1.85 | 96.30 |
Table 4.
Reclassification accuracy of taught defects (lines) by deep learning algorithm (lines add up to 100%).
Table 4.
Reclassification accuracy of taught defects (lines) by deep learning algorithm (lines add up to 100%).
| Classification Accuracy (%) | Agglome-rate | Coating Crack | Conta-mination | Micro-Compression | Mud Crack | Pinhole | Slip | Stripe |
|---|---|---|---|---|---|---|---|---|
| Agglomerate | 96.19 | 2.86 | 0.95 | |||||
| Coating crack | 95.00 | 5.00 | ||||||
| Contamination | 100.00 | |||||||
| Micro-compression | 0.74 | 1.48 | 96.30 | 1.48 | ||||
| Mud crack | 2.00 | 98.00 | ||||||
| Pinhole | 2.50 | 1.67 | 95.00 | 0.83 | ||||
| Slip | 4.29 | 94.29 | 1.43 | |||||
| Stripe | 1.18 | 1.18 | 97.65 |
Disclaimer/Publisher’s Note: The statements, opinions and data contained in all publications are solely those of the individual author(s) and contributor(s) and not of MDPI and/or the editor(s). MDPI and/or the editor(s) disclaim responsibility for any injury to people or property resulting from any ideas, methods, instructions or products referred to in the content. |
© 2023 by the authors. Licensee MDPI, Basel, Switzerland. This article is an open access article distributed under the terms and conditions of the Creative Commons Attribution (CC BY) license (https://creativecommons.org/licenses/by/4.0/).
Share and Cite
MDPI and ACS Style
Schoo, A.; Moschner, R.; Hülsmann, J.; Kwade, A. Coating Defects of Lithium-Ion Battery Electrodes and Their Inline Detection and Tracking. Batteries 2023, 9, 111. https://doi.org/10.3390/batteries9020111
AMA Style
Schoo A, Moschner R, Hülsmann J, Kwade A. Coating Defects of Lithium-Ion Battery Electrodes and Their Inline Detection and Tracking. Batteries. 2023; 9(2):111. https://doi.org/10.3390/batteries9020111
Chicago/Turabian StyleSchoo, Alexander, Robin Moschner, Jens Hülsmann, and Arno Kwade. 2023. "Coating Defects of Lithium-Ion Battery Electrodes and Their Inline Detection and Tracking" Batteries 9, no. 2: 111. https://doi.org/10.3390/batteries9020111
Note that from the first issue of 2016, this journal uses article numbers instead of page numbers. See further details here.