
Apparent Aging during Accelerated Cycling Aging Test of Cylindrical Silicon Containing Li-Ion Cells

Technische Hochschule Ingolstadt, Research Group Electromobility and Learning Systems, D-85049 Ingolstadt, Germany
*
Author to whom correspondence should be addressed.
Batteries 2023, 9(4), 230; https://doi.org/10.3390/batteries9040230
Submission received: 7 March 2023
/
Revised: 27 March 2023
/
Accepted: 13 April 2023
/
Published: 18 April 2023
(This article belongs to the Special Issue Lithium-Ion Batteries Aging Mechanisms, 2nd Edition)
Abstract
:Accelerated cyclic aging tests are very important for research and industry to quickly characterize lithium-ion cells. However, the accentuation of stress factors and the elimination of rest periods lead to an apparent capacity fade, that can be subsequently recovered during a resting phase. This effect is attributed to the inhomogeneous lithium distribution in the anode and is observable with differential voltage analysis (DVA). We tested cylindrical 18,650 cells with Li(NixCoyAlz)O2-graphite/silicon chemistry during two cycling and resting phases. The capacity, the pulse resistance, the DVA, and the capacity difference analysis are evaluated for cells cycled at different average SOC and current rates. An apparent capacity loss of up to 12% was reported after 200 FCE for cells cycled under the presence of pressure gradients, while only 1% were at low-pressure gradients. The subsequent recovery was up to 80% of the apparent capacity loss in some cases. The impact of silicon cannot be estimated as it shows no features in the dV/dQ curves. We observe a recovery of apparent resistance increase, which is not reported for cells with pure graphite anodes. Finally, we demonstrate the strong impact of apparent aging for the lifetime prediction based on standard accelerated cyclic aging tests.
1. Introduction
The ongoing energy transition requires high-performance and durable lithium-ion batteries for various grid-connected and mobile applications. Within the electric vehicle industry, for instance, energy storage systems may have a lifetime of over 8 years [1]. To avoid long test periods, cyclic aging tests are typically accelerated by increasing stress factors [2,3] such as current, state of charge (SOC), depth of discharge (DOD), and temperature, as well as eliminating rest periods, in contrast to real-world applications. This prevalent procedure leads to an underestimated lifetime prediction during real-life operation when the prediction models rely on accelerated cyclic aging test data.
In a work by Epding et al. [4], the influence of test pauses during cyclic aging tests was investigated using NMC/Graphite cells. In their experiment, on one side, the reduction of test pauses reduced the cycle life of the cells; on the other side, the pauses at 100% SOC led to a direct capacity increase that is not explainable by the anode overhang effect. On this account, at 100% SOC [5], active lithium would rather be lost to the anode overhang appearing in a capacity loss instead of a capacity increase. The examined cells were fixed between aluminum plates. The fixation of cells must be considered during cyclic aging tests as reported by Lewerenz et al. [6]. In their work, cells were cycled continuously at 6 to 12% DOD around five different average SOCs that were distributed over the full SOC range. The compressed cells revealed higher capacity losses at lower and higher average SOCs. In these SOC windows, the graphite active material exhibits a pressure gradient due to cell breathing [7,8,9]. Around 50% average SOC, the lowest aging rates were observed. In this SOC window, there is a plateau in the expansion, leading to only a very low-pressure gradient. In a subsequent rest phase at different storage SOCs, they observed capacity recovery for the cells cycled at high and low average SOCs. In a differential voltage analysis (DVA), they demonstrated a flattening of characteristic features over cycling and a reappearing of those features after recovery during rest. Moreover, they highlighted no significant flattening of features around 50% average SOC. They attributed this effect to the homogeneity of lithium distribution (HLD) over the electrode that was inhomogenized during high-current cycling and homogenized during rest periods. Hence, they concluded that pressure gradients over SOC play a key role in this phenomenon and its reversibility. In cases of higher measured apparent capacity losses, no influence on pulse resistance was reported.
In experiments using a cylindrical 18,650 format, the cells are not constrained with a defined compression. However, the expansion during breathing is limited by the cylindrical housing leading to an undefined pressure. In a comparable shallow cycling experiment, Ecker et al. [10] found, as well, for NMC/graphite higher losses at lower and higher average SOCs and the lowest losses around 50%.
In experiments using unconstrained pouch cells, Käbitz et al. [11] found increasing losses with higher average SOCs. These findings are confirmed by Lewerenz et al. [12] in a similar experiment investigating using another cell type. Hence, we conclude that this inhomogeneity effect appears in the moment of the expansion due to cell breathing being limited and turning into pressure.
For LiFePO4 (LFP)/graphite cells recovery was observed but at different average SOC compared to Li(NixMnyCoz)O2 (NMC)/graphite cells. Spingler et al. [13] investigated shallow cycling for various DOD windows and average SOC. In contrast to the previous NMC results, they found strong recovery around 50% average SOC as here, compared to NMC, the LFP voltage slope is very low, leading to low compensation currents. Moreover, they could show that the lithium distribution over the anode area was inhomogeneous after cycling. They found an accelerated recovery for higher temperatures and at 2 V where the voltage slope of the graphite is high.
This effect of inhomogeneous lithium distribution in presence of pressure gradients for NMC/graphite cells leads to the assumption that the different lithiated areas on the electrode have, on one side, a different cell potential that causes compensations currents over the electrode; on the other side, these electrode areas have as well a different cell expansion leading to spatial pressure gradients. As these inhomogeneities only appear in the presence of pressure gradients, the pressure gradients seem to hinder the compensation due to potential differences in the areas with different SOC.
To the best of our knowledge, the research did not investigate the impact of silicon on the phenomenon of the influence of cell pressure on recoverable capacity so far. Silicon has a volume expansion of about 300% including hysteresis [14] having potentially a great impact on cell pressure due to breathing. Silicon can significantly increment the energy density of lithium-ion cells and can be found nowadays more frequently in commercial cells [15].
In our work, we investigate silicon containing 18,650 cells for shallow cycling for three average SOC. In Section 3.1, we will focus on the influence of various current rates and the subsequent recovery and will examine what happens after repeating cycling and recovery phases. The evaluation of capacity and resistance losses and recovery will be discussed in Section 3.2. The link between capacity recovery and DVA will be given in Section 3.3. Finally, we highlight the impact of the reversible effect on the lifetime prediction of accelerated aging tests.
2. Materials and Methods
Thirteen cylindrical 18,650 cells of the type Samsung 35E were examined in this investigation. The technical cell features are in Table 1. The cells were investigated previously in the publications [7,16,17,18]. Kuntz and Popp et al. [19,20] reported a share of Si of 1.5% in the anode. The spread of the initial capacities is (3.39 ± 0.007) Ah, which was measured with C/15. For the execution of the tests, we used a test bench of Arbin Instruments (Model LBTa2030). The cells are kept in a temperature chamber from Binder (KB 115), guaranteeing a constant ambient temperature of 25 °C for the entire test. The cell temperatures during the cycling tests were measured at the cell housing. They range between 26 and 30 °C.
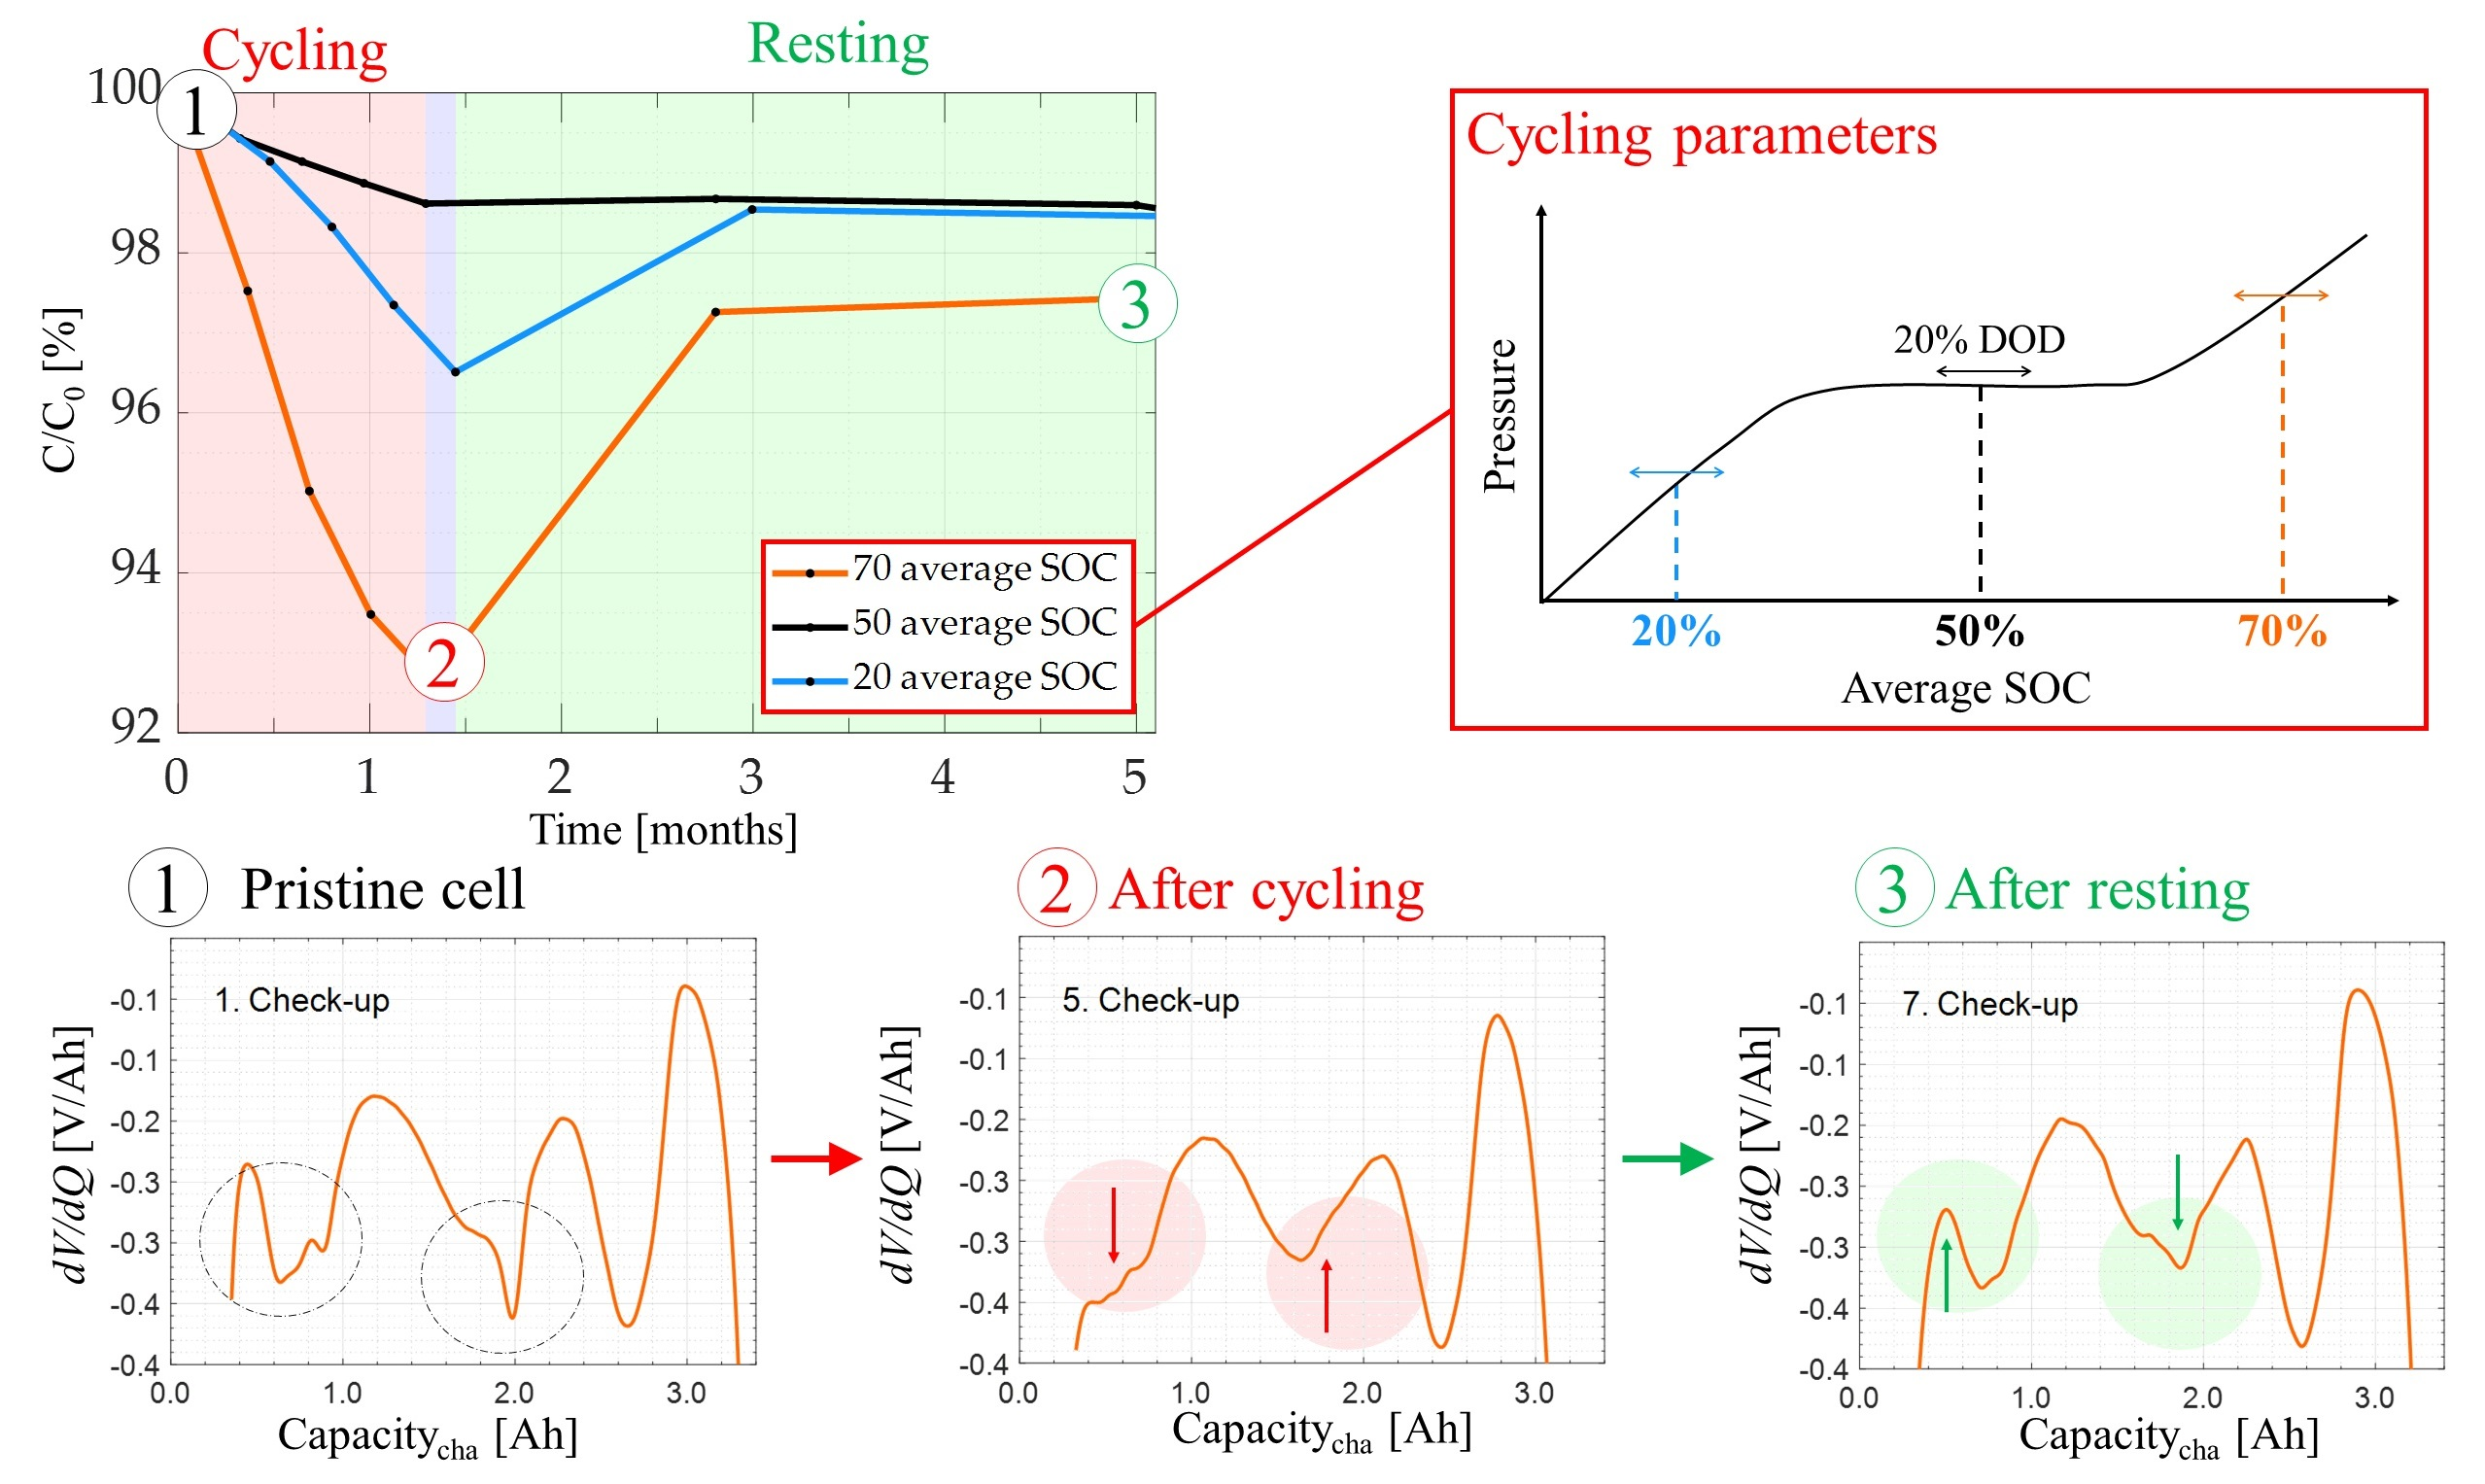
The test strategy consists of the recurrent cycling and resting of the cells. For this investigation, one cycling phase and the consequent resting phase are considered as one round. The test presented in this work contains two cycling-resting rounds. During the cyclic and resting phases, the SOH of the cell was measured with a check-up routine every 50 FCE or after an unspecified resting duration, as depicted in Figure 1. Cycling the cells with only 50 FCE between check-ups allows the formation of inhomogeneous lithium distribution at low risk of Li-plating, as it is not the aim to study irreversible aging but to analyze apparent aging and its recovery. During a check-up, the cells are at first charged CCCV to 4.2 V at C/3, followed by a CC discharge and CCCV charge with C/3 (Steps 1 and 2). Thereafter, a CC discharge (from 4.2 V to 2.65 V) followed by a CCCV charge with C/15 was performed (Steps 3 and 4). Various pulses were carried out with charging and discharging currents of 0.7C, 1C, and 1.4C at 10%, 50%, and 90% of the actual discharge capacity at C/15. After the check-up routine is carried out, the cells are charged with C/3 either to 12% SOC for resting or to the corresponding average SOC of the last measured capacity for cycling.
With this routine, we measured the capacity (Step 3) and the pulse resistance (Step 5) and conducted differential voltage analysis (DVA) and capacity difference analysis (CDA). The internal resistance was calculated by evaluating a discharge pulse test at 50% SOC with 1C after 20 s (Step 6). The other conducted pulse tests are part of a unified check-up routine of our project, but are beyond the scope of this publication.
For the cycling phase, the cells were charged up to a defined average SOC and then cycled with a defined DOD window. The charge/discharge currents were varied for different cells. The selection of the average SOC has a direct influence on the pressure gradient that the jelly-roll experiences during the cycling phase. Figure 2 shows a schematic of the pressure evolution over SOC of a cylindrical cell with a graphite anode.
To vary the pressure gradient, the average SOC was set to 20%, 50%, and 70%. The highest pressure gradients due to cell breathing are reported for 20% and 70% average SOC, while cells at 50% SOC reveal only small pressure gradients [21]. Studies that measured the can diameter change of cylindrical Si-containing cells are [7,8,9,16,17,22]. On this account, Willenberg [7,16,17] used the same cell used in this investigation. From [8,21,22], we assume a change of pressure in the jelly-roll produced mostly by the anode volume change and neglect the influence of the gas. The pressure is then a result of the metallic can confining the jelly-roll. As it is shown in the following section, these pressure gradients have a direct influence on the results of our investigation.
Since no formation of inhomogeneities are expected for cycling at 50% average SOC (reference cell), a variation of currents and DODs is provided only for cells at 20% and 70% average SOC. The DOD is varied between 20% and 30% using three pairs of charge and discharge currents. Detailed values are given in Table 2. Both cycling phases lasted around 2.5 months. Due to the different current rates, the cycling phases have a slightly different duration among the different cells.
After the first cycling sequence, the cells were rested at 3.45 V (12.3% SOC), with two check-ups conducted after 1.5 and 2.5 months. After the second cycling sequence, only one check-up was performed after 5 months during rest at 3.45 V. Due to a mistake in our procedure, cell 6 misses the last check-up.
3. Results and Discussion
3.1. Test Results: Cycling and Resting
To visualize the cycling and the resting phases in one graph, the measured capacity loss and resistance increase are plotted over time. The background of the plots represents the different phases during the tests. While the red background depicts the cycling phase, the green background shows the resting phases. The blue background represents the transition period between cycling and resting due to a time delay in the tests.
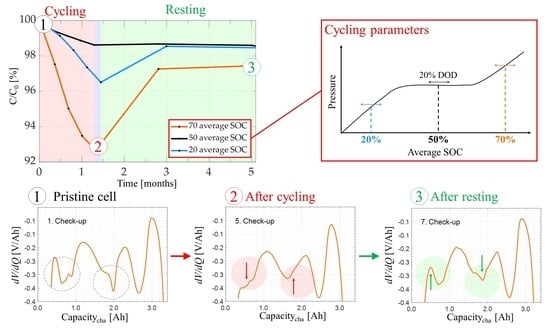
In Figure 3 the capacity (a) and pulse resistance (b) are plotted over the time for cells cycled at 20%, 50% (reference), and 70% average SOC with 20% DOD and with charge/discharge currents of 1360/2800 mA. During the first cycling phase of 1.5 months (about 200 FCE), the capacity decreases to 96% and 92% for cells cycled at 20% and 70% average SOC, while the reference cell at 50% preserves a capacity of 99%. During the first rest period of 3.5 months, the capacity of all cells with an average SOC of 20% and 70% increased and, including the cell at 50% SOC, reach a final value of about 98% (5 months). The alleged capacity loss induced during cycling can be recovered during a resting phase and is, consequently, only apparent aging.
The recovery is the strongest for the cells cycled around 20% and 70% average SOC, where the pressure gradient due to cell breathing is high (see Figure 2). The cell cycled around 50% average SOC presents only a slight recovery in comparison to the other cells. Regarding the cycling conditions, the only stress factor varied for this cell is the average SOC, which has a direct influence on the pressure gradient experienced by the cell during cycling (Figure 2). The low capacity recovery of this cell during the resting phase, along with the results of the cells cycled at 20% and 70% SOC, validate the previous hypothesis regarding the relationships between pressure gradients and the apparent capacity loss. Herein, the general results are in line with the ones reported by Lewerenz et al. [6] and Ecker et al. [11]. Nevertheless, in contrast to these publications, the resistance presents a different behavior.
The resistance shows high apparent aging during cycling followed by a significant recovery during resting, as depicted in Figure 3b. Similar to the behavior of the capacity, the resistance recovery during resting is the strongest in the presence of a pressure gradient during cycling (see Figure 2). The impact of cycling on resistance recovery might be an effect of the 1.5% Si in the anode, for a strong voltage and expansion hysteresis is reported in [8,19].
Figure 4 (Capacity) and Figure 5 (Resistance) present the aging results for cells cycled with different charge and discharge currents. The results are shown in a matrix arrangement with the average SOCs of 20% and 70% and the DODs of 20% and 70%. As expected, the apparent aging increases with higher cycling currents. In nearly all cases, more than 50% of the apparent capacity loss is recovered after the resting phase during the first cycling-resting round. This is also the case for the resistance. A clear aging trend due to the influence of DOD and average SOC is not evident.
For all the tests, with exception of the reference cell, the apparent aging during cycling is recovered during the resting phases, at least in a small amount. Nevertheless, the capacity evolution during one resting phase does not always show a recovery trend. For instance, the capacity of the cell cycled at 20% average SOC with 20% DOD with the currents 1360 mA/2800 mA (graph on the top left in Figure 4) shows a capacity loss between the months 3 and 5 (end of resting), which can be attributed to calendar aging during this period.
The apparent aging and its recovery can be observed in the first and second rounds (see Figure 3). Thus, the phenomenon occurs after a cycling phase, independently of the cell age. For a proper comparison of the capacity and resistance aging and recovery, the following section offers an evaluation of the aging rates and relative recovered the apparent capacity loss.
3.2. Evaluation of Aging Rates and Recovery
In the following, the rates of capacity loss and resistance increase during both cycling phases are compared. This analysis is complemented by the recovered apparent aging, which is explained consequently for all tested cells.
For the sake of simplicity, we assume a linear aging behavior for the capacity loss and resistance increase. Both aging rates are determined from the resulting slope between the initial and final values of the corresponding cycle phase. The results are presented in Figure 6, with the capacity loss rate on the left and the resistance increase rate on the right. The aging rate at 50% average SOC (black and grey bars) is comparably low for both cycling periods. In contrast to this, cycling at around 20% and 70% average SOC shows at higher charge/discharge currents a significantly lower aging rate during the 2nd cycling phase for resistance and capacity (bars with lighter colors). Only for lower currents the capacity loss rates are in both cycling phases roughly the same. The reasons for these different aging rates are further discussed in Section 3.3 with a focus on the homogeneity of lithium distribution.
Considering solely the aging rates for estimating the effects of different stress factors in the battery cycle life leads to erroneous conclusions. An analysis of the aging rates is complemented by the recoverable apparent aging, whose value provides the amount of recovered capacity/resistance relative to the apparent loss/increment during cycling. To neglect the influence of calendar aging and obtain the highest possible recovery with our test data, the relative recovery was computed by dividing the highest capacity value during the resting phase by the capacity value after the cycling phase (see Figure A1 in Appendix A).
The relative recovery of the cycling-resting tests is shown in Figure 7, arranged in a matrix form with the average SOC of 20% and 70% and the DOD of 20% and 30%. During the first round, all cells recover around 60% of the apparent capacity loss during cycling, with the exception of the cell cycled with 1020/2000 mA at 70% average SOC and 30% DOD. During the second round, the amount of recovery is still considerable, with similar or lower values to the recovery during the first round. Thus, the apparent aging happens after every cycling phase. The amount of recoverable apparent aging, on the other hand, is dependent on different factors, such as average SOC, DOD, and cycling currents.
The stress factors varied in this test show some dependencies of the recovery with respect to average SOC, DOD, and charge/discharge currents. For instance, cells cycled at 20% DOD present a slightly higher recovery per round, than the ones at 30% DOD. This behavior can be attributed to the pressure gradient during cycling, which may reach the expansion plateau when the DOD window becomes larger (see Figure 2). Analogous to the aging rate, higher currents lead to higher recoverable apparent capacity loss. Contrary to this behavior, the cells cycled with a higher current intensity, presenting a lower recovered apparent capacity loss. Therefore, we assume irreversible lithium plating on the anode surface is provoked by the combination of an inhomogeneous lithium distribution and the corresponding current intensity. Additionally, the higher average SOC during cycling increases the chance of this happening.
The values in Figure 7 can simultaneously include recovery effects due to other factors. Nevertheless, the contribution of reversible lithium-plating can be excluded due to the moderate temperatures [23], as well as the anode overhang effect [16,21,24]. The capacity loss during cycling (Figure 6), and its recovery (Figure 7), must correspond to an additional phenomenon, namely, the distribution of lithium.
3.3. Differential Voltage Analysis and Lithium Distribution
In this section, the apparent cell aging and its recovery is investigated using Differential Voltage Analysis. Previously, similar tests were conducted in [6,13] with a cycling and a resting phase. The dV/dQ curves obtained during the cycling phase flatten and recover to their original shape during resting. This was associated with successive loss of coherence during charge/discharge, which is caused by the lateral lithium distribution over the electrode area, and which can be reversed during the resting phase. Grounding on these findings, we apply the DVA to our tests and present results in this section.
Our DVA consists of the comparison of the measured dV/dQ curve with a virtual curve, that presents only a capacity loss (stretching and shifting of the curve) but no change in the curve features (no flattening). This comparison allows observation of the HLD during the cycling and resting phases. The procedure is depicted in more detail in Figure A2 in Appendix B. For a single cell, we compare the dV/dQ curves, and their corresponding DVA, at the beginning of the test (1st check-up), after the 1st cycling phase (5th check-up), the 1st resting phase (8th check-up), the 2nd cycling phase (12th check-up) and the 2nd resting phase (13th check-up). The check-up number is given at the bottom right part of the graph. The transition from the resting to the cycling phase is depicted with thick red arrows, and with green arrows otherwise.
The DVA is applied to three exemplary cells (20%, 50%, and 70% average SOC) with the result in Figure 3. The peak height MinHiY illustrates the loss of HLD (plots in Figure 8 for 20% average SOC). It is computed by comparing the measured (black solid line) anode peak at 1.8 Ah with the expected (black dashed line) curve. As the dV/dQ curve of the cathode is virtually preserved, the red dashed line returns the resulting anode curve from the measured full cell curve and, thus, the HLD over the anode. The results show a high reproducibility for all three cells.
At 50% average SOC the shape of the measured dV/dQ curve is almost perfectly preserved after the cycling phase and shows only little flattening at 1.8 Ah. During the resting phase, the shape has fully recovered and there is no difference between the expected and the measured anode curve (solid and dashed red lines), supporting the aforementioned fitting strategy of the half-cell educated guess.
At 20% and 70% average SOC, a significantly stronger flattening is observed after the cycling phases, as the peaks flatten not only at 1.8 Ah, but also between 0.3 and 1 Ah. During the resting phase, the shape recovers to some extent without reaching the expected curve shape (solid red). Thus, the HLD during resting has not fully recovered to its original state. Moreover, the inhomogenization after the 1st cycling phase is stronger than after the 2nd cycling phase for both average SOCs. On this account, the apparent aging and its recovery, previously shown in Figure 3, Figure 4 and Figure 5, evidently correlate with the HLD.
Summarizing, along with the apparent aging and its recovery, the reversibility of the HLD occurs only for the cells cycled at 20% and 70% average SOC, where the pressure gradient is higher. The HLD remains consistent at 50% average SOC, which is in line with previous publications in the field [6,10]. Additionally, as the solid red lines show, the peaks of the dV/dQ curves change during the test only on the anode side. Hence, the distribution of lithium is inhomogeneous at the anode, and not at the cathode. Moreover, due to the potential difference among the different areas, the cut-off voltage is reached earlier during a check-up, and the extractable capacity is hindered.
The aforementioned potential difference should lead to a compensation current within the active material, that homogenizes the lithium distribution instantly during the cycling phase. Nevertheless, in the case of a pressure gradient (20% and 70% average SOC), this compensation current is somehow hindered. The particles in these areas, due to the inhomogeneous lithium distribution, have different volumes, and, thus, different local pressure. For a deeper understanding of this process, more experiments are needed.
3.4. Capacity Difference Analysis and Lithium Distribution
With CDA we evaluate the extractable capacity obtained during a low and a higher current discharge. The CDA method is well described and applied in [25,26]. In this case, the capacity obtained from the dV/dQ curve (C/15) and the capacity at nominal current (C/3) is used. In Figure 9, all curves have an initial value of 0.5–0.6 Ah, which is correlating to the near anode overhang, summing up to 1–2% of the nominal capacity. The curves rise during cycling and sink during resting to nearly the same initial value. The results show higher values during the cycling phase for higher charge/discharge currents, with the exception of the cell at 50% average SOC. This effect is significantly weaker during the 2nd cycling phase. A higher DOD, however, is not associated with higher values.
Combined with the findings for the DVA, CDA is a measure for inhomogeneity of laterally distributed lithium on the graphite anode. The difference of 12 h between the two discharge rates allows lithium-ions to move laterally in the x-y-plane in the anode and increases the amount of extractable lithium. In contrast to the trends for resistance in Figure 5, the capacity difference returns to the initial value and is not increasing over aging. Thus, CDA is a great method to measure HLD without measuring aging. A possible limit to the practicability of this method for this application is the formation of strong Li-plating [27] during testing.
3.5. Impact of Inhomogeneities on Lifetime Prediction
We demonstrated in the previous sections that the apparent aging (capacity and resistance) during cycling can be recovered to a large fraction. A reasonable explanation is the cycling-induced inhomogenization of the lithium distribution throughout the anode area, and its rehomogeneization during resting.
To predict the lifetime of lithium-ion cells the trends of capacity loss and resistance increase obtained by accelerated cyclic aging tests are extrapolated using different models [28,29,30,31,32,33]. To accelerate the cycle of aging, on the one side, stress factors such as current rates, DOD, or temperatures, are intensified, and, on the other side, idle periods during a typical application are eliminated. Thus, faster aging in a shorter test time is achieved. However, for this approach, a reliable model-based relation between the accelerated and the unaccelerated real-life application is required.
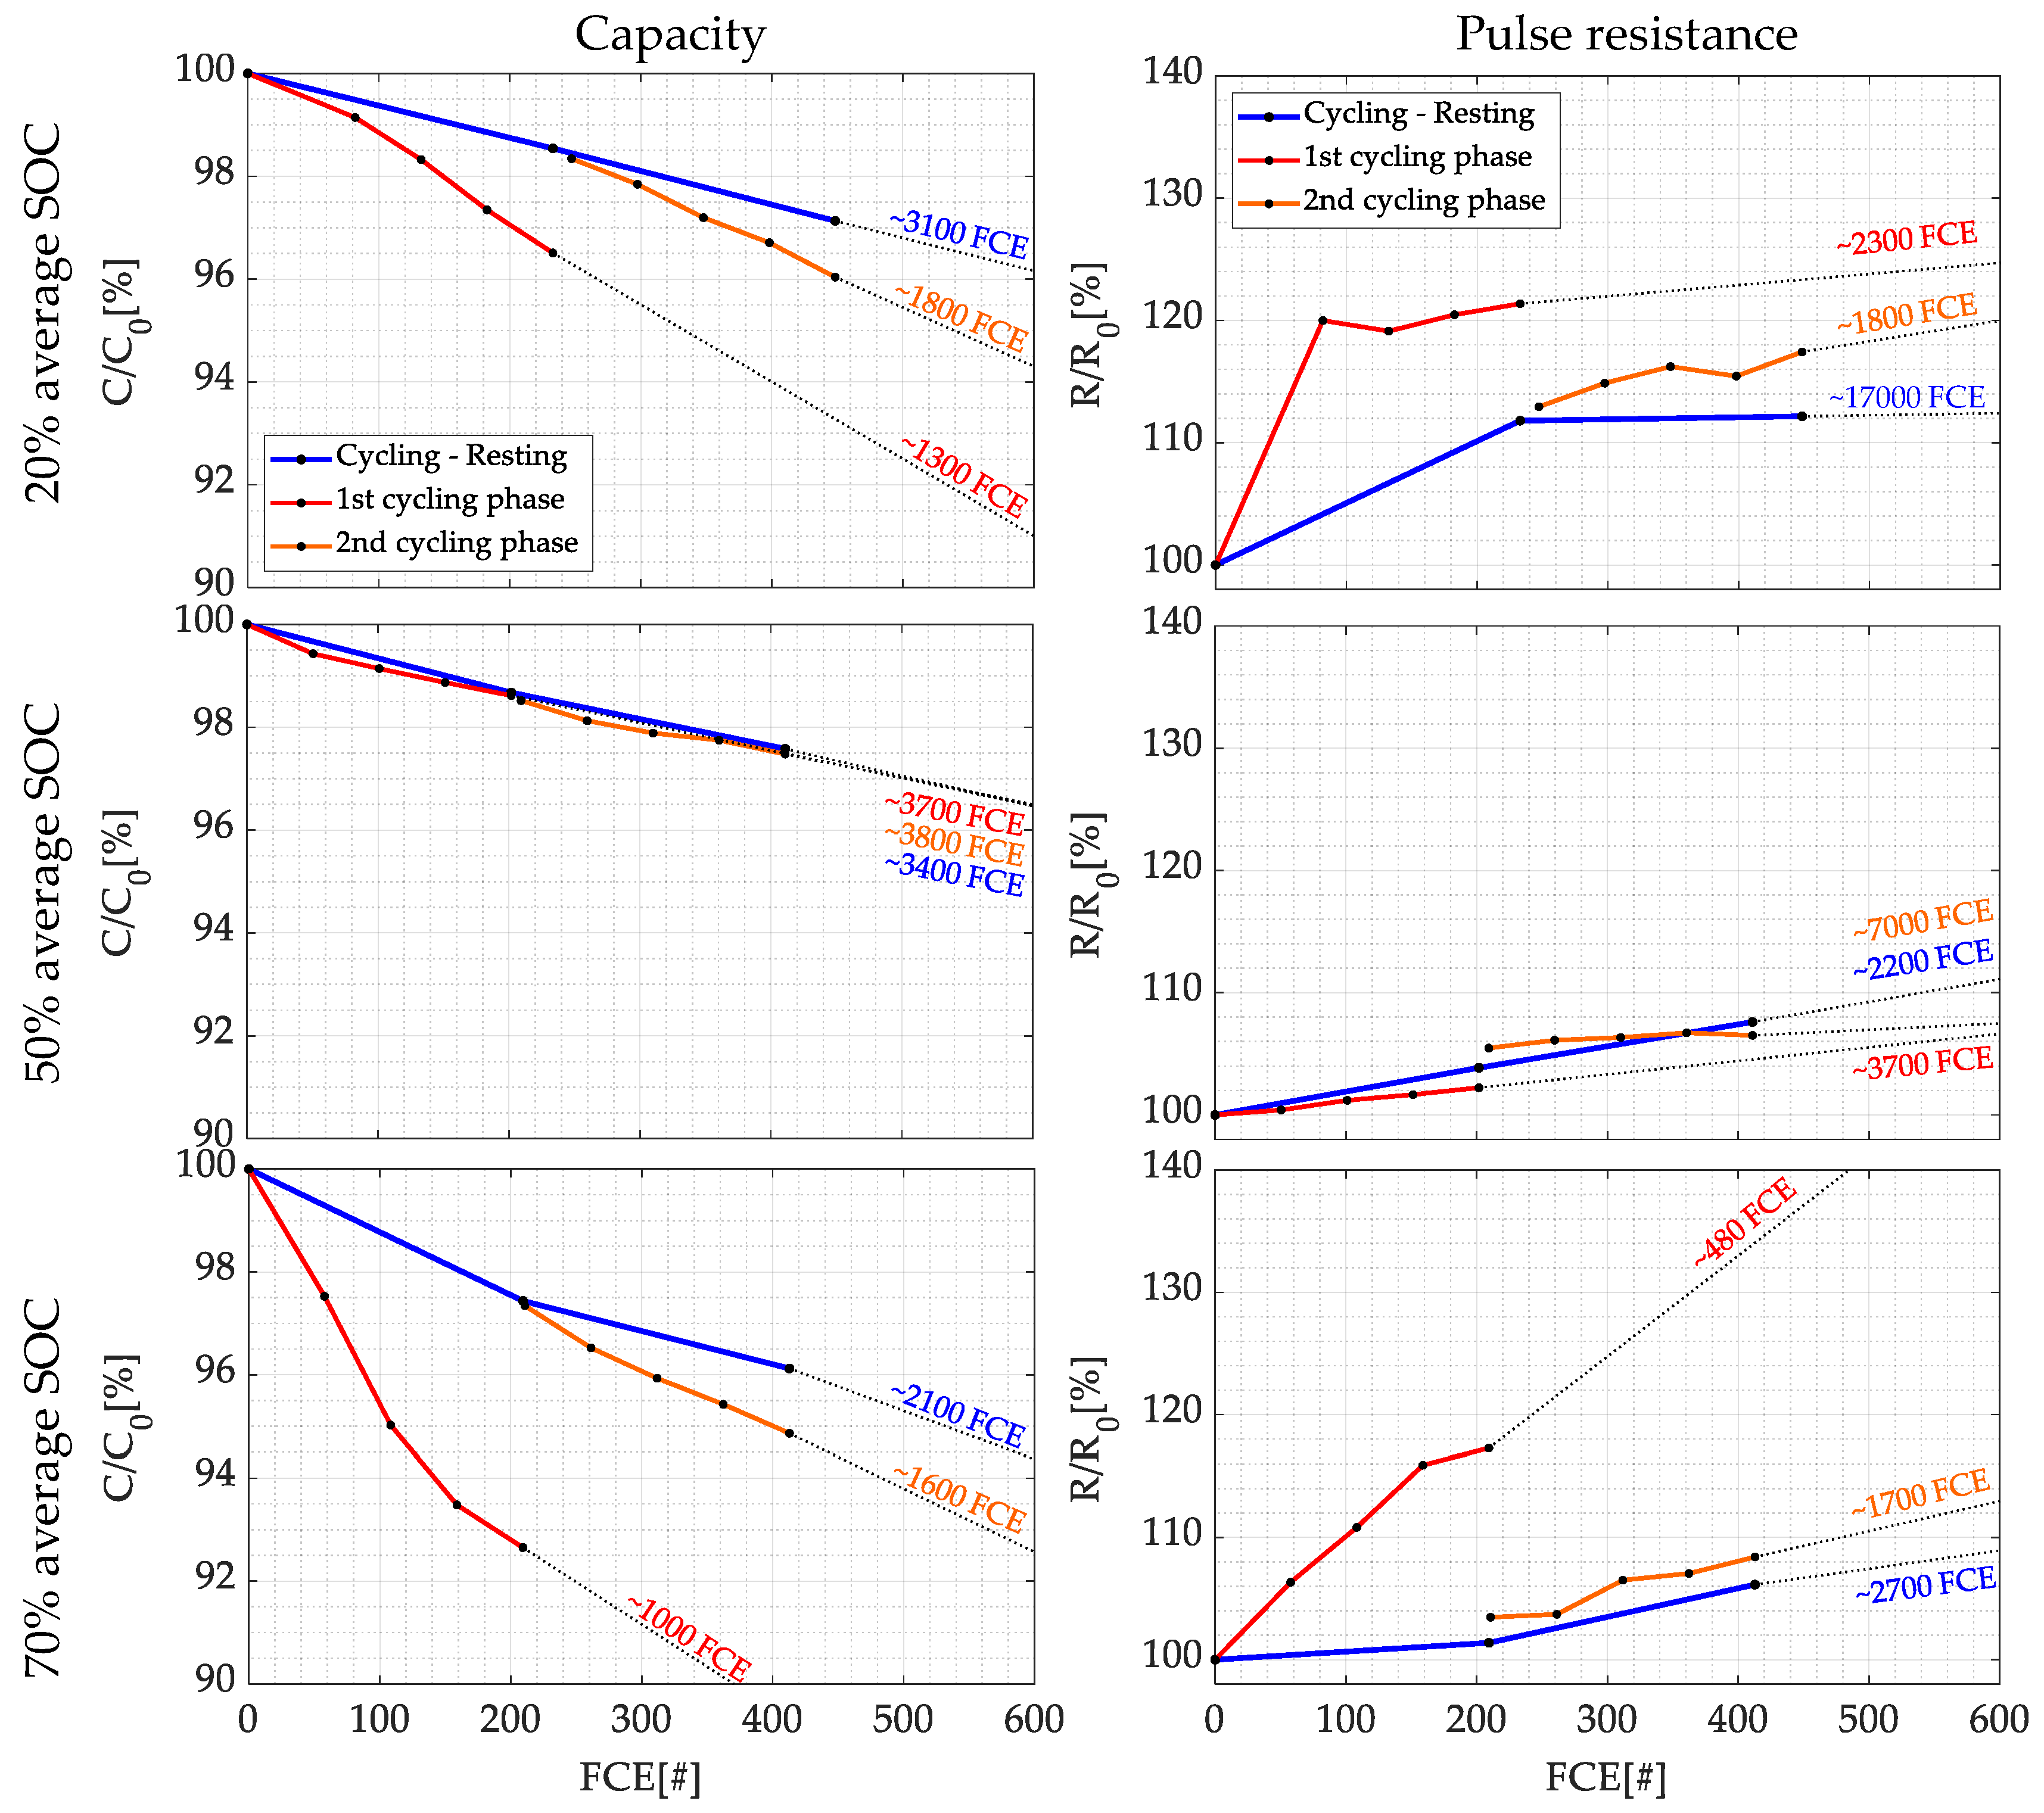
As depicted in the previous sections, the cells in this work present strong apparent aging under testing, which has a significant impact on lifetime prediction. In Figure 10, the cell capacity and resistance from Figure 3 are plotted over the FCE. In this manner, the resting periods are visually excluded from the graph, and a simple cycle lifetime estimation over FCE can be conducted (dashed line). Calendar aging is not considered for this estimation.
The curves in Figure 10 depict the apparent capacity loss and resistance increase for the 1st (red line) and 2nd (orange line) cycling phases. Additionally, the blue curve shows the aging rate of the cells when the resting phases are considered in the accelerated aging test. Thus, the three points corresponding to the blue curve consist of the initial capacity, the highest valued during the 1st resting phase, and the final value after the 2nd resting phase. For the three cases, the FCE is calculated when the capacity reaches 80% and the resistance 140%. These End-of-Life criterion corresponds to the standard established by the US Advanced Battery Consortium [34], which is still widely accepted in the automotive battery industry [35].
The computed cycle life has different values for the three aforementioned scenarios. The cycle life estimation for both cycling phases is, in comparison to the blue curve, highly overestimated. Hence, the recovery of apparent aging must be considered for the lifetime estimation of lithium-ion batteries based on an accelerated cyclic aging test.
4. Conclusions
Quick and accurate lifetime estimation of lithium-ion batteries is currently of extreme importance for the automotive, module, and cell manufacturing industries. On this account, we presented the results for accelerated cyclic aging tests with long resting periods on cylindrical lithium-ion cells of the type NCA/Si-graphite. The test consists of the cycling (250FCE) and subsequent resting (3 months) of the cells. During the cycling phase the DOD windows, average SOCs, and charge/discharge currents were strategically varied to focus higher pressure gradients. During the resting phase, all cells were set idle at 25 °C and 12% SOC.
The capacity loss after a cycling phase was recovered during the subsequent resting phase. This apparent aging was stronger for cells cycled with higher current rates and at 20% and 70% average SOC (high-pressure gradient). The cell cycled at 50% average SOC, with a low-pressure gradient, and presented almost no apparent aging.
During the first resting phase, around 60% of the apparent capacity loss was recovered. The recovery effect was also present after the second resting phase in a smaller, yet considerable amount. This apparent aging, and its recovery, could be associated with the homogeneity of lithium distribution (HLD) over the anode. Using differential voltage analysis (DVA), a strong correlation was found between the apparent aging (capacity loss and resistance increase) and the HLD of the anode. The cathode features of the dV/dQ curve remained the same over the test duration.
Additionally, the capacity difference analysis (CDA) correlated greatly with the computed HLD and the recovered apparent aging. In contrast to the cell resistance, the values of the CDA returned to their original state (no influence of aging). Along with the DVA, CDA is an adequate tool for the analysis of HLD in accelerated cyclic aging tests.
From the presented results and findings, we formulate the following hypothesis regarding accelerated cyclic aging tests, HLD, and pressure gradients, which are currently in our research interest:
- During the cycling phase, the pressure gradient has a more significant effect on the HLD, than constant pressure.
- During the cycling phase, the silicon content on the cell is responsible for the apparent resistance increase.
- During the cycling phase, pressure gradients impede the rehomogeneization of lithium distribution.
- During the resting phase, a pressure release of the jelly-roll accelerates the recovery of apparent capacity loss, along with a low resting SOC.
- Non-stop cycling of the cell causes an inhomogeneous lithium distribution in the anode, which promotes lithium platting, and that rarely occurs in field applications.
In summarizing, we conclude that for accurate lifetime estimation of lithium-ion batteries on basis of accelerated cyclic aging tests, the HLD must be better understood.
Author Contributions
Conceptualization, P.M.T., M.L. and C.E.; methodology, P.M.T. and M.L.; validation, P.M.T. and M.L.; formal analysis, P.M.T. and M.L.; investigation, P.M.T.; resources, M.L. and C.E.; data curation, P.M.T. and M.L., writing—original draft preparation, P.M.T. and M.L.; writing—review and editing, P.M.T. and M.L.; supervision, M.L.; project administration, C.E.; funding acquisition, M.L. and C.E. All authors have read and agreed to the published version of the manuscript.
Funding
The research is funded by the German Ministry of Education, Grant Nr. 03XP0320C.
Data Availability Statement
The data can be accessed here: https://doi.org/10.6084/m9.figshare.22644802.v2 (accessed on 5 March 2023).
Acknowledgments
Special thanks for the fruitful discussion and support to Julia Kowal, Marcel Rogge, Hülya Markl-Hahn and Philipp Dechent.
Conflicts of Interest
The authors declare no conflict of interest.
Appendix A. Calculation of the Relative Recovery
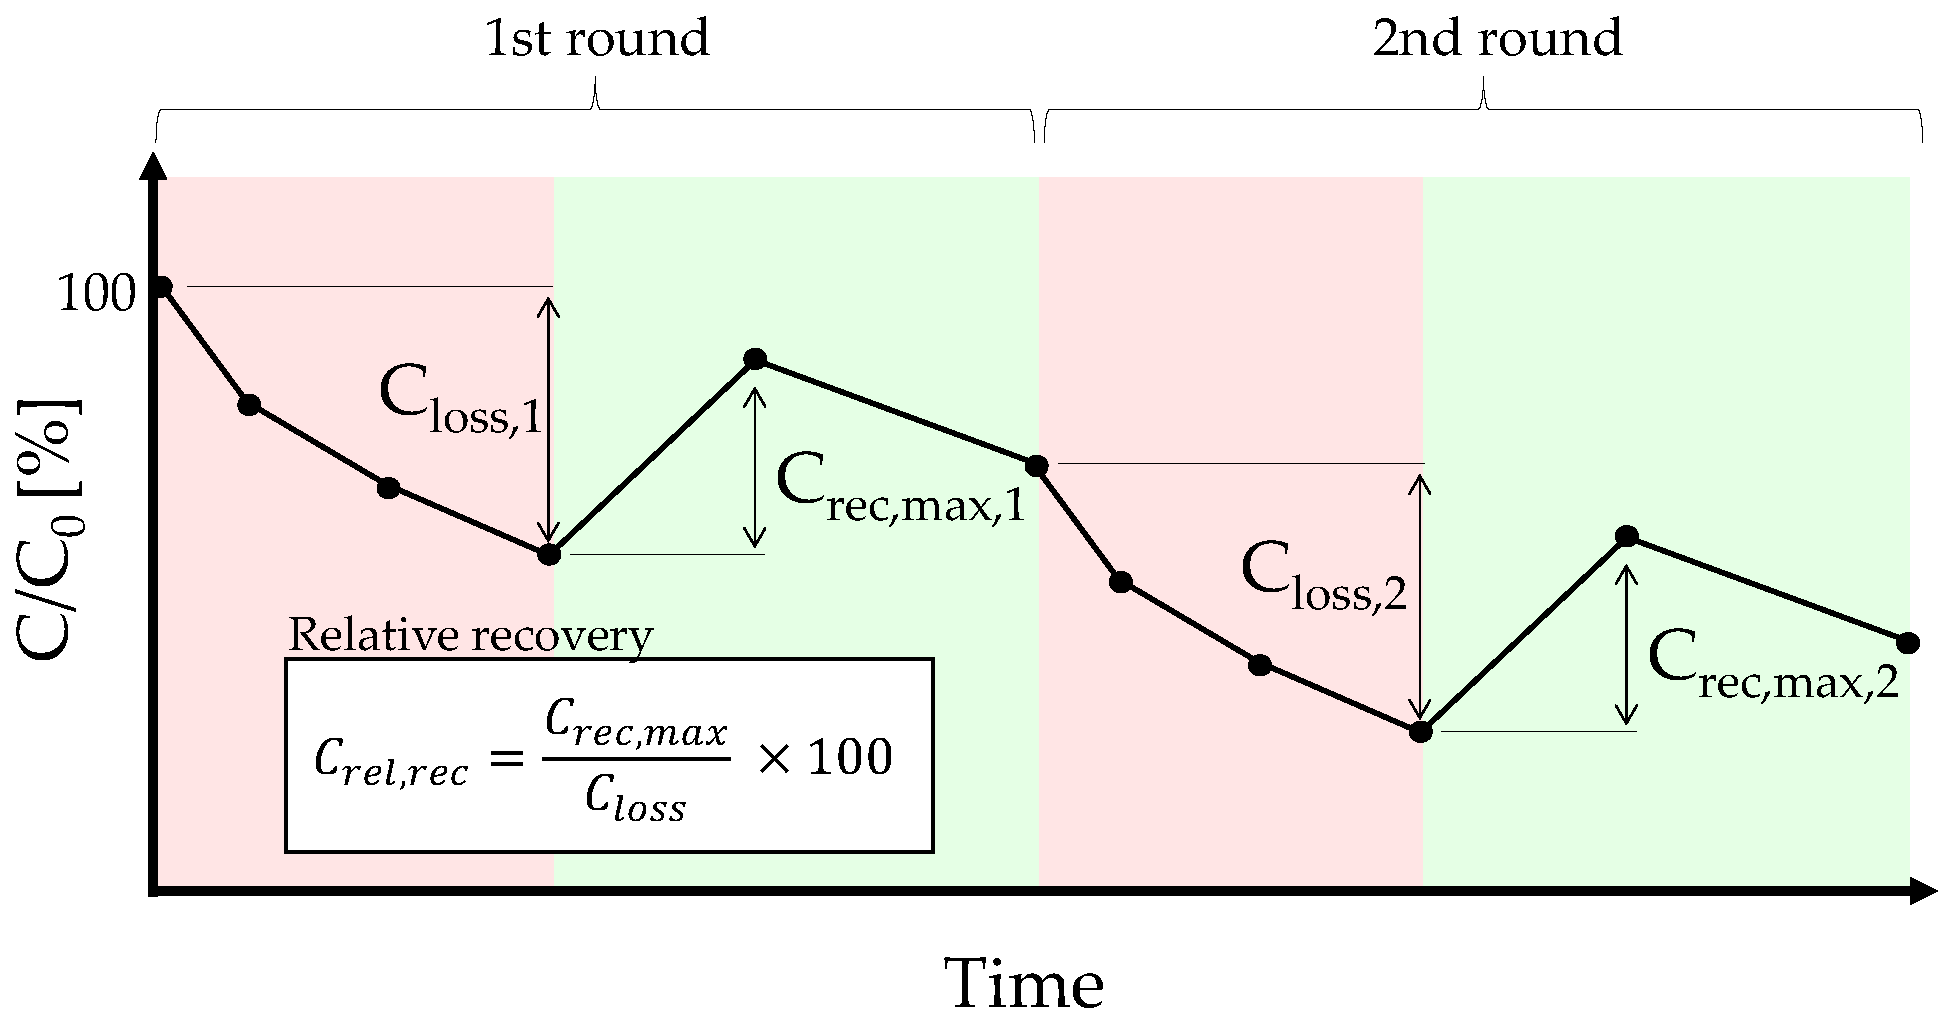
The apparent capacity loss and the subsequent recovery are depicted in Figure A1. To estimate the apparent capacity loss during both rounds, the first and the last capacity values during the cycling phase were selected. During recovery, the highest value that is reached during the resting phase is used. The relative recovery is the amount of capacity that can be recovered after a cycling phase.
Figure A1.
Schematic for the calculation of the relative recovery of apparent capacity loss and resistance increase.
Figure A1.
Schematic for the calculation of the relative recovery of apparent capacity loss and resistance increase.
Appendix B. Calculation of the DVA for the Estimation of HLD
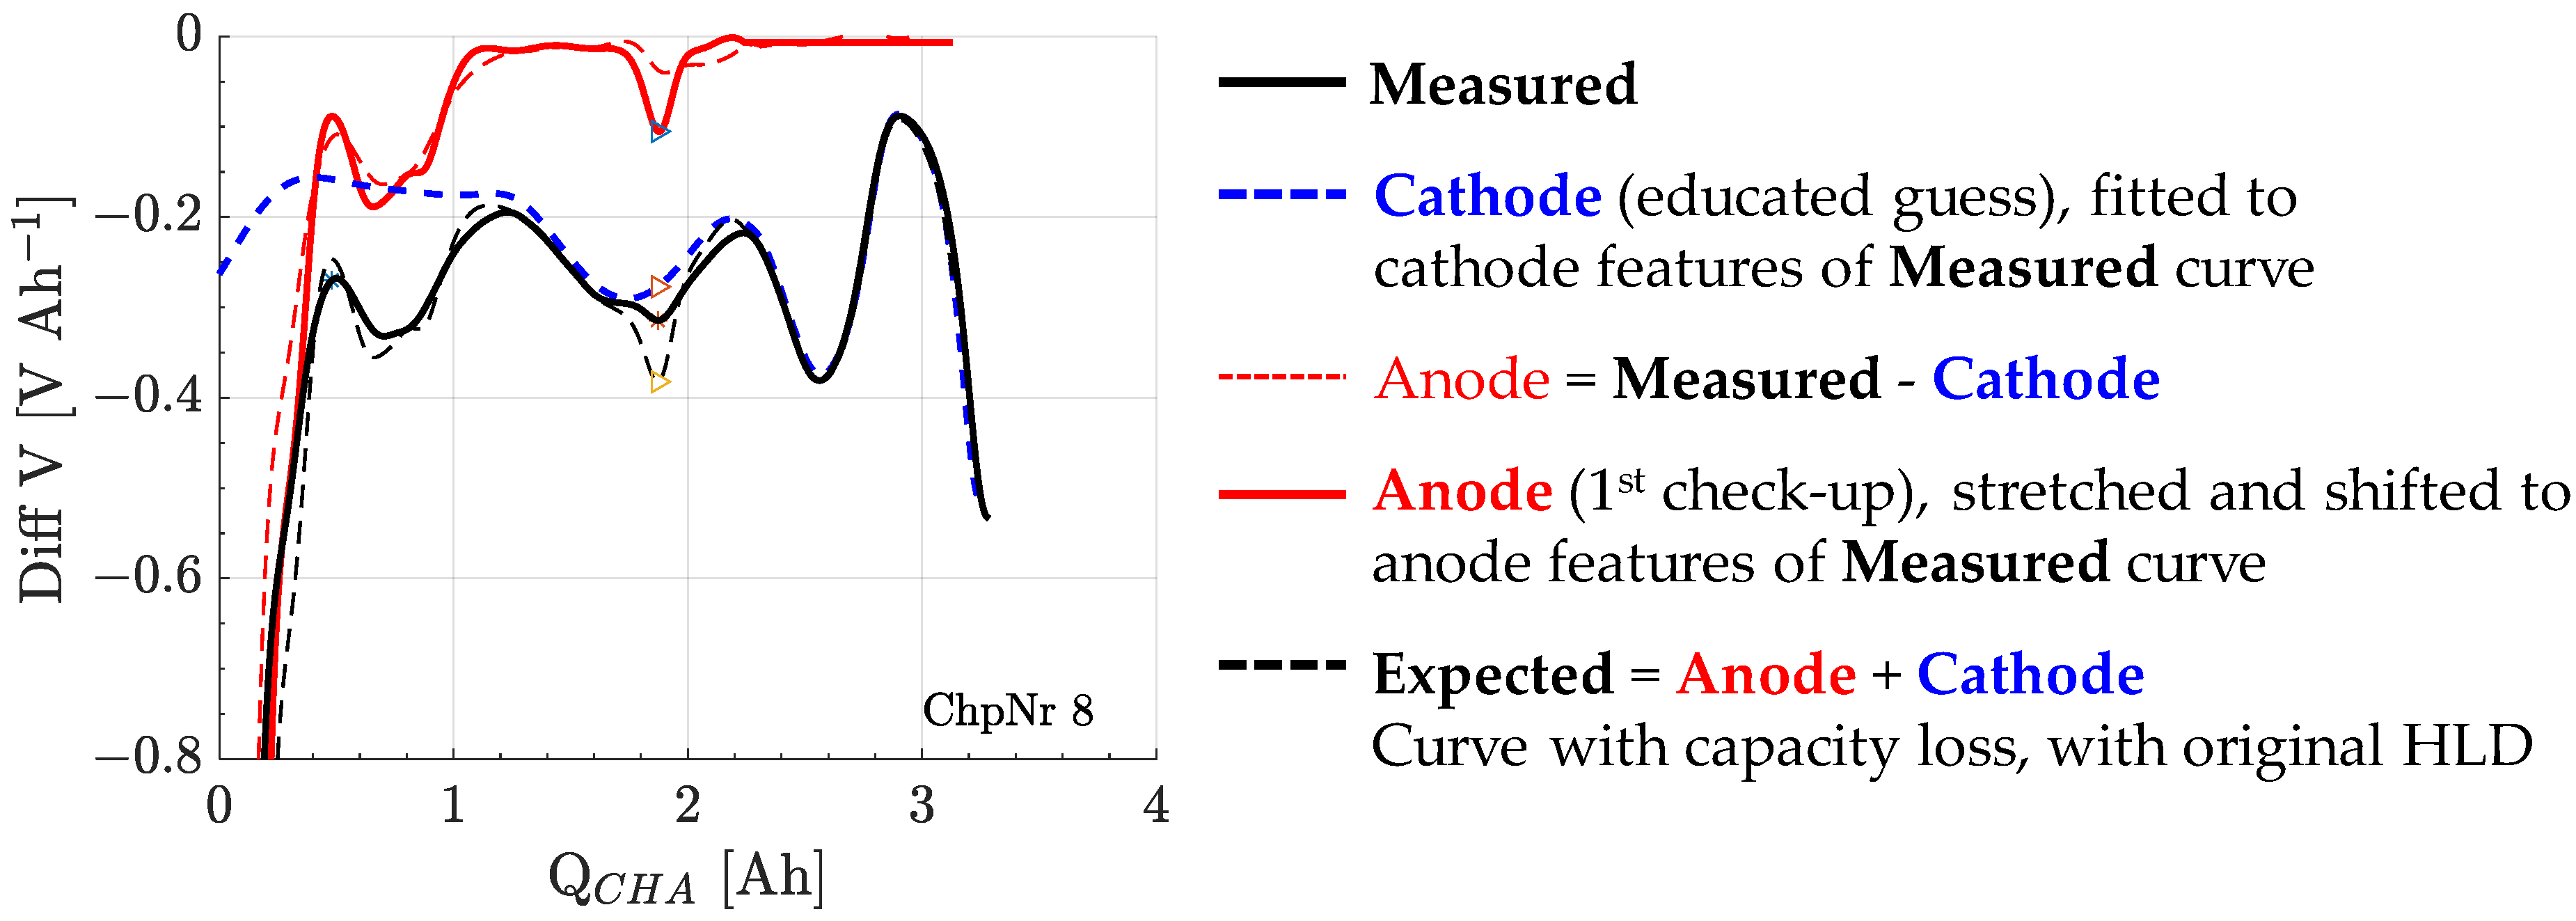
The measured full dV/dQ curve is depicted with a solid black line in Figure A2. It includes two major peaks associated to the anode and two minima and a maximum associated with the cathode. Since the features of the cathode material remain consistent for all cells during the whole test, our DVA is deployed as follows. Grounding on established dV/dQ curves of the respective electrodes (NCA and Gr), we can estimate the curve shape of the cathode curve (dashed blue line), fit it to the cathode features of the measured curve and calculate the anode curve (dashed red line). The calculated anode curved during the 1st check-up is then plotted (solid red line) with the dV/dQ curves of all other check-ups during the test. This allows a comparison of the HLD of the anode at the beginning of the test, with the current cell state. Finally, the expected full cell dV/dQ curve can be computed by adding the anode curve (solid red line) with the cathode curve (dashed blue line). The expected full cell dV/dQ curve (dashed black line) represents then a cell with lower capacity (shifting and stretching), but with preserved HLD (no curve flattening).
Figure A2.
Schematic for the calculation of the DVA for the estimation of HLD.
References
- Wassiliadis, N.; Steinsträter, M.; Schreiber, M.; Rosner, P.; Nicoletti, L.; Schmid, F.; Ank, M.; Teichert, O.; Wildfeuer, L.; Schneider, J.; et al. Quantifying the state of the art of electric powertrains in battery electric vehicles: Range, efficiency, and lifetime from component to system level of the Volkswagen ID.3. eTransportation 2022, 12, 100167. [Google Scholar] [CrossRef]
- Stadler, J.; Krupp, C.; Ecker, M.; Bandlow, J.; Spier, B.; Latz, A. Investigation and modeling of cyclic aging using a design of experiment with automotive grade lithium-ion cells. J. Power Sources 2022, 521, 230952. [Google Scholar] [CrossRef]
- Rechkemmer, S.K.; Zang, X.; Zhang, W.; Sawodny, O. Calendar and cycle aging study of a commercial LiMn2O4 cell under consideration of influences by cell progress. J. Energy Storage 2020, 30, 101547. [Google Scholar] [CrossRef]
- Epding, B.; Rumberg, B.; Jahnke, H.; Stradtmann, I.; Kwade, A. Investigation of significant capacity recovery effects due to long rest periods during high current cyclic aging tests in automotive lithium ion cells and their influence on lifetime. J. Energy Storage 2019, 22, 249–256. [Google Scholar] [CrossRef]
- Gyenes, B.; Stevens, D.A.; Chevrier, V.L.; Dahn, J.R. Understanding Anomalous Behavior in Coulombic Efficiency Measurements on Li-Ion Batteries. J. Electrochem. Soc. 2015, 162, A278–A283. [Google Scholar] [CrossRef]
- Lewerenz, M.; Dechent, P.; Sauer, D.U. Investigation of capacity recovery during rest period at different states-of-charge after cycle life test for prismatic Li(Ni1/3Mn1/3Co1/3)O2-graphite cells. J. Energy Storage 2019, 21, 680–690. [Google Scholar] [CrossRef]
- Willenberg, L.K.; Dechent, P.; Fuchs, G.; Sauer, D.U.; Figgemeier, E. High-Precision Monitoring of Volume Change of Commercial Lithium-Ion Batteries by Using Strain Gauges. Sustainability 2020, 12, 557. [Google Scholar] [CrossRef]
- Heugel, P.; Märkle, W.; Deich, T.; von Kessel, O.; Tübke, J. Thickness change and jelly roll deformation and its impact on the aging and lifetime of commercial 18650 cylindrical Li-ion cells with silicon containing anodes and nickel-rich cathodes. J. Energy Storage 2022, 53, 105101. [Google Scholar] [CrossRef]
- Hemmerling, J.; Guhathakurta, J.; Dettinger, F.; Fill, A.; Birke, K.P. Non-Uniform Circumferential Expansion of Cylindrical Li-Ion Cells—The Potato Effect. Batteries 2021, 7, 61. [Google Scholar] [CrossRef]
- Ecker, M.; Nieto, N.; Käbitz, S.; Schmalstieg, J.; Blanke, H.; Warnecke, A.; Sauer, D.U. Calendar and cycle life study of Li(NiMnCo)O2-based 18650 lithium-ion batteries. J. Power Sources 2014, 248, 839–851. [Google Scholar] [CrossRef]
- Käbitz, S.; Gerschler, J.B.; Ecker, M.; Yurdagel, Y.; Emmermacher, B.; André, D.; Mitsch, T.; Sauer, D.U. Cycle and calendar life study of a graphite|LiNi1/3Mn1/3Co1/3O2 Li-ion high energy system. Part A: Full cell characterization. J. Power Sources 2013, 239, 572–583. [Google Scholar] [CrossRef]
- Lewerenz, M.; Rahe, C.; Fuchs, G.; Endisch, C.; Sauer, D.U. Evaluation of shallow cycling on two types of uncompressed automotive Li (Ni1/3Mn1/3Co1/3)O2-Graphite pouch cells. J. Electrochem. Soc. 2020, 30, 101529. [Google Scholar] [CrossRef]
- Spingler, F.B.; Naumann, M.; Jossen, A. Capacity Recovery Effect in Commercial LiFePO4/Graphite Cells. J. Electrochem. Soc. 2020, 167, 40526. [Google Scholar] [CrossRef]
- Louli, A.J.; Li, J.; Trussler, S.; Fell, C.R.; Dahn, J.R. Volume, Pressure and Thickness Evolution of Li-Ion Pouch Cells with Silicon-Composite Negative Electrodes. J. Electrochem. Soc. 2017, 164, A2689–A2696. [Google Scholar] [CrossRef]
- Zhu, B.; Wang, X.; Yao, P.; Li, J.; Zhu, J. Towards high energy density lithium battery anodes: Silicon and lithium. Chem. Sci. 2019, 10, 7132–7148. [Google Scholar] [CrossRef] [PubMed]
- Willenberg, L.; Dechent, P.; Fuchs, G.; Teuber, M.; Eckert, M.; Graff, M.; Kürten, N.; Sauer, D.U.; Figgemeier, E. The Development of Jelly Roll Deformation in 18650 Lithium-Ion Batteries at Low State of Charge. J. Electrochem. Soc. 2020, 167, 120502. [Google Scholar] [CrossRef]
- Willenberg, L.K. Volume Expansion and Its Effects on the Ageing of a Cylindrical Lithium-Ion Battery. Ph.D. Thesis, RWTH Aachen University, Aachen, Germany, 2020. [Google Scholar]
- Parschau, A.; Degler, D.; Fill, A.; Birke, K.P.; Allmendinger, F. Cycle Tests on the Influence of Different Charging Currents—A Case Study on Different Commercial, Cylindrical Lithium Ion Cells. Batteries 2023, 9, 83. [Google Scholar] [CrossRef]
- Kuntz, P.; Raccurt, O.; Azaïs, P.; Richter, K.; Waldmann, T.; Wohlfahrt-Mehrens, M.; Bardet, M.; Buzlukov, A.; Genies, S. Identification of Degradation Mechanisms by Post-Mortem Analysis for High Power and High Energy Commercial Li-Ion Cells after Electric Vehicle Aging. Batteries 2021, 7, 48. [Google Scholar] [CrossRef]
- Popp, H.; Zhang, N.; Jahn, M.; Arrinda, M.; Ritz, S.; Faber, M.; Sauer, D.U.; Azais, P.; Cendoya, I. Ante-mortem analysis, electrical, thermal, and ageing testing of state-of-the-art cylindrical lithium-ion cells. Elektrotech. Inftech. 2020, 137, 169–176. [Google Scholar] [CrossRef]
- Lewerenz, M.; Fuchs, G.; Becker, L.; Sauer, D.U. Irreversible calendar aging and quantification of the reversible capacity loss caused by anode overhang. J. Energy Storage 2018, 18, 149–159. [Google Scholar] [CrossRef]
- Hemmerling, J.; Schäfer, J.; Jung, T.; Kreher, T.; Ströbel, M.; Gassmann, C.; Günther, J.; Fill, A.; Birke, K.P. Investigation of internal gas pressure and internal temperature of cylindrical Li-ion cells to study thermodynamical and mechanical properties of hard case battery cells. J. Energy Storage 2023, 59, 106444. [Google Scholar] [CrossRef]
- Petzl, M.; Danzer, M.A. Nondestructive detection, characterization, and quantification of lithium plating in commercial lithium-ion batteries. J. Power Sources 2014, 254, 80–87. [Google Scholar] [CrossRef]
- Dagger, T.; Kasnatscheew, J.; Vortmann-Westhoven, B.; Schwieters, T.; Nowak, S.; Winter, M.; Schappacher, F.M. Performance tuning of lithium ion battery cells with area-oversized graphite based negative electrodes. J. Power Sources 2018, 396, 519–526. [Google Scholar] [CrossRef]
- Lewerenz, M.; Warnecke, A.; Sauer, D.U. Introduction of capacity difference analysis (CDA) for analyzing lateral lithium-ion flow to determine the state of covering layer evolution. J. Power Sources 2017, 354, 157–166. [Google Scholar] [CrossRef]
- Lewerenz, M.; Sauer, D.U. Evaluation of cyclic aging tests of prismatic automotive LiNiMnCoO2-Graphite cells considering influence of homogeneity and anode overhang. J. Energy Storage 2018, 18, 421–434. [Google Scholar] [CrossRef]
- Lewerenz, M.; Warnecke, A.; Sauer, D.U. Post-mortem analysis on LiFePO4|Graphite cells describing the evolution & composition of covering layer on anode and their impact on cell performance. J. Power Sources 2017, 369, 122–132. [Google Scholar] [CrossRef]
- Schmid, A.U.; Ridder, A.; Hahn, M.; Schofer, K.; Birke, K.P. Aging of Extracted and Reassembled Li-ion Electrode Material in Coin Cells—Capabilities and Limitations. Batteries 2020, 6, 33. [Google Scholar] [CrossRef]
- Baghdadi, I.; Briat, O.; Delétage, J.-Y.; Gyan, P.; Vinassa, J.-M. Lithium battery aging model based on Dakin’s degradation approach. J. Power Sources 2016, 325, 273–285. [Google Scholar] [CrossRef]
- Baumhöfer, T.; Brühl, M.; Rothgang, S.; Sauer, D.U. Production caused variation in capacity aging trend and correlation to initial cell performance. J. Power Sources 2014, 247, 332–338. [Google Scholar] [CrossRef]
- Broussely, M.; Biensan, P.; Bonhomme, F.; Blanchard, P.; Herreyre, S.; Nechev, K.; Staniewicz, R.J. Main aging mechanisms in Li ion batteries. J. Power Sources 2005, 146, 90–96. [Google Scholar] [CrossRef]
- Naumann, M.; Schimpe, M.; Keil, P.; Hesse, H.C.; Jossen, A. Analysis and modeling of calendar aging of a commercial LiFePO 4 /graphite cell. J. Energy Storage 2018, 17, 153–169. [Google Scholar] [CrossRef]
- Dubarry, M.; Qin, N.; Brooker, P. Calendar aging of commercial Li-ion cells of different chemistries—A review. Curr. Opin. Electrochem. 2018, 9, 106–113. [Google Scholar] [CrossRef]
- United States Advanced Battery Consortium. Electric Vehicle Battery Test Procedures Manual; United States Advanced Battery Consortium: Southfield, MI, USA, 1996. [Google Scholar]
- Wood, E.; Alexander, M.; Bradley, T.H. Investigation of battery end-of-life conditions for plug-in hybrid electric vehicles. J. Power Sources 2011, 196, 5147–5154. [Google Scholar] [CrossRef]
Figure 1.
Check-up routine.

Figure 2.
Schematic of the pressure evolution over the SOC of lithium-ion cells with graphite anode along with the average SOC and DOD selected for the cycling tests.
Figure 2.
Schematic of the pressure evolution over the SOC of lithium-ion cells with graphite anode along with the average SOC and DOD selected for the cycling tests.
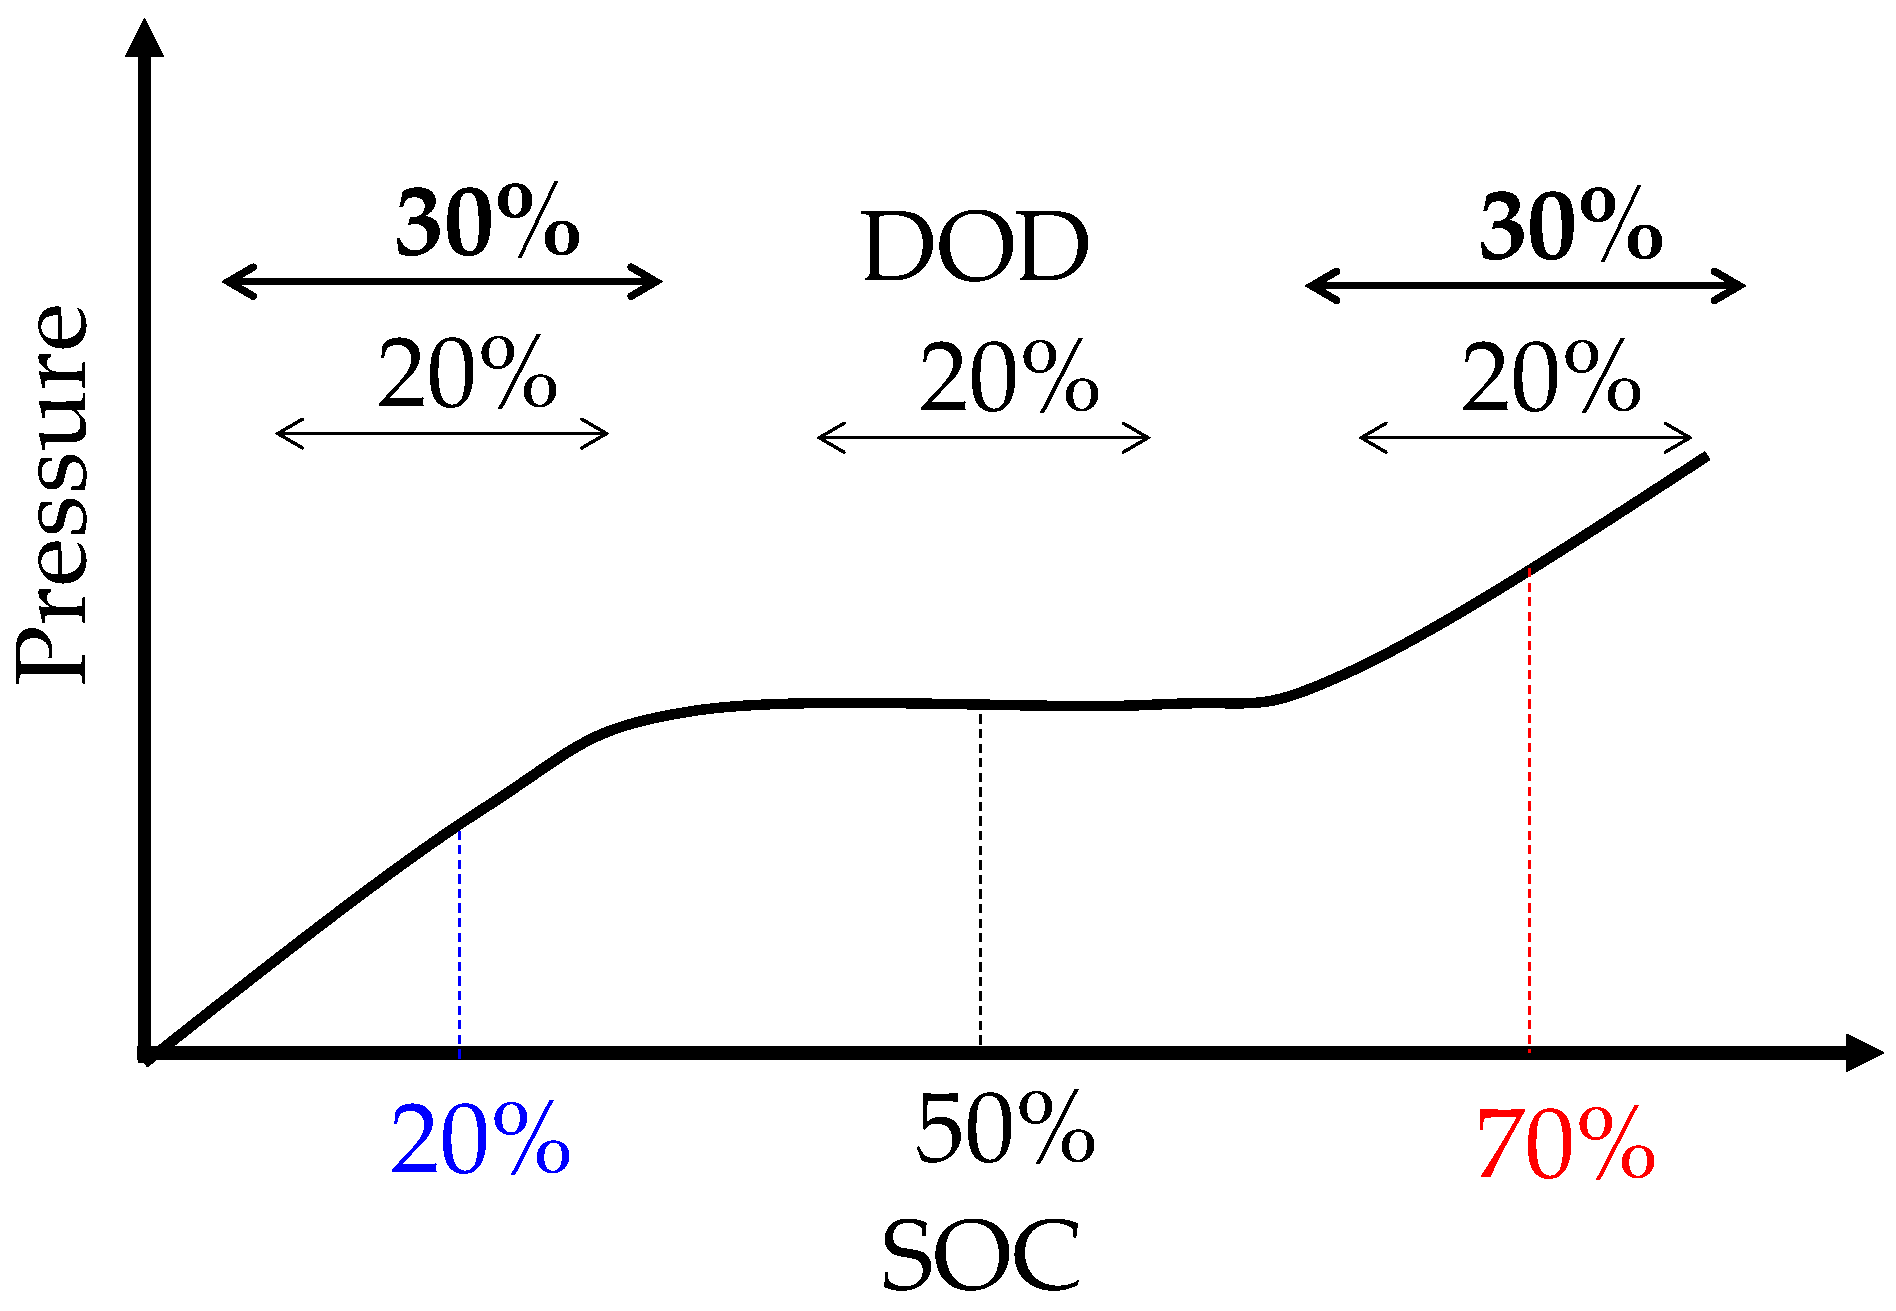
Figure 3.
Capacity loss (a) and pulse resistance (b) over time for cells cycled at 20% (blue), 50% (black), and 70% (orange) average SOC. All tests are conducted with 20% DOD and charge/discharge currents of 1360/2800 mA. Cycling, transition, and resting phases are depicted with red, blue, and green backgrounds, correspondingly.

Figure 4.
Capacity loss for cells cycled with charge/discharge currents in mA of 1020/2000, 1360/2800, and 1700/3400. The plots are arranged in a matrix with the average SOCs of 20% and 70% and DODs of 20% and 70%. Cycling, transition, and resting phases are depicted with red, blue, and green backgrounds, correspondingly.

Figure 5.
Pulse resistance for cells cycled with charge/discharge currents in mA of 1020/2000, 1360/2800, and 1700/3400. The plots are arranged in a matrix with the average SOCs of 20% and 70% and DODs of 20% and 70%. Cycling, transition, and resting phases are depicted with red, blue, and green backgrounds, correspondingly.
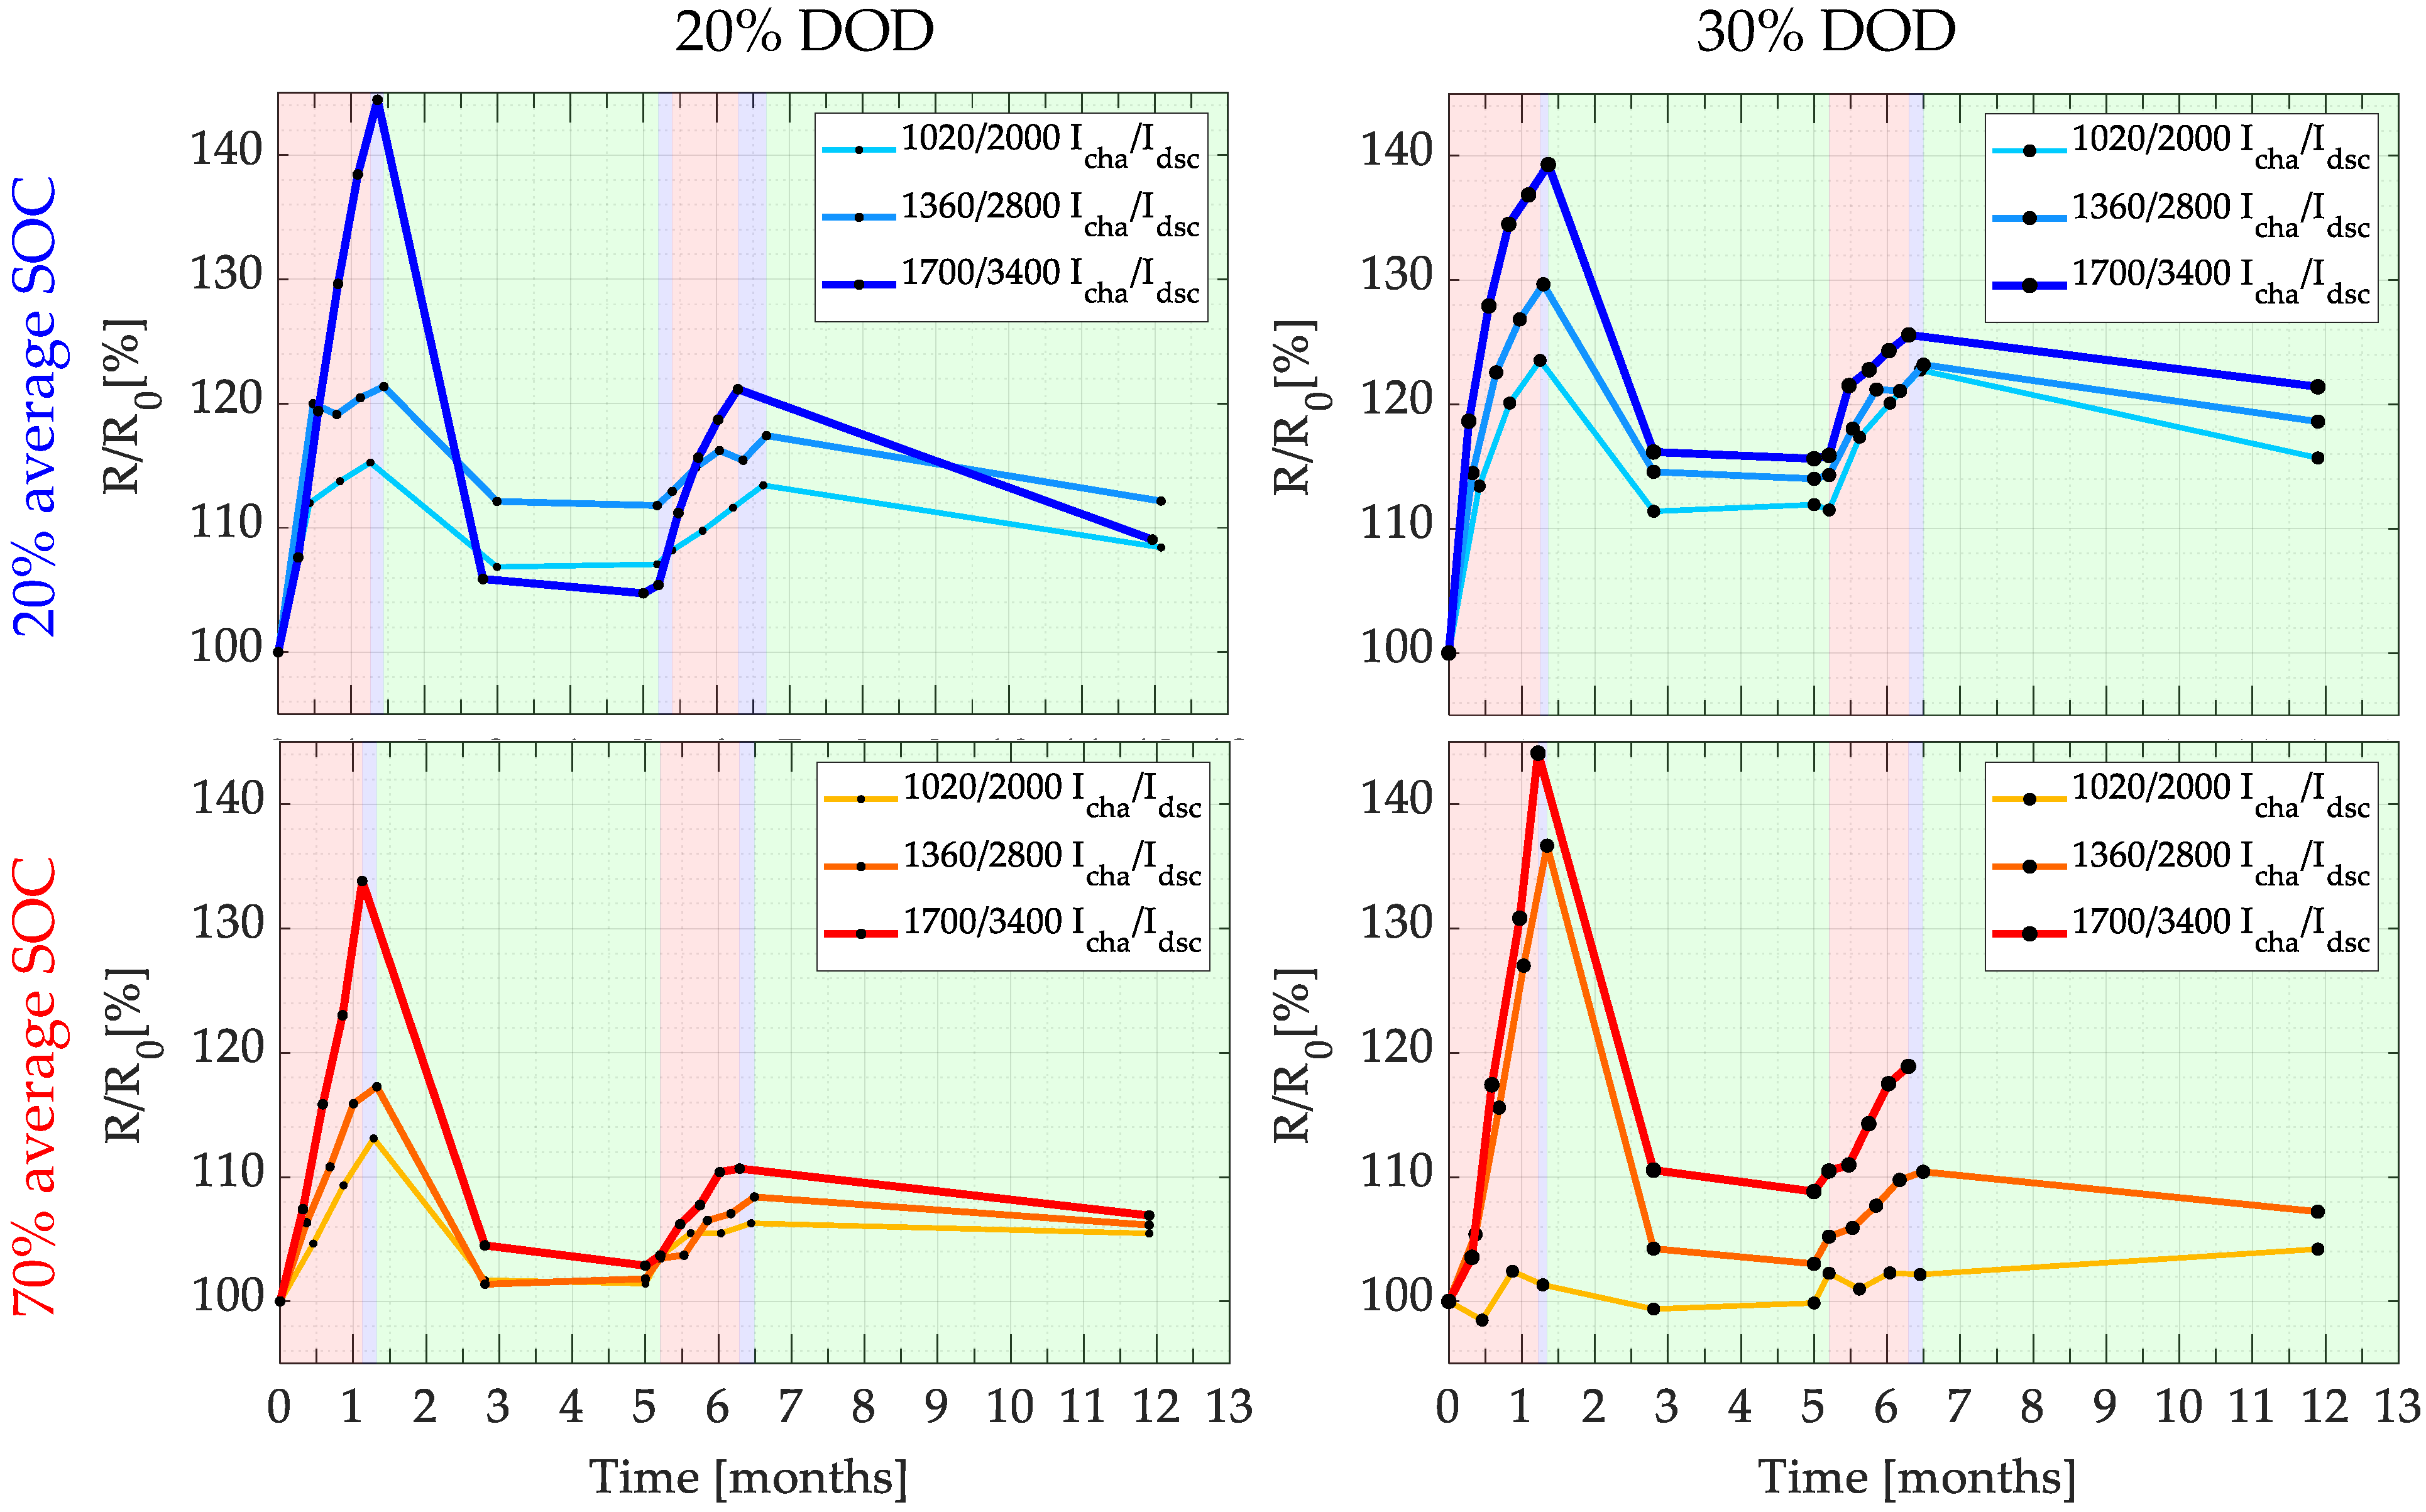
Figure 6.
Rates of the apparent capacity loss and resistance increase during the cycling phases. The cells were tested with 20%, 50%, and 70% average SOC (red, grey, and red background), 20% and 30% DOD, and low (1020 mA/2000 mA), mid (1360 mA/2800 mA) and high (1700 mA/3400 mA) charge/discharge currents.
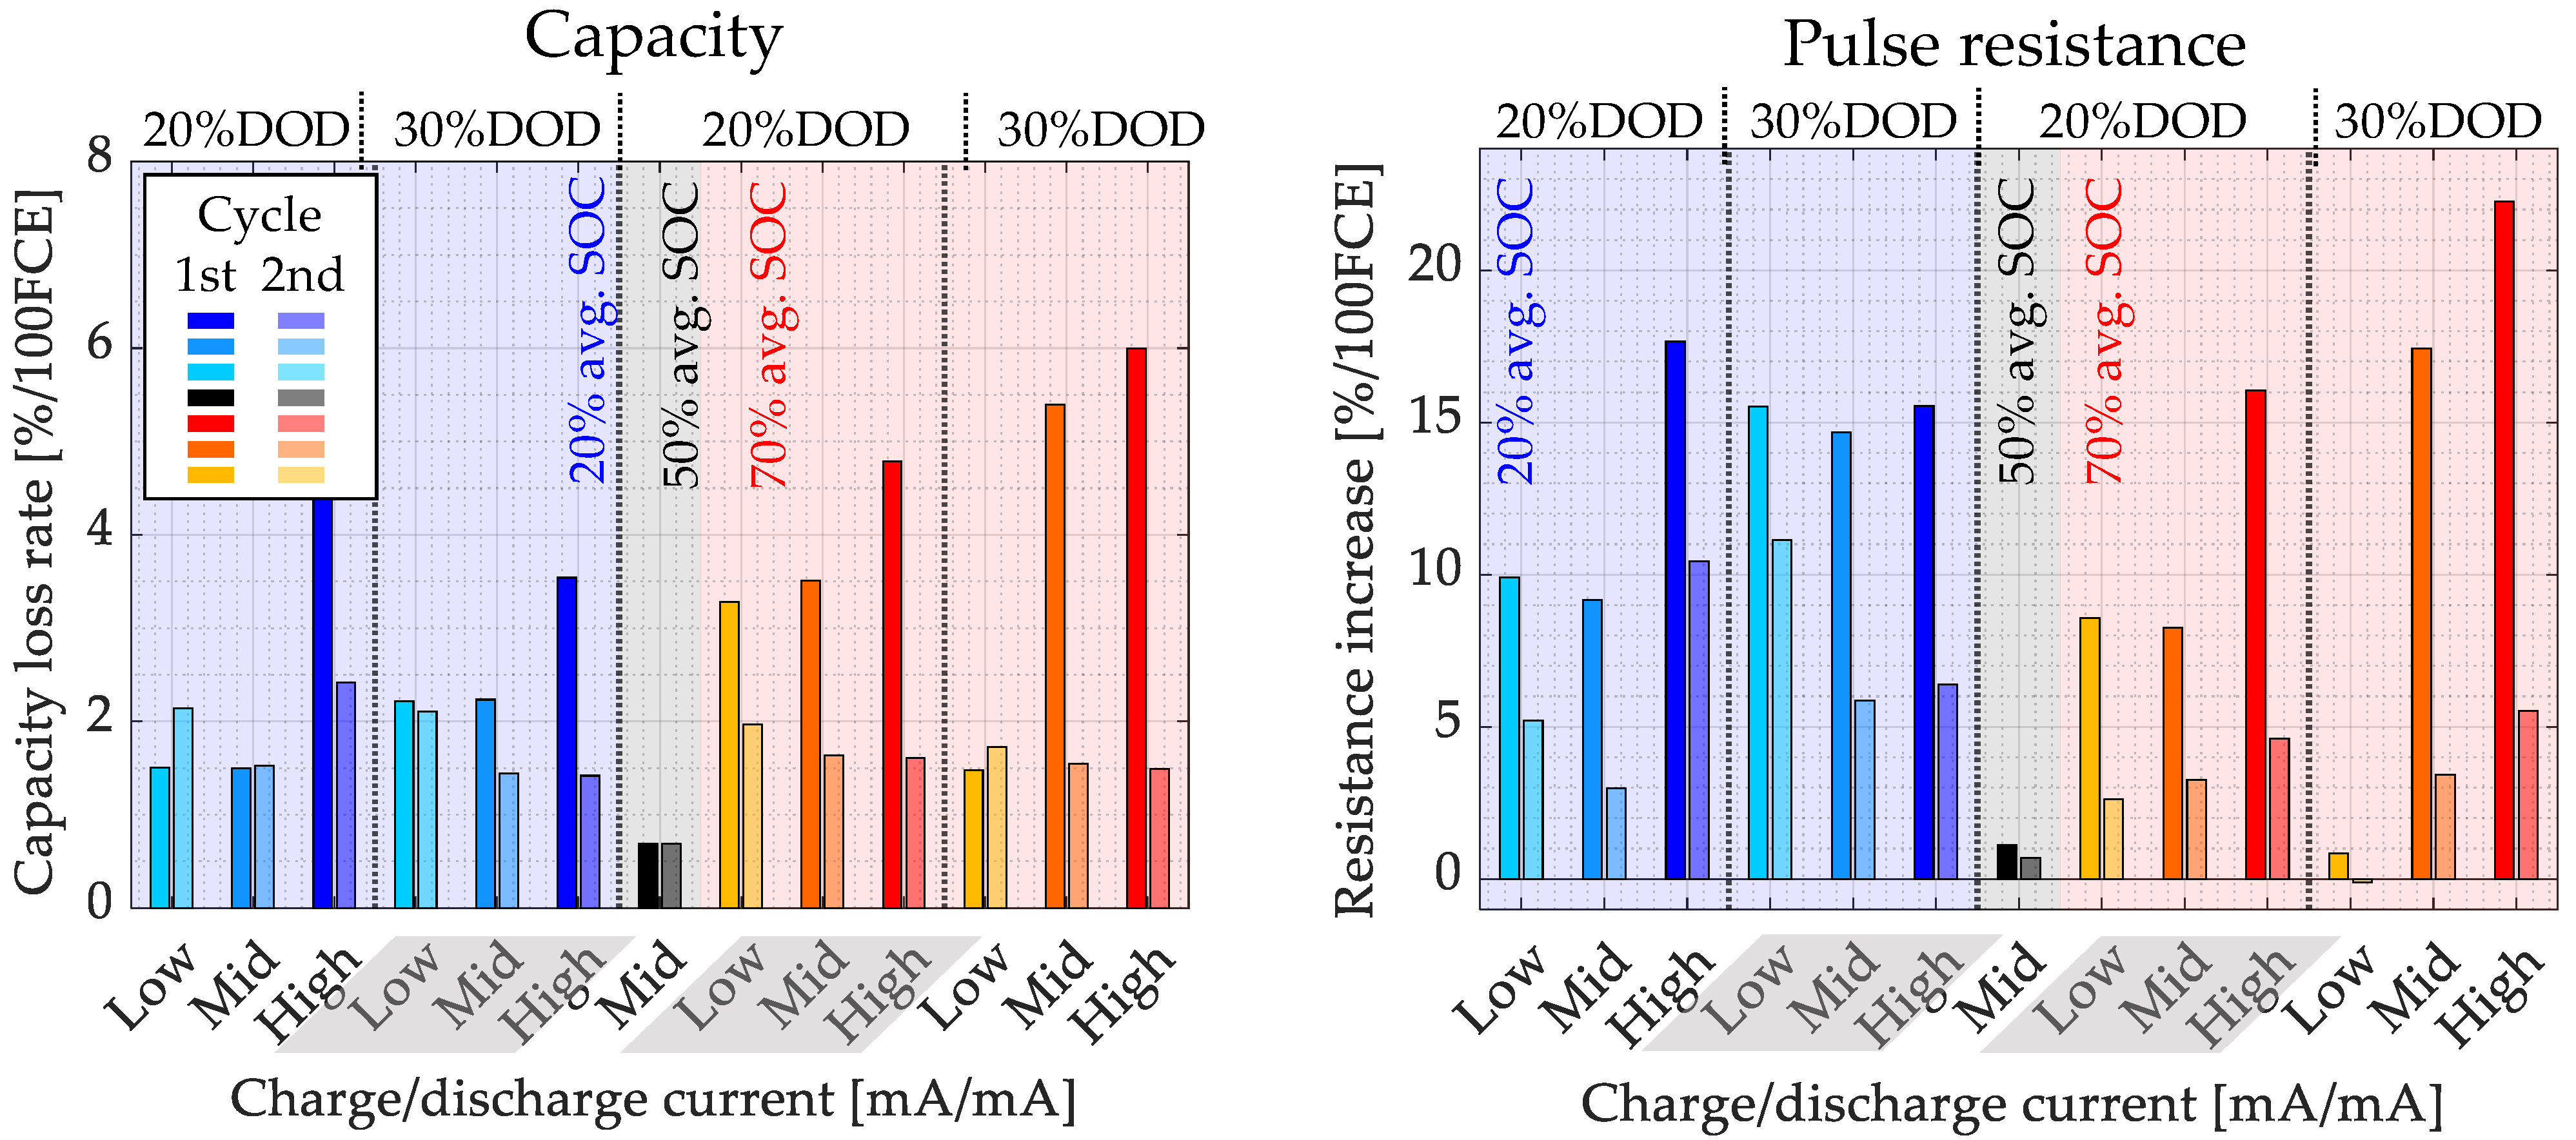
Figure 7.
Capacity recovery during the resting phases for the first and second cycles. The cells were tested with 20% and 70% average SOC, and 20% and 30% DOD and low (1020 mA/2000 mA), mid (1360 mA/2800 mA), and high (1700 mA/3400 mA) charge/discharge current intensities.
Figure 7.
Capacity recovery during the resting phases for the first and second cycles. The cells were tested with 20% and 70% average SOC, and 20% and 30% DOD and low (1020 mA/2000 mA), mid (1360 mA/2800 mA), and high (1700 mA/3400 mA) charge/discharge current intensities.

Figure 8.
DVA for three cells cycled at 20%, 50%, and 70% average SOC with 20% DOD and charge/discharge currents of 1360/2800 mA. The DVA is shown at begin of the test (1st check-up), after the 1st cycling phase (5th check-up), the 1st resting period (8th check-up), the 2nd cycling phase (12th check-up), and, finally, the 2nd resting period (13th check-up). The solid black line shows the measured full cell dV/dQ curve, the solid red line the estimated anode, and the dashed blue line the cathode (educated guess). The black dashed line shows the expected dV/dQ curve (HLD preserved). The green arrows in the graphs highlights rehomogenization and the red arrows the inhomogenization.
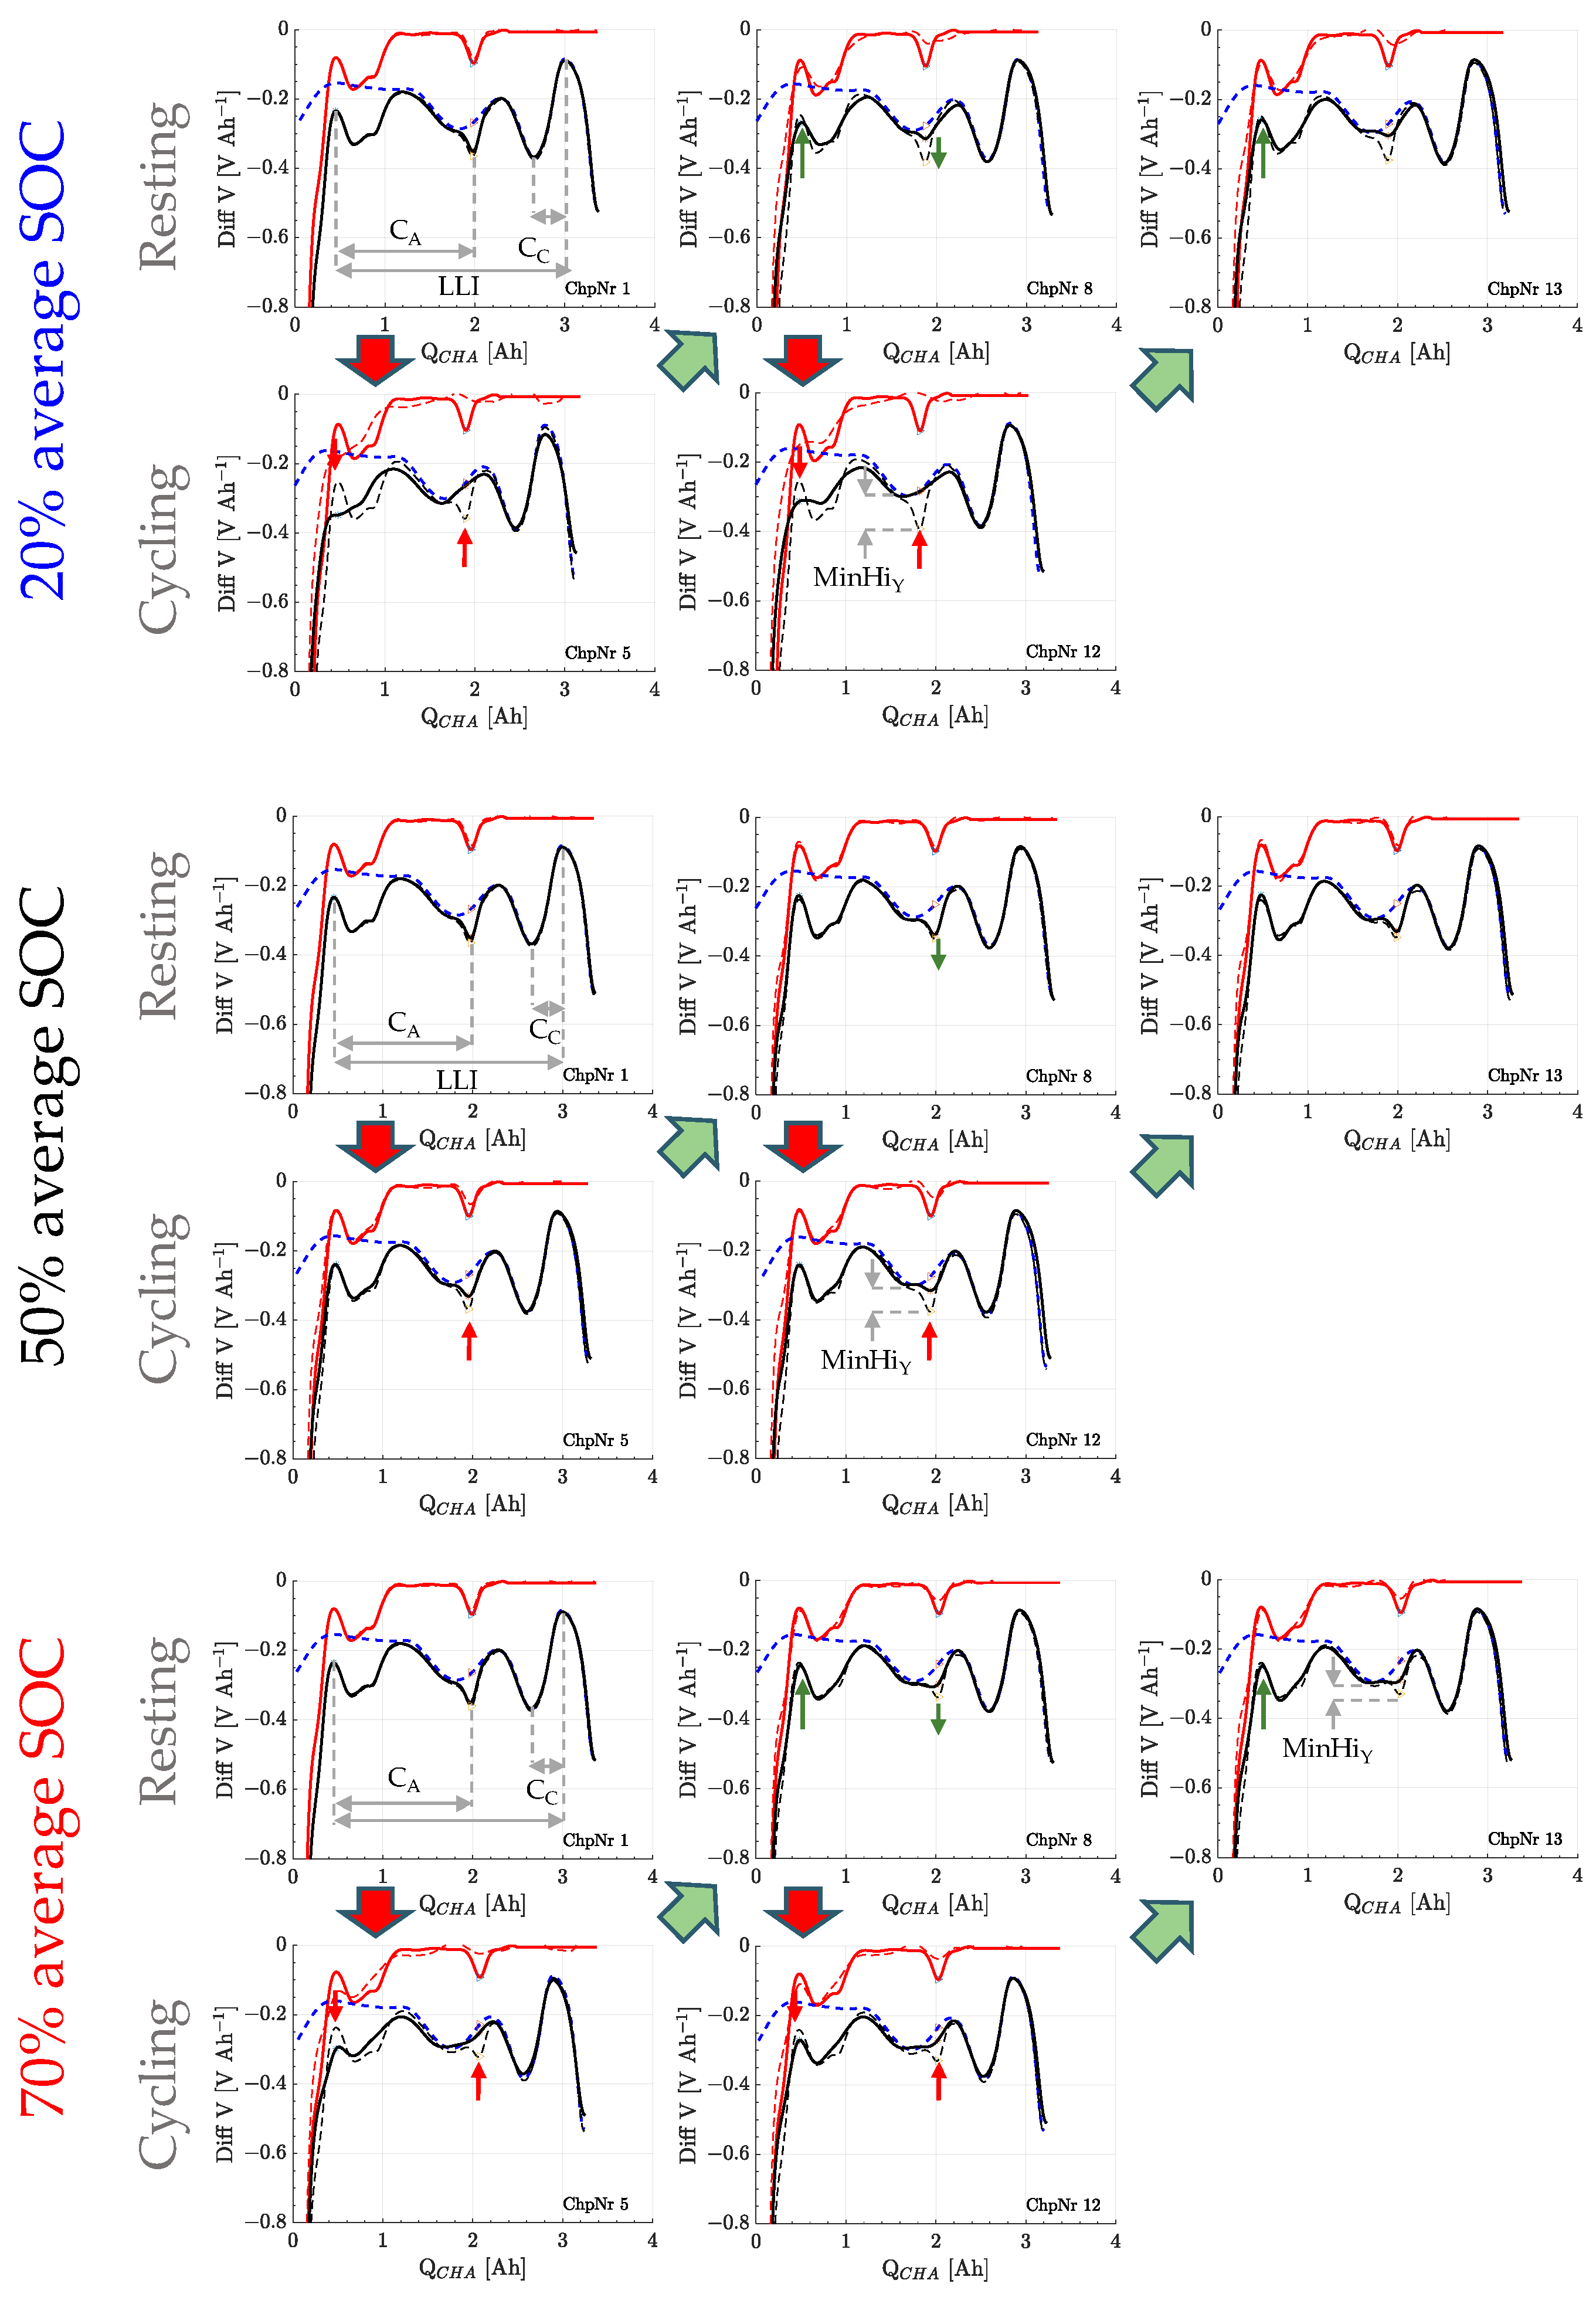
Figure 9.
Capacity difference analysis (CDA) for cells cycled at 20%, 50%, and 70% average SOC with 20% and 30% DOD, and charge/discharge currents of 1020/2000, 1360/2800, and 1700/3400 mA.
Figure 9.
Capacity difference analysis (CDA) for cells cycled at 20%, 50%, and 70% average SOC with 20% and 30% DOD, and charge/discharge currents of 1020/2000, 1360/2800, and 1700/3400 mA.
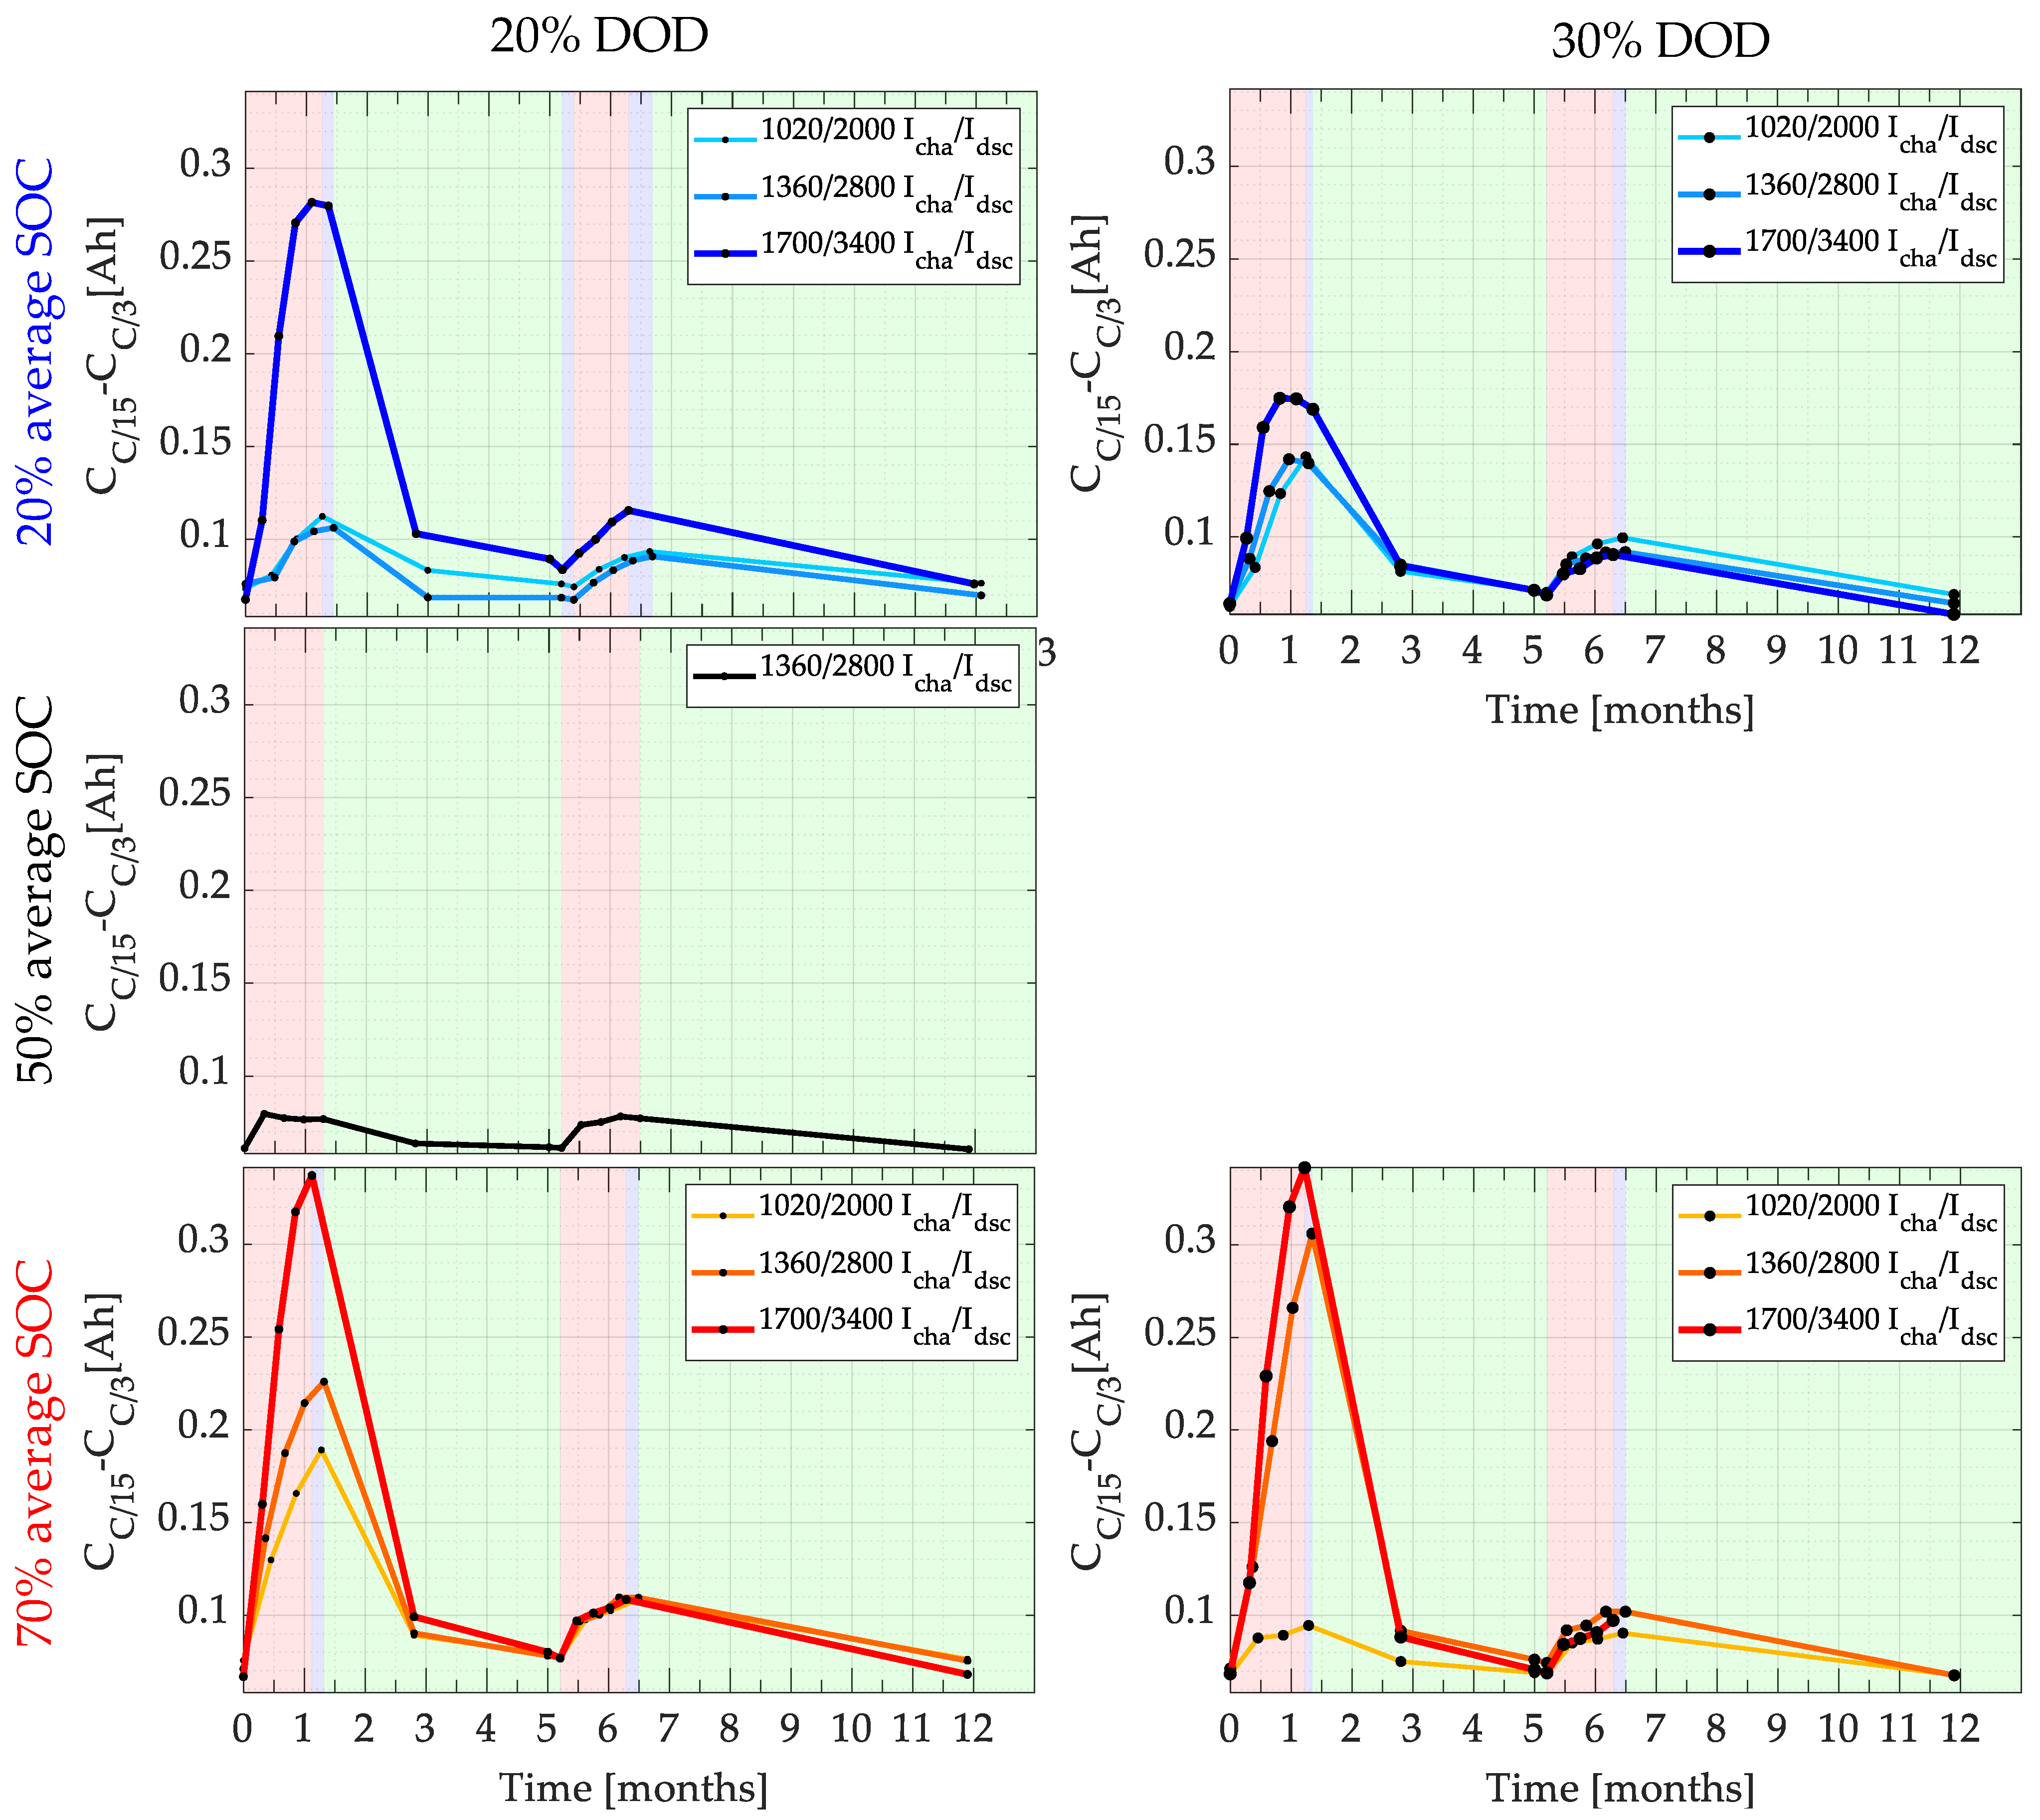
Figure 10.
Capacity loss and resistance increase rate for cells cycled at 20%, 50% (reference), and 70% average SOC. The aging rate during the 1st and 2nd cycling phases is plotted in red and orange, while the blue line depicts the aging with recovery effect during resting pauses. A prognosis is depicted with a black dotted line and the approximate FCE count for reaching the end-of-life criterion.

Table 1.
Datasheet of 18650-35E Samsung.
| Producer | Samsung |
|---|---|
| Cell type | 18650-35E |
| Cathode | NCA |
| Anode | Graphite + 1.5% Silicon |
| Nom. Capacity at 0.2C | 3.4 Ah |
| Max. discharge voltage | 2.65 V |
| Max. charge voltage | 4.2 V |
| Max. discharge current | 8000 mA |
| Delivery voltage | 3.55 V |
Table 2.
Variation of test parameters for the cycling phase: DOD, average SOC, charge and discharge currents Icha and Idsc.
Table 2.
Variation of test parameters for the cycling phase: DOD, average SOC, charge and discharge currents Icha and Idsc.
| Cell Nr. | SOC [%] | DOD [%] | Icha [mA] | Idsc [mA] |
|---|---|---|---|---|
| 1 | 20 | 20 | 1020 | 2000 |
| 2 | 20 | 20 | 1360 | 2800 |
| 3 | 20 | 20 | 1700 | 3400 |
| 4 | 20 | 30 | 1020 | 2000 |
| 5 | 20 | 30 | 1360 | 2800 |
| 6 | 20 | 30 | 1700 | 3400 |
| 7 | 50 | 20 | 1360 | 2800 |
| 8 | 70 | 20 | 1020 | 2000 |
| 9 | 70 | 20 | 1360 | 2800 |
| 10 | 70 | 20 | 1700 | 3400 |
| 11 | 70 | 30 | 1020 | 2000 |
| 12 | 70 | 30 | 1360 | 2800 |
| 13 | 70 | 30 | 1700 | 3400 |
Disclaimer/Publisher’s Note: The statements, opinions and data contained in all publications are solely those of the individual author(s) and contributor(s) and not of MDPI and/or the editor(s). MDPI and/or the editor(s) disclaim responsibility for any injury to people or property resulting from any ideas, methods, instructions or products referred to in the content. |
© 2023 by the authors. Licensee MDPI, Basel, Switzerland. This article is an open access article distributed under the terms and conditions of the Creative Commons Attribution (CC BY) license (https://creativecommons.org/licenses/by/4.0/).
Share and Cite
MDPI and ACS Style
Morales Torricos, P.; Endisch, C.; Lewerenz, M. Apparent Aging during Accelerated Cycling Aging Test of Cylindrical Silicon Containing Li-Ion Cells. Batteries 2023, 9, 230. https://doi.org/10.3390/batteries9040230
AMA Style
Morales Torricos P, Endisch C, Lewerenz M. Apparent Aging during Accelerated Cycling Aging Test of Cylindrical Silicon Containing Li-Ion Cells. Batteries. 2023; 9(4):230. https://doi.org/10.3390/batteries9040230
Chicago/Turabian StyleMorales Torricos, Pablo, Christian Endisch, and Meinert Lewerenz. 2023. "Apparent Aging during Accelerated Cycling Aging Test of Cylindrical Silicon Containing Li-Ion Cells" Batteries 9, no. 4: 230. https://doi.org/10.3390/batteries9040230
Note that from the first issue of 2016, this journal uses article numbers instead of page numbers. See further details here.