Article

A Deep Learning Approach for State-of-Health Estimation of Lithium-Ion Batteries Based on a Multi-Feature and Attention Mechanism Collaboration

1
China Software Testing Center, Beijing 100038, China
2
School of Transportation Science and Engineering, Beihang University, Beijing 102206, China
3
School of Electrical Engineering, Southeast University, Nanjing 211189, China
4
College of Automobile and Traffic Engineering, Nanjing Forestry University, Nanjing 210037, China
5
Department of Chemical Engineering, Imperial College London, London SW7 2AZ, UK
*
Authors to whom correspondence should be addressed.
Batteries 2023, 9(6), 329; https://doi.org/10.3390/batteries9060329
Submission received: 13 April 2023 / Revised: 5 June 2023 / Accepted: 16 June 2023 / Published: 19 June 2023

Abstract

:
Safety issues are one of the main limitations for further application of lithium-ion batteries, and battery degradation is an important causative factor. However, current state-of-health (SOH) estimation methods are mostly developed for a single feature and a single operating condition as well as a single battery material system, which consequently makes it difficult to guarantee robustness and generalization. This paper proposes a data-driven and multi-feature collaborative SOH estimation method based on equal voltage interval discharge time, incremental capacity (IC) and differential thermal voltammetry (DTV) analysis for feature extraction. The deep learning model is constructed based on bi-directional long short-term memory (Bi-LSTM) with the addition of attention mechanism (AM) to focus on the important parts of the features. The proposed method is validated based on a NASA dataset and Oxford University dataset, and the results show that the proposed method has high accuracy and strong robustness. The estimated root mean squared error (RMSE) are below 0.7% and 0.3%, respectively. Compared to single features, the collaboration between multiple features and AM resulted in a 25% error improvement, and the capacity rebound is well captured. The proposed method has the potential to be applied online in an end-cloud collaboration system.

Graphical Abstract

1. Introduction

Electric vehicles are gaining more and more popularity and applications. Lithium-ion batteries are widely used as power sources in the power system of electric vehicles due to the advantages of high energy density, long service life and low self-discharge rate [1]. However, lithium-ion batteries gradually degrades during usage. Battery degradation leads to an increase in resistance and a decrease in capacity, which in turn leads to a decrease in battery performance [2,3,4]. When the battery ages to less than 80% of its nominal capacity, it is considered to be at the end of its life, at which point there is a high risk of thermal runaway or other safety issues [5,6,7]. Therefore, it is critical to perform an accurate state of health (SOH) estimation of the battery to ensure that it operates in a highly efficient and safe way [8]. However, it is often difficult to accurately estimate the SOH of a battery due to the superposition of multiple influencing factors such as internal side reactions, different operating environments and different operating conditions of the battery [9,10]. Current methods for battery SOH estimation can be classified into direct measurement methods, model-based methods and data-driven methods [11].
The direct measurement method is usually based on the Ah integration method to calculate the capacity or test the resistance of the battery to obtain results. However, the direct measurement method usually requires the complete charge–discharge cycle data to be carried out, and the experimental process is affected by many external factors. The direct measurement method is only suitable for specific application scenarios, and it is difficult to be applied in dynamic and a complex on-board environment [12].
The model-based approach is usually performed by establishing battery models such as the empirical model, equivalent circuit model (ECM) and electrochemical mechanism model. The empirical model-based approach is based on fitting a functional relationship between SOH and macroscopic signal quantities, and in practical applications, the SOH values can be obtained simply by mapping the macroscopic signals. The ECM-based approach simulates the operating characteristics of the battery by constructing a circuit model and adding different circuit elements. The electrochemical mechanism model-based method simulates the working process of the battery by constructing a multi-physical field coupling model and considering the superposition of various side reactions to simulate the capacity loss during the aging process, so as to obtain the SOH of the battery. Meng et al. [13] combined the particle filter (PF) and empirical mode decomposition (EMD) methods to estimate the end of life, proposed a simple PF parameter adjustment process and used EMD in the state estimation phase of PF to avoid overfitting in the extrapolation process. Singh et al. [14] proposed a semi-empirical model using battery charge/discharge cycles as an input to achieve a fast and accurate SOH estimation. Rahimifard et al. [15] added sensor bias to the ECM to improve the estimation accuracy, combined with an adaptive smooth variable structure filter with a variable boundary layer strategy to estimate the SOH by estimating the internal resistance. Yang et al. [16] attributed the aging of batteries mainly to the breakage of cathode agglomerates and the thickness change of anode solid electrolyte interface (SEI) film, and constructed a full-cell impedance model based on this to estimate the SOH of batteries by parameters strongly correlated with SOH. Although the ECM model-based and electrochemical model-based methods can achieve high accuracy prediction, the model-based methods usually have problems for applicability and may have poor performance in different cells and under different profiles. Additionally, it is usually difficult to construct a high-precision battery model due to the complex mechanism and coupling influence of multiple factors in the use process. While the empirical model-based methods are simpler and have higher real-time performance in practical applications, the accuracy and robustness of empirical models are often difficult to guarantee, and many empirical models rely heavily on initial values as an open-loop method. At the same time, there are problems of convergence difficulties and large errors in the edge region of the battery aging curve.
In recent years, with the development of hardware, computer arithmetic power has gained a qualitative leap. At the same time, with the development of data acquisition, various databases have been expanded and enriched. Based on this, data-driven methods became popular. Liu et al. [17] extracted features based on the curve of the constant-current charging process and used a linear regression algorithm to achieve battery SOH estimation. Li et al. [18] extracted features based on the charging voltage curve and integrated five basic machine learning models to form a new model to achieve highly accurate SOH estimation. Fan et al. [19] extracted features based on fixed voltage intervals and used a back propagation (BP) neural network optimized based on a genetic algorithm to estimate the battery SOH. The data-driven approach is based entirely on data and avoids complex internal mechanism of the studied object, while enabling high accuracy and robust estimation. However, it also leads to the problem that the data-driven approach is poorly interpretable and highly dependent on the quality of the extracted features.
The features used for battery aging estimation include direct and indirect features. Direct features are extracted from origin signals such as currents and voltages, which are often more concise and require only a small amount of data pre-processing to obtain satisfactory features. Shen et al. [12] divided the voltage and current curves into 25 segments, taking the left endpoint of each segment as the feature, and conducted SOH estimation based on deep convolutional neural network (DCNN). Lin et al. [20] used equal voltage interval charging time as a feature based on a given sampling step and voltage range. Xu et al. [21] used the area and maximum slope of the voltage distribution in the constant current charging stage and the differential of the temperature curve as features. However, the selection of direct features is often based on observation and experience and lacks sufficient basis, which leads to an unsure correlation between features and capacity fade. In contrast, indirect features are usually subjected to signal analysis techniques for feature extraction, which usually results in high-quality features with a strong correlation with battery degradation. At the same time, the adoption of signal analysis techniques can, to a certain extent, compensate for the poor interpretability of data-driven-based methods and establish a link between macroscopic signals and internal battery responses. Currently, the most commonly used signal analysis techniques include incremental capacity analysis (ICA) and differential thermal voltammetry (DTV). The ICA technique was developed by analyzing the voltage and capacity changes, and high quality features can be extracted by analyzing the IC curves. The DTV analysis method uses the temperature data, fully explores the entropy change information during the battery aging process and then establishes a connection with the phase change during the aging process [22,23,24]. Compared to other signal analysis techniques, the DTV analysis method fully utilizes temperature information. During the aging process of batteries, the micro phase transitions that occur internally are inevitably accompanied by changes in energy, which is usually manifested in the form of heat. DTV analysis fully explores this information and can extract aging features that are more closely related to the micro phase transitions during battery aging through macroscopic signals. However, the extraction of indirect features often requires tedious data pre-processing to obtain high-quality features, which can lead to a certain degree of reduction in model efficiency.
A single feature often cannot contain sufficient aging information in the feature, and the collaboration of multiple features can effectively solve this problem and further improve the performance of the model. Zhang et al. [25] proposed an improved method for obtaining IC curves, which collects IC curves based on reference voltage and extracts incremental capacity values of multiple equal voltage intervals as features. Meng et al. [26] used random segments of the charging curve for IC analysis and extracted some curves as features. Lin et al. [27] extracted poles and offsets as thermoelectric coupling features based on IC analysis, DTV analysis and DTC analysis, and used them together with internal resistance as input features of the model. Although there are several ways to obtain satisfactory features, the information implied by different features is different, and the generalizability across different battery systems and operating conditions may not be guaranteed. Despite the joint application of multiple features effectively alleviating this problem, the importance of different features in different time series is variable. Deep learning models suffer from the problem of distraction and cannot distinguish the importance of different features in different locations, which can lead to a reduction in the utilization of the information embedded in features. Meanwhile, the selection of multiple features is another issue. The selection of features should include information related to battery aging as comprehensively as possible. At the same time, considering the computational efficiency issues in practical applications, the selection of multiple features should also avoid complexity, duplicate information and overly complex feature extraction.
In order to solve the above problem, this paper proposes a data-driven method to estimate the SOH of a battery based on multi-feature collaboration and the addition of an attention mechanism. Based on IC analysis, DTV analysis and the duration of the same discharging voltage range analysis, features are extracted to capture the changes in thermal and electrochemical characteristics that accompany microscopic phase transitions during battery aging. At the same time, attention mechanism (AM) was added to the deep learning model to capture the important sequence positions of important features in order to further optimize multi-feature collaboration. Firstly, data pre-processing and feature extraction are performed based on the NASA dataset and the Oxford University database, and feature screening is performed by the Pearson correlation analysis method. Then, a deep learning model is built based on Bi-LSTM. Considering the different importance of different features in different time series, AM is added to the model to extract the information embedded in the data so that the model can focus on the important part of the important features to solve the problem of scattered attention. Finally, the trained model is used for SOH prediction, and the proposed method is validated with error analysis. This work shows that the multi-feature collaboration approach can effectively improve the SOH prediction accuracy with strong generalization. The correlation of different features with battery aging on different time series is uneven, and the addition of the AM can effectively focus the model on more important information. The proposed model can achieve highly accurate SOH prediction, which is expected to be applied online in practical applications in the framework of cyber hierarchy and interactional network (CHAIN) in combination with the cloud platform [28].
The remaining sections of this paper are laid out as follows: Section 2 describes the battery aging dataset and multi-feature extraction and analysis. Section 3 describes the overall model architecture and algorithm details. Section 4 performs comparative validation and error analysis. Section 5 summarizes the main conclusions.

2. Degradation Data and Multi-Feature Extraction

2.1. Dataset Description

In this paper, the battery degradation datasets of lithium-ion batteries from the NASA database and Oxford University database were used [29,30]. The two datasets use batteries of different material systems and different experimental conditions. Validation based on cells of different material systems and different working conditions can effectively demonstrate the generalization of the proposed method. The details are listed in Table 1 and Table 2, respectively. The capacity decay curves of the cells used in both datasets are shown in Figure 1. In the Oxford University dataset, individual cells were found to have capacity dips, so only cells #1, #3, #4, #7 and #8 were selected for the next analysis and validation.

2.2. Feature Extraction and Correlation Analysis

2.2.1. Duration of the Same Discharging Voltage Range

The first feature extracted is the duration of the same discharging voltage range, the feature can be described as follows:
t = t V l o w t V h i g h
where t represents the duration of the same discharging voltage range, and t V l o w and t V h i g h represent the time corresponding to the maximum and minimum voltage within the specified voltage range, respectively.
For the NASA dataset, the voltage region was chosen to be 3.5–3.9 V. For the Oxford University dataset, the voltage region was chosen to be 3.7–4.1 V. The extracted equal-interval discharge voltage times are direct features, and although they can be obtained more concisely, the amount of information contained in them is often insufficient. In this paper, two signal analysis techniques, ICA and DTV, are used to extract indirect features to complement the information contained in the features.

2.2.2. Incremental Capacity Analysis

ICA technology can establish a link between battery aging and the detachment and embedding of lithium ions inside the electrodes. By analyzing the relationship between voltage and capacity changes, the voltage plateau region is characterized visually in the form of peaks and valleys in the curve, and thus, battery aging can be effectively monitored and characterized. The incremental capacity analysis can be calculated:
d Q d V = I × d t d V
where Q represents the discharge capacity, I represents the discharge current, V represents the discharge voltage and t represents the discharge time.
Since IC analysis performs a differential operation, it inevitably amplifies the errors in the data due to sampling. For this reason, the data is first preprocessed when IC analysis is performed. Data preprocessing includes resetting the sampling interval as well as filtering. For the Oxford University dataset, the sampling interval was reset to 20 s. Due to the small amount of data in the NASA dataset, the sampling interval was not fixed for the NASA dataset, and only the filtering operation was performed. The SG filter, which is good at handling peak and valley information, was used for filtering. The SG filter is:
y i = j = p j = p 1 N c C j x i + j
where y represents the signal after smoothed, C j the coefficient and x the signals.
Figure 2c,d show how the IC curve changes as the battery ages. It can be seen that the peaks in the curve move accordingly with battery aging, and the features thus extracted can establish a strong correlation with SOH.

2.2.3. Differential Thermal Voltammetry

The DTV analysis technique describes battery aging based on the information of entropy change during battery degradation. The phase change during battery aging is accompanied by energy change, which further reacts as entropy change; thus, battery aging can be analyzed by two macroscopic signal quantities, voltage and temperature. DTV analysis can be described as follows:
D T V = d T d t d V d t = d T d V
where d T represents the differential of battery temperature and d V the differential of voltage.
In conducting the DTV analysis, the same data pre-processing process described in Section 2.2.2 was first adopted. Figure 2e,f shows the change process of the DTV curve with battery aging, and it can be seen that there are two obvious peaks and one valley in the curve for the two datasets with different battery material systems and different operating conditions. There are a large number of features extracted based on DTV analysis, so we selected some of them with a high correlation coefficient to be used. For the NASA dataset, the peak and valley location information was selected as the feature, while for the Oxford dataset, the peak position of the second peak was selected as the feature. The Pearson correlation analysis is:
r x y = i = 1 n x i x ¯ y i y ¯ i = 1 n x i x ¯ 2 i = 1 n y i y ¯ 2
where x and y are the variables.
The correlation analysis results of all the final selected features are shown in Figure 3. All the extracted features have high correlation with SOH.

3. Methodology

3.1. Bi-LSTM Network

Bi-LSTM consists of two LSTMs that learn and extract temporal features from the forward and backward directions, respectively. In Bi-LSTM, the two output vectors are stitched into a new vector, which is the final description of the current sequence. Bi-LSTM is able to fully integrate information from the past and the future, which can capture the temporal information embedded in the features better than LSTM. Each unit can be expressed as:
f t = s i g m o i d w f x x t + w f s s t 1 + b t
i t = s i g m o i d w i x x t + w i s s t 1 + b i
c ˜ t = t a n h w c x x t + w c s s t 1 + b c
o t = s i g m o i d w o x x t + w o s s t 1 + b c
c ^ t = t a n h c t
where f t is the output of the forgetting gate, i t is the output signal of the output gate, c ˜ t is the preliminary information to be input into the memory cell c , o t is the output signal of the output gate and c ^ t is the preliminary information to be output to the hidden layer state s .

3.2. Attention Mechanism

AM is a mechanism to focus the model on the important positions of different features by assigning weights to the features in a probabilistic way. During the training process of the network, the weight assignment strategy is trained together with it. By assigning weights through AM, the model will focus on the important parts of the features and assign higher weights to the important parts. For information with low relevance, lower weights are assigned. In this paper, AM is introduced to improve the performance of Bi-LSTM and solve the distraction problem of the model in the long series problem. The AM can be described as follows:
e t = u tanh w h t + b
a t = exp e t / j = 1 t exp e j
s t = t = 1 i a t h t
where u and w are the weight, b the bias, a t the attention weight, h t the input vector of the attention layer, e t the value of the hidden layer and s t is the output.
For multi-feature, this paper adds AM in the time dimension while setting unshared weights for different features in the same time sequence, which means that the weights among different features in the same sequence are also different, so that the model focuses on the important sequence while also focusing on the important features in the current sequence, which further optimizes the model.

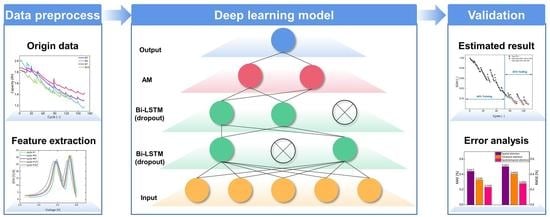
3.3. Framework of the Proposed SOH Estimation Model

Figure 4 shows the overall framework of the proposed model in this paper. The data are first subjected to some pre-processing and then feature extraction. The extracted features and volume data are constructed into a time series format and input to the deep learning model for training. The deep learning model consists of an input layer, Bi-LSTM layer, Dropout layer, AM layer and output layer. The data is fed through the input layer, then the temporal features in it are captured by the Bi-LSTM, and a nonlinear mapping is established for the SOH. The Dropout technique is used to prevent overfitting. The AM layer focuses the model on the important part of the features by assigning weights to capture the importance of different features in different sequence positions. The hyperparameters of the whole model are automatically searched for by Bayesian optimization techniques. The optimized hyperparameter includes the unit number in each layer and the Dropout rate. The training of the whole model is carried out based on the RMSprop algorithm. Finally, the trained model is used for prediction, the comparison between different features and different algorithms is validated and the error analysis is performed.

4. Results and Discussion

4.1. Estimation Results Based on a Single Feature and Multiple Features

In this sub-section, a comparative validation is performed based on battery #5 from the NASA dataset and battery #3 from the Oxford University dataset. The prediction results are compared using single and multiple features as input features, respectively. Then, the prediction results before and after the addition of AM are compared to verify the optimization effect of the addition of AM on the model. The results are shown in Figure 5 and Figure 6, where the black dot plots represent the real SOH and the red dot plots represent the predicted SOH. It can be seen that for the NASA dataset, the RMSEs of the prediction results using single features are both around 0.5% and the MAEs are both around 0.4%. For the Oxford University dataset, the RMSEs using single features are around 0.2% and the MAEs are around 0.15%. It can be seen that the extracted features all reflect the battery aging well, among which the features extracted based on DTV achieved the best estimation results among them, with RMSEs of 0.357% and 0.214% for the prediction results on the two datasets, respectively, which indicates that the DTV analysis method can better establish the macro–micro connection in the battery aging process by reflecting the battery aging practice through entropy change. The errors of the prediction results using multiple features are both lower than those using single features, with RMSEs of 0.337% and 0.189% for the prediction results on the two datasets, bringing an error improvement of 5.6% and 11.6%, respectively, compared to the optimal results using single features. This indicates that the collaboration of multiple features can bring more comprehensive aging information and further improve the data quality to achieve higher prediction accuracy of the Bi-LSTM. The addition of AM further improves the prediction accuracy of the model. The RMSEs of the prediction results on the two datasets are only 0.298% and 0.146%, and the MAEs are only 0.217% and 0.122%, respectively. This indicates that the addition of AM can further bring optimization to the model, so that the model can focus on the significant sequence positions of the important features in the features. The collaboration of multiple features and AM can bring substantial optimization to the model, and the collaboration of multiple features and AM can bring about 25% error improvement to the model compared to the optimal results using single features, which significantly improves the performance of the model.

4.2. Validation and Robustness Verification on Different Batteries

In this sub-section, the proposed method in this paper was validated on all cells on both datasets based on multiple features. The comparison of the prediction results with and without AM was also performed on each cell. Then, the robustness of the proposed method was verified. Figure 7 shows the prediction results on different cells. The results show that the proposed method achieves high accuracy in prediction on all cells. For the NASA dataset, the RMSE and MAE of the prediction results are around 0.4% and 0.3%, respectively. For the Oxford University dataset, the predicted RMSE and MAE are around 0.2%. For all cells, the addition of AM brings an improvement in accuracy, which further illustrates the effectiveness of collaboration between AM and multi-feature methods. For the verification of robustness, the verification is performed by artificially excluding the top 20% of battery data to simulate different battery start-up cycles. The estimation results are shown in Figure 8 and Table 3. It can be seen that the proposed method in this paper has strong robustness, and the predicted RMSE and MAE are only within 0.2% of each other compared to the 0-start cycle case. The strong robustness of the method is largely due to the collaboration of multiple features. In practical applications, outliers often appear in the features due to various environmental disturbances and sampling errors. Since the data-driven approach is completely dependent on data quality, the impact of such occurrences on the prediction results would be devastating when using single features. The collaboration of multiple features can effectively avoid this extreme situation, and when one feature has a problem, the other features can still guarantee the prediction accuracy, thus ensuring the reliability and robustness of the prediction.

4.3. Validation on Batteries with Different Material Systems and Comparison with Other Works

In this sub-section, the proposed method in this paper is validated on the MIT–Stanford–Toyota Research Center dataset [31]. This dataset uses a lithium iron phosphate battery, which is different from the ternary lithium battery system of the NASA dataset and Oxford dataset. We further validated the generalization ability of the proposed method on different battery systems. The estimated results are shown in Figure 9. The batteries numbered 20, 22, 36 and 44 were selected for validation, and the results showed that the proposed method achieved satisfactory estimation results on batteries made of the lithium iron phosphate material system. The RMSEs of the predicted results were all below 0.6%, which is comparable to the estimated results obtained on the ternary material system. The validation results further indicate that the proposed method has strong generalization on batteries with different material systems.
Finally, a comparison between this paper and other works was conducted, and the results are summarized in Table 4 and Table 5. Table 4 shows the results based on the Oxford University dataset, while Table 5 shows the results based on the NASA dataset. It can be seen that compared with most methods, the method proposed in this article has higher accuracy. Lin et al. [27] estimated the SOH based on the explanation boosting machine–Ant colony algorithm (EBM-ACO) and combined it with the characteristics of thermoelectric coupling and internal resistance. Xu et al. [21] estimated the SOH using voltage, temperature and IC as features based on the stacking-based ensemble learning model. Gong et al. [32] estimated the SOH based on the LSTM–backpropagation (BP) neural network and voltage as a feature. Zhang et al. [25] and Meng et al. [26] used IC as a feature to estimate the SOH with LSTM and LSTM using Bayesian optimization. Gu et al. [33] conducted further data dimensionality reduction and feature extraction based on multiple signals and used the CNN-Transformer model to estimate the SOH. The accuracy of this work is higher than that of the method proposed in this paper due to the powerful ability of the Transformer model to handle sequence problems and the meticulous processing of features. However, the meticulous processing of features can lead to a corresponding decrease in the efficiency of the model.

5. Conclusions

This paper proposes a multi-feature collaboration and data-driven method for SOH estimation. Specifically, certain pre-processing of the data was performed first. The data pre-processing included fixed sampling interval and filtering. The processed data were subjected to multi-feature extraction, and the extracted features included equal voltage interval discharge time, peaks and valleys extracted based on the IC analysis, and peaks and valleys extracted based on the DTV analysis. The extracted features were input to a deep learning model for training and prediction. The Bi-LSTM model was built with the addition of a dropout technique to prevent overfitting and AM technique to focus on the important parts of the features. The hyperparameters of the model were automatically searched by using a Bayesian optimization algorithm, and the model was trained based on an RMSprop algorithm. Finally, the trained model was used for prediction, and a comparative validation and error analysis were performed. The validation was conducted based on two datasets, which have different battery material systems and experimental conditions. The results showed that the proposed method can achieve a highly accurate SOH estimation. The RMSEs and MAEs of the prediction results based on the NASA dataset were both around 0.5% and 0.4%, respectively. The RMSEs and MAEs based on the Oxford University dataset were both around 0.2% and 0.15%, respectively. The slightly poor estimation results based on the NASA dataset were due to the severe capacity rebound in the NASA dataset, and the proposed method was able to capture the capacity rebound well. Compared to single features, the collaboration between multiple features and AM resulted in a 25% error improvement. The main contributions of this paper are as follows: (1) the collaboration of multiple features such as DTV, IC and the duration of the same discharging voltage range fully explores the changes in thermal and electrochemical properties that accompany microscopic phase transitions during battery aging, ensuring that the information contained in the features is as abundant as possible, greatly improving the performance of the model. (2) Adding AM on the basis of multiple features solves the problem of scattered attention and can focus the attention of the model on the important features and the important sequences, and further optimizes the model. (3) Multiple feature extraction methods are based on voltage, current and temperature signals to avoid significant errors caused by sensor errors in vehicle applications, and they provide backup solutions. The collaboration of multiple features has increased generalization and has been severely evaluated on multiple battery datasets using different materials. Satisfactory estimation results have been achieved for different material systems and experiments, demonstrating strong generalizability. (4) The collaboration of multi-feature and AM brought a 25% error improvement compared to a single feature. Meanwhile, the RMSE of the estimation results only differed by 0.2% under different battery start-up cycles compared with the 0-start start-up case, demonstrating the strong robustness of the method. Based on the CHAIN framework, the proposed method possesses the potential to be applied in practical applications for online estimation in the end-cloud collaboration system.

Author Contributions

Conceptualization, B.Z., W.W. and R.T.; methodology, B.Z., M.X. and P.J.; software, B.Z. and W.D.; validation, B.Z., P.J. and W.H.; investigation, M.X.; resources, W.W. and R.T.; writing—original draft preparation, L.Z.; writing—review and editing, H.W.; visualization, M.X. and Y.Z.; supervision, W.W. and R.T.; project administration, W.W.; funding acquisition, B.Z. and R.T. All authors have read and agreed to the published version of the manuscript.

Funding

This research received no external funding.

Data Availability Statement

The data presented in this study are openly available in [Oxford university research archive] at [https://dx.doi.org/10.5287/bodleian:KO2kdmYGg] (accessed on 11 April 2022), reference number [29,30].

Conflicts of Interest

The authors declare no conflict of interest.

References

  1. Chaoui, H.; Ibe-Ekeocha, C.C. State of Charge and State of Health Estimation for Lithium Batteries Using Recurrent Neural Networks. IEEE Trans. Veh. Technol. 2017, 66, 8773–8783. [Google Scholar] [CrossRef]
  2. Jiang, Z.Y.; Li, H.B.; Qu, Z.G.; Zhang, J.F. Recent Progress in Lithium-Ion Battery Thermal Management for a Wide Range of Temperature and Abuse Conditions. Int. J. Hydrogen Energy 2022, 47, 9428–9459. [Google Scholar] [CrossRef]
  3. Jiang, Z.; Qu, Z. Lattice Boltzmann Simulation of Ion and Electron Transport in Lithium Ion Battery Porous Electrode during Discharge Process. In Energy Procedia; Elsevier Ltd.: Amsterdam, The Netherlands, 2016; Volume 88, pp. 642–646. [Google Scholar]
  4. Jiang, Z.Y.; Qu, Z.G.; Zhou, L.; Tao, W.Q. A Microscopic Investigation of Ion and Electron Transport in Lithium-Ion Battery Porous Electrodes Using the Lattice Boltzmann Method. Appl. Energy 2017, 194, 530–539. [Google Scholar] [CrossRef]
  5. Hua, Y.; Liu, X.; Zhou, S.; Huang, Y.; Ling, H.; Yang, S. Toward Sustainable Reuse of Retired Lithium-Ion Batteries from Electric Vehicles. Resour. Conserv. Recycl. 2021, 168, 105249. [Google Scholar] [CrossRef]
  6. Lin, J.; Liu, X.; Li, S.; Zhang, C.; Yang, S. A Review on Recent Progress, Challenges and Perspective of Battery Thermal Management System. Int. J. Heat. Mass. Transf. 2021, 167, 120834. [Google Scholar] [CrossRef]
  7. Mou, J.; Duan, P.; Gao, L.; Liu, X.; Li, J. An Effective Hybrid Collaborative Algorithm for Energy-Efficient Distributed Permutation Flow-Shop Inverse Scheduling. Future Gener. Comput. Syst. 2022, 128, 521–537. [Google Scholar] [CrossRef]
  8. Pang, M.C.; Yang, K.; Brugge, R.; Zhang, T.; Liu, X.; Pan, F.; Yang, S.; Aguadero, A.; Wu, B.; Marinescu, M.; et al. Interactions Are Important: Linking Multi-Physics Mechanisms to the Performance and Degradation of Solid-State Batteries. Mater. Today 2021, 49, 145–183. [Google Scholar] [CrossRef]
  9. Liu, X.; Zhang, L.; Yu, H.; Wang, J.; Li, J.; Yang, K.; Zhao, Y.; Wang, H.; Wu, B.; Brandon, N.P.; et al. Bridging Multiscale Characterization Technologies and Digital Modeling to Evaluate Lithium Battery Full Lifecycle. Adv. Energy Mater. 2022, 12, 2200889. [Google Scholar] [CrossRef]
  10. You, H.; Zhu, J.; Wang, X.; Jiang, B.; Sun, H.; Liu, X.; Wei, X.; Han, G.; Ding, S.; Yu, H.; et al. Nonlinear Health Evaluation for Lithium-Ion Battery within Full-Lifespan. J. Energy Chem. 2022, 72, 333–341. [Google Scholar] [CrossRef]
  11. Xiong, R.; Tian, J.; Shen, W.; Lu, J.; Sun, F. Semi-Supervised Estimation of Capacity Degradation for Lithium Ion Batteries with Electrochemical Impedance Spectroscopy. J. Energy Chem. 2023, 76, 404–413. [Google Scholar] [CrossRef]
  12. Shen, S.; Sadoughi, M.; Li, M.; Wang, Z.; Hu, C. Deep Convolutional Neural Networks with Ensemble Learning and Transfer Learning for Capacity Estimation of Lithium-Ion Batteries. Appl. Energy 2020, 260, 114296. [Google Scholar] [CrossRef]
  13. Meng, J.; Azib, T.; Yue, M. Early-Stage End-of-Life Prediction of Lithium-Ion Battery Using Empirical Mode Decomposition and Particle Filter. Proc. Inst. Mech. Eng. Part A J. Power Energy 2023, 0. [Google Scholar] [CrossRef]
  14. Singh, P.; Chen, C.; Tan, C.M.; Huang, S.C. Semi-Empirical Capacity Fading Model for SoH Estimation of Li-Ion Batteries. Appl. Sci. 2019, 9, 3012. [Google Scholar] [CrossRef] [Green Version]
  15. Rahimifard, S.; Habibi, S.; Goward, G.; Tjong, J. Adaptive Smooth Variable Structure Filter Strategy for State Estimation of Electric Vehicle Batteries. Energies 2021, 14, 8560. [Google Scholar] [CrossRef]
  16. Yang, B.; Wang, D.; Zhang, B.; Chen, S.; Sun, X.; Wang, T. Aging Diagnosis-Oriented Three-Scale Impedance Model of Lithium-Ion Battery Inspired by and Reflecting Morphological Evolution. J. Energy Storage 2023, 59, 106357. [Google Scholar] [CrossRef]
  17. Liu, W.; Zhao, J. An Online Estimation Method of State of Health for Lithium-Ion Batteries Based on Constant Current Charging Curve. J. Electrochem. Soc. 2022, 169, 050514. [Google Scholar] [CrossRef]
  18. Li, G.; Li, B.; Li, C.; Wang, S. State-of-Health Rapid Estimation for Lithium-Ion Battery Based on an Interpretable Stacking Ensemble Model with Short-Term Voltage Profiles. Energy 2023, 263, 126064. [Google Scholar] [CrossRef]
  19. Fan, Z.; Zi-xuan, X.; Ming-hu, W. State of Health Estimation for Li-Ion Battery Using Characteristic Voltage Intervals and Genetic Algorithm Optimized Back Propagation Neural Network. J. Energy Storage 2023, 57, 106277. [Google Scholar] [CrossRef]
  20. Lin, M.; Wu, D.; Meng, J.; Wang, W.; Wu, J. Health Prognosis for Lithium-Ion Battery with Multi-Feature Optimization. Energy 2023, 264, 126307. [Google Scholar] [CrossRef]
  21. Xu, J.; Liu, B.; Zhang, G.; Zhu, J. State-of-Health Estimation for Lithium-Ion Batteries Based on Partial Charging Segment and Stacking Model Fusion. Energy Sci. Eng. 2023, 11, 383–397. [Google Scholar] [CrossRef]
  22. Merla, Y.; Wu, B.; Yufit, V.; Brandon, N.P.; Martinez-Botas, R.F.; Offer, G.J. Extending Battery Life: A Low-Cost Practical Diagnostic Technique for Lithium-Ion Batteries. J. Power Sources 2016, 331, 224–231. [Google Scholar] [CrossRef]
  23. Merla, Y.; Wu, B.; Yufit, V.; Brandon, N.P.; Martinez-Botas, R.F.; Offer, G.J. Novel Application of Differential Thermal Voltammetry as an In-Depth State-of-Health Diagnosis Method for Lithium-Ion Batteries. J. Power Sources 2016, 307, 308–319. [Google Scholar] [CrossRef] [Green Version]
  24. Wu, B.; Yufit, V.; Merla, Y.; Martinez-Botas, R.F.; Brandon, N.P.; Offer, G.J. Differential Thermal Voltammetry for Tracking of Degradation in Lithium-Ion Batteries. J. Power Sources 2015, 273, 495–501. [Google Scholar] [CrossRef]
  25. Zhang, Z.; Min, H.; Guo, H.; Yu, Y.; Sun, W.; Jiang, J.; Zhao, H. State of Health Estimation Method for Lithium-Ion Batteries Using Incremental Capacity and Long Short-Term Memory Network. J. Energy Storage 2023, 64, 106934. [Google Scholar] [CrossRef]
  26. Meng, H.; Geng, M.; Han, T. Long Short-Term Memory Network with Bayesian Optimization for Health Prognostics of Lithium-Ion Batteries Based on Partial Incremental Capacity Analysis. Reliab. Eng. Syst. Saf. 2023, 236, 107427. [Google Scholar] [CrossRef]
  27. Lin, M.; Yan, C.; Wang, W.; Dong, G.; Meng, J.; Wu, J. A Data-Driven Approach for Estimating State-of-Health of Lithium-Ion Batteries Considering Internal Resistance. Energy 2023, 277, 127675. [Google Scholar] [CrossRef]
  28. Yang, S.; He, R.; Zhang, Z.; Cao, Y.; Gao, X.; Liu, X. CHAIN: Cyber Hierarchy and Interactional Network Enabling Digital Solution for Battery Full-Lifespan Management. Matter 2020, 3, 27–41. [Google Scholar] [CrossRef]
  29. Birkl, C. Oxford Battery Degradation Dataset 1 VO-RT-Aggregated Database. OP. Available online: https://ora.ox.ac.uk/objects/uuid:03ba4b01-cfed-46d3-9b1a-7d4a7bdf6fac (accessed on 11 April 2022).
  30. Birkl, C. Diagnosis and Prognosis of Degradation in Lithium-Ion Batteries; University of Oxford: Oxford, UK, 2017. [Google Scholar]
  31. Severson, K.A.; Attia, P.M.; Jin, N.; Perkins, N.; Jiang, B.; Yang, Z.; Chen, M.H.; Aykol, M.; Herring, P.K.; Fraggedakis, D.; et al. Data-Driven Prediction of Battery Cycle Life before Capacity Degradation. Nat. Energy 2019, 4, 383–391. [Google Scholar] [CrossRef] [Green Version]
  32. Gong, Q.; Wang, P.; Cheng, Z. A Data-Driven Model Framework Based on Deep Learning for Estimating the States of Lithium-Ion Batteries. J. Electrochem. Soc. 2022, 169, 030532. [Google Scholar] [CrossRef]
  33. Gu, X.; See, K.W.; Li, P.; Shan, K.; Wang, Y.; Zhao, L.; Lim, K.C.; Zhang, N. A Novel State-of-Health Estimation for the Lithium-Ion Battery Using a Convolutional Neural Network and Transformer Model. Energy 2023, 262, 321–330. [Google Scholar] [CrossRef]
Figure 1. Battery degradation curve. (a) NASA dataset. (b) Oxford University dataset.
Batteries 09 00329 g001
Figure 2. Schematic diagram of feature extraction. (a,b) are the changes of voltage curge of two datasets. (c,d) are the change of the IC curve with the battery degradation of two datasets. (e,f) are the change of DTV curve with battery degradation of two datasets.
Batteries 09 00329 g002
Figure 3. Results of the correlation analysis. (ad) Results of B5 of the NASA dataset. (ei) Results of Ox1 of the Oxford University dataset.
Batteries 09 00329 g003
Figure 4. The overall structure of the proposed model.
Batteries 09 00329 g004
Figure 5. SOH estimation results of battery B5 of the NASA dataset. (a) Results of using duration of the same discharging voltage range as the feature. (b) Results of using ICA as the feature. (c) Results of using DTV as the feature. (d) Results of using multiple features. (e) Results of using multiple features and AM collaboration. (f) Error analysis of the estimation results.
Batteries 09 00329 g005
Figure 6. SOH estimation results of battery #3 of the Oxford University dataset. (a) Results of using duration of the same discharging voltage range as the feature. (b) Results of using ICA as the feature. (c) Results of using DTV as the feature. (d) Results of using multiple features. (e) Results of using multiple features and AM collaboration. (f) Error analysis of the estimation results.
Batteries 09 00329 g006
Figure 7. SOH estimation results of validation on other batteries. (a) B6. (b) B7. (c) B18. (d) #1. (e) #4. (f) #7. (g) #8. (h) Error analysis of the estimation results of multiple features without AM. (i) Error analysis of the estimation results of multiple features with AM.
Batteries 09 00329 g007
Figure 8. SOH estimation results of robustness validation. (a) B5. (b) B6. (c) B7. (d) B18. (e) #1. (f) #3. (g) #4. (h) #7. (i) #8.
Batteries 09 00329 g008
Figure 9. SOH estimation results of the MIT–Stanford–Toyota Research Center dataset. (a) #20. (b) #22. (c) #36. (d) #44.
Batteries 09 00329 g009
Table 1. Detailed battery technical information and experimental conditions of the NASA dataset.
Test ConditionTechnical Specifications
Nominal capacity2 AhCathode materialsLiCoO2
Charging current1.5 A
Upper cutoff voltage4.2 VCharge testCC-CV
Cut-Off VoltageB52.7 VDischarge testCC
B62.5 V
B72.2 VEnvironmental temperature24 ℃
B182.5 V
Table 2. Detailed battery technical information and experimental conditions of the Oxford University dataset.
Technical SpecificationsTest Environment
Test subjects8 × Kokam CO LTDBattery testerBio-Logic MPG-205, 8 channel
Nominal voltage3.7 VEnvironmental chamberBinder thermal chamber
Nominal capacity740 mAhCathode materialLCO/NCO
Limit charge voltage4.2 V ± 0.03 VCharge test2C-rate charge
Discharge testAttemis drives cycle discharge
Cut-Off voltage2.7 V
Environmental temperature40 °C
Table 3. RMSE and MAE of SOH estimation results of robustness validation.
BatteryB5B6B7B18#1#3#4#7#8
RMSE (%)0.2920.6960.3410.4340.2160.1620.2310.2290.191
MAE (%)0.1980.5310.2480.3570.1840.1240.1880.1820.148
Table 4. RMSE of the SOH estimation results of different methods based on the Oxford dataset.
MethodData Split PortionFeatureRMSE (%)
#1#3#4#7#8
Proposed6:4DTV
IC
Duration of the same discharging voltage range
0.2160.1620.2310.2290.191
EBM-ACO [27]Leave-one-out
cross validation
IC
DTV
DTC
Internar resistance
0.771.490.590.790.77
Stacking-based ensemble learning model [21]Leave-one-out
cross validation
Voltage
Temperature
IC
0.720.620.420.530.45
LSTM-BP [32]Leave-one-out
cross validation
Voltage0.220.270.30.290.25
Table 5. RMSE of the SOH estimation results of different methods based on the NASA dataset.
MethodData Split PortionFeatureRMSE (%)
B5B6B7B18
Proposed6:4DTV
IC
Duration of the same discharging voltage range
0.2920.6960.3410.434
LSTM [25]K-fold cross validationImproved IC analysis0.7-1.31.7
LSTM with Bayesian optimization [26]4:6Partial IC curve1.271.531.621.72
CNN-Transformer [33]6:4Capacity
Current
Voltage
Temperature
Sampling time
0.340.320.370.32
Disclaimer/Publisher’s Note: The statements, opinions and data contained in all publications are solely those of the individual author(s) and contributor(s) and not of MDPI and/or the editor(s). MDPI and/or the editor(s) disclaim responsibility for any injury to people or property resulting from any ideas, methods, instructions or products referred to in the content.

