Article

Examining the Moderating Role of Perceived Lack of Facilitating Conditions on Household Recycling Intention in Kano, Nigeria

by
Muhammad Salisu Khalil
1,2,
Sabrina Ho Abdullah
1,*,
Latifah Abd Manaf
3,
Amir Hamzah Sharaai
1 and
Aliyu Baba Nabegu
4
1
Department of Environmental Management, Faculty of Environmental Studies, Universiti Putra Malaysia, 43400 Serdang, Selangor, Malaysia
2
Department of Environmental Sciences, Faculty of Science, Federal University Dutse, 7156 Dutse Jigawa State, Nigeria
3
Department of Environmental Science, Faculty of Environmental Studies, Universiti Putra Malaysia, 43400 Serdang, Selangor, Malaysia
4
Department of Geography, Faculty of Earth and Environmental Sciences, Kano University of Science and Technology, Wudil 713101, Nigeria
*
Author to whom correspondence should be addressed.
Recycling 2017, 2(4), 18; https://doi.org/10.3390/recycling2040018
Submission received: 31 August 2017 / Revised: 19 October 2017 / Accepted: 19 October 2017 / Published: 24 October 2017

Abstract

:
Improper handling of household solid waste causes problems that affect public health and the environment, as well as the aesthetic nature of cities. This paper aims to determine if the theory of planned behavior (TPB), and its extended version can be used to predict household recycling intention (RI), and whether perceived lack of facilitating conditions have a moderating role on households’ RI in Nigeria. Data from a sample of 393 households from Kano metropolis Nigeria were analyzed using structural equation modeling. The result reveals that the TPB Model predicts households RI in Nigeria and explains 42% of the variance in RI. Attitude is the most important predictor of RI in the TPB model (β = 0.593, p = 0.000). However, after personal norm (PN) was added into the model, the variance in RI increases to 58% and PN becomes the most important predictor of RI in the extended TPB model (β = 0.496, p = 0.000). Perceived lack of facilitating condition was found to have a significant moderating effect on households’ RI. Finally, our findings show that providing households with recycling facilities and local collections holds great promise for improving households’ intention to recycle.

1. Introduction

Globally, municipal solid waste management (MSWM) is becoming more complex and difficult to manage, especially in developing countries. Its complexity is as a result of high population growth, rapid urbanization, rising living standard, and change in consumption patterns [1]. Household solid waste (HSW) refers to the garbage produced as a result of day-to-day activities of the household [2] and is the major source of MSW in many countries to which most cost of MSWM is allocated [3]. Additionally, HSW is one of the major issues facing cities in developing countries [4] such as Nigeria.
In Nigeria, households’ attitude towards waste handling has been a key concern, which leads to many health and environmental problems [5]. Furthermore, reckless dumping of waste into the drainages and, on any available land has resulted in problems such as environmental degradation, flooding, air and water pollution, etc. Conspicuously, solid waste is seen in most parts of the cities; on the roads, within the neighborhoods and around residential buildings [6]. Even the solid wastes collected by the municipal authority often end up deposited in the landfills. Landfilling is the major approach adopted for waste disposal in Nigeria; however, it imposes a great danger to the physical environment, underground water, and also leads to scarcity of the land resource [7]. Effective management of wastes can facilitate recovery of recyclable materials and reduction of its negative environmental impact [8]. Recycling represents a sustainable way of processing and reusing materials that have been previously used. It also reduces the amount of wastes directly sent to the landfills [9].
Waste recycling has been widely adopted in developed countries such as Japan, U.K., and the U.S.A., etc. For example, in the U.S.A. recycling laws have been in place since the year 1993, which required people to recycle certain percentage of their waste. A report by the U.S. Environmental Protection Agency [10] has revealed that the recycling law was successfully implemented, with about 34% of MSW been recycled as of 2010. Similarly, the UK has recorded success in recycling, with about 44.9% of the solid waste generated being recycled as of 2014, and set out to achieve a target of minimum of 50% of recycling rates by the year 2020 [11]. Additionally, in Japan, the government imposed a strict recycling law that mandated people to minimize waste generation as well as participate in recycling. The law emphasized that all food producers must use recyclable packaging materials for their product, and also encourage their customers to reuse the food packages [12].
In contrast, recycling activities in Nigeria are mainly carried out by the informal sector [6] who support themselves by selling recyclable items as secondary materials to local markets, either for local use or export. Even in some cities where the formal waste recycling was introduced, the effect of the program is always limited, and open dumping and landfilling remain the methods most widely practiced. The possible explanation for this is that the existing recycling policies were not targeted toward changing household waste handling behavior. It is evident that policies that are designed to reduce household waste generation and encourage recycling are unlikely to be effective if they are not targeted to the fundamental psychological factors that underpin residents’ motivations to recycle [13]. Additionally, designing an effective policy intervention, which has a significant effect on factors such as attitude, subjective norms, and perceived behavioral control, can influence individual’s intention to perform a behavior [14]. Effective recycling policies can influence people’s intention and behavior in different ways; directly through imposing taxes and levy, or generally by changing the social context of people’s behavior [15], this has been a challenge to the Nigerian MSWM system. For example, previous policies and researches on solid waste management were focused on top-down approach such as institutional problems [16], provision of infrastructure [17], appraisal of waste management strategies [18], regulations and governance [19], state of the environment [20], and ignored the bottom-up approach that ensures individual’s participation.
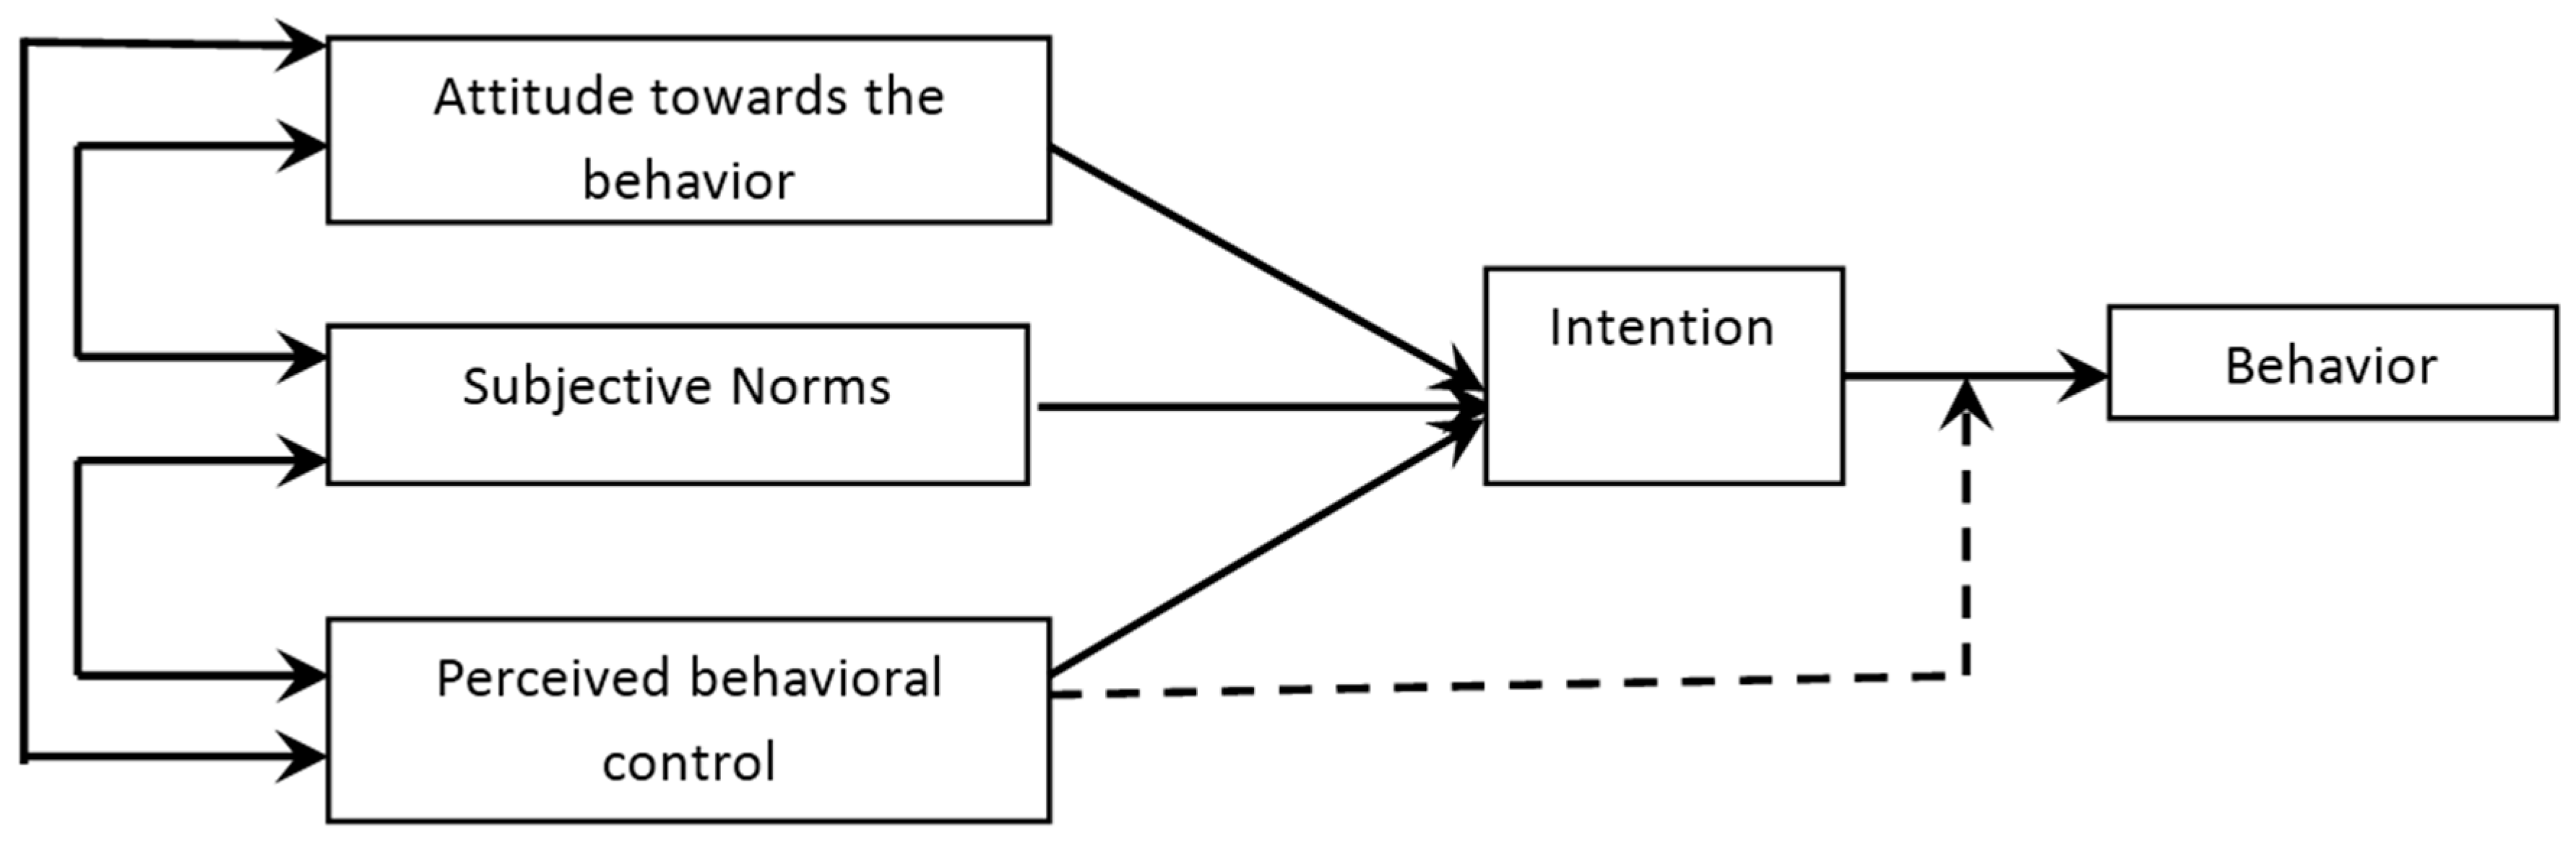
Therefore, this paper leans towards the bottom-up approach to MSWM by investigating household recycling intention in Nigeria. The paper utilizes the theory of planned behavior [21] to perform this task. The theory has been widely utilized by previous studies to investigate pro-environmental behavior [22,23,24,25,
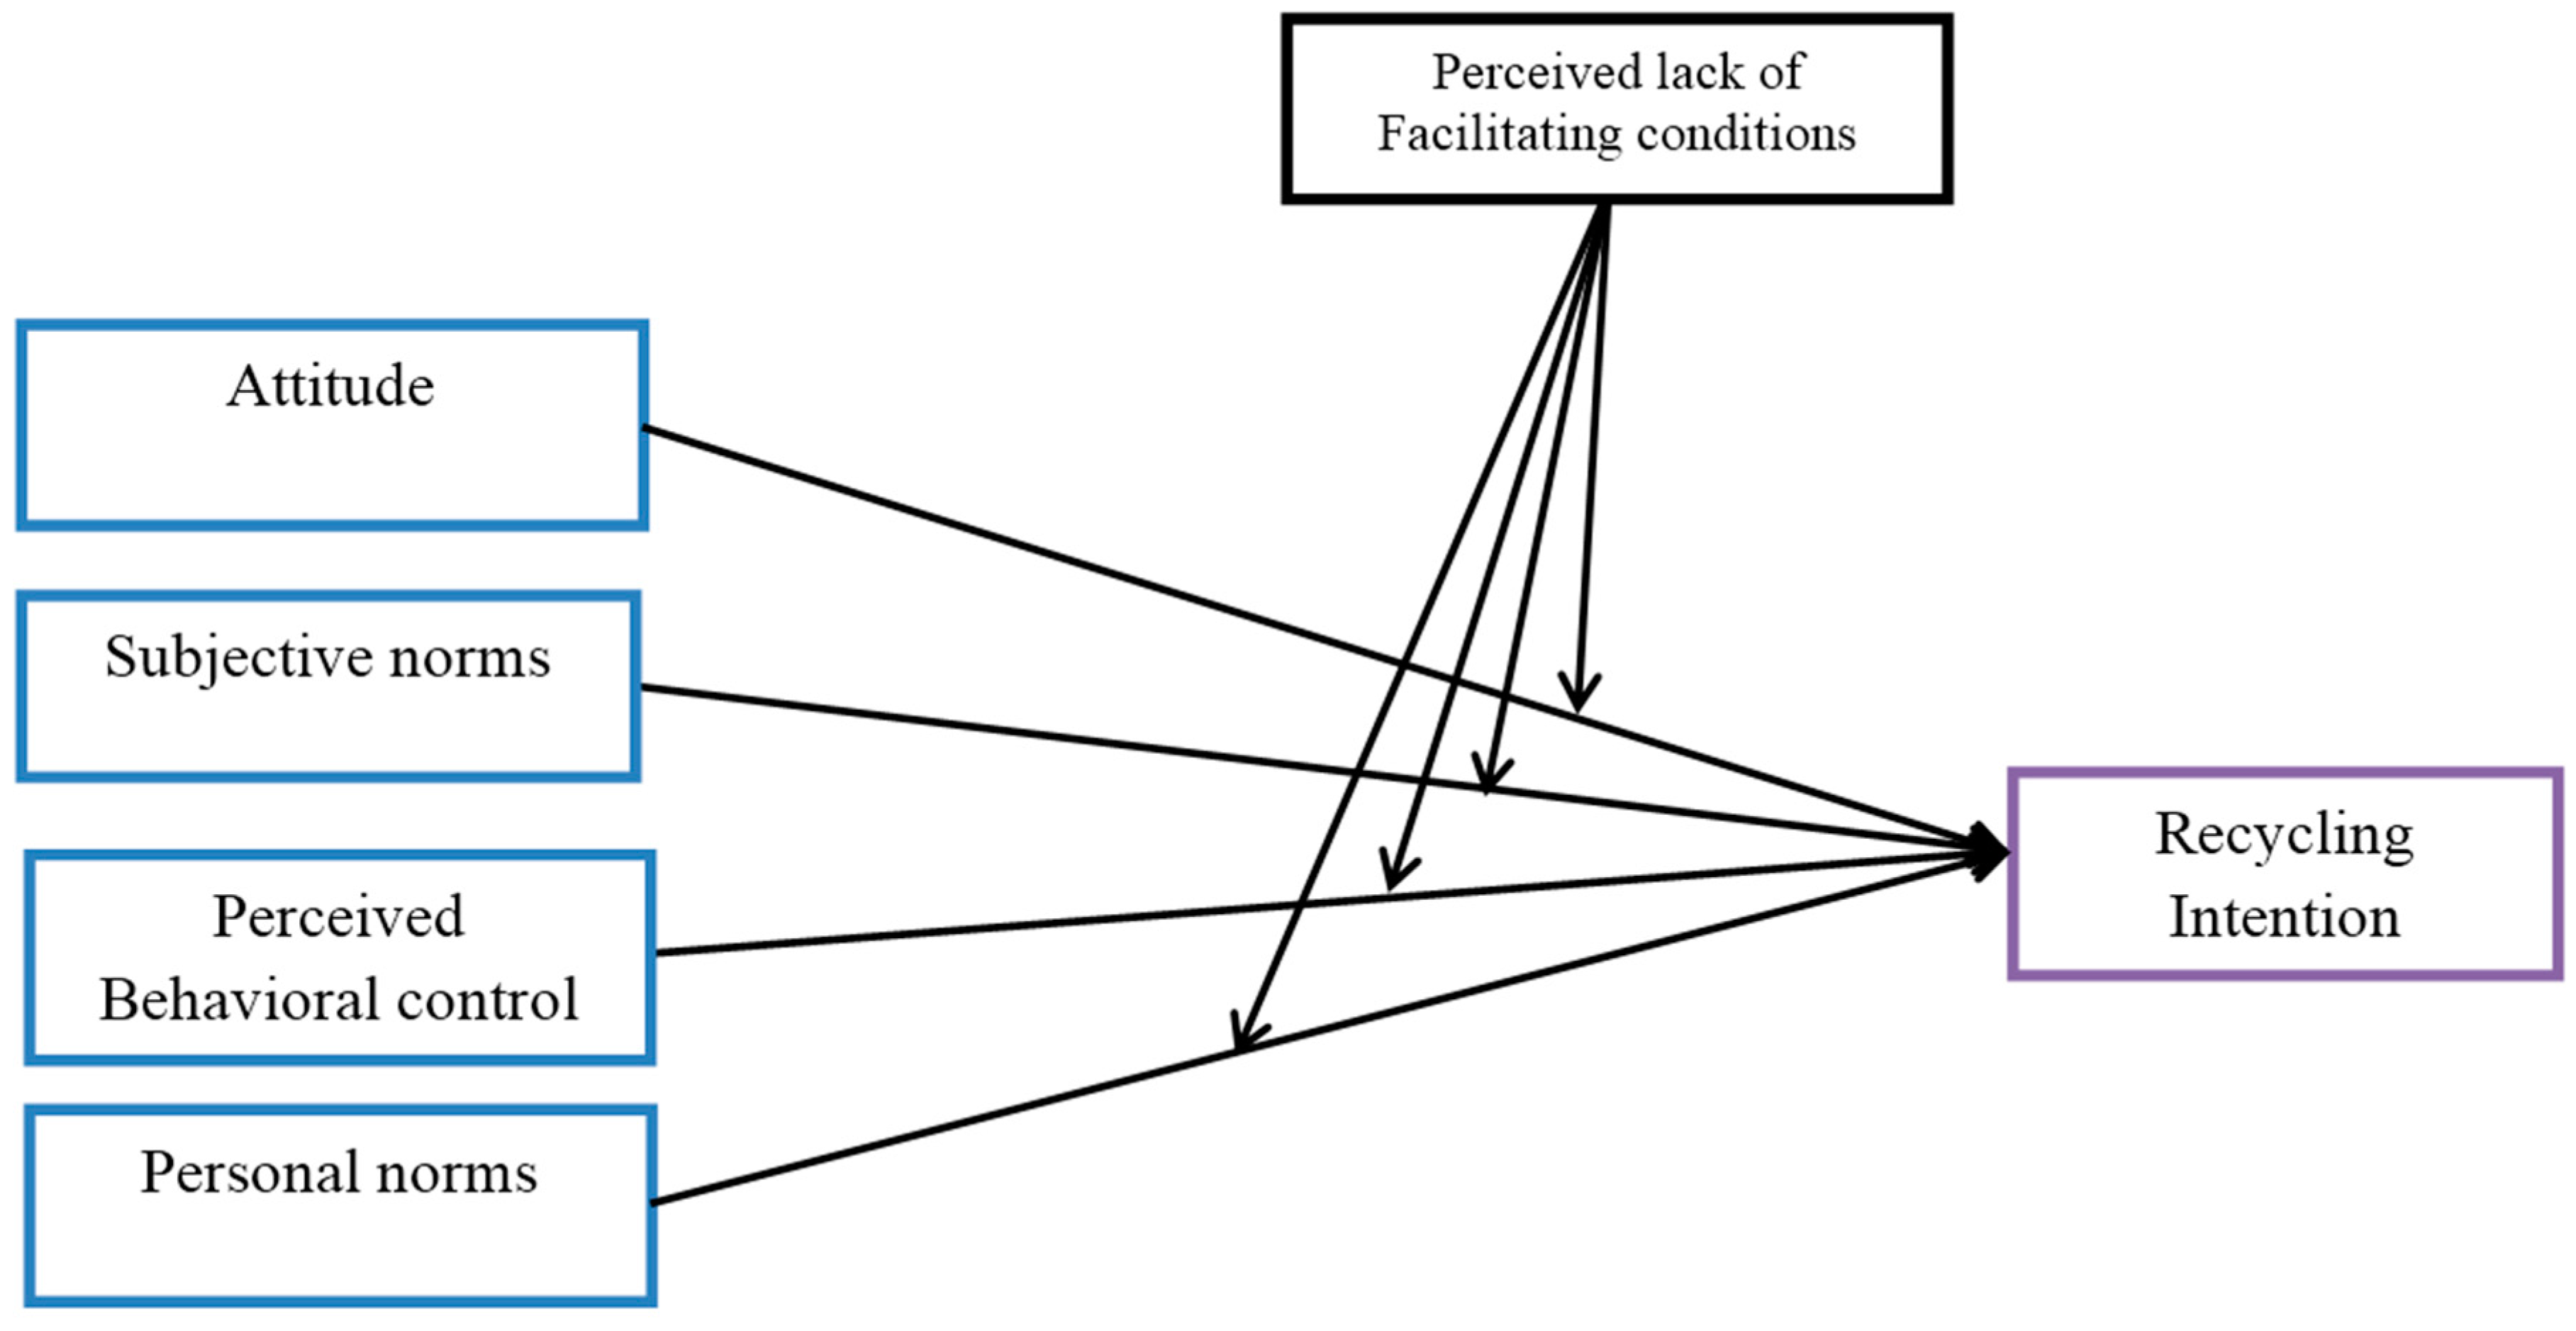
26], however, to the best of our knowledge, there is lack of studies that utilized TPB in African continent, particularly in Nigeria. This study is the first that used the TPB to investigate household recycling intention in Nigeria. Furthermore, the present study expands the TPB by including two additional variables: personal norms and perceived lack of facilitating conditions (lack of facilities and local collection) to determine if lack of facilities and local collections affect households intention to recycle. Therefore, the following questions would be addressed in this paper: Does the Theory of Planned Behavior predict recycling intention among households in Kano metropolis Nigeria? What is the role of personal norms in conjunction with TPB components in predicting recycling intention among households in Kano metropolis Nigeria? What is the moderating role of perceived lack of facilitating conditions on households’ recycling intention?

2. Theoretical Basis of the Study

2.1. Theory of Planned Behavior (TPB)

Scholars, especially in the field of psychology, have devoted much effort to investigating people’s behavior, hence the development of psychological theories and models to facilitate the understanding of the factors influencing behavior. Among these theories, the TPB has emerged as the most widely used framework in behavioral research, particularly, in pro-environmental studies. Developed by Ajzen, [21], TPB was developed from the theory of reasoned action (TRA) [27].
According to the TPB, when individuals are asked to decide on a course of action, first of all, they tend to look at the likely consequences of the available alternatives (behavioral beliefs), secondly, they consider the normative expectations of important people around them (normative beliefs), and finally, they weigh the available resources at their disposal and potential obstacles (control beliefs). These beliefs result, respectively, in the formation of attitudes (one’s general assessment of the gain or otherwise of engaging in a specific behavior), subjective norms (one’s perceived social pressure by the important people around him/her to perform a behavior), and perceived behavioral control (one’s perceptions of his/her ability to carry out a particular behavior) (Figure 1) [14]. However, PBC does not only predict behavioral intention, it also directly predicts a behavior.
Overall, the TPB is a conceptual framework that looks at the factors influencing people’s behavior. It has been widely utilized by many researchers on issues related to sustainable food choice behavior [28], sexual behaviors [29], water saving technology [30], smoking behavior [31], environmental knowledge and attitude [26], reducing energy consumption [32], and recycling [33]. Findings from these studies have supported the robustness of TPB constructs in predicting pro-environmental behavioral intention. However, most of these studies that used TPB were carried out in developed countries and particularly in the U.S.A., U.K., and economically stable Asian countries, such as China, Japan, Malaysia, etc. Thus, it is pertinent to ascertain the validity of the theory in other cultural settings of low economic countries, especially in African countries like Nigeria. The present study inclines to examine if TPB could be used to predict recycling intention among households in Kano metropolis, Nigeria.
One advantage of the TPB is that it allows for the inclusion of additional variables from other theories. As reported by previous studies, incorporating external variables into the TPB framework increases the predictability of the theory [34,35,36]. Ajzen, [37] himself noted that TPB is “open to the inclusion of additional predictors if it can be shown that they capture a significant proportion of the variance in intention or behavior after the theory’s current variables have been taken into account”.
However, TPB has been criticized mainly for focusing on cost and benefit, and it has failed to consider the intrinsic sources of motivation such as personal/moral norms [38]. It is evident that pro-environmental behavior is best conceptualized as behavior which involves a combination of both self-gain and selfless motives (altruism) [22]; thus, the present study incorporates personal norms into the TPB model.

2.2. The Role of Personal Norms (PNs)

Household recycling behavior contains some components of social responsibility and moral norms. Personal Norms (PNs) are formed when an individual is aware about the consequences of not performing a particular behavior, and when the individuals ascribed the responsibility of these consequences. That is to say, people develop a personal norm for recycling when they have the basic knowledge and motivation for recycling. Furthermore, people need to know and personally believe that their participation in recycling will provide positive consequences, and failure to participate will result in negative effects not only to themselves but also to others.
Previous literature has reported a correlation between PNs and recycling intention [24,31,39,40,41,42]. That is to say, if a person’s norm holds that recycling is good as well as beneficial to the people around him and their environment, then he/she may likely intend to recycle. Therefore, the strong relationship between PNs and recycling intention provides the need for formulating policies that presents recycling as a social activity that is useful, pleasant and important to the entire public [43].
Apart from recycling studies, PNs have also been used to predict other behaviors, such as dishonest actions [21], traffic rule violations [44], and shoplifting [45], in all these studies, the PNs appeared as a significant predictor of intention. Moreover, it was reported that including PNs in TPB framework increases the variance of intention [46,47]. This implies that performing a behavior depends not only on the cost-benefit analysis as indicated in the TPB, but also on the altruistic, selfless, and pro-social motives [48]. Therefore, the present study tends to investigate the role of personal norms in conjunction with the TPB components in predicting recycling intention among households in Kano metropolis Nigeria.

2.3. The Role of Facilitating Conditions

Facilitating conditions represent a person’s situation at a given time and are important determinants of recycling behavioral intention. These factors include access to services [49], frequency of collection, logistics, type of container, and the type of materials to be recycled [49,50]. In addition, provision of incentives is also considered as a facilitating factor because it influences households recycling behavior [51]. Other facilitating factors include the availability of recycling facilities and local collections. These variables play a significant role in determining levels of recycling intention [49,52], and offer a way to assess and improve the recycling process through expansion of services offered. Martin et al., [53] reported that if individual perceived a lack of recycling facilities and local collection, he/she may likely not participate in recycling. Other studies have also revealed absolutely consistent results on the role of recycling facilities and local collection in influencing residents’ intention toward recycling [41,43,54,55].
In view of the role of facilitating conditions in influencing a household’s intention to recycle, the variable is included into the original TPB framework (Figure 2) to examine if it moderates the relationships between TPB predictors, personal norms, and recycling intention. We consider this as a gap in the literature, especially since the study is conducted in Nigeria, where recycling facilities and local collections are lacking.

3. Method

3.1. Research Design

The method of this study includes both descriptive and correlational research design. In the descriptive research design, demographic variables were analyzed based on their frequencies and percentages. Furthermore, in the correlational research design, the degrees of relationships that exist between the variables of the study and how the predictor variables predict recycling intention among households in Kano metropolis were analyzed and presented using SEM. To answer the research questions, two models were developed and examined. Model 1 proposed that TPB components predict recycling intention among households in Kano metropolis Nigeria. Model 2 proposed that personal norms improve the predictive ability of TPB components, and perceived lack of facilitating conditions moderate the relationships between the predictor variables and recycling intention.

3.2. Location of the Study

This study was conducted in Nigeria and the target location for the study is Kano metropolis in Northern Nigeria. Nigeria is a developing country and has a population of more than 180 million and an average growth rate of 2.38 [16], which is distributed on the land area of 923,768 km2. As Africa’s most populous country and the ninth most populous country in the world, Nigeria has a population density of about 139 persons/km2 [56]. The country has 36 states, with Lagos and Kano as the first and second largest cities respectively.
Kano metropolis is located on latitude 12°40′ N and longitude 8°35′ N to 8°45′ E [57]. Kano has a long history of commercial and industrial activities, which attracts millions of people from within and outside Nigeria [58]. The city’s population was estimated at 6 million, with a growth rate at about 3% per annum, which make it among the fastest growing and one of the most crowded cities in Nigeria [59]. These characteristics explain the high waste generation in Kano metropolis and the complexity of its management, which require innovative strategies.

3.3. Participants

The data used in the present study was collected between May 2016 and December 2016. The population for this study includes all households residing within Kano metropolis. Kano metropolis has a total of 477,805 households [60], which is unevenly distributed within its three major zones, which are: Government Residential Areas (mainly dominated by high-income class); the inner city (dominated by middle-income class); and suburban zone (dominated by low-income class). The three zones constituted eight local governments that formed the study area as shown in Figure 3 below:

3.4. Sampling

To draw the sample for this study, one local government was randomly selected from each of the three zones to represent the zone. Following this procedure the following local governments were selected; Dala LGA (middle income), Nassarawa LGA (high income), and Kumbotso LGA (low income). In the final stage proportionate random sampling of households based on the population of each of the representative local governments was adopted as recommended by McMillan, [62]. This technique ensures that all participants in the target population have an equal chance of being selected for the study [63]. Considering the heterogeneity of the local governments in Kano metropolis, multistage stratified random sampling technique was employed to collect data from the sampled population. Cohen, [64] observed that the larger the sample size, the better, because everything being equal, the degree of error will be small and the reliability of the result will be higher. In this regard, Cohen, [64] suggested the use of a truly representative sample of the population, which may be a better option. Based on the above, a researcher needs to determine what constitutes an appropriate sample size for his study.
For the purpose of this study, 450 questionnaires were distributed proportionately among households in the three sampled local government areas. However, only 393 questionnaires were found valid during the analysis. This is because, out of the 450 questionnaires, only 422 were completed and returned successfully. However, about 29 out of the 422 returned questionnaires were found to have a significant missing data. Therefore, for ease of analysis, we deleted about 29 respondents using a list wise deletion of missing data. Finally, this method resulted to a reduced sample of about 393 respondents. As highlighted by Israel, [65] a good sample size ranges between 200 and 500, especially for statistical analysis that involves multiple regression analysis. Also, Howell, [66] argues that the sample size of a study plays a significant role in determining the result of a study, because when the sample size is reduced, the power value would also be reduced to below 0.80, which would be undesirable. Therefore, 393 samples are good enough for the analysis of this study.
The following was the distribution of households from the randomly selected three local governments areas from which the sample of the study was drawn as indicated in Figure 3: Dala has 68,005 households, and its proportionate sample was 133.195 (29.59%), Nassarawa has 108,780 households, and its proportionate sample was 213.058 (47.33%), and Kumbotso has 52,969 households, and its proportionate sample was 103.745 (23.05%).

3.5. Procedure

After the sample was determined and the respondents were identified, the research assistants contacted all the 450 households in person and asked them to complete the self-report questionnaire. The research assistants explained the main aim of the research to the respondents. Within one week, the research assistants went round and collected the completed questionnaire from the respondents for further analysis. The returned response rate was about 422 questionnaires (93.77%).

3.6. Instrument

A set of items that make up one self-report questionnaire was used in the data collection for this study. The instruments were organized and planned in a single self-report questionnaire that was administered to all the participants successfully. The present study adopted established instruments from the past literature by Tonglet et al., [39], Knussen et al., [33] and Chen and Tung, [24]. The questionnaire contained the following sections:

3.6.1 Demographic Variables

Households were asked to respond to the questions about their gender, area of residence, household size, age, educational level, income, and occupation.

3.6.2 Dependent Variable

The dependent variable in this study is recycling intention. The construct was measured using five items (e.g., “I intend to recycle my waste when there are: collection centers, satisfactory services, and on every weekend” …). The participants were asked to respond to each question using a five-point Likert scale that ranges from 1-strongly disagrees to 5-strongly agree. The construct has a Cronbach’s alpha = 0.873.

3.6.3 Predictor Variables

  • Attitude (ATT): This variable was measured using nine items statements (e.g., “Recycling is: good, useful, rewarding, responsible”, etc.). However, during CFA, two items were deleted. The respondents were asked to choose the answer that best describes their opinion on the 5-point scale which ranges from 1-strongly disagrees to 5-strongly agree. The Cronbach’s alpha for this construct is 0.935.
  • Subjective norms (SN): On this construct, the households were asked to indicate how much they agree with the 5—items statements about their perception of social pressure to recycle (e.g., “most people think I should recycle, most people who are important to me want me to engage in recycling”, etc.). The Cronbach’s alpha for this scale is 0.898.
  • Perceived behavioral control (PBC): With the Cronbach’s alpha of 0.935, this variable was measured using eight-item statement. However, one item was deleted during CFA analysis. Households indicated their level of agreement with each statement on a 5-point Likert scale with 1 as strongly disagrees and 5 strongly agree (e.g., “I know what items can be recycled, I know where to take my household waste for recycling. Recycling is: inconvenient, easy”, etc.).
  • Personal Norms (PNs): This construct has a Cronbach’s alpha value of 0.891. It comprised of seven items, one item was deleted during the CFA. Respondents rated their level of agreement based on the 5-point Likert scale (e.g., “I feel I should not waste anything if it could be used again, it would be wrong of me not to recycle my waste, not recycling goes against my principles”, etc.).

3.6.4. Moderating Variable

The construct perceived lack of facilitating conditions (i.e., Lack of recycling facilities, and lack of local collections) was used as a moderator in this study. It was measured using two items statements (“Failing to recycle is because: recycling facilities are not easily available, there are no local collections”). The respondents were asked to indicate their level of agreement on each statement using 5-point Likert scale, where 1 means strongly disagree and 5 is strongly agree. Perceived lack of facilitating conditions has a Cronbach’s alpha value of 0.801.

3.7. Analysis

Firstly, the demographic characteristics of the participants of this study were examined. Then, the correlations among all the variables in this study were determined. This was followed by investigating the relative degree of contribution of all the predictor variables on recycling intention. Finally, Multi-Group Analysis was conducted to determine the moderating effect of perceived lack of facilitating conditions on the relationships between the predictor variables and the recycling intention. The study employed the use of Structural Equation Modeling (SEM) as a statistical technique to perform these tasks. SEM AMOS statistical software program version 22 was used. SEM combines factor analysis and regression techniques and has the ability to test multiple paths of influence simultaneously [67]. Thus, SEM takes the approach of testing hypothesis to the multivariate analysis of structural theory, especially one that specifies causal relationships among multiple variables, just like the one in this study.

4. Data Analysis and Results

4.1. Result of the Descriptive Analysis

From the 393 valid questionnaires, the socio-demographic result of the respondents revealed that 50.9% were male, and 49.1 were female. In total, 62.8% attained tertiary education level. The age group of the respondents falls within the range of 20–34 (46.1%), 35–49 (25.7%), 50–65 (27%), and >65 (1.3%). In addition, the size of the households ranges between <5 (33.8%), 5–8 (36.1%), and >8 (30%) as presented in Table 1:

4.2. Result of the Correlation Analysis

Prior to conducting SEM analysis, Descriptive statistics (Mean and standard deviation), and the correlation among the variables of the study were analyzed and presented in Table 2. The correlation matrix shows that all the predictor variables have significant positive correlation with recycling intention. However, the moderator (perceived lack of facilitating conditions) has a significant negative relationship with recycling intention. This implies that the more households perceive a lack of facilitating conditions, the lower will be their intention to recycle.

4.3. Testing of the Measurement Model

In this study, confirmatory factor analysis (CFA) was conducted to test for the convergent validity and construct reliability of the measurement model. It is the intent of convergent validity (CV) to demonstrate that there is an agreement between measures of the same construct assessed by different methods. That is to say, the CV shows the level in which the intended variables measure what the items claim to measure [63]. Therefore, CV can be established if all the indicators (items) of a particular variable share a certain higher proportion of variance in common [68]. There are number of ways to estimate convergent validity, especially in conjunction with SEM as documented by [69] that recommends three most important ways, which include; factor loading, average variance extracted (AVE), and construct reliability.
In order to ascertain the factor loading of the individual items that constitute the construct in this study, a pooled CFA was conducted for all the constructs and their corresponding items (Figure 4). Factor loading is one of the most important considerations in convergent validity because higher convergent validity is indicated by higher factor loading. Thus, a rule of thumb recommended standardized factor loading estimate, ranges from 0.5 to 0.7, or even higher [69]. In this study, with CFA, the Average Variance Extracted (AVE) for each latent variable was determined. The estimated AVE is the average amount of variation that a latent construct is able to explain in the observed variables to which it is theoretically related in a study. The rule of thumb recommendation by Hayes and Preacher [68] states that an AVE of 0.5 and above is an indication of adequate convergence. Therefore, the AVE measure for each latent construct in this study is greater than 0.5 (Table 3), hence the convergent validity of the measurement model of this study has been achieved. The next important indicator of convergent validity is construct reliability.
Construct Reliability (CR) is the degree to which study items consistently measures whatever they claim to measure [63]. Since the present study employed the use of SEM statistical data analysis technique, the CR value is used as a measure of the reliability of the construct involved in the study. It is estimated from the squared sum of the factor loading (L) for each variable. A recommendation of the rule of thumb suggests that a reliability of 0.6 to 0.7 is acceptable [68]. A higher CR means there is high internal consistency, that is to say, there is consistency among the items representing the latent variable they intend to measure [69]. In this study, the result of internal consistency among the items of each construct is satisfactory. Table 3 below shows a summary of the CFA for the validity and reliability of all the constructs under this study, which includes both the AVE and CR.
Another important thing is the Discriminant validity (DV), which refers to the extent to which a construct/variable is truly distinct from the other constructs/variables. To provide evidence of DV, the AVE for two factors must be greater than the squared correlation between the two factors [70]. The result in Table 4 below shows that the DV in this study has been achieved.
Additionally, the indices that indicate the model’s Goodness-of-fit were used to test the measurement model of this study. The commonly-used model fit indices are; Chi-square, root mean square error of approximation (RMSEA), normed fit index (NFI), comparative fit index (CFI), and incremental fit index (IFI). Previous literature has shown that three to four of the aforementioned fit indices are adequate to conclude that a model is fit [69]. A model is considered to have an acceptable fit to the data when (CMIN/df ≤ 5), (CFI ≥ 0.90), (GFI ≥ 0.90), (AGFI ≥ 0.90), (NFI ≥ 0.90,) (RAMSEA ≤ 0.08) [71].
A close look at the Measurement model of this study in Figure 4 below shows that the model finally met the required recommended cut-off fit indices values; this was achieved after the second pooled CFA was conducted. Thus, the measurement model for this study was found fit. Table 5 below provides a summary of the fit indices of this study.
From Table 5 above, the measurement model for this study is fit since it has met more than four of the goodness-of-fit indices. Hence the researcher went ahead with the specification and examination of the structural model.

4.4. Result of the Structural Equation Modeling (SEM)

The first aim of this study was to determine if TPB components predict household recycling intention in Nigeria. To achieve this aim, the present study employs the use of structural equation modeling in order to determine the individual and collective contribution of TPB components on households’ intention to recycle. When the TPB variables (attitude, subjective norms, perceived behavioral control) were entered into the model (Figure 5), they explained 42% variance in recycling intention. As expected, all the three TPB components have significant positive correlation with the recycling intention (Table 6).
The analysis of model 1 (Figure 5) in Table 6 above shows that the standardized path coefficient of the constructs have supported all the hypotheses by indicating that attitude towards recycling has contributed significantly to recycling intention (β = 0.593, CR = 8.817, p = 0.000), subjective norms have contributed significantly to recycling intention (β = 0.194, CR = 3.005, p = 0.003), and perceived behavioral control has also significantly contributed to recycling intention (β = 0.132, CR = 2.045, p = 0.041).
The result of model 1 in Figure 5 above has been corroborated with the previous studies which asserted that TPB is an important model that provides a theoretical framework for investigating predictors of recycling intention [22,24,36].
Additionally, from the model 2 below, the TPB components together with personal norms were entered into the model, and the R2 increased from 42% to 58%. This means that personal norms alone add an additional 16% variance in recycling intention. The result has been corroborated with the studies by Bamberg and Moser [46]; Botetzagias, et al. [72]; Onwezen et al. [47] who reported that including PNs in TPB framework increases the variance of intention. The path diagram of the SEM analysis in Figure 6 below shows the collective and individual contribution of variables in this study. The result of the analysis is presented in Table 7 below:
The result in Table 7 above shows that attitude toward recycling contributed significantly to recycling intention (β = 0.456, CR = 7.817, p = 0.000), subjective norms have contributed significantly to recycling intention (β = 0.158, CR = 2.840, p = 0.005), and personal norms have contributed significantly to recycling intention (β = 0.496, CR = 8.134, p = 0.000). However, the contribution of perceived behavioral control to the recycling intention is not significant (β = 0.100, CR = 1.803, p = 0.071). This result is consistent with that of Chen and Tung, [24]; Davies et al., [36], who revealed that perceived behavioral control is not a significant determinant of recycling intention. Moreover, model 2 supports the assertion by previous studies that incorporating additional variables (personal norms) improve the predictive ability of the TPB [24,34,35,36].

4.5. The Moderating Effect of Perceived Lack of Facilitating Conditions

In this study, the construct perceived lack of facilitating conditions (PLFC) was incorporated to examine if it has a moderating effect on the relationships between the predictor variables and recycling intention. PLFC refers to the extent to which perceived unavailability of recycling facilities affects households’ intention to recycle waste. The variable was represented by two factors; lack of facilities and lack of local collections. Therefore, lack of recycling facilities was considered group ‘1’, and lack of local collections was assumed to be group ‘2’.
Prior to the testing of moderating effect of the PLFC on the relationships between ATT, SN, PBC, PN, and recycling intention, the fit indices of the structural model were examined (Figure 6). The model fit indices are χ2 (CMIN) = 997.207 (df = 392), relative χ2 (CMIN/df) = 2.544, GFI = 0.860, AGFI = 0.834, CFI = 0.899, IFI = 0.900, TLI = 0.888, RMSEA = 0.063, and RMR = 0.057. By convention relative χ2 must be <5, while AGFI, GFI, CFI, NFI, IFI, TLI must be >0.9, RMR and RMSEA should be <0.08 [73,74]. According to Hair, et al., [75] model is said to be fit, when it meets any three or four of the fit indices. Thus, based on this reason, the model in this study fits the data.
The test for moderating effect was then carried out through Multi-Group Analysis. According to Bahaman Abu Samah, [70] if a moderator is hypothesized to moderate the relationship between several predictors on a criterion variable, the test for moderation will consist of two major stages: establishing the presence of a moderating effect in the general model, and determining the effect of the moderator on the individual path.

4.6. Testing the Presence of Moderating Effects of Perceived Lack of Facilitating Conditions on the Overall Model

In order to establish the presence of moderating effect on the overall structural model, two models need to be compared: Unconstrained and Measurement Residuals models. The presence of moderating effect in the overall model is established when the unconstrained model has better Goodness-of-Fit indices than the Measurement Residuals model [70]. This can be determined by comparing the chi-square values of the two models. If the chi-square of the unconstrained model is smaller than the chi-square of the measurement residual, then unconstrained is said to be a better model by having smaller chi-square, thus it can be concluded that there is presence of moderation in the model. For this study, the models comparison is as follows:
  • Unconstrained model: χ2 (CMIN) = 1230.952, df = 788, p = 0.000
  • Measurement residuals model: χ2 = 1273.453, df = 816, p = 0.000
  • ∴ Δχ2 (CMIN) = (1273.453–1230.952); Δdf = (816–788); p = 0.000
  • ∴ Δχ2 (CMIN) = 42.501; Δdf = 28; p = 0.000
Based on the result above, the measurement residual chi-square is greater than the unconstrained chi-square. Thus, there is moderating effect of perceived lack of facilitating conditions on the model.

4.7. Testing the Moderating Effects of Perceived Lack of Facilitating Conditions on the Individual Paths

Furthermore, the moderation effect on the individual path can be determined using different decision criteria. This study employed the criteria proposed by Hair et al., [75], which is based on the value of the standardized path coefficient (Beta). According to Hair, the relationship between independent and dependent variables is moderated by the moderator if:
  • Beta (β) for Group 1 is significant while that of Group 2 is not significant, or
  • Beta (β) for both groups (1 and 2) are significant. Nevertheless, one is positive and the other is negative.
Going by the criteria proposed by Hair et al., [75], the result in Table 8 below reveals that the two paths: attitude—recycling intention and personal norms—recycling intention were moderated by the PLFC. However, the other two paths subjective norms—recycling intention, and perceived behavioral control—recycling intention were not moderated by the PLFC.
The result in Table 8 above shows that the relationship between attitude and intention to recycle household waste is moderated by perceived lack of facilitating conditions (lack of recycling facilities (β = 0.078, p = 0.446) and lack of local collection (β = 0.210, p = 0.002)). Also, the relationship between personal norms and intention to recycle is moderated by perceived lack of facilitating conditions (lack of recycling facilities (β = 0.142, p = 0.162) and lack of local collection (β = 0.225, p = 0.000)). However, the relationships between subjective norms and intention to recycle is not moderated by perceived lack of facilitating conditions (lack of recycling facilities (β = 0.449, p = 0.000) and lack of local collection (β = 0.272, p = 0.000), and the relationship between perceived behavioral control and intention to recycle is not moderated by perceived lack of facilitating conditions (lack of recycling facilities (β = − 0.024, p = 0.820) and lack of local collection (β = 0.061, p = 0.379)). This result is consistent with that of Martin et al., [53] which revealed that individual’s perception of lack of recycling facilities may likely affect their intention to participate in recycling scheme. Also, a study by Miafodzyeva and Brandt [43] revealed that access to curbside collection positively influences residents’ waste recycling intention. Other studies also reported that access to curbside station influence recycling behavior and increase recycling of all type of materials [41,54,55]. Thus, households with better access to local collection tend to recycle more, also, a good location of recycling collection stations not far from the households may influence recycling behavior [76].

5. Discussion and Policy Implication

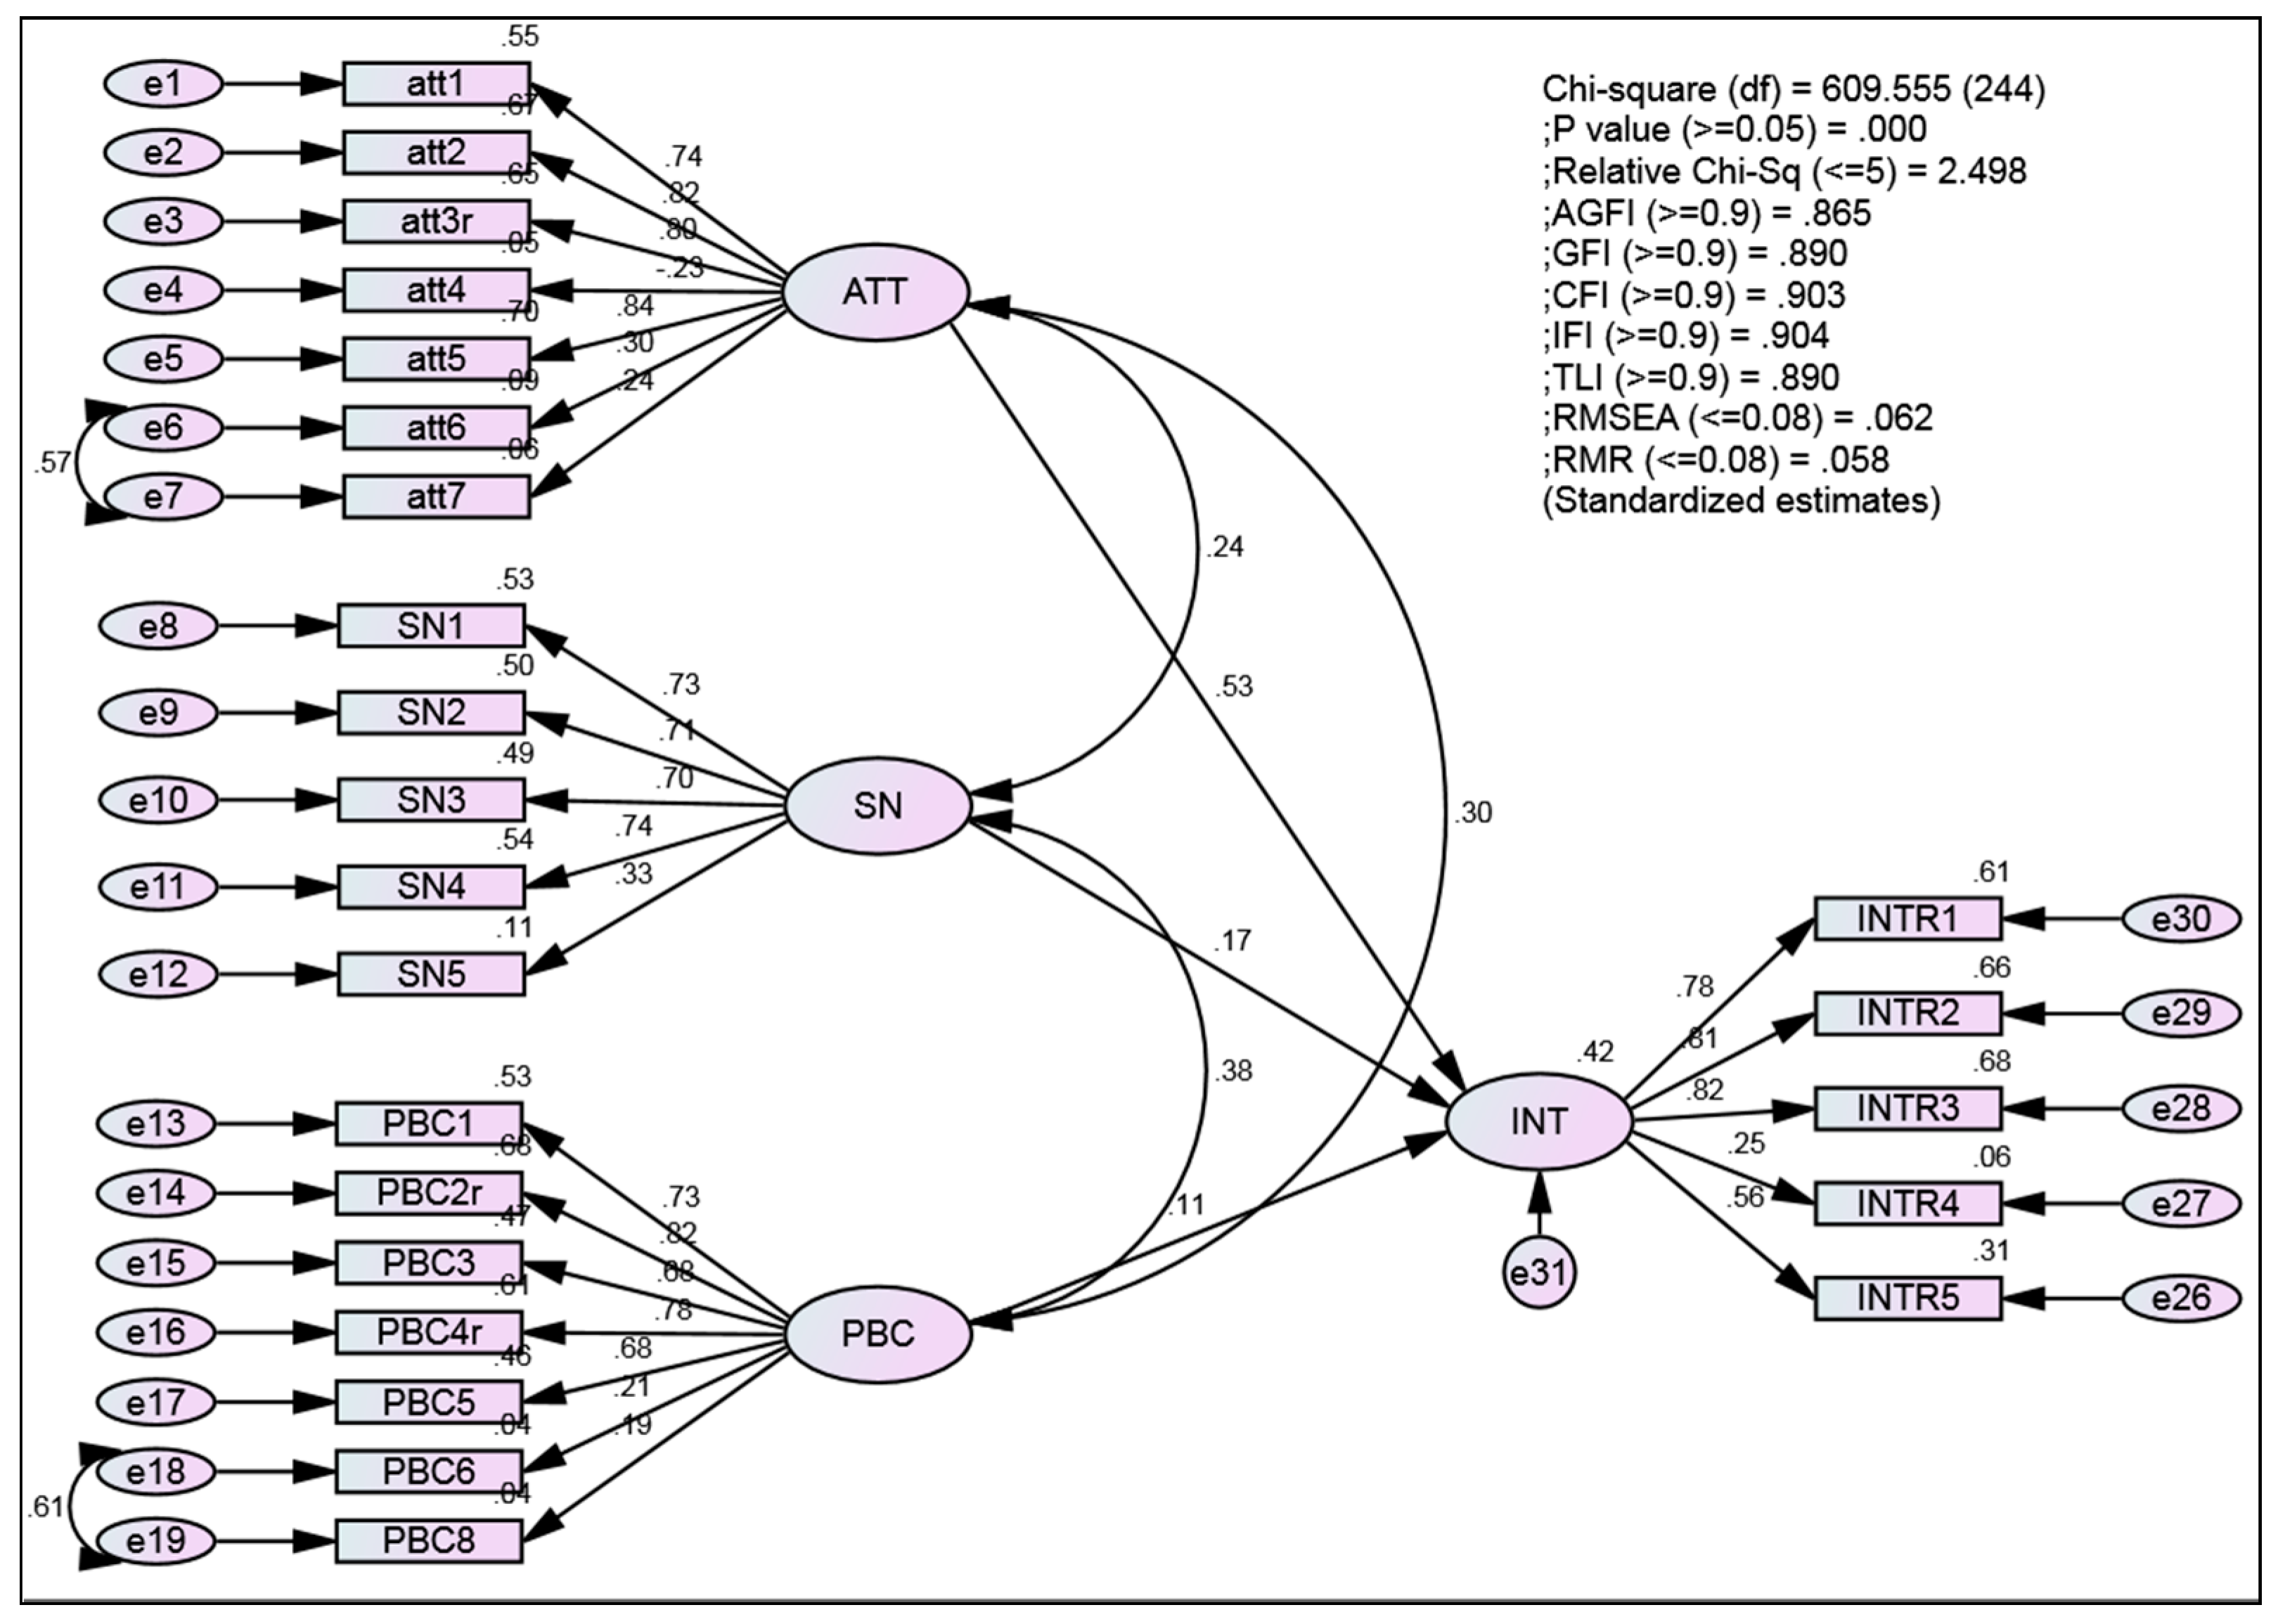
The theory of planned behavior (TPB) laid the theoretical foundation of this study. Model 1 explains 42% variance in recycling intention. According to Armitage and Conner [35], TPB components averagely account for 39% of the variance in intentions. However, Perugini and Bagozzi [77] reported that 32% variance can be considered adequate. Based on this, we conclude that our model reveals a satisfactory result. Our model can be compared with those of previous studies conducted in the U.S.A. [78], U.K. [23], Hong Kong [79], Iran [3], Cuba [80], and Malaysia [26] indicating robustness of TPB in predicting household recycling behavior despite the differences in availability of facilities between developed and developing countries.
The result of model 1, which includes the TPB constructs (ATT, SN, and PBC), reveals that, although all the TPB components significantly predict households’ recycling intention, attitude appeared as the most important predictor of recycling intention. This means that households’ intention to recycle is influenced primarily by their attitude toward recycling, and to some extent by the pressure and expectation of people around them, and their perceived control over recycling. Consistent with our findings, Tonglet, et al., [39] reported that attitude was the most important predictor of recycling intention, while perceived behavioural control was not a significant predictor of recycling intention among households in UK. The authors reported availability of recycling facilities, high level of experience and knowledge among their respondents as the main determinants of RI. Therefore, they proposed that for households who had low recycling abilities, PBC would be a significant predictor of their RI. Contrarily, in spite of the fact that attitude is the most significant predictor of recycling intention in our study, in Kano metropolis, recycling facilities are not readily available and majority of the recyclers are doing so for financial benefit rather than environmental concern. This corroborated the findings of Knussen et al., [33], who asserted that in an area with relatively poor recycling facilities, both attitude and PBC tend to be significant predictors of recycling intention. However, a study by Karim Ghani et al., [81], which investigated intention to separate food waste at source among households living in an area with poor facilities revealed that attitude was the only predictor of intention, while other variables such as SN, PBC, and situational factors were not significant predictors of intention. In contrast, Ramayah, et al., [26] reported that attitude and subjective norm were significant predictors of recycling behaviour, while PBC was insignificant predictor in an area with poor waste management facilities in Malaysia. Therefore, it can be concluded that there is no general consensus about which of the TPB construct is the major predictor of waste recycling intention. The findings differ from one area to another and from one study to another.
Although the TPB model has been widely applied in investigating various pro-environmental behaviour and was found valid in most of the studies [22,24,36], inconsistent results were reported regarding which of the TPB variable is the major predictor of recycling intention. The major reasons for the inconsistencies were due to the differences in the availability and conditions of recycling facilities as reported by Karim Ghani et al., [81], Knussen et al., [33], and Ramayah, et al., [26], especially between developed and developing countries. However, this does not affect the validity and reliability of the recycling intention model. Therefore, policy approach should be country specific with due consideration to the availability and accessibility of facilities from one country to another and even across locations within a country.
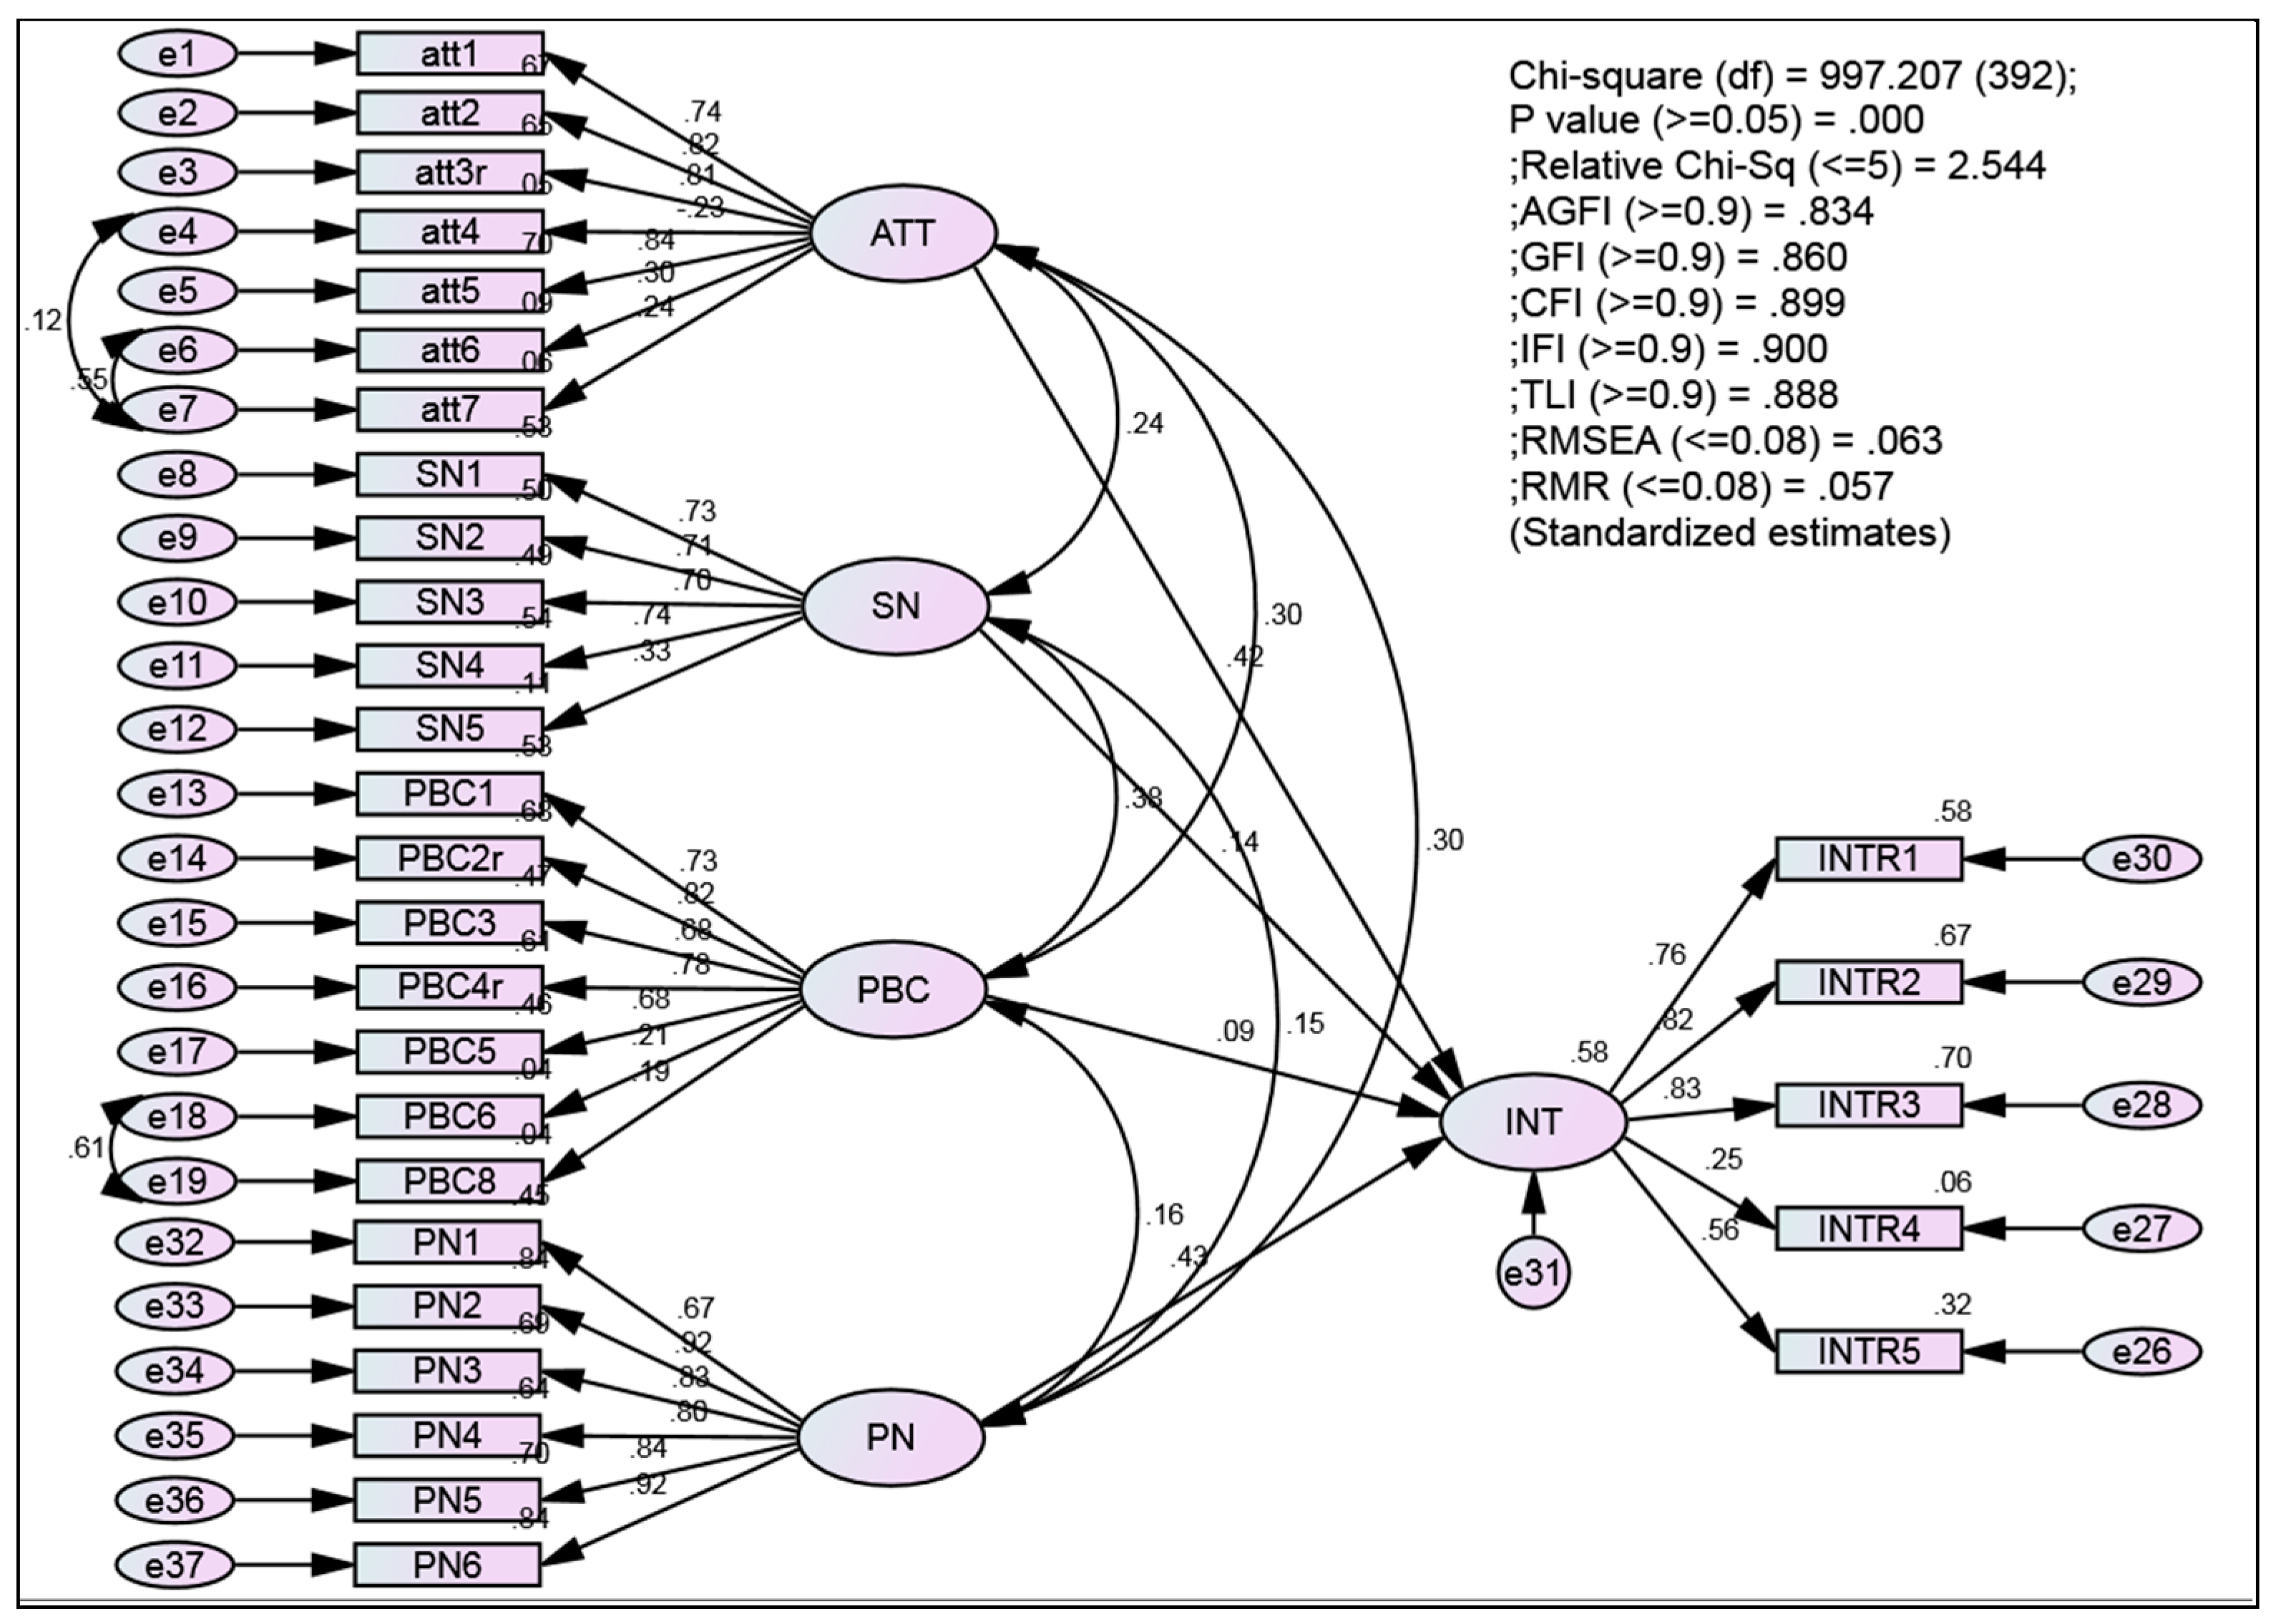
As for the model 2, our findings corroborated other studies who reported that incorporating additional variables into the TPB framework improves its predictive power for explaining households’ recycling intention (e.g., [82]). Attitude, SN, and PNs made significant contributions to the variance of recycling intention, but PBC did not. The Model explains 58% of the variance in households’ recycling intention. Consistent with the findings of Miafodzyeva and Brandt, [43] and Pakpour et al., [3] our findings reveal that PNs have the higher regression coefficient than the TPB components, thus it is the strongest predictor of recycling intention. This has supported the assertion by previous studies that incorporating PNs in the original TPB framework increases the predictive ability of the model [3,22,43,46,47,82].
Additionally, the inclusion of PNs into the TPB model has taken over the predictive power of the PBC, and also become the most important predictor of recycling intention more than attitude. This finding is consistent with the study of Wan et al., [83]. This implies that although majority of the respondents engage in informal recycling activities in order to get some financial benefit, they still believed that not recycling is against their norms and recycling is a socially desirable practice. The result also posits that if an individual has a more positive attitude, subjective norms, and hold personal norms towards recycling, he/she may likely have the intention to recycle household waste. On the other hand, people’s perceived control over recycling may not increase their intention to recycle waste if facilities and local collections are not provided.
The failure of the perceived behavioral control to make a significant contribution to recycling intention was not unexpected because, it has been reported in previous studies as a weak contributor to intentions among the TPB components [24,36,83]. When the perceived control is low, the intention to participate in a pro-environmental behavior tends to be low [84]. For this study, a possible explanation is that a recycling program was not formerly established in Kano metropolis, and facilities for recycling were not readily available in the study area. This can affect the households’ perceived control, which may consequently lower their intention to participate. Poor waste management, particularly recycling facilities, could result in low participation rates of households in waste separation and recycling. In order to improve households’ perceived behavioral control, policies which promote individuals’ ability to recycle would be important in influencing households recycling intention. Such strategies will be particularly important in Kano metropolis where households’ intention to recycle is affected by lack of recycling facilities.
Additionally, the test for moderating effect shows that two of the four paths (attitude—intention, and personal norms—intention) were moderated by perceived lack of facilitating conditions (lack of facilities and local collections). However, the relationships between subjective norms—recycling intention, and perceived behavioral control-recycling intention were not affected by the lack of recycling facilities and local collection. A possible explanation is that households that have more subjective norms and behavioral control over recycling will still have the intention to recycle, even if they perceived a lack of facilitating conditions. On the other hand, when an individual perceives a lack of recycling facilities and local collections, the positive correlations between their attitude—recycling intention, and personal norms—recycling intention will diminish. That is to say, positive attitude and PNs failed to influence recycling intention when local collections and recycling facilities were perceived to be lacking. This result is consistent with that of [33] who reported that people may not recycle if there are no recycling facilities that would ease their participation, even if they feel recycling is a good thing to do. Also, some of the respondents reported that they fail to recycle because the facilities and local collections are not readily available.
Based on the findings of this research, there are several policy implications regarding the development and implementation of recycling schemes in Kano metropolis Nigeria. First, the findings show that household intention to recycle is influenced by positive attitude, subjective norms, and personal norms. Therefore, the Nigerian government should come up with a recycling awareness campaign to enlighten people about the benefit of recycling to oneself and to the environment. This will help to strengthen people that already have a positive attitude as well as change others with a less positive attitude toward recycling. Some of the issues that should be highlighted in the recycling campaign should include the health and environmental consequences of a poor attitude of households towards waste handling. Also, emphasis should be given to personal gain; especially the financial benefit associated with participating in recycling through selling recyclables items. On the other hand, the government should enlighten and convince people that the benefit of recycling is not only to the environment and themselves, but also it is an altruistic behavior done to benefit others. Therefore, the government should come up with policies that will strengthen households’ intrinsic and moral motivation for recycling. This will enhance household personal norms and positive attitude towards recycling, and ultimately will influence their intention to recycle.
Additionally, the Nigerian government should design a recycling program and include the concept of environmental protection and recycling in primary and secondary school curricula. By doing so, the younger generation will be used as the agent of change at home, community level, and society at large. This strategy will improve personal norms among residents in Nigeria. Also, households should be educated on what, how, why and where to recycle their waste. Only then can the recycling policies and programs be successful.

6. Conclusions

Based on the findings of this study, the theory of planned behavior predicts households recycling intention in Kano metropolis, Nigeria. However, the extended TPB model provides a better explanation of households recycling intention. Overall, consistent with Stoeva and Alriksson, [82] the result of the present study shows that the provision of recycling facilities and local collections is of paramount importance to the success of recycling program in the study area. This is evident as perceived lack of facilitating conditions appeared to have a significant effect on households’ intention to recycle. Therefore, the Nigerian government should ensure adequate provision of recycling facilities and collection stations in every part of the city; this will enhance recycling intention among households in Nigeria.
The findings of this study reveal that the extended TPB framework is a better model for investigating household recycling intention. However, the present study investigates household intention, not behavior. Thus, future studies should investigate the actual household recycling behavior as a follow-up to this study. Additionally, the findings of this research are limited to Kano metropolis where the sample was drawn. This will limit its generalizability to other countries. Furthermore, the present study added only personal norms in the TPB component, however, there are other variables reported as significant predictors of recycling intention, these include; awareness of consequences, habits, ascription of responsibility, and convenience [76,85,86]. Future studies should incorporate some of these variables into the TPB framework to determine their contribution in predicting household recycling intention in Nigeria. Moreover, recycling intention in other sources of MSW should be investigated in the future studies, such as commercial, industrial, and offices wastes recycling intention and behavior. By doing this, the recycling intention among different sectors would be understood, and proper policies would be formulated and implemented.

Acknowledgments

The authors acknowledge Ahmad Said Abubakar, Bashir Mukhtar, Ibrahim Kabir Abdullahi, Nasar Mansir and Salisu Nasir for their assistance with this study. Additionally, the authors thank the three anonymous reviewers for their useful comments.

Author Contributions

Latifah Abd Manaf contributed to designing and analyzing the instruments used for data collection; Aliyu Baba Nabegu contributed in collecting the data. Muhammad Salisu Khalil and Sabrina Ho Abdullah contributed in Data analysis and presentation of the paper. Amir Hamzah Sharaai contributed to the critical revision of the paper.

Conflicts of Interest

The authors declare no conflicts of interest.

References

  1. Mahar, A.; Malik, R.N.; Qadir, A.; Ahmed, T.; Khan, Z.; Khan, M.A. Review and Analysis of Current Solid Waste Management Situation in Urban Areas of Pakistan. In Proceedings of the International Conference on Sustainable Solid Waste Management, Chennai, India, 5–7 September 2007; pp. 34–41. [Google Scholar]
  2. Mbande, C. Appropriate Approach in Measuring Waste Generation, Composition and Density in Developing Areas. J. S. Afr. Inst. Civ. Eng. 2003, 45, 2–10. [Google Scholar]
  3. Pakpour, A.H.; Zeidi, I.M.; Emamjomeh, M.M.; Asefzadeh, S.; Pearson, H. Household Waste Behaviours among a Community Sample in Iran: An Application of the Theory of Planned Behaviour. Waste Manag. 2014, 34, 980–986. [Google Scholar] [CrossRef] [PubMed]
  4. Wang, Z.; Guo, D.; Wang, X. Determinants of Residents’ E-Waste Recycling Behaviour Intentions: Evidence from China. J. Clean. Prod. 2016, 137, 850–860. [Google Scholar] [CrossRef]
  5. Kadafa, A.A.; Manaf, L.A.; Nur, W.; Sulaiman, A. Applications of System Analysis Techniques in Solid Waste Management Assessment. Pol. J. Environ. Stud. 2014, 23, 1061–1070. [Google Scholar]
  6. Abd’Razack, N.T.A.A.; Medayese, S.O.; Shaibu, S.I.; Adeleye, B.M. Habits and Benefits of Recycling Solid Waste among Households in Kaduna, North West Nigeria. Sustain. Cities Soc. 2017, 28, 297–306. [Google Scholar] [CrossRef]
  7. Adefemi, S.O.; Awokunmi, E.E. The Impact of Municipal Solid Waste Disposal in Ado-Ekiti Metropolis, Ekiti-State, Nigeria. Sci. Technol. 2009, 3, 186–189. [Google Scholar]
  8. Gundupalli, S.P.; Hait, S.; Thakur, A. A Review on Automated Sorting of Source-Separated Municipal Solid Waste for Recycling. Waste Manag. 2017, 60, 56–74. [Google Scholar] [CrossRef] [PubMed]
  9. Rudnik, E. Compostable Polymer Materials (Google eBook), 1st ed.; Elsevier: Amsterdam, The Netherlands, 2010. [Google Scholar]
  10. US Environmental Protection Agency. Exposure Factors Handbook: 2011 Edition; US Environmental Protection Agency: Washington, DC, USA, 2011.
  11. Priestley, S. Household recycling in the UK. In Briefing Paper; House of Commons: London, UK, 2016. [Google Scholar]
  12. World Bank. World Development Indicators, 1st ed.; Green Press: Washington, DC, USA, 2011. [Google Scholar]
  13. Graham-Rowe, E.; Jessop, D.C.; Sparks, P. Predicting Household Food Waste Reduction Using an Extended Theory of Planned Behaviour. Resour. Conserv. Recycl. 2015, 101, 194–202. [Google Scholar] [CrossRef]
  14. Bamberg, S.; Ajzen, I.; Schmidt, P. Choice of Travel Mode in the Theory of Planned Behavior: The Roles of Past Behavior, Habit, and Reasoned Action. Basic Appl. Soc. Psych. 2003, 25, 175–187. [Google Scholar] [CrossRef]
  15. Jackson, T. Motivating Sustainable Consumption: A Review of Evidence on Consumer Behaviour and Behavioural Change; Centre for Environmental Strategy: Guildford, UK, 2005. [Google Scholar]
  16. Nabegu, A.B.; Mustapha, A. Institutional Constraints to Municipal Solid Waste Management in Kano Metropolis, Nigeria. Int. J. Innov. Environ. Stud. Res. 2015, 3, 13–21. [Google Scholar]
  17. Ogu, V.I. Stakeholders’ Partnership Approach to Infrastructure Provision and Management in Developing World Cities: Lessons from the Sustainable Ibadan Project. Habitat Int. 2000, 24, 517–533. [Google Scholar]
  18. Batagarawa, R.L. Sustainability Appraisal of Waste Management in Nigeria: Development and Evaluation of an Index Based Tool. Ph.D. Thesis, University of Portmouth, Portsmouth, UK, 2011. [Google Scholar]
  19. Nzeadibe, T.C.; Ajaero, C.K. Development Impact of Advocacy Initiatives in Solid Waste Management in Nigeria. Environ. Dev. Sustain. 2011, 13, 163–177. [Google Scholar] [CrossRef]
  20. Anake, W.U.; Adie, G.U.; Osibanjo, O. Heavy Metals Pollution At Municipal Solid Waste Dumpsites in Kano and Kaduna States in Nigeria. Bull. Chem. Soc. Ethiop. 2009, 23, 281–289. [Google Scholar] [CrossRef]
  21. Beck, L.; Ajzen, I. Predicting Dishonest Actions Using the Theory of Planned Behavior. J. Res. Pers. 1991, 25, 285–301. [Google Scholar] [CrossRef]
  22. Chan, L.; Bishop, B. A Moral Basis for Recycling: Extending the Theory of Planned Behaviour. J. Environ. Psychol. 2013, 36, 96–102. [Google Scholar] [CrossRef]
  23. Davis, G.; Morgan, A. Using the Theory of Planned Behaviour to Determine Recycling and Waste Minimisation Behaviours: A Case Study of Bristol City, UK. Aust. Community Psychol. 2008, 20, 105–117. [Google Scholar]
  24. Chen, M.-F.; Tung, P.-J. The Moderating Effect of Perceived Lack of Facilities on Consumers’ Recycling Intentions. Environ. Behav. 2010, 42, 824–844. [Google Scholar] [CrossRef]
  25. Nigbur, D.; Lyons, E.; Uzzell, D. Attitudes, Norms, Identity and Environmental Behaviour: Using an Expanded Theory of Planned Behaviour to Predict Participation in a Kerbside Recycling Programme. Br. J. Soc. Psychol. 2010, 49, 259–284. [Google Scholar] [CrossRef] [PubMed]
  26. Ramayah, T.; Lee, J.W.C.; Lim, S. Sustaining the Environment through Recycling: An Empirical Study. J. Environ. Manage. 2012, 102, 141–147. [Google Scholar] [CrossRef] [PubMed]
  27. Fishbein, I.; Ajzen, M. Belief, Attitude, Intention and Behavior; Addison-Wesley: Reading, MA, USA, 1975. [Google Scholar]
  28. Han, Y.; Hansen, H. Determinants of Sustainable Food Consumption: A Meta-Analysis Using a Traditional and a Structura Equation Modelling Approach. Int. J. Psychol. Stud. 2012, 4, 22–46. [Google Scholar] [CrossRef]
  29. Kumar, B.A. Theory of Planned Behaviour Approach to Understand the Purchasing Behaviour for Environmentally Sustainable Products. IIMA India Res. Publ. 2012, 12, 1–43. [Google Scholar]
  30. Trumbo, W.; Garrett, J.; O’Keefe, C. Intention to Conserve Water: Environmental Values, Planned Behavior, and Information Effects. A Comparison of Three Communities Sharing a Watershed. Soc. Nat. Resour. 2001, 14, 889–899. [Google Scholar]
  31. Kaiser, F.G.; Wölfing, S.; Fuhrer, U. Environmental Attitude and Ecological Behaviour. J. Environ. Psychol. 1999, 19, 1–19. [Google Scholar] [CrossRef]
  32. Sparks, P.; Hinds, J.; Curnock, S.; Pavey, L. Connectedness and Its Consequences: A Study of Relationships with the Natural Environment. J. Appl. Soc. Psychol. 2014, 44, 166–174. [Google Scholar] [CrossRef]
  33. Knussen, C.; Yule, F.; MacKenzie, J.; Wells, M. An Analysis of Intentions to Recycle Household Waste: The Roles of Past Behaviour, Perceived Habit, and Perceived Lack of Facilities. J. Environ. Psychol. 2004, 24, 237–246. [Google Scholar] [CrossRef]
  34. Boldero, J. The Prediction of Household Recycling of Newspapers: The Role of Attitudes, Intentions, and Situational Factors. J. Appl. Soc. Psychol. 1995, 25, 440–462. [Google Scholar] [CrossRef]
  35. Armitage, C.J.; Conner, M. Efficacy of the Theory of Planned Behaviour: A Meta-Analytic Review. Br. J. Soc. Psychol. 2001, 40, 471–499. [Google Scholar] [CrossRef] [PubMed]
  36. Davies, J.; Foxall, G.R.; Pallister, J. Beyond the Intention–Behaviour Mythology. Mark. Theory 2002, 2, 29–113. [Google Scholar] [CrossRef]
  37. Ajzen, I. The Theory of Planned Behavior. Orgnizational Behav. Hum. Decis. Process. 1991, 50, 179–211. [Google Scholar] [CrossRef]
  38. Klöckner, C.A.; Blöbaum, A. A Comprehensive Action Determination Model: Toward a Broader Understanding of Ecological Behaviour Using the Example of Travel Mode Choice. J. Environ. Psychol. 2010, 30, 574–586. [Google Scholar] [CrossRef] [Green Version]
  39. Tonglet, M.; Phillips, P.S.; Read, A.D. Using the Theory of Planned Behaviour to Investigate the Determinants of Recycling Behaviour: A Case Study from Brixworth, UK. Resour. Conserv. Recycl. 2004, 41, 191–214. [Google Scholar] [CrossRef]
  40. Berglund, C. The Assessment of Households’ Recycling Costs: The Role of Personal Motives. Ecol. Econ. 2006, 56, 560–569. [Google Scholar] [CrossRef]
  41. Hage, O. Norms and Economic Motivation in Household Recycling: Evidence from Sweden. Resour. Conserv. Recycl. 2008, 53, 155–165. [Google Scholar] [CrossRef]
  42. De Feo, G.; De Gisi, S. Public Opinion and Awareness towards MSW and Separate Collection Programmes: A Sociological Procedure for Selecting Areas and Citizens with a Low Level of Knowledge. Waste Manag. 2010, 30, 958–976. [Google Scholar] [CrossRef] [PubMed]
  43. Miafodzyeva, S.; Brandt, N. Recycling Behaviour among Householders: Synthesizing Determinants via a Meta-Analysis. Waste Biomass Valoriz. 2013, 4, 221–235. [Google Scholar] [CrossRef]
  44. Parker, D.; Manstead, A.S.R.; Stradling, S.G.; Reason, J.T.; Baxter, J.S. Intention to Commit Driving Violations: An Application of the Theory of Planned Behavior. J. Saf. Res. 1994, 25, 63. [Google Scholar] [CrossRef]
  45. Tonglet, M. Consumer Misbehavior: An Exploratory Study of Shoplifting. J. Consum. Behav. 2002, 1, 336–354. [Google Scholar] [CrossRef]
  46. Bamberg, S.; Moser, G. Twenty Years after Hines, Hungerford, and Tomera: A New Meta-Analysis of Psycho-Social Determinants of pro-Environmental Behaviour. J. Environ. Psychol. 2007, 27, 14–25. [Google Scholar] [CrossRef]
  47. Onwezen, M.C.; Antonides, G.; Bartels, J. The Norm Activation Model: An Exploration of the Functions of Anticipated Pride and Guilt in pro-Environmental Behaviour. J. Econ. Psychol. 2013, 39, 141–153. [Google Scholar] [CrossRef]
  48. Botetzagias, I.; Dima, A.F.; Malesios, C. Extending the Theory of Planned Behavior in the Context of Recycling: The Role of Moral Norms and of Demographic Predictors. Resour. Conserv. Recycl. 2015, 95, 58–67. [Google Scholar] [CrossRef]
  49. Barr, S.; Gilg, A. Sustainable Lifestyles: Framing Environmental Action in and around the Home. Geoforum 2006, 37, 906–920. [Google Scholar] [CrossRef]
  50. Timlett, R.E.; Williams, I.D. Public Participation and Recycling Performance in England: A Comparison of Tools for Behaviour Change. Resour. Conserv. Recycl. 2008, 52, 622–634. [Google Scholar] [CrossRef]
  51. Price, J.L. The Landfill Directive and the Challenge Ahead: Demands and Pressures on the UK Householder. Resour. Conserv. Recycl. 2001, 32, 333–348. [Google Scholar] [CrossRef]
  52. Tucker, P.; Speirs, D. Model Forecasts of Recycling Participation Rates and Material Capture Rates for Possible Future Recycling Scenarios; University of Paisley Environmental Technology Group: Paisley, UK, 2002; Volume 44, pp. 1–38. [Google Scholar]
  53. Martin, M.; Williams, I.D.; Clark, M. Social, Cultural and Structural Influences on Household Waste Recycling: A Case Study. Resour. Conserv. Recycl. 2006, 48, 357–395. [Google Scholar] [CrossRef]
  54. Jenkins, R.R.; Martinez, S.A.; Palmer, K.; Podolsky, M.J. The Determinants of Household Recycling: A Material-Specific Analysis of Recycling Program Features and Unit Pricing. J. Environ. Econ. Manag. 2003, 45, 294–318. [Google Scholar] [CrossRef]
  55. Woodard, R.; Bench, M.; Harder, M.K. The Development of a UK Kerbside Scheme Using Known Practice. J. Environ. Manag. 2005, 75, 115–127. [Google Scholar] [CrossRef] [PubMed] [Green Version]
  56. Ogwueleka, T.C. Municipal Solid Waste Characteristics and Management in Nigeria. Iran. J. Environ. Health Sci. Eng. 2009, 6, 173–180. [Google Scholar]
  57. Khalil, M.S.; Sabiu, N.; Muhammed, S.N. A Brief Look at Geography Education in Nigeria: A Case Study of Kano State. Dutse J. Pure Appl. Sci. 2015, 1, 11–18. [Google Scholar]
  58. Incekara, S.; Khalil, M.S. Student Perceptions of Geography as a Discipline: A Comparative Study Case Studies from Turkey and Nigeria, 1st ed.; Lap Lambert: Saarbrücken, Germany, 2014. [Google Scholar]
  59. Nabegu, A.B. An Analysis of Municipal Solid Waste in Kano Metropolis, Nigeria. J. Hum. Ecol. 2010, 31, 111–119. [Google Scholar]
  60. National Population Commission. National Policy on Population for Sustainable Development; National Population Commission: Abuja, Nigeria, 2012. [Google Scholar]
  61. Ali, A.F.; Tanko, A.I.; Kovo, A.S. Solid Waste Management Practice in a Less Developed Urban Setting: A Case Study. J. Environ. Stud. 2017, 3, 1–4. [Google Scholar] [CrossRef]
  62. McMillan, J.H. Educational Research: Fundamentals for the Consumer, 6th ed.; Pearson Education: London, UK, 2008. [Google Scholar]
  63. Ary, D.; Jacobs, L.C.; Sorensen, C.K.; Walker, D.A. Introduction to Research in Education; Cengage Learning: Boston, MA, USA, 2013. [Google Scholar]
  64. Cohen, J. Statistical Power Analysis. Curr. Dir. Psychol. Sci. 1992, 1, 98–101. [Google Scholar] [CrossRef]
  65. Israel, G.D. Determining Sample Size, PEOD6; Agricultural Education and Communication Department, Florida Cooperative Extension Service, Institute of Food and Agricultural Sciences, University of Florida: Gainesville, FL, USA, 1992. [Google Scholar]
  66. Howell, D.C. Statistics for the Behavioral Sciences, 7th ed.; Cengage Learning: Boston, MA, USA; Belmont: Nashville, TN, USA, 2011. [Google Scholar]
  67. Lei, P.-W.; Wu, Q. Introduction to Structural Equation Modeling: Issues and Practical Considerations. Educ. Meas. Issues Pract. 2007, 26, 33–43. [Google Scholar] [CrossRef]
  68. Hayes, A.F.; Preacher, K.J. Quantifying and Testing Indirect Effects in Simple Mediation Models When the Constituent Paths Are Nonlinear. Multivar. Behav. Res. 2010, 45, 627–660. [Google Scholar] [CrossRef] [PubMed]
  69. Hayes, A.F.; Scharkow, M. The Relative Trustworthiness of Inferential Tests of the Indirect Effect in Statistical Mediation Analysis: Does Method Really Matter? Psychol. Sci. 2013, 24, 1918–1927. [Google Scholar] [CrossRef] [PubMed]
  70. Samah, B.A. Enhancing Extention Education Research Using Structural Equation Modelling, 1st ed.; University Putra Malaysia Press: Serdang, Malaysia, 2016. [Google Scholar]
  71. Hu, L.; Bentler, P.M. Cutoff Criteria for Fit Indexes in Covariance Structure Analysis: Conventional Criteria versus New Alternatives Cutoff Criteria for Fit Indexes in Covariance Structure Analysis: Conventional Criteria Versus New Alternatives. Struct. Equ. Model. A Multidiscip. J. 2009, 6, 1–55. [Google Scholar] [CrossRef]
  72. Botetzagias, I.; Malesios, C.; Poulou, D. Electricity Curtailment Behaviors in Greek Households: Different Behaviors, Different Predictors. Energy Policy 2014, 69, 415–424. [Google Scholar] [CrossRef]
  73. De Carvalho, J.; Chima, O.F. Applications of Structural Equation Modeling in Social Sciences Research. Am. Int. J. Contemp. Res. 2014, 4, 6–11. [Google Scholar]
  74. Maccallum, R.C.; Austin, J.T. Applications of Structural Equation. Annu. Rev. Psychol. 2000, 1, 201–226. [Google Scholar] [CrossRef] [PubMed]
  75. Hair, J.F.; Black, W.C.; Babin, B.J.; Anderson, R.E. Multivariate Data Analysis A Global Perspective, 7th ed.; Pearson Prentice Hall: Upper Saddle River, NJ, USA, 2010. [Google Scholar]
  76. Barr, S. Factors Influencing Environmental Attitudes and Behaviors. Env. Behav. 2007, 39, 435–473. [Google Scholar] [CrossRef]
  77. Perugini, M.; Bagozzi, R.P. An Alternative View of Pre-Volitional Processes in Decision Making: Conceptual Issues and Empirical Evidence. Contemp. Perspect. Psychol. Attitudes 2004, 169–201. [Google Scholar]
  78. Largo-Wight, E.; Bian, H.; Lange, L. An Empirical Test of an Expanded Version of the Theory of Planned Behavior in Predicting Recycling Behavior on Campus. Am. J. Health Educ. 2012, 43, 66–73. [Google Scholar] [CrossRef]
  79. Cheung, S.F.; Chan, D.K.-S.; Wong, Z.S.-Y. Reexamining the Theory of Planned Behavior in Understanding Wastepaper Recycling. Environ. Behav. 1999, 31, 587–612. [Google Scholar] [CrossRef]
  80. Mosler, H.J.; Martens, T. Designing Environmental Campaigns by Using Agent-Based Simulations: Strategies for Changing Environmental Attitudes. J. Environ. Manag. 2008, 88, 805–816. [Google Scholar] [CrossRef] [PubMed]
  81. Karim Ghani, W.A.W.A.; Rusli, I.F.; Biak, D.R.A.; Idris, A. An Application of the Theory of Planned Behaviour to Study the Influencing Factors of Participation in Source Separation of Food Waste. Waste Manag. 2013, 33, 1276–1281. [Google Scholar] [CrossRef] [PubMed] [Green Version]
  82. Stoeva, K.; Alriksson, S. Influence of Recycling Programmes on Waste Separation Behaviour. Waste Manag. 2017, 68, 732–741. [Google Scholar] [CrossRef] [PubMed]
  83. Wan, C.; Shen, G.Q.; Yu, A. The Role of Perceived Effectiveness of Policy Measures in Predicting Recycling Behaviour in Hong Kong. Resour. Conserv. Recycl. 2014, 83, 141–151. [Google Scholar] [CrossRef]
  84. Ajzen, I. The Theory of Planned Behaviour: Reactions and Reflections. Psychol. Health 2011, 26, 37–41. [Google Scholar] [CrossRef] [PubMed]
  85. Tudor, T.; Robinson, G.M.; Riley, M.; Guilbert, S.; Barr, S.W. Challenges Facing the Sustainable Consumption and Waste Management Agendas: Perspectives on UK Households. Local Environ. 2011, 16, 51–66. [Google Scholar] [CrossRef]
  86. Ittiravivongs, A. Recycling as Habitual Behavior: The Impact of Habit on Household Waste Recycling Behavior in Thailand. Asian Soc. Sci. 2012, 8, 74–81. [Google Scholar] [CrossRef]
Figure 1. Standard Theory of planned behavior constructs [37].
Recycling 02 00018 g001
Figure 2. The extended theory of planned behavior (TPB) framework with addition of Personal Norms and Perceived Lack of Facilitating Conditions.
Recycling 02 00018 g002
Figure 3. Showing the map of Kano metropolis and the distribution of sample [61].
Recycling 02 00018 g003
Figure 4. The measurement model of the study. Note: ATT: Attitude (seven items); SN: Subjective norms (five items); PBC: Perceived behavioral control (seven items); PNs: Personal norms (six items); FC: Facilitating conditions (two items); INT: Intention (five items).
Recycling 02 00018 g004
Figure 5. A Structural model explaining the level of prediction of recycling intention by TPB variables. Note: ATT: Attitude (seven items); SN: Subjective norms (five items); PBC: Perceived behavioral control (seven items); INT: Intention (five items).
Recycling 02 00018 g005
Figure 6. Structural model showing the level of prediction of recycling intention by TPB components and personal norms. Note: ATT: Attitude (seven items); SN: Subjective norms (five items); PBC: Perceived behavioral control (seven items); PNs: Personal norms (six items); INT: Intention (five items).
Recycling 02 00018 g006
Table 1. Demographic characteristics of the respondents.
VariableCategoryFrequencyPercentageMeanSD
GenderMale20050.91.490.501
Female19349.1
Area of ResidenceDala12229.591.450.499
Kumbotso10023.05
Nassarawa17147.34
Age (years)20–3418146.12.98730.76087
35–4910125.7
50–6410627
>6551.3
EducationPrimary348.72.730.748
Secondary7519.1
Tertiary24762.8
Religious379.4
Income (N)<N15000028873.31.34100.61093
N150001-N3000007619.3
>300001297.4
HH Size<513333.81.96180.79928
5–814236.1
>811830
Note: $1 = N360; HH = Household.
Table 2. Descriptive Statistics and the Correlation Coefficient Matrix of the variables.
ConstructATTSNPBCPNINTPLFCMeanSD
ATTPearson Correlation117.313.114
Sig. (2-tailed)
SNPearson Correlation0.166 **115.183.355
Sig. (2-tailed)0.001
PBCPearson Correlation0.211 **0.289 **121.014.387
Sig. (2-tailed)0.0000.000
PNPearson Correlation0.204 **0.170 **0.150 **121.145.068
Sig. (2-tailed)0.0000.0010.003
INTPearson Correlation0.213 **0.387 **0.165 **0.276 **120.422.778
Sig. (2-tailed)0.0000.0000.0010.000
PLFCPearson Correlation−0.127 *0.157−0.166 *−0.211 *−0.210 *115.985.335
Sig. (2-tailed)0.0150.0660.0190.9780.031
Note: * Correlation is significant at the 0.05 level (2-tailed); ** Correlation is significant at the 0.01 level (2-tailed). ATT: Attitude; SN: Subjective norms; PBC: Perceived behavioral control; PNs: Personal norms; PLFC: Facilitating conditions; INT: Intention.
Table 3. Reliability and Convergent Validity of the Measurement Model.
ConstructItemStandardized Factor LoadingComposite ReliabilityAverage Variance Extracted
AttitudeATT10.800.9350.596
ATT20.81
ATT30.76
ATT40.77
ATT50.77
ATT60.75
ATT70.76
Subjective normsSN10.620.8980.525
SN20.76
SN30.76
SN40.75
SN50.76
Perceived behavioral controlPBC10.700.9350.568
PBC20.75
PBC30.71
PBC40.78
PBC50.81
PBC60.76
PBC70.76
Personal normsPN10.840.8910.603
PN20.92
PN30.79
PN40.83
PN50.62
PN60.85
Intention to recycleITR10.650.8730.535
ITR20.75
ITR30.74
ITR40.73
ITR50.78
Table 4. Discriminant Validity Index Summary for the Construct.
ConstructPBCPNATTSNITR
PBC0.635
PN0.1620.818
ATT0.3000.3180.629
SN0.2950.0150.1690.660
ITR0.1730.5060.2870.0340.810
Note: ATT: Attitude; SN: Subjective norms; PBC: Perceived behavioral control; PNs: Personal norms; PLFC: Perceived lack of facilitating conditions; INT: Intention.
Table 5. Summary of the goodness-of-fit indices of the measurement model of this study.
CMINdFCMIN/dfPGFICFIIFINFITLIRMSEA
1050.0444462.3540000.8630.9090.9100.8530.8990.059
Table 6. Unstandardized and standardized regression weight in the hypothesized path model 1.
Hypothesized RelationshipUnstandardized Regression Weight EstimateS.Estandardized Regression Weight EstimateCRp
INT <--- ATT0.5930.0670.5348.8170.000
INT <--- SN0.1940.0640.1713.0050.003
INT <--- PBC0.1320.0640.1142.0450.041
Note: ATT: Attitude; SN: Subjective norms; PBC: Perceived behavioral control; INT: Intention.
Table 7. Unstandardized and standardized regression weight in the hypothesized path model 2.
Hypothesized RelationshipUnstandardized Regression Weight Estimate (B)S.Estandardized Regression Weight Estimate (β)CRp
INT <--- ATT0.4560.0580.4217.8170.000
INT <--- SN0.1580.0560.1432.8400.005
INT <--- PBC0.1000.0550.0891.8030.071
INT <--- PN0.4960.610.4288.1340.000
Note: ATT: Attitude; SN: Subjective norms; PBC: Perceived behavioral control; PNs: Personal norms; INT: Intention.
Table 8. Result of Moderation Test of Perceived lack of facilitating conditions on Relationship between Predictors and Intention to Recycle.
ConstructsObservations in Each GroupUnstandardized Regression Weight Estimate (B)Standardized Regression Weight Estimate (β)p
Attitude towards recycling (ATT)
Lack of recycling facilities1420.0530.0780.446
Lack of local collection2510.1700.2100.002
Subjective norms toward recycling (SN)
Lack of recycling facilities1420.3760.4490.000
Lack of local collection2510.2090.2720.000
Perceived behavioral control to recycling (PBC)
Lack of recycling facilities142−0.018-0.0240.820
Lack of local collection2510.0510.0610.379
Personal norms toward recycling
Lack of recycling facilities1420.1000.1420.162
Lack of local collection2510.1990.2250.000

