Social Acceptance for Reclaimed Water Use: A Case Study in Bengaluru


1
Centre for Ecological Economics and Natural Resources (CEENR), Institute for Social and Economic Change (ISEC), Dr. VKRV Rao Road, Nagarabhavi, Bangalore 560072, India
2
Centre for Research in Urban Affairs (CRUA), Institute for Social and Economic Change (ISEC), Dr. VKRV Rao Road, Nagarabhavi, Bangalore 560072, India
*
Author to whom correspondence should be addressed.
Recycling 2018, 3(1), 4; https://doi.org/10.3390/recycling3010004
Submission received: 9 November 2017
/
Revised: 6 January 2018
/
Accepted: 9 January 2018
/
Published: 20 January 2018
(This article belongs to the Special Issue Water Recovery Recycling and Resilience)
Abstract
:The main source of water to the peri-urban areas of Bengaluru is groundwater. Access to groundwater is through tankers, private borewells, Bruhat Bengaluru MahanagaraPalike (Urban Local Body) borewells, and public stand posts. All modes other than tankers provide water to the community free of charge. Reclaimed water from sewage treatment plants (STPs) is in use by industries and some gated communities and multistoried apartments for toilet flushing and landscaping. For individual households in peri-urban areas of Bengaluru, it could be an additional water source replacing expensive water supply through tankers; reducing demand for groundwater (a finite resource); improving the sanitation system by providing drainage systems and preventing groundwater contamination from black and grey water. Consequently, this research paper investigates the willingness of residents in peri-urban areas of Bengaluru to use reclaimed water for non-potable end uses. To investigate residents’ willingness and key motivations for the use of reclaimed water, a survey of residents in the peri-urban ward of Bellandur was conducted. In this region, the sewerage board had prepared a media advertisement to create awareness of—and to sell—reclaimed water to other users, including local residents. This advertisement was shown to respondents, asking if they were willing to accept and buy the reclaimed water at 15 Indian Rupees (INR) per kiloliter. Sixty-seven percent of residents who were household owners were willing to buy reclaimed water, 20% were concerned about hygiene, and 33% of respondents lacked trust in the public agency with respect to water quality standards. The study concludes that public awareness from key stakeholders is essential for the reuse of reclaimed water. It also recommends stringent regulation by levying fees for groundwater extraction in addition to making reclaimed water readily available and supplied free of charge to the consumers. In addition, the quality of reclaimed water should meet international standards to gain the confidence of the people.
1. Introduction
Reclaimed water is water produced in any part through the treatment of wastewater that may be used for beneficial purposes; because of such treatment, reclaimed water is considered a valuable resource, and is no longer considered wastewater. Reclaimed water use technology has improved greatly in recent decades, and studies [1] show that for water-stressed regions, reclaimed water is a dependable alternative water source. Although countries like Singapore, the USA, and Australia have demonstrated the viability of sustainable reuse practices, there remains negative perceptions with respect to the use of reclaimed water in some countries. The water authorities have also not understood its advantages and development potential to engage the community to widely implement this is many countries. However, the Bengaluru Water Supply Sewerage Board (BWSSB) has shown proactive governance, and has established reuse markets with a few industries, the International Airport, and through package treatment and recycling schemes for flushing toilets in apartments.
This socio-institutional setup is studied here, where assuming BWSSB has fully understood the benefits and hence are advertising the sale of reclaimed water with the intention to scale up the existing industrial market and tap the residential/commercial market. The unit of analysis chosen here is a peri-urban ward (a ward is an administrative unit or boundary). The peri-urban interface is characterized by strong urban influences and rapid development, with easy access to markets, services, and other inputs. Water and sanitation are complex but critical problems in these areas, due to sustained poverty, poor infrastructure, and a lack of institutional frameworks and governmental support [2]. This has resulted in more inequity, with the expansion of informal settlements lacking provision of services. As a result, the tanker business was introduced which led to change in occupational characteristics, as farmers find it lucrative to sell water from their borewells though tankers. This business has driven conflicts in Chennai, [3] and in Bangalore peri-urban areas it is termed as “mafias” [4]. Augmenting the water supply to meet the growing demand for these regions is another big challenge. Sanitation and clean drinking water are critical determinants of health, and are complementary to each other. According to the WHO/UNICEF Joint Monitoring Programme for Water Supply and Sanitation, at least 1.8 billion people world-wide are estimated to drink water that is faecally contaminated. The authors of [5] estimated that the total annual economic impact of inadequate sanitation in India amounted to a loss of INR 2.4 trillion (USD 53.8 billion) in 2006, which was equivalent to about 6.4% of India’s gross domestic product (GDP) in 2006. A study by the Ministry of Urban Development, Government of India [6] found that 23 million children below the age of 14 in urban India were at risk from poor sanitation. The same study found that 8 million children in urban areas were at risk from poor water supply. These six major challenges—water scarcity, augmenting water supply for equitable distribution, inequity, unaccounted water loss, groundwater stress, and wastewater safe disposal—can be addressed by implementing a zero discharge approach by treating and reusing the treated water. A total of 723 of India’s cities and towns with populations of 50,000 and above generate about 38,000 million liters per day of wastewater [7]. If 80% of urban wastewater could be treated by 2030, there would be a total volume of around 17 billion cubic meters (BCM) per year—an increase of around 400% in the volume of available treated wastewater. If captured, treated safely, and recycled, this 17 BCM of treated wastewater resource would be equivalent to almost 75% of the projected industrial demand in 2025 [1], and almost a quarter of the total projected drinking water requirements in the country.
Consequently, in an effort to address these interconnected problems, this study aims to assess the feasibility of supplying reclaimed water for residential use in peri-urban areas in this critical environment of decreasing freshwater availability, groundwater stress, and increasing costs for delivering acceptable quality water supply to cities for multiple uses.
Bengaluru was chosen as the best example for this situation, as this city is not abutting any major surface water source (river). It is situated approximately 400 m above sea level, and currently around 958 million liters per day (hereafter MLD) of water is pumped from the river (Cauvery and Arkavathy) sources situated about 95 km away from the city. At present, the BWSSB is withdrawing about 19 TMC of water (1470 MLD) from Cauvery river to meet the city’s demand. Approximately 790 MLD of groundwater is extracted per day from 0.3 million borewells, leading to groundwater stress (CSD 2012). With the groundwater levels already plunging close to 2000 feet, to cope with the demand in summer, the BWSSB has prepared tenders to sink 300 borewells in addition to the 8000 existing and functional borewells in the city. Leakage-loss rates of 50% are not uncommon in urban distribution systems. Some 250 to 500 million m3 of drinking water gets lost in many mega cities each year. Saving this amount could provide an additional 10 to 20 million people with drinking water in each mega city [8].
In Bengaluru, the unaccounted-for water loss is as high as 40% [9]. The reasons are physical losses like leakage in pipelines and drying up of reservoirs, while commercial losses are mainly unauthorized connections, meter tampering, and meter reader lapses. The sixth challenge which needs to be considered to close the sanitation cycle is where does the used water or the wastewater go in these peri-urban areas? Wastewater reuse, decentralized systems, and how sustainable it can be to reduce water stress has been the subject of a great deal of discussion in the peri-urban context [10,11] in the context of Bengaluru [12,13].
The State of Sanitation and Treatment Infrastructure and Its Performance
The revised Master Plan (Table 1) shows that by 2031, 378 MLD of wastewater will be left untreated due to the lack of infrastructure for sewage treatment. As of 2015, there were 17 sewage treatment plants with an installed capacity of 721 MLD against the requirement of 980 MLD as shown in Table 1. However, the existing infrastructure is underutilized, as only three-fourths of the installed capacity is being utilized to treat the waste water of the city. The effective treatment capacity is only 16%, although it is installed at a treatment capacity of 80%. This is attributed to a lack of sewerage networks to many areas and ineffective operation and maintenance of treatment facilities. The not-sewered areas’ wastewater are discharged into lakes and to agricultural fields through cesspool vehicles, creating a most unhygienic environment. To cater to the growing peri-urban areas, the BWSSB has proposed treatment facilities in addition to existing STPs; there are 11 STPs with an overall capacity of 339 MLD under construction, and another 8 STPs with an overall capacity of 550 MLD under the tendering process. To cater to demand for 2031, the BWSSB has proposed to construct another 207 MLD capacity of STPs at 16 locations. Overall, approximately1817 MLD of treated wastewater will be available.
The study region Bellandur has 14 localities, of which 11 localities fall under those non-sewered areas. There is one 50 MLD capacity STP, of which 30 MLD is inflow of wastewater for secondary treatment.
The STP was commissioned in 2002/2007. Due to the lack of a sewerage network, they were treating Bellandur lake water until 2011. Since 2011, sewerage from neighboring localities like Mahadevapura, DRDO, and Yamlur have been let into the STP, and from the past year the required organic loading (i.e., Biochemical Oxygen demand (BOD) flow is about 80/90 MLD)is received in the STP. This BOD inflow is muchless. Some septage (cesspool) vehicles discharge their sewage especially from the textile (sewing) industry.
The secondary treated effluent (reclaimed water) available is 28.5 MLD and is fit for secondary non-potable uses like car washing, street washing, and toilet flushing, which can be distributed through tankers as a cost-effective sustainable solution to prevent groundwater depletion, flooding, and maintain hygiene environs.
In Australia, 269 residents of the Mawson Lakes community were surveyed [14] regarding their attitudes to recycled water use. Key findings of this study include: The majority of respondents (94%) were satisfied with recycled water use at Mawson Lakes. Only two respondents had disconnected from the recycled water system. We found a lot of empirical work carried out over more than three decades to investigate the level of stated public acceptance for recycled water based on a set of socio-economic and demographic variables like age [15,16]; education [17,18] emphasizing health risks; [19,20] talks of perceptions of good water quality and trust in authorities associated with recycled water use. A number of other studies identified correlates of high acceptance levels [21]. Most studies investigating public acceptance of recycled water come to the same conclusion: that people are very open to using recycled water for uses with low personal contact, such as watering trees and shrubs in their garden, but are reluctant to adopt recycled water for uses with high personal contact, such as drinking or bathing one’s baby. Authors in [22] found that 92% of Australian respondents would use recycled water for garden watering, but only 36% for drinking.
Although it could be argued that recycled water has now been used for many decades, recent studies have shown that the same pattern is still valid [23,24].
The acceptance levels of water from alternative sources (i.e., desalinated water and recycled water) has also been studied by [18]. However, in this study region there are different modes of water supply from different sources (Table 2). The aim of this paper is to see the nuanced dynamics between these modes of supply and source of water, along with the socio-economic and personal characteristics of the respondents. The possible interaction effects of multiple factors have mostly been ignored to-date. This survey was not just to directly ask respondents about their willingness to use reclaimed water, but to try and understand what wide range of factors are simultaneously involved to accept this initiative by the water board. This paper is also different with respect to the study area chosen—as mentioned earlier, a peri-urban area and culturally in an Indian context, where water is used extensively for washing, reuse is emphasized for such non-potable uses which accounts for 38% of total water demand by the sample population (Table 3).
2. Materials and Methods
Description of Study Area
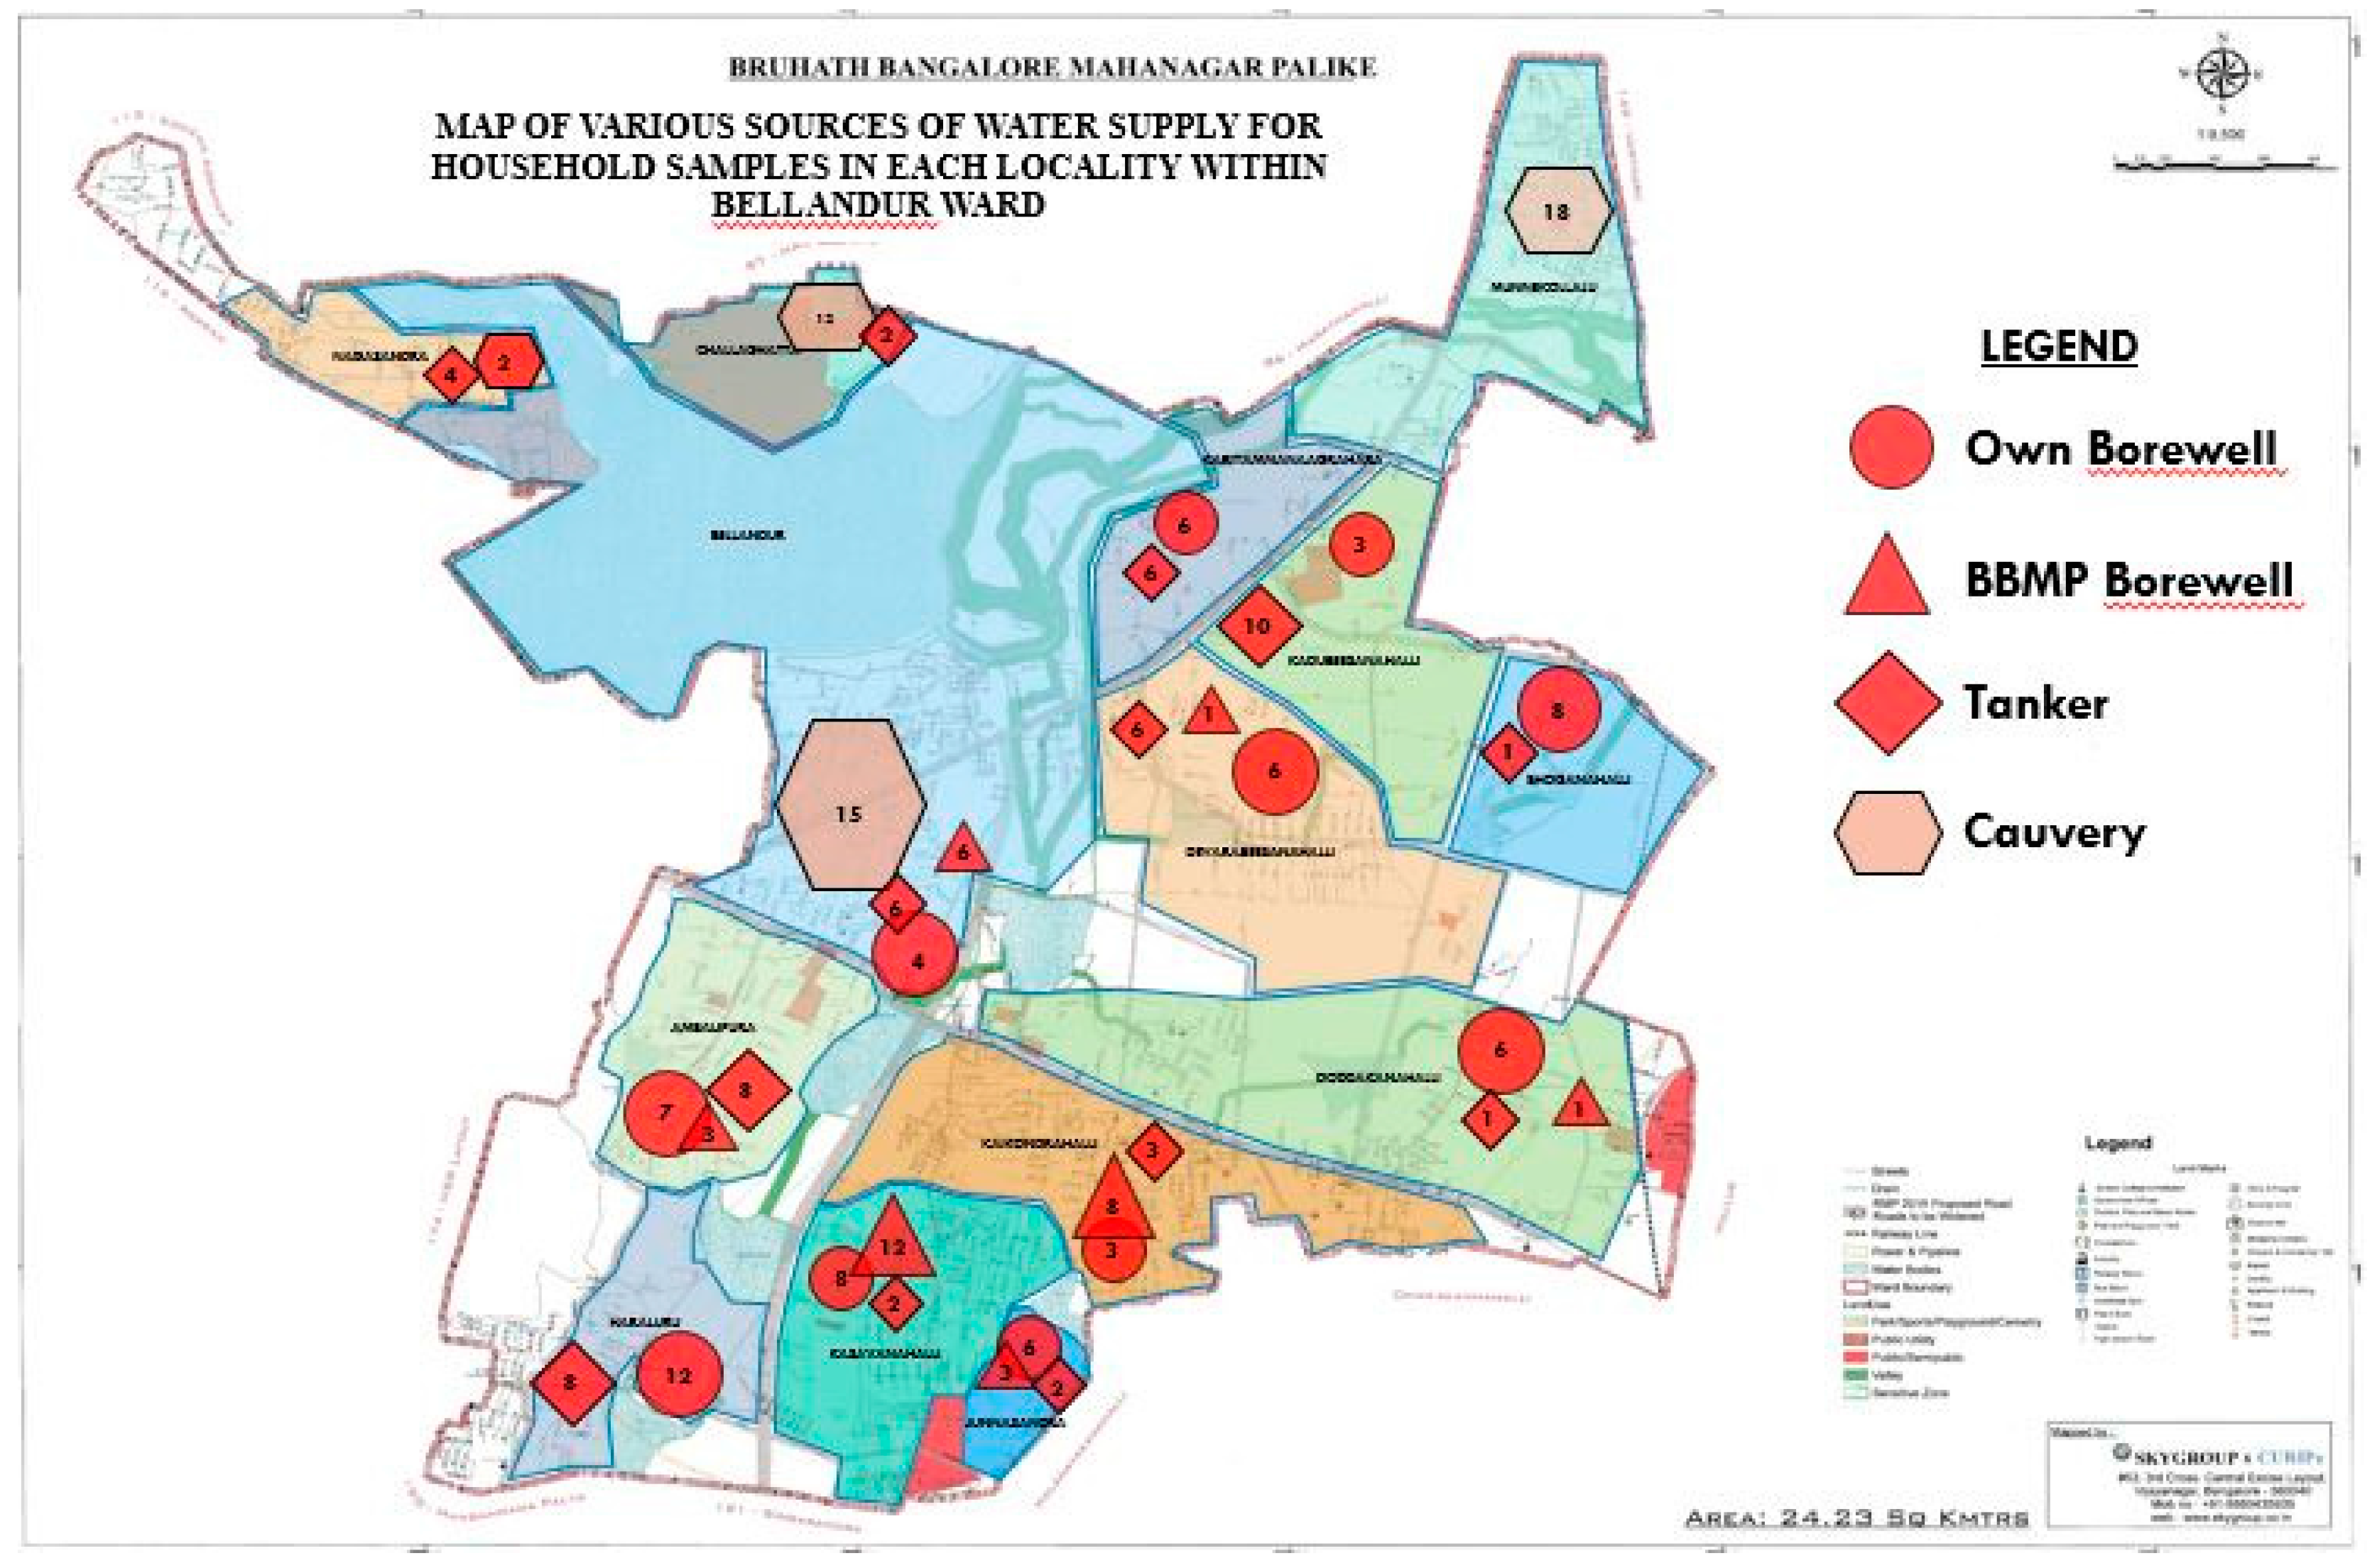
The study area, Bellandur, is the second-largest ward in Bengaluru, spanning an area of 26.4 sq km. This ward falls under the administrative jurisdiction of BBMP (Bruhat Bengaluru Mahangara Palike, Karnataka, India), which is a local body governing the peri-urban expansion of Bengaluru (Figure 1). The salient features of this ward are many in terms of administrative changes, water supply, and socio-economic characteristics. The Bellandur ward has 14 localities, of which 10 localities were under Gram Panchayath (Village Council) until 2005 and were then included under the urban local body after declaring some portion of this ward as a Special Economic Zone (SEZ). A map of the ward is shown in Figure 1. The SEZ development in four localities of this ward and its location formed a bridge or connectivity to two other major IT hubs (namely Whitefield and Electronic city), which paved the way for drastic development of residential and commercial establishments.
The present study does not require the sample to be representative, because we are interested in assessing which factors affect the public acceptance of recycled water. It is more important to ensure that there is sufficient variety in those variables which are hypothesized to play a role. This is ensured by the way in which the sample was drawn. As seen in the map of Bellandur ward, there are 14 localities in this ward. With practical considerations of time and budget, systematic random sampling was used. The author used the map to identify streets, housing density, high to low income areas, source of water supply, and geographical features like lakes in each of these localities. Next, a sampling strategy was determined based on the size of each locality;the population in each locality was obtained from BBMP property tax collection for the year 2015, and the 2011 Census was used to cross-verify. Larger localities were broken down to smaller clusters which were segmented further based on source of water supply and presence of informal settlements to encompass a range of socio-economic and environmental conditions that is broadly representative of the wholeward.
The selected localities including the sample distribution in each of the localities is listed in the Table below:
A total of 285 households (72 borewell owners and 55 public BBMP borewell-dependent households) were selected as questionnaire respondents using the following procedure:
- For each of the selected provinces, a list of households and populations was compiled from ward-level census data (2015).
- From the list of households of census data, 20 households were selected randomly in each locality for interviewing.
- Through reconnaissance survey in each street, a list of households that depended on BBMP borewells and those who had their own borewells were prepared for each locality.
- From the list of households that depended on BBMP borewells, 12 households were selected randomly in each locality for interviewing. If there were four or fewer which were dependent on BBMP borewells in the locality, all available were interviewed.
A total of 65 commercial establishments were chosen, of which 18 hadtheir own borewells and 10 depended on BBMP.
The Questionnaire was designed considering three consumer groups of different sources of water supply, as listed below.
- Public water utility-dependent communities (i.e., surface water)
- Borewells—both public and private
- Private informal water supply (i.e., tankers)
Four questionnaires were developed for the study: three to collect household-level data based on the three modes of supply above, and another to collect commercial establishments’ data.
Survey was carried out by the author independently and questions were divided into the following categories.
- socio-economic variables—age, household income, education, gender, ownership of the house
- Water demand—source of water, monthly expenditure on water (for surface water and tankers), overhead tank (OHT) capacity, frequency of switching on the motor to fill the OHT, number of buckets used to fill or store the water in case of low-income groups, number of borewells, year of installation of borewell;for tankers—number of loads of tanker supply, quality of water supplied, sump capacity to store.
- Type of usage—street washing, number of two wheelers and four wheelers to determine the usage for vehicle wash, frequency of washing.
- Qualitative information regarding sufficiency—respondents were asked if it is sufficient giving the options of yes or no.
- Awareness of wastewater treatment—photographs of types of wastewater treatment were shown along with existing STP photographs in Bengaluru city if the respondents mentioned that they are unaware of the processes, and then the advertisement by the BWSSB for the sale of reclaimed water from all its tertiary treatment facilities at 12 INR per kiloliter (kL) Respondents were informed about the present users who are primarily industries and gated communities for toilet flushing. Based on this information, they were asked if they were willing to buy and use or willing to use if provided free of cost.
3. Results
3.1. Population Growth and Water Demand
From Census 2001 to Census 2011 there was a population growth rate of 291%, and using standard projection methods, we can observe that in 2051 Bellandur ward will have a population of 0.15 million. This alarming growth rate is an indication of how developments have happened. Present water demand is approximately 18.31 MLD, and by 2051, 31.25 MLD of water will be required.
3.2. Sources of Supply
With respect to the source of water supply in Bellandur, four localities (namely Challaghatta, Munnekollal, Bellandur, and Belur Nagasandra) out of 14 have a piped water supply with the source being surface water. Only 984 connections were metered by BWSSB, which accounts for 5% of the entire Ward’s water requirement. Bellandur, although it was a Gram Panchayat (Gram Panchayat is a village-level self-governing body established by the Government) demanded a surface water piped supply in the 1990s, and got metered connections. The remaining 10 localities are entirely dependent on groundwater through various modes. The borewells are drilled by the residents, and in some places where their own borewells have dried up, BBMP has set up borewells and residents have taken connections from it. The other mode is the most predominant, informal, unregulated expensive mode, which is purchase through tankers. Only one public stand post is seen in Kaikondrahalli which caters to the backward community residing there for the past three decades. The major source of supply to the ward is through tankers, which forms 32% of residential demand followed by resident-owned borewells supplying 21% of the residential demand. This ward has 74 functional borewells out of 100 wells that have been drilled by BBMP.
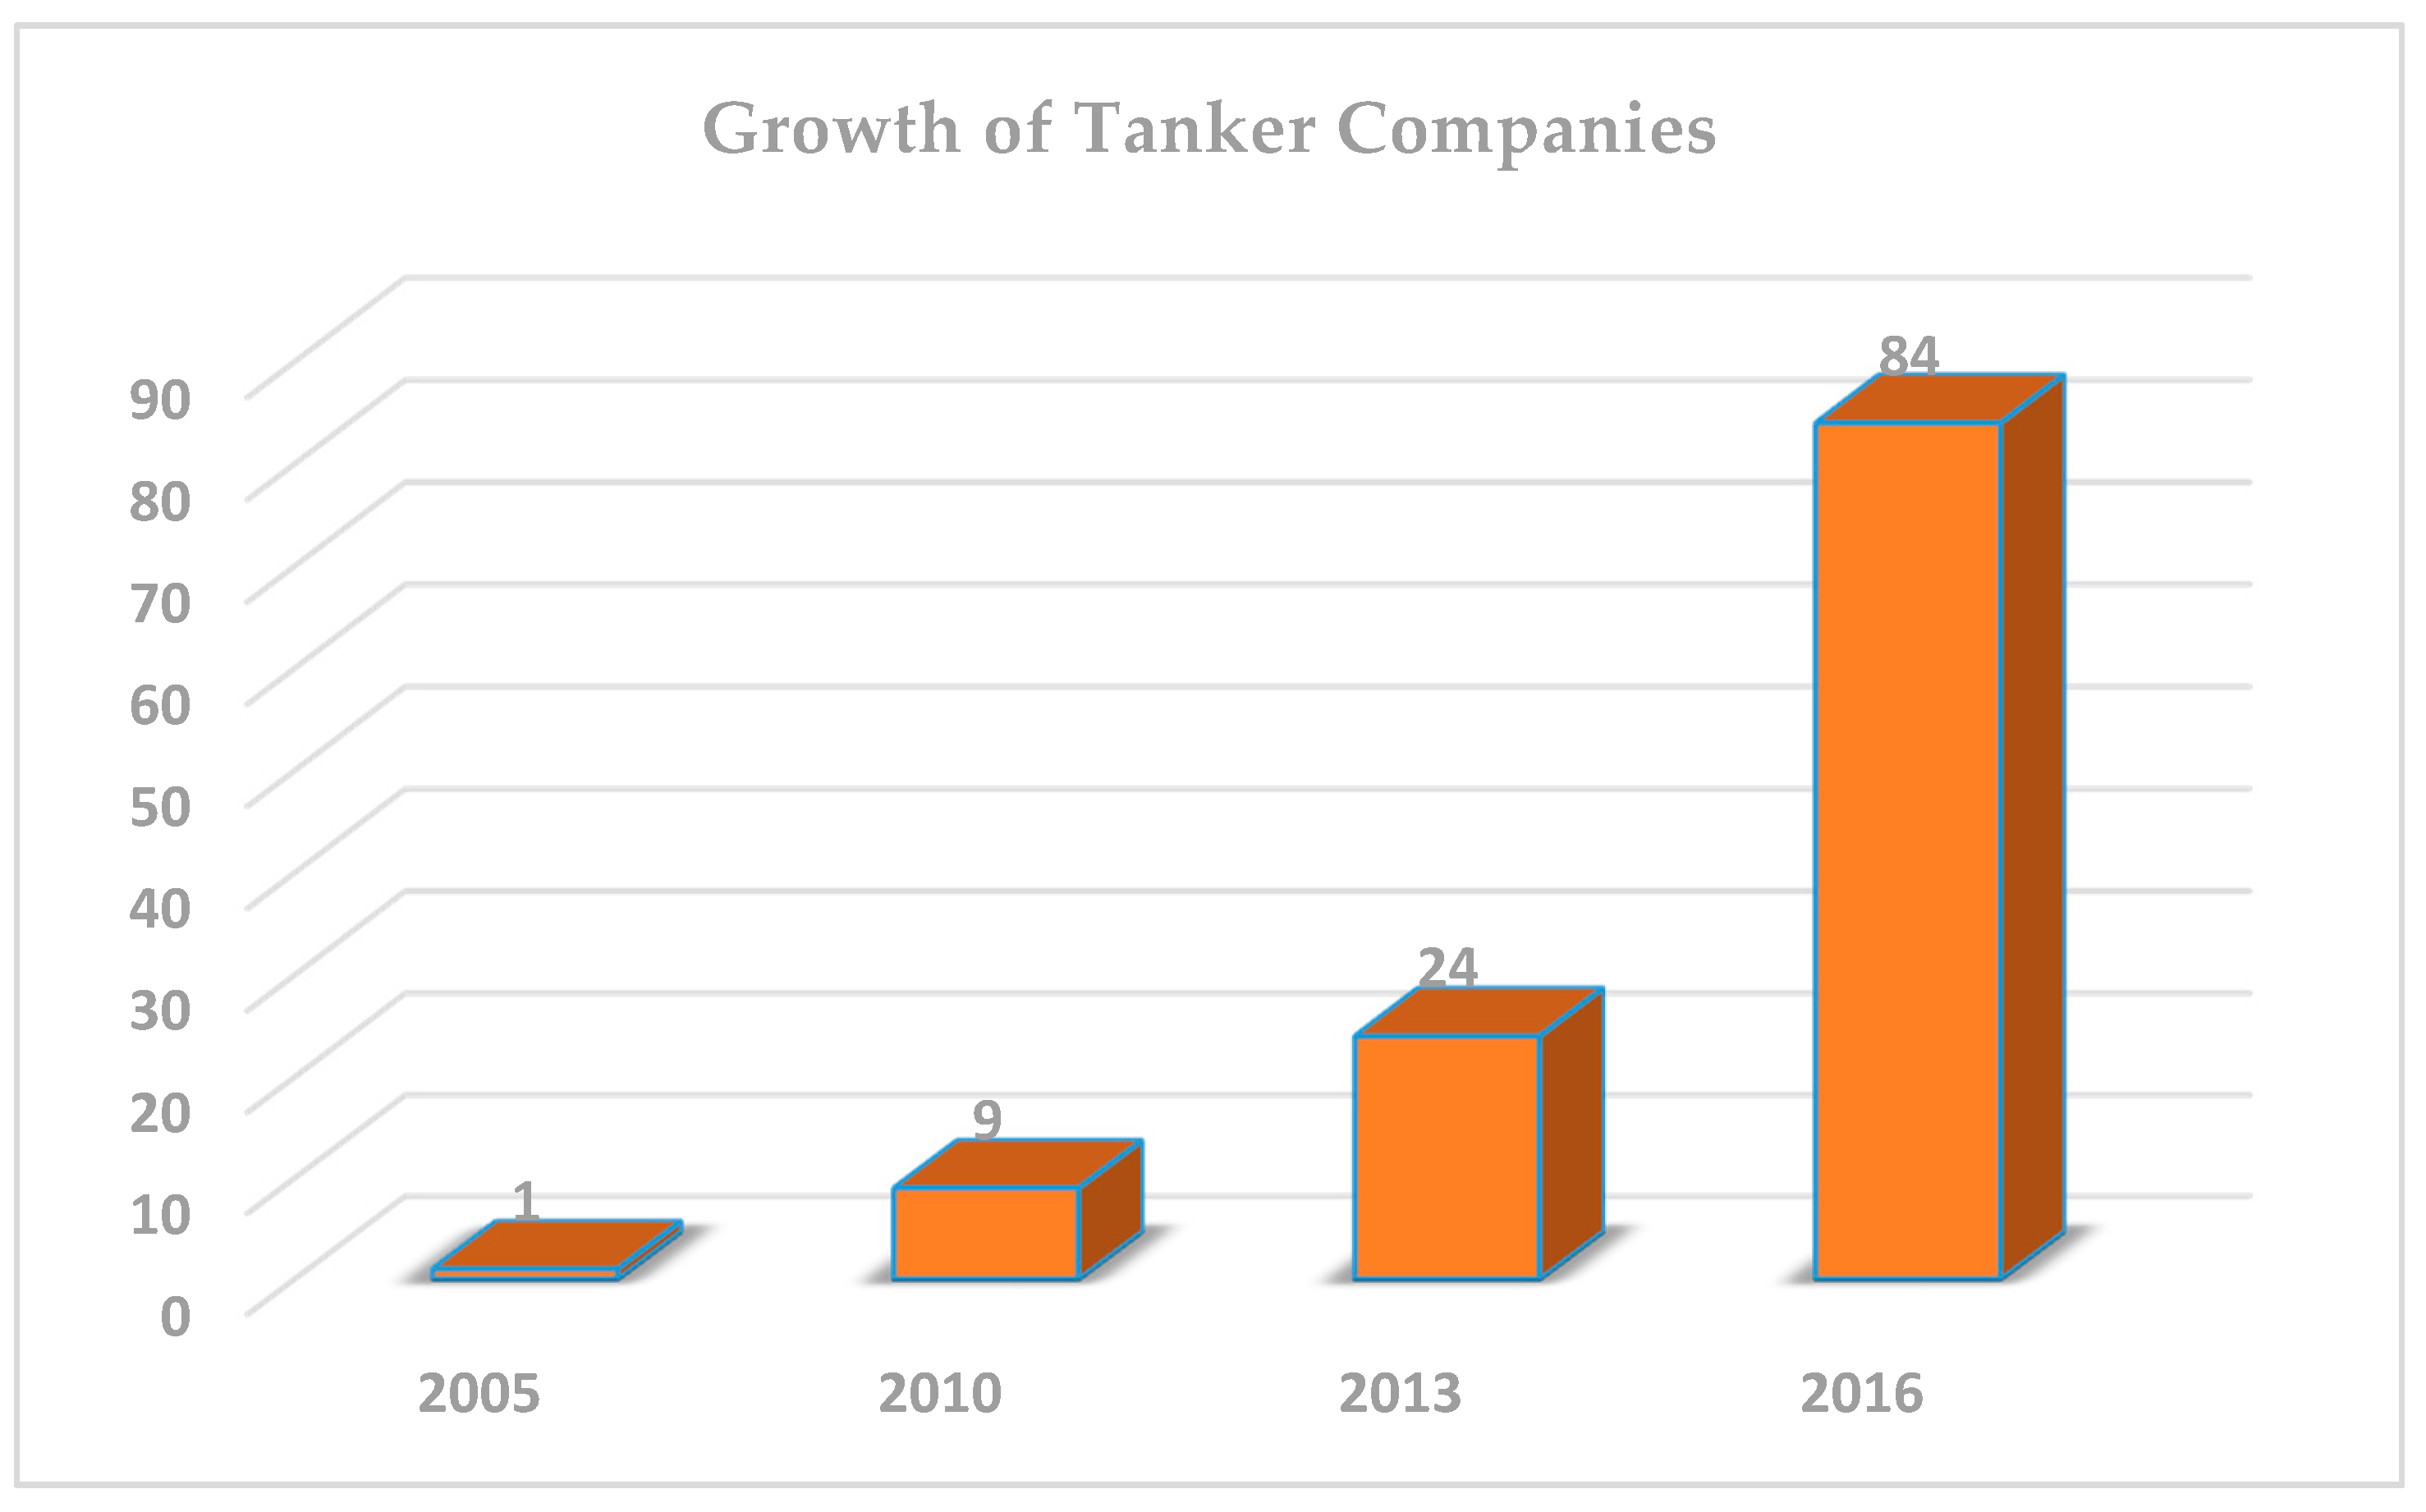
Approximately 57% of water demand is withdrawn from own borewells (Table 2) and sold through tankers making it a lucrative business hence, we see the growth in tanker companies has grown enormously over a decade (Figure 2).
Within the sample size in the study area, 100% of residences had septic tanks, which in this research is not considered as a treatment facility as it is a much-debated and discussed issue in the literature [25,26]. The reason for this is their unscientific design and not giving enough hydraulic retention time as they are desludged by septic tank cleaners/cesspool vehicles daily.
From Table 4, we see that majority of individual residential units, hotels, and restaurants in the sample surveyed do not have a treatment facility. These respondents were enquired and informed about treatment and reuse options; their responses are presented below.
3.3. Awareness of Wastewater Treatment and Reuse
The analysis pays particular attention to the role of awareness of wastewater treatment and type of water source they are using and the impacts these have on households’ concern for decision making to buy reclaimed water. Type of water source is the primary determinant influencing the attitude of respondents. There is a profound effect of type of water source the respondents were using on their awareness levels for water crisis and the social acceptability of reclaimed water. The results below illustrate the analysis arising from the survey responses.
The key findings from this study are that education is not a primary factor influencing public acceptance, but may be correlated to the source of water supply. Table 5 shows that the tanker-dependent consumers are very much aware of the concept of reuse. When checked with their education levels as well, it was found that the education level does not impact the awareness.
In terms of age considered as a factor to determine wastewater reuse awareness (Table 6), it was evident that the awareness was high among the age group 26–60. Previous studies and our results are similar with respect to age [22,26],as older respondents are not aware and hence not easily willing to accept.
Awareness is another driving factor with the knowledge of treatment process [14,26,27,28,29]. Table 7 categorizes awareness to treatment, reuse, and types of wastewater reuse. Respondents who were aware of wastewater treatment were further asked about types of wastewater (i.e., grey water and black water). The findings were that 47% of the tanker-dependent community were the majority who were aware of treatment, of which 30.5% were aware of greywater reuse as in few gated communities this was already in practice.
Eighty-nine percent of surface water-dependent communities are not aware of the concept of wastewater treatment or reuse. While interacting with this group, we briefed them about existing sewage treatment plants and how the sewerage board has been selling reclaimed water to industries and how they came up with a media advertisement to create awareness and sell the reclaimed water to other users. This advertisement was shown to respondents, asking if they were willing to accept and buy the reclaimed water at 15 INR per kiloliter. Sixty-seven percent of residents who were owners accepted (as shown in Table 8), and Figure 3 gives the reasons about what the respondents are concerned about and rejecting the use of treated wastewater. Twenty percent were very concerned about hygiene, and 33% respondents lacked trust in the agency regarding quality standards. The way in which treatment will be done, efficiency, and operation were concerns. The stakeholders opined that they are supplied with abundance of water supply either through borewells or surface water hence they do not want to pay for reclaimed water.
Respondents expressing a particular concern for one of the factors relative to other issues indicates the lesser likelihood for their willingness to accept, and aids in customizing the scenario to create awareness.
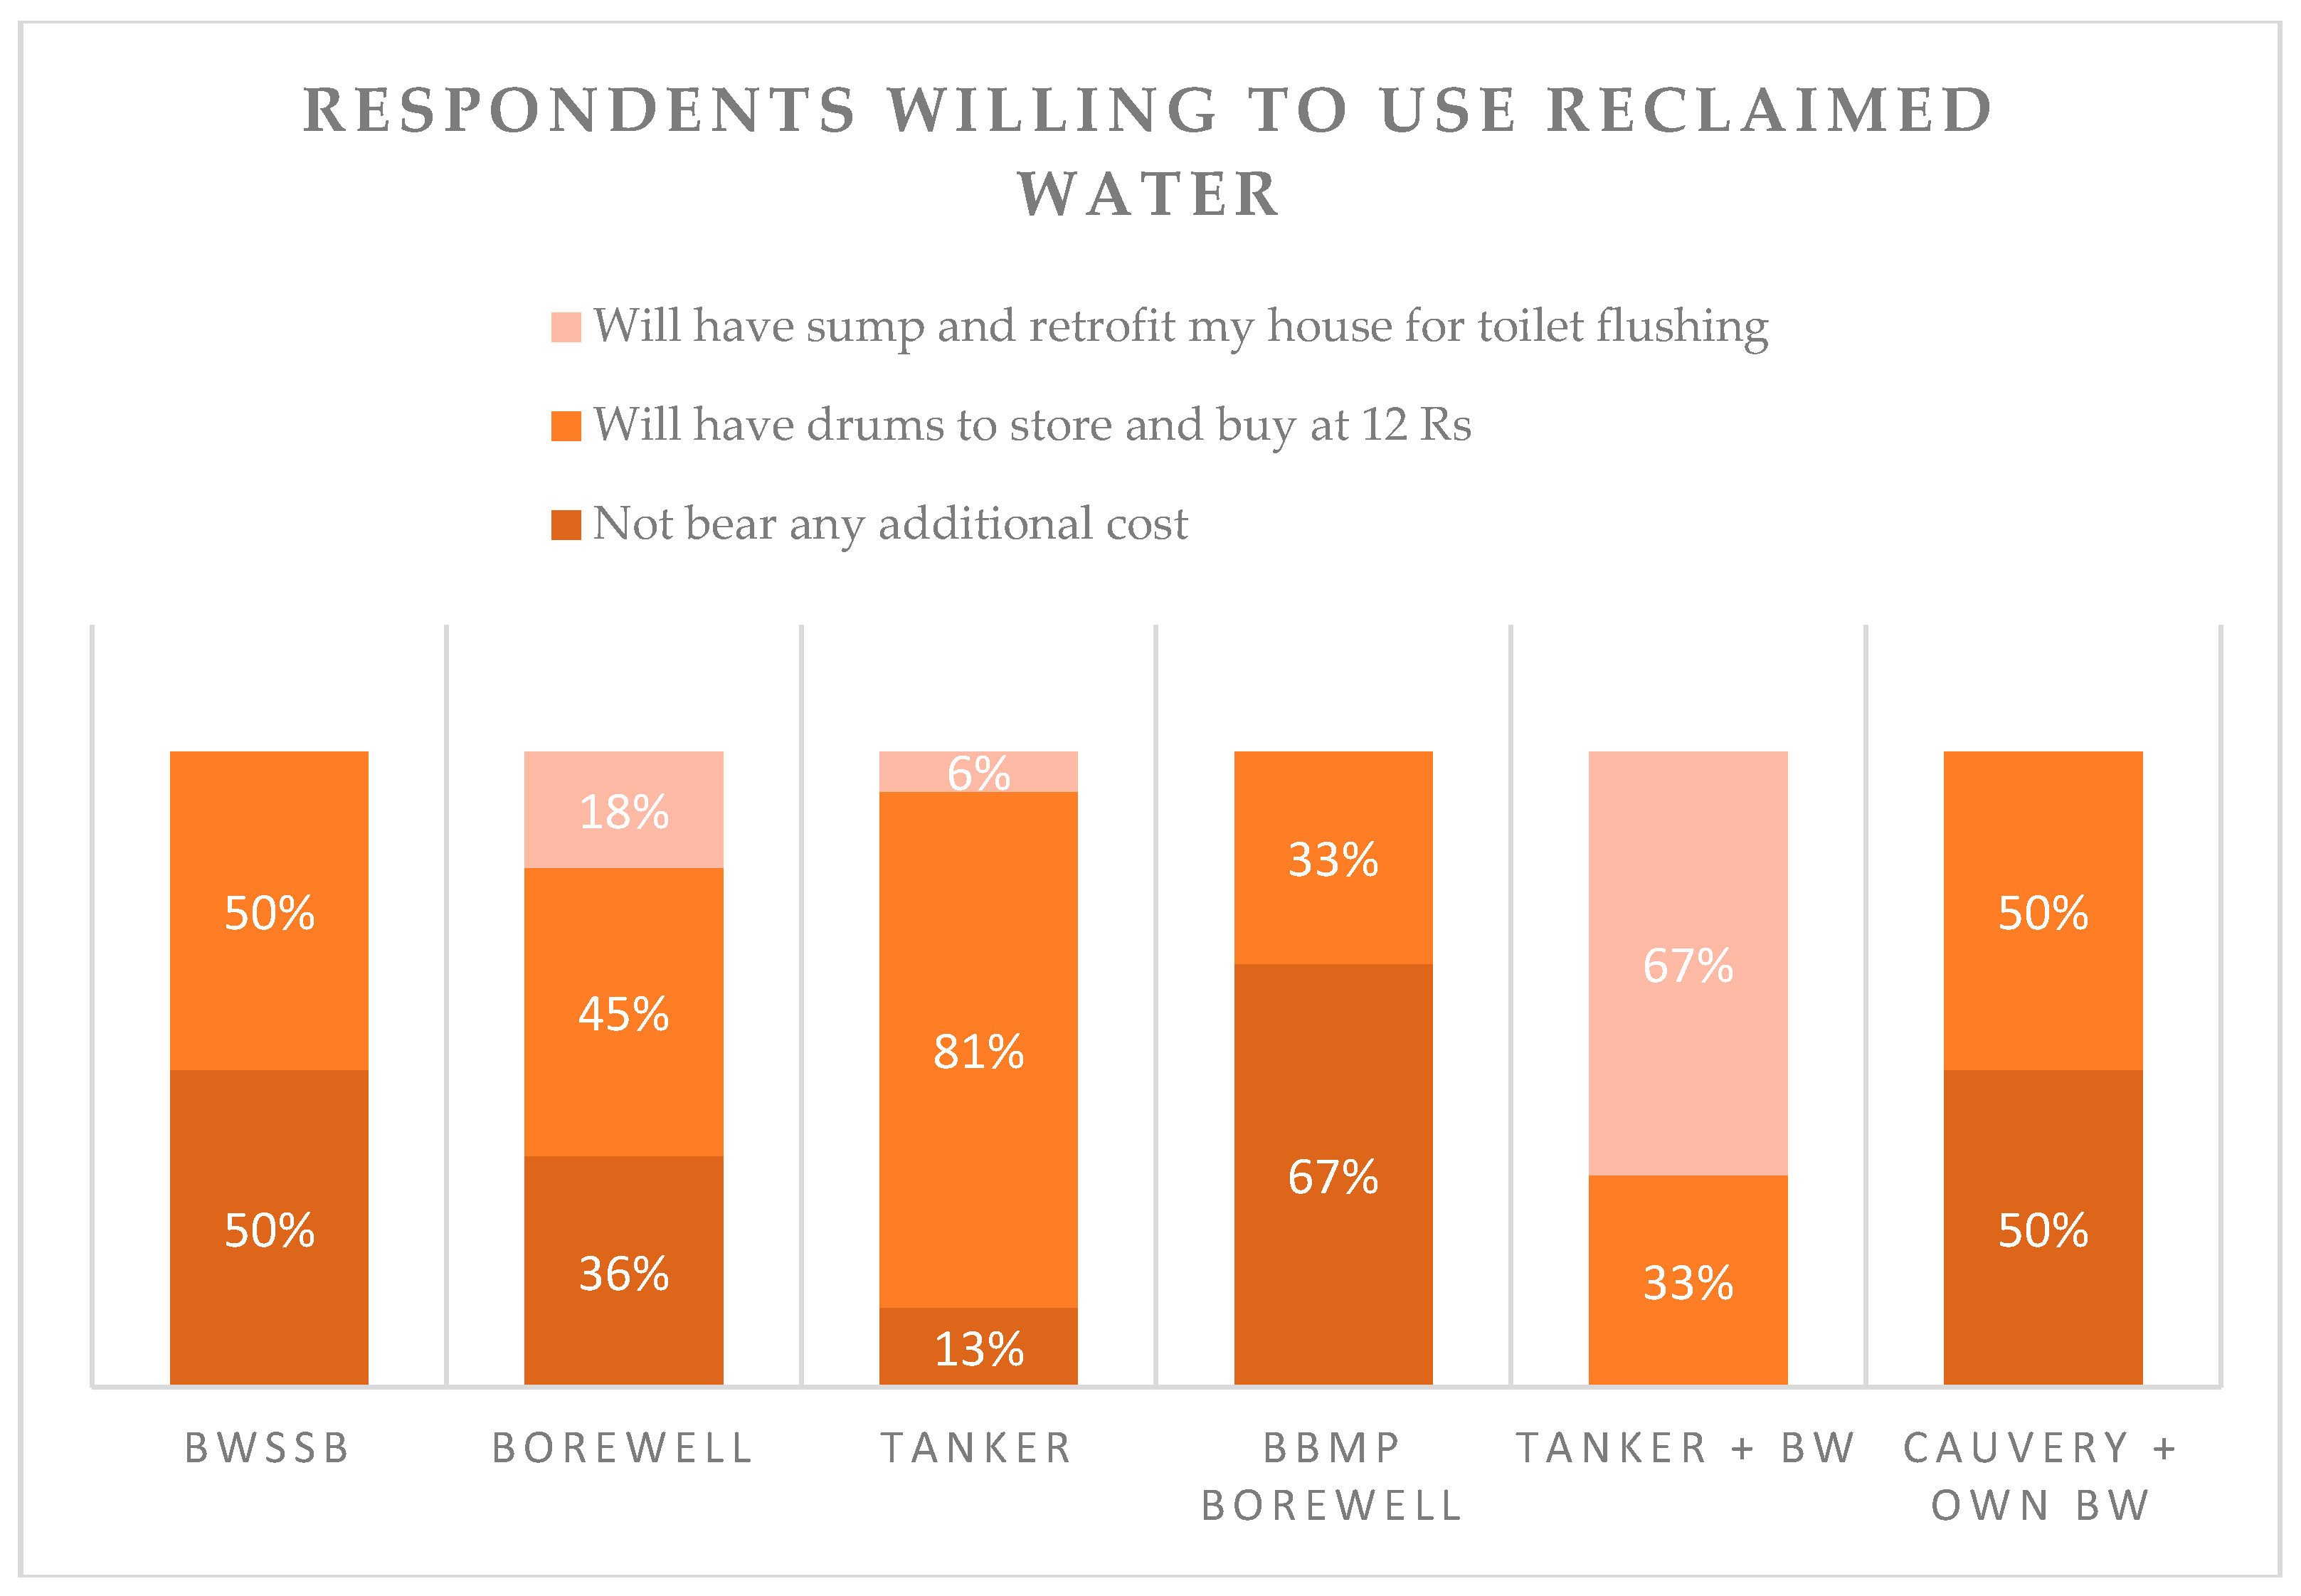
The responses helped us to understand the dissonance in concerns for reuse by residents (Figure 3). While 28% of residents rejected its use due to psychological aversion (yuck factor), 27% were not ready to reuse as they felt they had sufficient freshwater available and accessibility from their own borewells. Thirty-three percent of residents were “concerned”about the health risks, and an equal portion (34%) were concerned about quality standards—however, while surveying, it was observed that a majority of intake points for tanker supply were from sewage-fed lakes and vicinities. However, when tanker supply consumers were informed to the about the source quality and how BWSSB is already supplying tertiary treated water with reliable quality to industrial communities, a marked variability in responses was seen by residents. Tanker users were the majority (81%) who were willing to buy and have additional storage for reclaimed water, as they found it to be a cost-effective solution, whereas only 33% of BBMP borewell users were willing to buy and store reclaimed water for use. A good response of 67% by tanker and borewell users to retrofit their homes with dual piping for toilet flushing was recorded as shown in Figure 4. This develops insight as to what kind of awareness or knowledge transfer needs to be provided to the users and informs on how best to categorize them accordingly for successful participatory planning.
4. Discussion
Key drivers for the acceptance of reclaimed water are the possession of positive perceptions about the treatment process and reclaimed water itself, and the extent to which other people might influence a person’s decisions about the way STP functions. So, personal communication channels (i.e., family, friends, and colleagues) must share messages of the benefits of using recycled water instead of focusing primarily only on the issues and challenges of operating an STP, which is often the case with the majority of apartment residents. The marketing strategies used by the water board and even private land developers should be devised in an attractive manner.
The survey revealed a mixed response from tenants living in rental properties. Some were ready to buy reclaimed water as they found it to be cost-effective compared to tanker purchase, whereas others showed less interest to invest in a property they do not own, particularly if they are living there temporarily. Similarly, landlords were defiant to invest in a dual piping system in rental properties with the belief that the tenants get to reap the benefits and not them. So, government intervention through incentivizing rental properties with dual piping systems can alleviate such barriers, but must tread with care and caution.
The study concludes that a good amount of recognition for wastewater management and recycling is in place in policy frameworks and partial implementation at some institutional levels. Since the concept is put into practice at large-scale and some small-scale levels, scaling up to ward level or country level should not be difficult. However, this requires a detailed understanding and guidance on treatment standards, types of reuse applications, design, and Operation and Maintenance (O & M) considerations for the management of wastewater recycling projects and tariff structures for the sale of recycled water for various applications.
For water, market mechanisms tend to refer mainly to tariffs, fees, and charges that are administratively determined by authorities reflecting cost recovery for managing water rather than giving a price for water per se. Increase in tariff and volumetric pricing has been recommended in many studies, which should be made with immediate effect. Surface water costs 11 INR/kL and STP water costs 12 INR/kL. Surface water supply is underpriced, which does not foster frugal use of water by these communities. Moreover, when comparing this tariff with the pricing of STP water, the community has no monetary gain in buying STP water at this cost, and no confidence or accountability regarding the quality of water.
Instead of scaling-up existing STPs, formalizing the tanker supply systemwill substantially expand and improve water and sanitation provision in peri-urban areas, especially in ways that will benefit low-income and vulnerable groups.
Author Contributions
Chaya Ravishankar and Manasi Seshaiah conceived and designed the experiments; Chaya Ravishankar performed the experiments; Sunil Nautiyal contributed the tools, analyzed and reviewed the data; Chaya Ravishankar wrote the paper.
Conflicts of Interest
The authors declare no conflict of interest.
References
- World Bank; Water and Sanitation Program (WSP); International Water Management Institute (IWMI). Recycling and Reuse of Treated Wastewater in Urban India; International Water Management Institute (IWMI): Colombo, Sri Lanka, 2016. [Google Scholar]
- Norström, A. Planning for Drinking Water and Sanitation in Peri-Urban Areas. Swed. Water House Rep. 2007, 21, 1–16. [Google Scholar]
- Janakirajan, S. A Snake in the Grass! Unequal Power, Unequal Contracts and Unexplained Conflicts: Facilitating Negotiations over Water Conflicts in Peri-Urban Catchments 1 Introduction; Madras Institute of Development Studies: Chennai, India, 2005; pp. 1–19. [Google Scholar]
- Ranganathan, M. “Mafias” in the Waterscape: Urban Informality and Everyday Public Authority in Bangalore. Water Altern. 2014, 7, 89–105. [Google Scholar]
- Water and Sanitation Program (WSP); Asian Development Bank (ADB); Australian Aid (AusAid); UKAid. The Economic Impacts of Inadequate Sanitation in India. Power 2011, 9. Available online: http://documents.worldbank.org/curated/en/820131468041640929/pdf/681590WSP0Box30UBLIC00WSP0esi0india.pdf (accessed on 19 January 2018).
- United Nations Children’s Fund (UNICEF). The Situation of Children in India A Profile; United Nations Children’s Fund: New Delhi, India, 2011. [Google Scholar]
- Gautam, S.; Vimal, J.; Swami, R.; Sinha, A.; Basu, D.; Kamyotra, J. Status of Water Supply, Wastewater Generation and Treatment in Class-I Cities & Class-Ii Towns of India. 2009, pp. 1–89. Available online: http://cpcb.nic.in/upload/NewItems/NewItem_153_Foreword.pdf (accessed on 7 November 2017).
- Rollnick, R.; Naudin, T. Un-Habitat Annual Report 2010; UN-Habitat: Nairobi, Kenya, 2010. [Google Scholar]
- Raj, K. Urbanization and Water Supply: An Analysis of Unreliable Water Supply in Bangalore City, India. In Nature, Economy and Society: Understanding the Linkages; Ghosh, N., Mukhopadhyay, P., Shah, A., Panda, M., Eds.; Springer: New Delhi, India, 2016; pp. 113–132. [Google Scholar]
- Parkinson, J.; Tayler, K. Decentralized Wastewater Management in Peri-Urban Areas in Low-Income Countries. Environ. Urban. 2003, 15, 75–90. [Google Scholar] [CrossRef]
- Kurian, M.; Reddy, R.; Rao, M.; Lata, S. Productive Use of Domestic Wastewater in Peri-Urban Regions: Issues and Options. In Proceedings of the IRC Symposium: Sanitation for the Urban Poor Partnerships and Governance, Delft, The Netherlands, 19–21 November 2008. [Google Scholar]
- Jam, P.; Trust, A. Addressing Water Stress through Waste Water reuse: Complexities and challenges in Bangalore, India. In Proceedings of the Waste Water Reuse (WWRU) Recycle and Reuse of Treated Effluent Within the City, Bonn, Germany, 31 May 2014. [Google Scholar]
- Kuttuva, P.S. An Integrated Analysis of the Economic, Social, Institutional and Environmental Factors Affecting Decentralized Urban Wastewater Reuse Systems: Insights from Bengaluru, India. Master’s Thesis, Universitat Autònoma de Barcelona Bellaterra, Barcelona, Spain, 2015. [Google Scholar]
- Hurlimann, A.; Hemphill, E.; McKay, J.; Geursen, G. Establishing Components of Community Satisfaction with Recycled Water Use through a Structural Equation Model. J. Environ. Manag. 2008, 88, 1221–1232. [Google Scholar] [CrossRef] [PubMed]
- Stone, R.; Kahle, R. Wastewater Reclamation: Socio-Economics, Technology, and Public Acceptance; Final Report; Office of Water Resource Research, US Department of the Interior: Washington, DC, USA, 1974.
- McKay, J.; Hurlimann, A. Attitudes to Reclaimed Water for Domestic Use: Part 1. Age; Australian Water Association: Sydney, Australia, 2003. [Google Scholar]
- Bruvold, W.H.; Ward, P.C. Using Reclaimed Wastewater: Public Opinion. J. Water Pollut. Control Fed. 1972, 44, 1690–1696. [Google Scholar] [PubMed]
- Dolnicar, S.; Hurlimann, A.; Grün, B. What Affects Public Acceptance of Recycled and Desalinated Water? Water Res. 2011, 45, 933–943. [Google Scholar] [CrossRef] [PubMed]
- Bruvold, W.H.; Olson, B.H.; Rigby, M. Public Policy for the Use of Reclaimed Water. Environ. Manag. 1981, 5, 95–107. [Google Scholar] [CrossRef]
- Po, M.; Kaercher, J.D.; Nancarrow, B.E. Literature Review of Factors Influencing Public Perceptions of Water Reuse. CSIRO Land Water Tech. Rep. 2003, 54, 1–44. [Google Scholar]
- Baumann, D.D.; Kasperson, R.E. Public Acceptance of Renovated Waste Water: Myth and Reality. Water Resour. Res. 1974, 10, 667–674. [Google Scholar] [CrossRef]
- Dolnicar, S.; Hurlimann, A. Water Alternatives—Who and What Influences Public Acceptance? J. Public Aff. 2011, 11, 49–59. [Google Scholar] [CrossRef]
- Dolnicar, S.; Schäfer, A.I. Public Perception of Desalinated versus Recycled Water in Australia. In Proceedings of the AWWA Desalination Symposium, Honolulu, HI, USA, 7–9 May 2006. [Google Scholar]
- Nancarrow, B.E.; Leviston, Z.; Po, M.; Porter, N.B.; Tucker, D.I. What Drives Communities’ Decisions and Behaviours in the Reuse of Wastewater. Water Sci. Technol. 2008, 57, 485–491. [Google Scholar] [CrossRef] [PubMed]
- Cofiea, O.O.; Drechsela, P.; Agbottaha, S.; van Veenhuizenb, R. Resource Recovery from Urban Waste: Options and Challenges for Community-Based Composting in Sub-Saharan Africa. Desalination 2009, 248, 256–261. [Google Scholar] [CrossRef]
- Johansson, G.; Sundin, E. A Value Proposition: Resource Recovery from Faecal sludge—Can It Be the Driver for Improved Sanitation? Resour. Conserv. Recycl. 2014, 88, 32–38. [Google Scholar] [CrossRef]
- Flack, J.E.; Greenberg, J. Public Attitudes toward Water Conservation. J. Am. Water Work. Assoc. 1987, 79, 46–51. [Google Scholar]
- Jeffrey, P.; Jefferson, B. Public Receptivity Regarding “in-House” Water Recycling: Results from a UK Survey. Water Sci. Technol. Water Supply 2003, 3, 10–116. [Google Scholar]
- Tsagarakis, K.P.; Georgantzís, N. The Role of Information on farmers’ Willingness to Use Recycled Water for Irrigation. Water Sci. Technol. Water Supply 2003, 3, 105–113. [Google Scholar]
Figure 1.
Location map of Study area showing sample distribution based on various sources of supply. BBMP: Bruhat Bengaluru MahangaraPalike.
Figure 1.
Location map of Study area showing sample distribution based on various sources of supply. BBMP: Bruhat Bengaluru MahangaraPalike.

Figure 2.
Growth in the number of tanker companies in the study area.

Figure 3.
Factors influencing the respondents’decision to not buy reclaimed water.
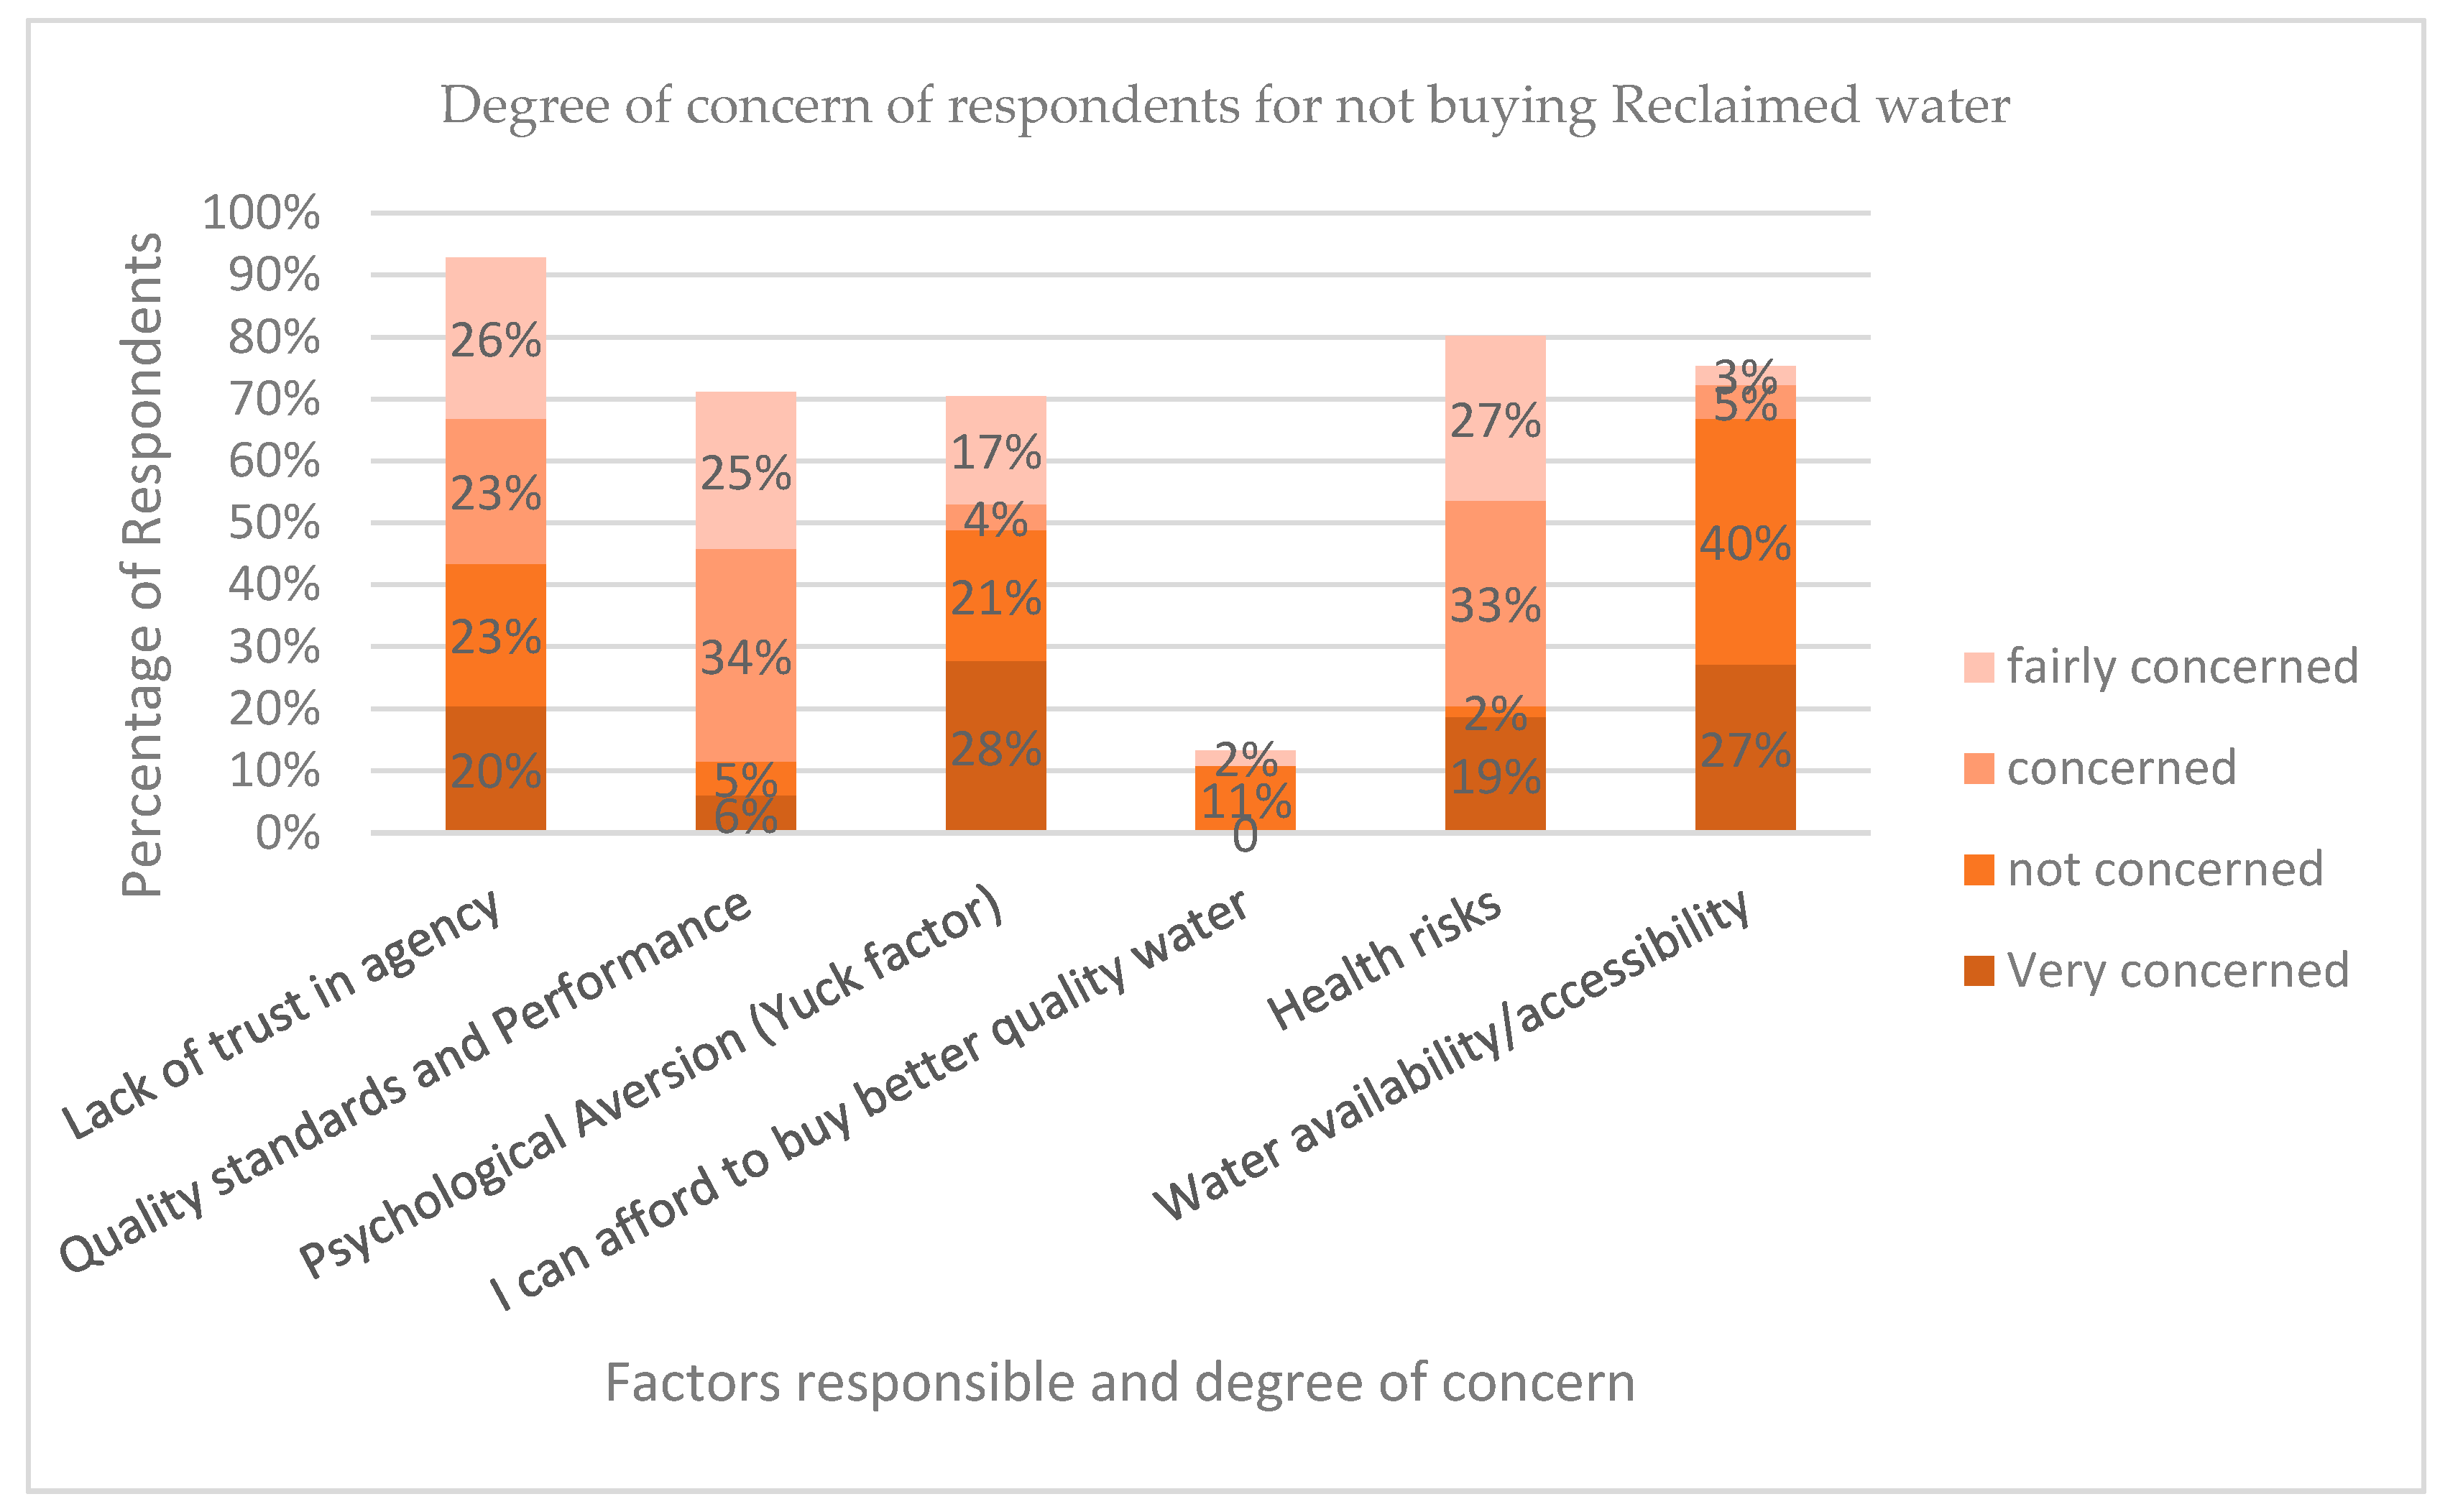
Figure 4.
Respondents willing to use reclaimed water.


Table 1.
The sewage treatment infrastructure gaps for the domestic sector.
| S. No | Head | Units | 2011 | 2016 | 2021 | 2026 | 2031 |
|---|---|---|---|---|---|---|---|
| 1 | Population | No. | 9,044,664 | 11,071,055 | 13,551,445 | 1,6,594,465 | 20,320,805 |
| 2 | Water Supply 135 lpcd | MLD | 1221 | 1495 | 1829 | 2240 | 2743 |
| 3 | Sewage 80% of water supply | MLD | 977 | 1196 | 1464 | 1792 | 2195 |
| 4 | Treatment capacity | MLD | 721 | 721 | 1060 | 1610 | 1817 |
| 5 | Gap in Treatment infra | MLD | 256 | 475 | 404 | 182 | 378 |
Source: BWSSB and RMP 2031 Analysis as cited in Revised BDA Master plan 2031.lpcd: liters per capita per day.
Table 2.
Sample distribution based on source of water supply.
| Source of Supply | Residential | Commercial |
|---|---|---|
| Borewell | 21% | 4% |
| Cauvery | 13% | 4% |
| BBMP Borewell | 16% | 2% |
| Tanker | 32% | 9% |
Table 3.
Non-potable water demand for the sample.
| S. No. | Localities | Residential Non-Potable Water Demand (Litres per Day) at 38% | Commercial Non-Potable Water Demand (lpd) | |
|---|---|---|---|---|
| IT | Shops | |||
| 1 | Munnekollal | 3724 | 0 | 1100 |
| 2 | Bellandur | 9956 | 0 | 1100 |
| 3 | Doddakanahalli | 2508 | 675,000 | 600 |
| 4 | Haraluru | 6688 | 0 | 600 |
| 5 | Kaikondrahalli | 5548 | 0 | 500 |
| 6 | Kasavanahalli | 7752 | 0 | 1100 |
| 7 | Challaghatta | 3268 | 0 | 500 |
| 8 | Devarabeesanahalli | 3952 | 855,000 | 0 |
| 9 | Bhoganahalli | 2660 | 0 | 500 |
| 10 | Junnasandra | 4408 | 0 | 0 |
| 11 | Kariammana Agrahara | 3952 | 18,000 | 0 |
| 12 | Nagasandra | 1140 | 0 | 0 |
| 13 | Kadubeesanahalli | 3344 | 315,000 | 1000 |
| 14 | Ambalipura | 6080 | 0 | 600 |
| 15 | Total | 64,980 | 1,863,000 | 7600 |
NOTE: i. As per IS 1172-1993, non-potable uses are washing and cleaning of residential premises (15 lpcd), lawn watering and gardening (15 lpcd), and flushing of water closets (45 lpcd), which account for 38% of the total water demand. ii. Lpcd liters per capita per day. iii. For commercial and IT: only 45 lpcd for flushing of water closets is taken, and no showers or kitchen water is considered, as this is recycled back into their sewage treatment plants (STPs).
Table 4.
Wastewater generated in the study area.
| S. No. | Land Use Type | Water Demand (lpd) | Wastewater Generated | % Treated | Volume Requiring Treatment (lpd) |
|---|---|---|---|---|---|
| 1 | Residential Units | 171,000 | 136,800 | 0 | 136,800 |
| 2 | Apartments | 8,764,000 | 7,011,200 | 95 | 350,560 |
| 3 | Hospitals | 638,100 | 510,480 | 20 | 408,384 |
| 4 | Hotels | 93,780 | 75,024 | 20 | 60,019 |
| 5 | Restaurants | 57,750 | 46,200 | 0 | 46,200 |
| 6 | IT parks | 1,863,000 | 1,490,400 | 70 | 447,120 |
| Total | 11,587,630 | 9,270,104 | 1,449,083 |
Table 5.
Respondents awareness of wastewater reuse corresponding to their education levels. BWSSB: Bengaluru Water Supply Sewerage Board.
Table 5.
Respondents awareness of wastewater reuse corresponding to their education levels. BWSSB: Bengaluru Water Supply Sewerage Board.
| Source | Illiterate | Primary Level–Higher Secondary Level | Undergraduate Level | Post-Graduate Level |
|---|---|---|---|---|
| BWSSB | 16.7% (7) | 25.0% (8) | 28.6% (11) | 100.0% (3) |
| Borewell (BW) | 16.0% (25) | 17.2% (28) | ||
| Tanker | 16.7% (6) | 14.3% (35) | 71.9% (41) | 28.6% (13) |
| public stand post | ||||
| BBMP Borewell | 25.0% (18) | 36.4% (25) | 100.0% (12) | |
| Tanker + BW | 50.0% (8) | |||
| Surface water + Tanker | 10.0% (15) | |||
| Surface water + Own BW | 16.7% (6) | |||
| Total Respondents (%) | 8% | 34% | 46% | 14% |
Table 6.
Distribution of sample in different age groups who are aware of wastewater reuse.
| Below 25 | 26–40 | 41–60 | Above 60 |
|---|---|---|---|
| 16% (47) | 34% (98) | 34% (96) | 15% (44) |
Table 7.
Respondents’awareness of wastewater reuse.
| Source of Supply | Respondents Who Are Aware of All the Parameters | Aware of Wastewater Treatment but Not the Concept of Reuse | Aware of Wastewater Reuse | Aware of Greywater Reuse | Not Aware |
|---|---|---|---|---|---|
| BWSSB | 14.18% | 6.90% | 27.59% | 17.24% | 65.52% |
| Borewell | 38.81% | 15.38% | 13.85% | 13.85% | 70.77% |
| Tanker | 28.36% | 5.26% | 29.47% | 18.95% | 27.37% |
| public stand post | 16.67% | 50.00% | |||
| BBMP Borewell | 9.70% | 3.64% | 18.18% | 10.91% | 20.00% |
| Tanker + BW | 25.00% | 25.00% | |||
| Surface water+ Tanker | 3.73% | 5.00% | 5.00% | 65.00% | |
| Surface water + Own BW | 5.22% | 7.69% | 61.54% | ||
| Total Respondents (%) | 15% | 7% | 13% | 20% | 44% |
Table 8.
Percentage of respondents who were willing to pay 15 INR/kL as prescribed by BWSSB and use reclaimed water based on their ownership of the house.
Table 8.
Percentage of respondents who were willing to pay 15 INR/kL as prescribed by BWSSB and use reclaimed water based on their ownership of the house.
| Source of Water Supply | Tenants Willing to Pay and Use Reclaimed Water | Owners Willing to Pay and Use Reclaimed Water |
|---|---|---|
| BWSSB | 6% | 100% |
| Borewell | 13% | 100% |
| Tanker | 23% | 31% |
| public stand post | nil | |
| BBMP Borewell | 43% | |
| Tanker + BW | 100% | 67% |
| Surface water + Tanker | ||
| Surface water + Own BW | 40% |
© 2018 by the authors. Licensee MDPI, Basel, Switzerland. This article is an open access article distributed under the terms and conditions of the Creative Commons Attribution (CC BY) license (http://creativecommons.org/licenses/by/4.0/).
Share and Cite
MDPI and ACS Style
Ravishankar, C.; Nautiyal, S.; Seshaiah, M. Social Acceptance for Reclaimed Water Use: A Case Study in Bengaluru. Recycling 2018, 3, 4. https://doi.org/10.3390/recycling3010004
AMA Style
Ravishankar C, Nautiyal S, Seshaiah M. Social Acceptance for Reclaimed Water Use: A Case Study in Bengaluru. Recycling. 2018; 3(1):4. https://doi.org/10.3390/recycling3010004
Chicago/Turabian StyleRavishankar, Chaya, Sunil Nautiyal, and Manasi Seshaiah. 2018. "Social Acceptance for Reclaimed Water Use: A Case Study in Bengaluru" Recycling 3, no. 1: 4. https://doi.org/10.3390/recycling3010004