Material Implications of Rural Electrification—A Methodological Framework to Assess In-Use Stocks of Off-Grid Solar Products and EEE in Rural Households in Bangladesh

Abstract
:1. Introduction
- To develop the framework of linking access to electricity metrics with product properties for the assessment of in-use stocks for off-grid solar products and EEE in rural households in developing countries.
- To provide empiric datasets to apply a conceptual framework for a case study in Bangladesh.
- To demonstrate the impact of the type of access to electricity on the material in-use stocks in rural households of developing countries.
2. Background
2.1. Measuring Access to Energy
2.2. Rural Electrification and (E-)Waste
2.3. E-Waste Definition
2.4. Assessing and Estimating E-Waste Generation
2.5. Research Trends for Rural Electrification and Off-Grid Energy Systems with a Focus on Environmental Impacts
2.6. Case Study: Bangladesh and the Local SHS Program
3. Materials and Methods
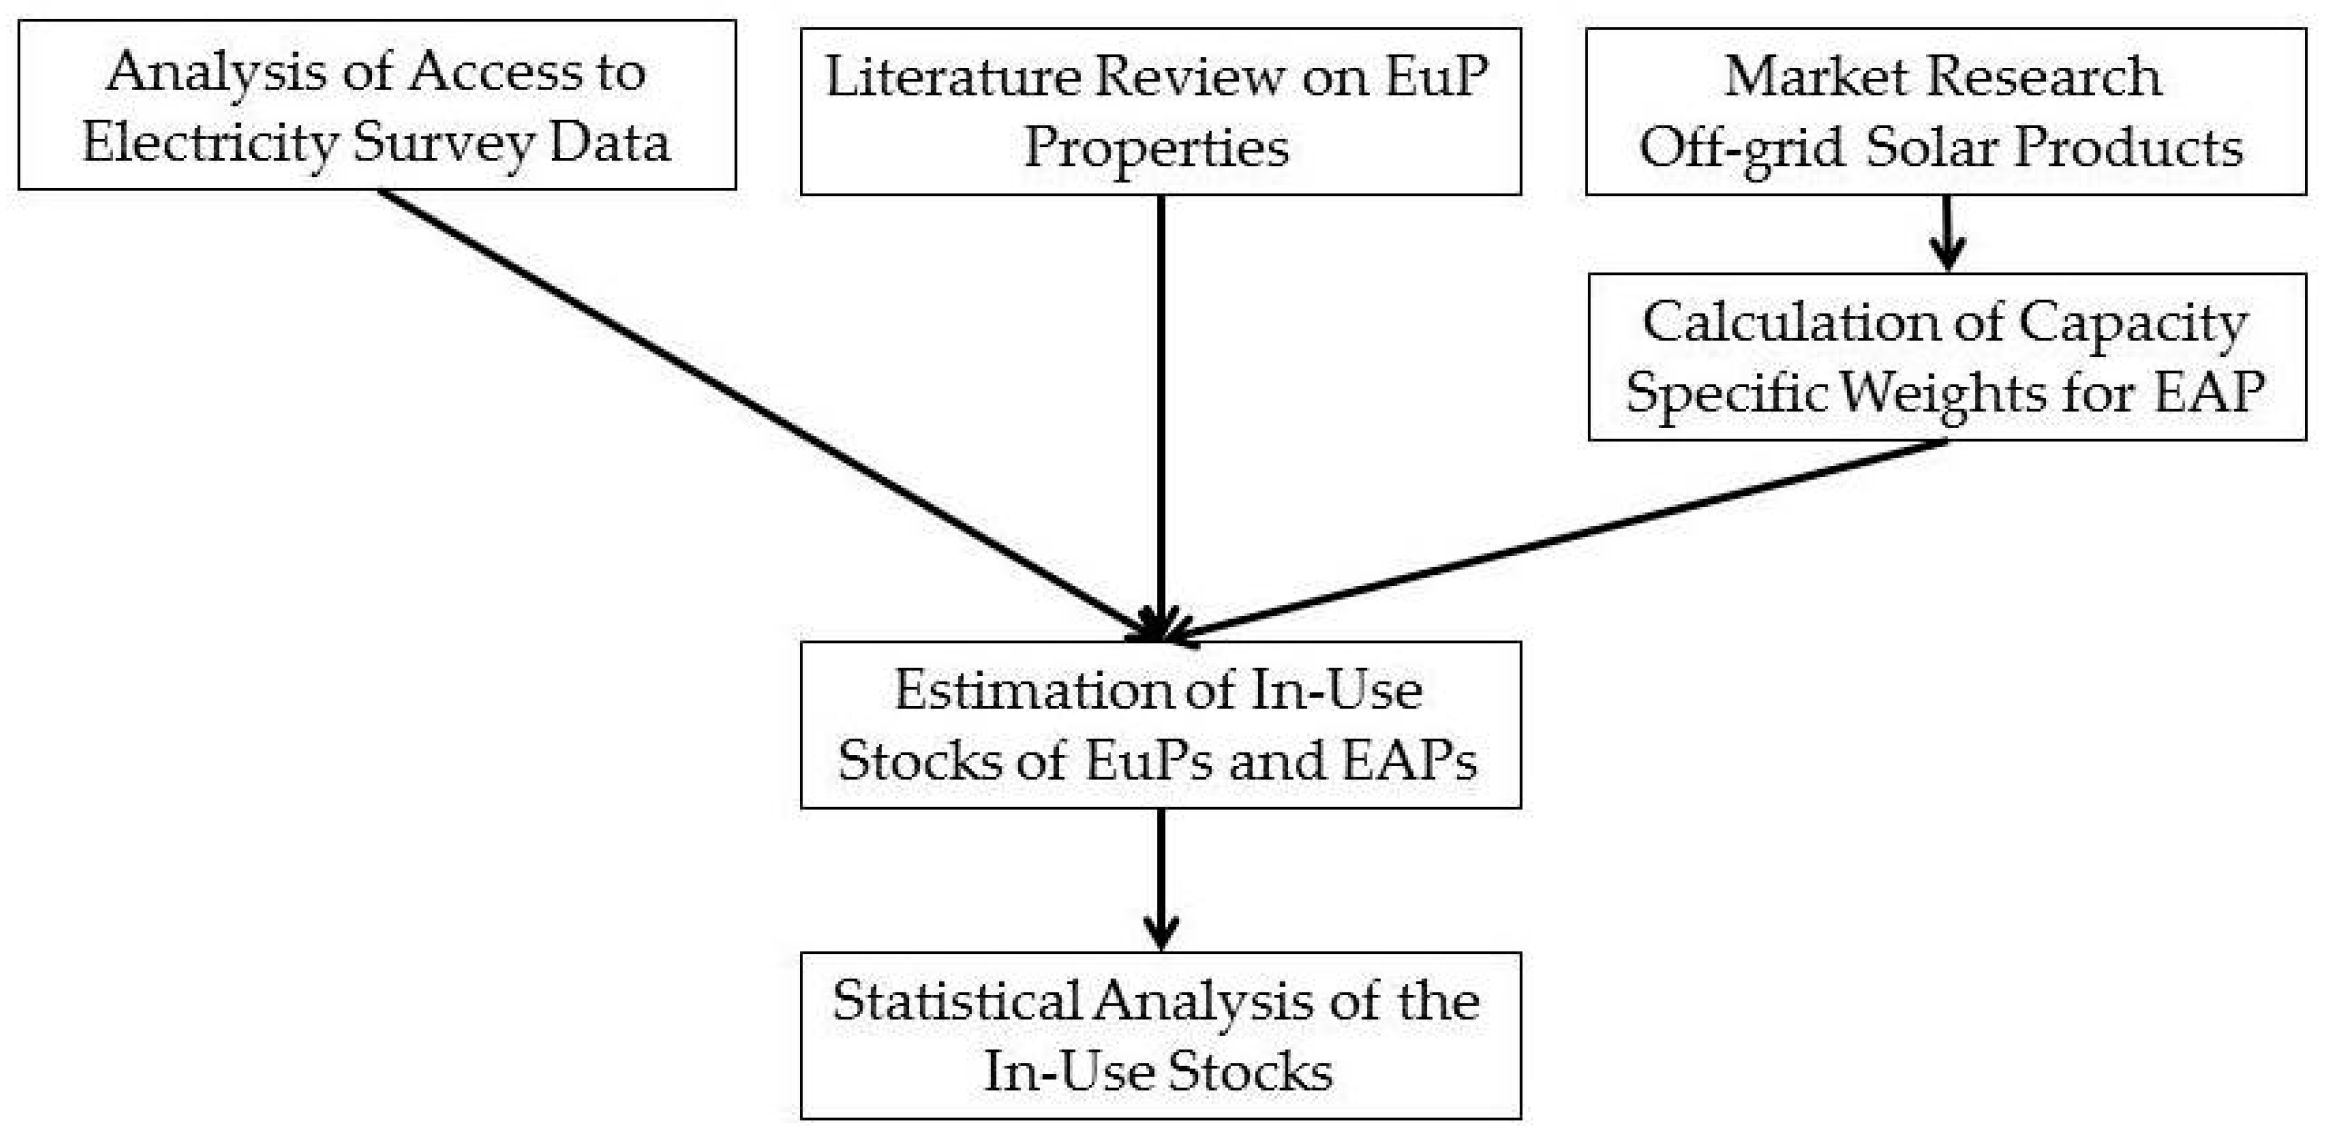
3.1. Methodological Approach and Research Design
3.2. Used Dataset: Access-to-Electricity Survey in Rural Bangladesh
3.3. Data Collection Weights of EEE and Categorization and Characterization for Off-Grid Solar Products
3.4. Calculation of the In-Use Stocks of EEE and Off-Grid Solar Products
3.5. Statistical Analysis
4. Results
4.1. Household Possession
4.1.1. Household Possession of EuPs and EAPs
4.1.2. Household Possession of EuPs Based on the Demographic and Health Surveys
4.2. Material Properties of Off-Grid Solar Products
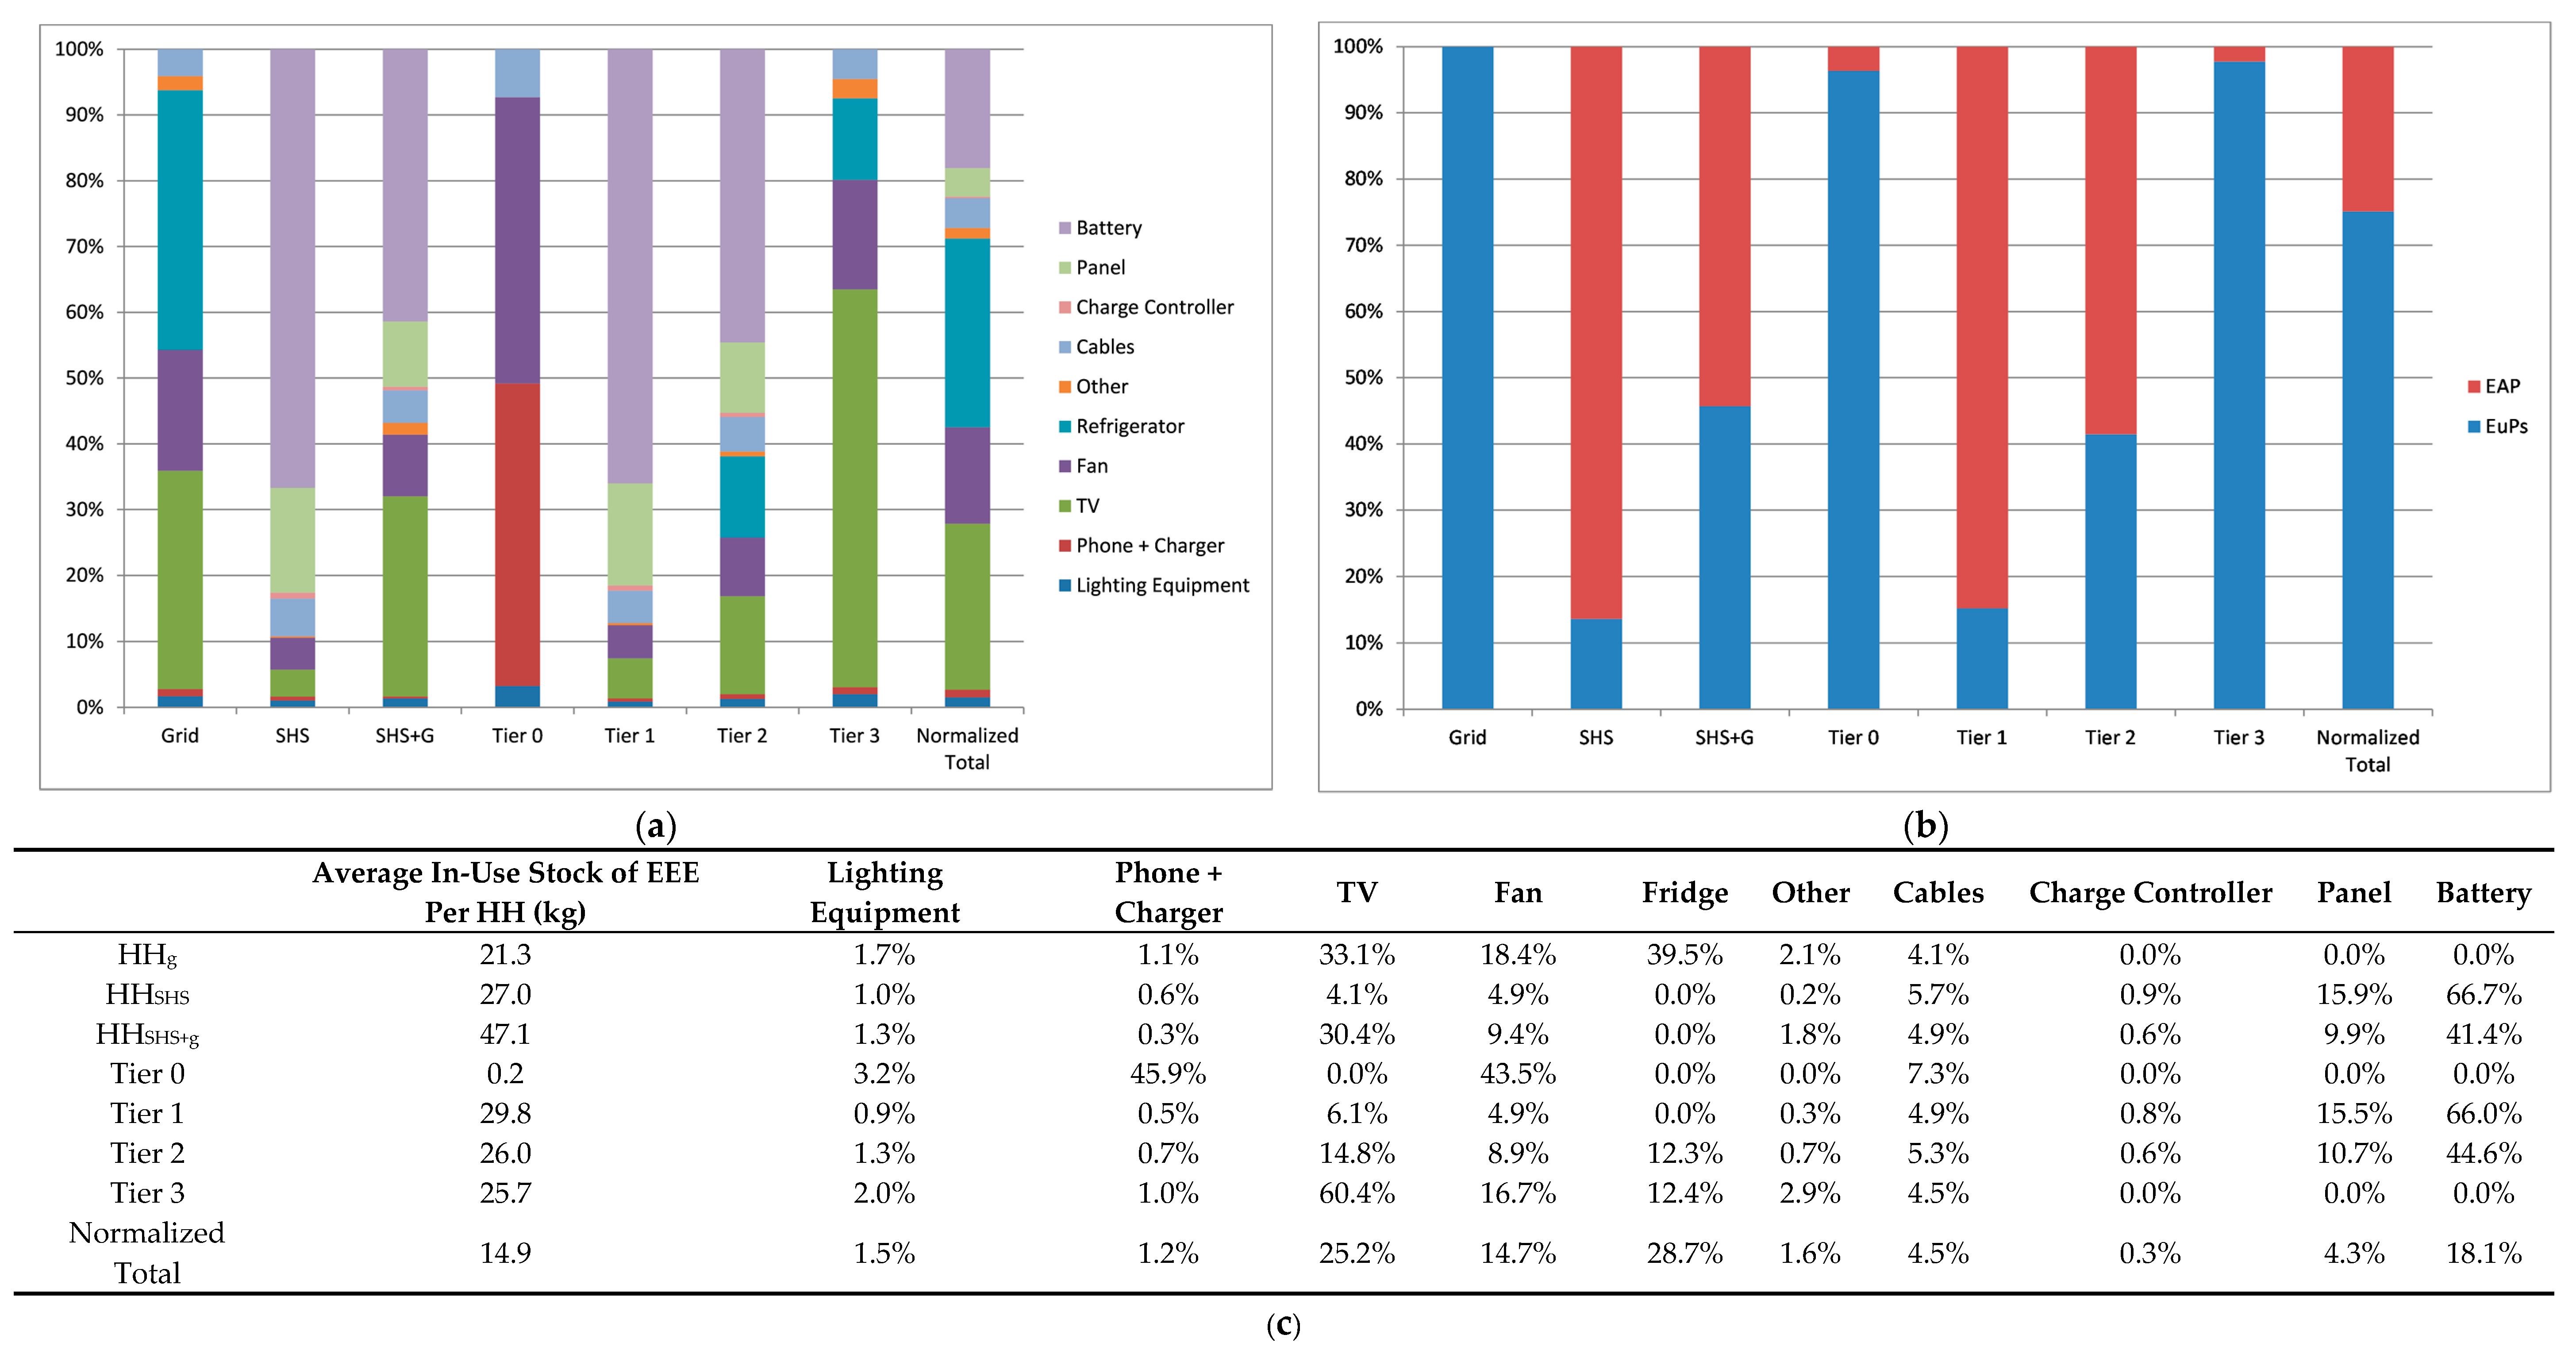
4.3. In-Use Stocks of EuPs and EAPs
4.4. Statistical Analysis of the In-Use Stocks Calculations
4.4.1. Analysis of the In-Use Stocks Composition
4.4.2. Sensitivity Analysis of the Results
5. Discussion
5.1. Dimension of the SHS Program for Stocks and Flows of EEE in Bangladesh
5.2. Waste Categorization for Off-Grid Solar Products
5.3. The Owner Perspective of Nonfunctional EuPSHS and EAPs as E-Waste
5.4. Limitations of the Research and the Methodology
6. Conclusions and Outlook
Supplementary Materials
Acknowledgments
Author Contributions
Conflicts of Interest
Abbreviation
| EAP | Energy Access Product |
| EEE | Electrical and Electronic Equipment |
| ESMAP | Energy Sector Management Assistance Program (World Bank) |
| EuP | Electricity-using Product |
| EUPg | Electricity-using Product, found in a grid-connected household |
| EUPSHS | Electricity-using Product found in a Solar Home System household |
| GDP | Gross Domestic Product |
| HH | Household |
| HHg | Household having grid connection |
| HHo | Household not having access to electricity |
| HHSHS | Household possessing a Solar Home System |
| HHSHS+g | Household having grid connection and a Solar Home System |
| IEAG | Independent Expert Advisory Group on a Data Revolution for Sustainable Development |
| LCD | Liquid Cristal Diode |
| LED | Light Emitting Diode |
| MDG | Millennium Development Goal |
| MFA | Material Flow Analysis |
| MTF | Multitier Framework |
| PV | Photovoltaic |
| SDG | Sustainable Development Goal |
| SHS | Solar Home System |
| STEP | Solving the E-waste Problem Initiative |
| UNEP | United Nations Environment Programme |
| UNU | United Nations University |
| WEEE | Waste Electrical and Electronic Equipment |
References
- Thomas Edison Rutgers School of Arts and Sciences. Available online: http://edison.rutgers.edu/latimer/tae1.htm (accessed on 13 October 2016).
- World Bank. World Bank Global Tracking Framework 2017: Progress Towards Sustainable Energy; World Bank: Washington, DC, USA, 2017. [Google Scholar]
- Ki-moon, B. Our Vision | Sustainable Energy for All (SEforALL). Available online: http://se4all.org/our-vision (accessed on 13 October 2016).
- United Nations Economic and Social Council. Progress towards the Sustainable Development Goals; UN Report of the Secretary-General; E/2016/75; United Nations Economic and Social Council: New York, NY, USA, 2016. [Google Scholar]
- Bensch, G.; Peters, J.; Sievert, M. The lighting transition in rural Africa—From kerosene to battery-powered LED and the emerging disposal problem. Energy Sustain. Dev. 2017, 39, 13–20. [Google Scholar] [CrossRef]
- Mills, E.; Tracy, J.L.; Alstone, P.; Jacobson, A.; Avato, P. Low-cost LED flashlights and market spoiling in Kenya’s off-grid lighting market. Energy Effic. 2014, 1–15. [Google Scholar] [CrossRef]
- Bazilian, M.; Nussbaumer, P.; Rogner, H.-H.; Brew-Hammond, A.; Foster, V.; Pachauri, S.; Williams, E.; Howells, M.; Niyongabo, P.; Musaba, L.; et al. Energy access scenarios to 2030 for the power sector in sub-Saharan Africa. Util. Policy 2012, 20, 1–16. [Google Scholar] [CrossRef]
- International Energy Agency. IEA World Energy Outlook 2016; International Energy Agency: Paris, France, 2016. [Google Scholar]
- Organisation for Economic Co-operation and Development (OECD)//IEA. Enery for All. Financing Access for the Poor. Special Early Excerpt of the World Energy Outlook 2011; OECD/IEA: Paris, France, 2011. [Google Scholar]
- Pachauri, S.; van Ruijven, B.J.; Nagai, Y.; Riahi, K.; van Vuuren, D.P.; Brew-Hammond, A.; Nakicenovic, N. Pathways to achieve universal household access to modern energy by 2030. Environ. Res. Lett. 2013, 8, 024015. [Google Scholar] [CrossRef]
- Palit, D. Solar energy programs for rural electrification: Experiences and lessons from South Asia. Energy Sustain. Dev. 2013, 17, 270–279. [Google Scholar] [CrossRef]
- Sadeque, Z.; Rysankova, D.; Elahi, R.; Soni, R. Scaling Up Access to Electricity: The Case of Bangladesh; Live Wire 2014; World Bank: Washington, DC, USA, 2014. [Google Scholar]
- Global Leap. The State of the Off-Grid Appliance Market; U.S. Department of Energy—Global Lighting and Energy Access Partnership (Global LEAP): Washington, DC, USA, 2016. [Google Scholar]
- Feron, S. Sustainability of Off-Grid Photovoltaic Systems for Rural Electrification in Developing Countries: A Review. Sustainability 2016, 8, 1326. [Google Scholar] [CrossRef]
- REN21 Secretariat. Renewables 2016 Global Status Report; REN21 Secretariat: Paris, France, 2016. [Google Scholar]
- Sovacool, B.K.; Bazilian, M.; Toman, M. Paradigms and poverty in global energy policy: Research needs for achieving universal energy access. Environ. Res. Lett. 2016, 11, 064014. [Google Scholar] [CrossRef]
- Herat, S.; Agamuthu, P. E-waste: A problem or an opportunity? Review of issues, challenges and solutions in Asian countries. Waste Manag. Res. 2012, 30, 1113–1129. [Google Scholar] [CrossRef] [PubMed]
- European Parliament and the Council of the European Union. Proceedings of the Directive 2012/19/EU of the European Parliament and of the council of 4 July 2012 on Waste Electrical and Electronic Equipment (WEEE), Brussels, Belgium, 2012.
- Graedel, T.E. Metal Stocks in Society—Scientific Synthesis; UNEP: New York, NY, USA, 2010. [Google Scholar]
- Schluep, M.; Müller, E.; Hilty, L.; Ott, D.; Widmer, R.; Böni, H. Insights from a decade of development cooperation in e-waste management. In Proceedings of the ICT4S—First International Conference on Information and Communication Technologies for Sustainability, Zürich, Switzerland, 12–14 February 2013; pp. 223–230. [Google Scholar] [CrossRef]
- ESMAP, Beyond Connections Energy Access Redefined, 2015. Available online: http://www.sun-connect-news.org/fileadmin/DATEIEN/Dateien/New/Beyond_Connections_Energy_Access_Redefined_Exec_ESMAP_2015.pdf (accessed on 22 July 2015).
- United Nations Secretary-General’s Independent Expert Advisory Group on a Data Revolution for Sustainable Development. A World That Counts—Mobilising the Data Revolution for Sustainable Development. Available online: http://www.undatarevolution.org/wp-content/uploads/2014/12/A-World-That-Counts2.pdf (accessed on 12 December 2017).
- Groh, S.; Pachauri, S.; Narasimha, R. What are we measuring? An empirical analysis of household electricity access metrics in rural Bangladesh. Energy Sustain. Dev. 2016, 30, 21–31. [Google Scholar] [CrossRef]
- Jain, A.; Ray, S.; Ganesan, K.; Aklin, M.; Cheng, C.-Y.; Urpelainen, J. Access to Clean Cooking Energy and Electricity—Survey of States—CEEW ACCESS Report September 2015; Council on Energy, Environment and Water: New Delhi, India, 2015. [Google Scholar]
- Lighting Global. Eco Design Notes. Available online: https://www.lightingglobal.org/resources/eco-design-notes/ (accessed on 20 November 2016).
- GOGLA (Global Off-Grid Lighting Assosciation). Gogla Industry Opinion on Lifecycle and Recycling. Available online: http://global-off-grid-lighting-association.org/sites/www.gogla.org/files/recource_docs/gogla-industry-opinion-on-lifecycle-and-recycling1.pdf (accessed on 20 September 2016).
- Schützeichel, H. No Grid—No Problem. Available online: http://sun-connect-news.org/fileadmin/DATEIEN/Dateien/New/No-grid-no-problem_onlineversion.pdf (accessed on 20 September 2016).
- GOGLA. Lighting Global Conference Report—4th International Off-Grid Lighting Conference and Exhibition. In Proceedings of the 4th International Off-Grid Lighting Conference and Exhibition, Dubai, UAE, 26–29 October 2015. [Google Scholar]
- Magalini, F.; Sinha-Khetriwal, D.; Rochat, D.; Huismann, J.; Munyambu, S.; Oliech, J.; Chidiabsu, I.; Mbera, O. Electronic Waste (e-Waste) Impacts and Mitigation Options in the Off-Grid Renewable Energy Sector; Evidence on Demand: London, UK, 2016. [Google Scholar]
- Balde, C.P.; Kuehr, R.; Blumenthal, K.; Gill, S.F.; Kern, M.; Micheli, P.; Magpantay, E.; Huisman, J. E-Waste Statistics: Guidelines on Classifications, Reporting and Indicators; United Nations University: Bonn, Germany, 2015; ISBN 978-92-8-084554-9. [Google Scholar]
- STEP. Solving the E-Waste Problem Initiative, One Global Definition of E-Waste. Available online: http://www.step-initiative.org/files/step/_documents/StEP_WP_One%20Global%20Definition%20of%20E-waste_20140603_amended.pdf (accessed on 10 March 2017).
- Wang, F.; Huisman, J.; Baldé, K.; Stevels, A. A systematic and compatible classification of WEEE. In Proceedings of the 2012 Electronics Goes Green 2012+, Berlin, Germany, 9–12 September 2012; pp. 1–6. [Google Scholar]
- UNEP. Call for Global Action on E-waste—United Nations Environment Programme (UNEP). Available online: http://www.unep.org/Documents.Multilingual/Default.asp?ArticleID=5447&DocumentID=496&l=en (accessed on 23 November 2016).
- Robinson, B.H. E-waste: An assessment of global production and environmental impacts. Sci. Total Environ. 2009, 408, 183–191. [Google Scholar] [CrossRef] [PubMed]
- Baldé, C.P.; Wang, F.; Kuehr, R.; Huisman, J. The Global e-Waste Monitor—2014; United Nations University, IAS–SCYCLE: Bonn, Germany, 2015. [Google Scholar]
- Cucchiella, F.; D’Adamo, I.; Lenny Koh, S.C.; Rosa, P. Recycling of WEEEs: An economic assessment of present and future e-waste streams. Renew. Sustain. Energy Rev. 2015, 51, 263–272. [Google Scholar] [CrossRef]
- Liu, W.; Chen, L.; Tian, J. Uncovering the Evolution of Lead In-Use Stocks in Lead-Acid Batteries and the Impact on Future Lead Metabolism in China. Environ. Sci. Technol. 2016, 50, 5412–5419. [Google Scholar] [CrossRef] [PubMed]
- IRENA and IEA-PVPS. End-of-Life Management: Solar Photovoltaic Panels; International Renewable Energy Agency: Abu Dhabi, UAE; International Energy Agency Photovoltaic Power Systems: St. Ursen, Switzerland, 2016. [Google Scholar]
- Ongondo, F.O.; Williams, I.D.; Cherrett, T.J. How are WEEE doing? A global review of the management of electrical and electronic wastes. Waste Manag. 2011, 31, 714–730. [Google Scholar] [CrossRef] [PubMed]
- Widmer, R.; Oswald-Krapf, H.; Sinha-Khetriwal, D.; Schnellmann, M.; Böni, H. Global perspectives on e-waste. Environ. Impact Assess. Rev. 2005, 25, 436–458. [Google Scholar] [CrossRef]
- Hamouda, K.; Adjroudi, R.; Rotter, V.S.; Wang, F. Methodology for WEEE assessment in Algeria. Int. J. Environ. Stud. 2017, 74, 568–585. [Google Scholar] [CrossRef]
- Sepúlveda, A.; Schluep, M.; Renaud, F.G.; Streicher, M.; Kuehr, R.; Hagelüken, C.; Gerecke, A.C. A review of the environmental fate and effects of hazardous substances released from electrical and electronic equipments during recycling: Examples from China and India. Environ. Impact Assess. Rev. 2010, 30, 28–41. [Google Scholar] [CrossRef]
- Heacock, M.; Kelly, C.B.; Asante, K.A.; Birnbaum, L.S.; Bergman, Å.L.; Bruné, M.-N.; Buka, I.; Carpenter, D.O.; Chen, A.; Huo, X.; et al. E-Waste and Harm to Vulnerable Populations: A Growing Global Problem. Environ. Health Perspect. 2016, 124, 550–555. [Google Scholar] [CrossRef] [PubMed]
- Graedel, T.E.; Allwood, J.; Birat, J.-P.; Buchert, M.; Hagelüken, C.; Reck, B.K.; Sibley, S.F.; Sonnemann, G. What Do We Know About Metal Recycling Rates? J. Ind. Ecol. 2011, 15, 355–366. [Google Scholar] [CrossRef]
- Wang, F.; Huisman, J.; Stevels, A.; Balde, C.P. Enhancing e-waste estimates: Improving data quality by multivariate Input-Output Analysis. Waste Manag. 2013, 33, 2397–2407. [Google Scholar] [CrossRef] [PubMed]
- Araújo, M.G.; Magrini, A.; Mahler, C.F.; Bilitewski, B. A model for estimation of potential generation of waste electrical and electronic equipment in Brazil. Waste Manag. 2012, 32, 335–342. [Google Scholar] [CrossRef] [PubMed]
- Oguchi, M.; Kameya, T.; Yagi, S.; Urano, K. Product flow analysis of various consumer durables in Japan. Resour. Conserv. Recycl. 2008, 52, 463–480. [Google Scholar] [CrossRef]
- Yu, J.; Williams, E.; Ju, M.; Yang, Y. Forecasting Global Generation of Obsolete Personal Computers. Environ. Sci. Technol. 2010, 44, 3232–3237. [Google Scholar] [CrossRef] [PubMed]
- Kumar, A.; Holuszko, M.; Espinosa, D.C.R. E-waste: An overview on generation, collection, legislation and recycling practices. Resour. Conserv. Recycl. 2017, 122, 32–42. [Google Scholar] [CrossRef]
- Oguchi, M.; Terazono, A.; Masaaki, F. Future Generation of WEEE in Developing Countries: An Estimation Model and Case Studies in Asia. In Proceedings of the Electronic Goes Green 2016+; Technische Universität Berlin: Berlin, Germany, 2016. [Google Scholar]
- Kahhat, R.; Williams, E. Materials flow analysis of e-waste: Domestic flows and exports of used computers from the United States. Resour. Conserv. Recycl. 2012, 67, 67–74. [Google Scholar] [CrossRef]
- Steubing, B.; Böni, H.; Schluep, M.; Silva, U.; Ludwig, C. Assessing computer waste generation in Chile using material flow analysis. Waste Manag. 2010, 30, 473–482. [Google Scholar] [CrossRef] [PubMed]
- Andarani, P.; Goto, N. Potential e-waste generated from households in Indonesia using material flow analysis. J. Mater. Cycles Waste Manag. 2013, 16, 306–320. [Google Scholar] [CrossRef]
- Streicher-Porte, M.; Bader, H.-P.; Scheidegger, R.; Kytzia, S. Material flow and economic analysis as a suitable tool for system analysis under the constraints of poor data availability and quality in emerging economies. Clean Technol. Environ. Policy 2007, 9, 325–345. [Google Scholar] [CrossRef]
- Chancerel, P.; Rotter, S. Recycling-oriented characterization of small waste electrical and electronic equipment. Waste Manag. 2009, 29, 2336–2352. [Google Scholar] [CrossRef] [PubMed]
- Lam, C.W.; Lim, S.-R.; Schoenung, J.M. Linking Material Flow Analysis with Environmental Impact Potential. J. Ind. Ecol. 2013, 17, 299–309. [Google Scholar] [CrossRef]
- Agamuthu, P.; Kasapo, P.; Mohd Nordin, N.A. E-waste flow among selected institutions of higher learning using material flow analysis model. Resour. Conserv. Recycl. 2015, 105 Pt A, 177–185. [Google Scholar] [CrossRef]
- Lau, W.K.-Y.; Chung, S.-S.; Zhang, C. A material flow analysis on current electrical and electronic waste disposal from Hong Kong households. Waste Manag. 2013, 33, 714–721. [Google Scholar] [CrossRef] [PubMed]
- Mishima, K.; Rosano, M.; Mishima, N.; Nishimura, H. End-of-Life Strategies for Used Mobile Phones Using Material Flow Modeling. Recycling 2016, 1, 122. [Google Scholar] [CrossRef]
- Schillebeeckx, S.J.D.; Parikh, P.; Bansal, R.; George, G. An integrated framework for rural electrification: Adopting a user-centric approach to business model development. Energy Policy 2012, 48, 687–697. [Google Scholar] [CrossRef]
- Durlinger, B.; Reinders, A.; Toxopeus, M. A comparative life cycle analysis of low power PV lighting products for rural areas in South East Asia. Renew. Energy 2012, 41, 96–104. [Google Scholar] [CrossRef]
- Alstone, P.; Lai, P.; Mills, E.; Jacobson, A. High Life Cycle Efficacy Explains Fast Energy Payback for Improved Off-Grid Lighting Systems. J. Ind. Ecol. 2014, 18, 722–733. [Google Scholar] [CrossRef]
- Stojanovski, O.; Thurber, M.; Wolak, F. Rural energy access through solar home systems: Use patterns and opportunities for improvement. Energy Sustain. Dev. 2017, 37, 33–50. [Google Scholar] [CrossRef]
- Emili, S.; Ceschin, F.; Harrison, D. Product–Service System applied to Distributed Renewable Energy: A classification system, 15 archetypal models and a strategic design tool. Energy Sustain. Dev. 2016, 32, 71–98. [Google Scholar] [CrossRef]
- Batteiger, A. Off-Grid Electrification and its Impacts on the Waste Management System—The Case of Bangladesh. Available online: http://www.ucl.ac.uk/steapp/isngi/proceedings (accessed on 1 February 2016).
- IRENA (International Renewable Energy Agency). Renewable Energy and Jobs—Annual Review 2016. Available online: http://www.irena.org/rejobs.pdf (accessed on 23 March 2016).
- Alstone, P.; Gershenson, D.; Kammen, D.M. Decentralized energy systems for clean electricity access. Nat. Clim. Chang. 2015, 5, 305–314. [Google Scholar] [CrossRef]
- IDCOL (Infrastructure and Development Company Limited). Dhaka. Bangladesh. Available online: http://www.idcol.org/old/bd-map/bangladesh_map/ (accessed on 6 August 2016).
- IRENA. Renewable Capacity Statistics 2017; International Renewable Energy Agency: Abu Dhabi, UAE, 2017. [Google Scholar]
- National Institute of Population Research and Training (NIPORT); Mitra and Associates; ICF International. Bangladesh Demographic and Health Survey 2014; NIPORT: Dhaka, Bangladesh; Mitra and Associates: Dhaka, Bangladesh; ICF International: Rockville, MD, USA, 2016.
- IDCOL. IDCOL SHS Installation under RE Program. Available online: http://www.webcitation.org/6qS3DqlMD (accessed on 14 May 2017).
- World Bank Database. Available online: http://data.worldbank.org (accessed on 13 March 2017).
- Department of Environment. National 3R-Strategy for Waste Management 2010; Department of Environment: Dhaka, Bangladesh, 2010.
- IDCOL. Infrastructure and Development Company Limited. Rural Electrification and Renewable Energy Development Project II—Updated Environmental and Social Management Framework 2014. Available online: http://idcol.org/download/e26ae795489e5b7351aed40e044553a2.pdf (accessed on 18 August 2015).
- Environment and Social Development Organization (ESDO). Magnitude of the Flow of E-waste in Bangladesh. Dhaka, Bangladesh, 2016. [Google Scholar]
- Lepawsky, J.; Billah, M. Making Chains That (un)make Things: Waste–Value Relations and the Bangladeshi Rubbish Electronics Industry. Geogr. Ann. Ser. B Hum. Geogr. 2011, 93, 121–139. [Google Scholar] [CrossRef]
- Lepawsky, J.; Connolly, C. A crack in the facade? Situating Singapore in global flows of electronic waste. Singap. J. Trop. Geogr. 2016, 37, 158–175. [Google Scholar] [CrossRef]
- Alam, M.; Bahauddin, K.M. E-Waste In Bangladesh: Evaluating The Situation, Legislation And Policy And Way Forward With Strategy And Approach. Present Environ. Sustain. Dev. 2015, 9, 25–46. [Google Scholar] [CrossRef]
- Sthiannopkao, S.; Wong, M.H. Handling e-waste in developed and developing countries: Initiatives, practices, and consequences. Sci. Total Environ. 2013, 463–464, 1147–1153. [Google Scholar] [CrossRef] [PubMed]
- Ahmed, S. Measuring the Willingness to Pay for Hazard-Free e-Waste Management in Dhaka city, Bangladesh. Available online: http://www.eldis.org/go/topics&id=61003&type=Document#.WMBeS_ItKkQ (accessed on 8 March 2017).
- Islam, M.T.; Abdullah, A.B.; Shahir, S.A.; Kalam, M.A.; Masjuki, H.H.; Shumon, R.; Rashid, M.H. A public survey on knowledge, awareness, attitude and willingness to pay for WEEE management: Case study in Bangladesh. J. Clean. Prod. 2016, 137, 728–740. [Google Scholar] [CrossRef]
- National Institute of Population Research and Training (NIPORT); Mitra and Associates; ORC Macro. Bangladesh Demographic and Health Survey 2011; National Institute of Population Research and Training: Dhaka, Bangladesh; Mitra and Associates: Dhaka, Bangladesh; ORC Macro: Calverton, MD, USA, 2013.
- National Institute of Population Research and Training (NIPORT); Mitra and Associates; ORC Macro. Bangladesh Demographic and Health Survey 2007; National Institute of Population Research and Training: Dhaka, Bangladesh; Mitra and Associates: Dhaka, Bangladesh; ORC Macro: Calverton, MD, USA, 2009.
- National Institute of Population Research and Training (NIPORT); Mitra and Associates; ORC Macro. Bangladesh Demographic and Health Survey 2004; National Institute of Population Research and Training: Dhaka, Bangladesh; Mitra and Associates: Dhaka, Bangladesh; ORC Macro: Calverton, MD, USA, 2005.
- Oguchi, M.; Murakami, S.; Sakanakura, H.; Kida, A.; Kameya, T. A preliminary categorization of end-of-life electrical and electronic equipment as secondary metal resources. Waste Manag. 2011, 31, 2150–2160. [Google Scholar] [CrossRef] [PubMed]
- IDCOL. Infrastructure Development Company. Technical Specifications for Solar Home System (SHS) 2017. Available online: http://idcol.org/download/d31327d6638937dfd2c8a81ea1e35f37.pdf (accessed on 23 March 2017).
- Batteiger, A. Towards a Waste Management System for Solar Home Systems in Bangladesh. In Decentralized Solutions for Developing Economies; Groh, S., Straeten, J., van der Lasch, B.E., Gershenson, D., Filho, W.L., Kammen, D.M., Eds.; Springer Proceedings in Energy, Springer International Publishing: Berlin/Heidelberg, Germany, 2015; pp. 133–140. ISBN 978-33-1-915963-8. [Google Scholar]
- Asaduzzaman; Yunus, M.; Haque, A.K.E.; Abdul Malek Azad, A.; Neelormi, S.; Hossain, A. Power from the Sun: An Evaluation of Institutional Effectiveness and Impact of Solar Home Systems in Bangladesh; World Bank: Washington, DC, USA, 2013. [Google Scholar]
- Magalini Frederico. (W)EEE Mass balance and market structure in Belgium—2011. Available online: http://www.weee-forum.org/system/files/documents/2011_weee_mass_balance_and_market_structure_in_belgium.pdf (accessed on 26 March 2017).
- Smartflower. Available online: https://www.smartflower.com/assets/smartflowerpop-en-8735aa9c879acc510f78f92a16d489e7.pdf (accessed on 21 March 2017).
- UNU-IAS SCYCLE. Solving the E-waste Problem. E-waste World Map—Overview Bangladesh. Available online: http://www.step-initiative.org/Overview_Bangladesh.html (accessed on 31 March 2017).
- Islam, F. Battery Recycling Arrangements under IDCOL’s Off-Grid Solar Home Systems Program. Available online: https://de.scribd.com/doc/134607480/Battery-Recycling-Arrangements-under-IDCOL-s-Off-grid-Solar-Home-Systems-Program-Formanul-Islam (accessed on 23 March 2016).
- IDCOL (Infrastructure Development Company Limited). Half-Yearly Report (January–June 2016) on Warranty Expired Battery Collection and New Battery Distribution under IDCOL’s SHS Program; IDCOL: Dhaka, Bangladesh, 2016. [Google Scholar]


| n | Min (kg) | First Quartile (kg) | Median (kg) | Third Quartile (kg) | Max (kg) | |
|---|---|---|---|---|---|---|
| Total | 231 | 0.1 | 0.1 | 14.1 | 28.2 | 182.1 |
| HH0 | 54 | 0.1 | 0.1 | 0.1 | 0.1 | 0.1 |
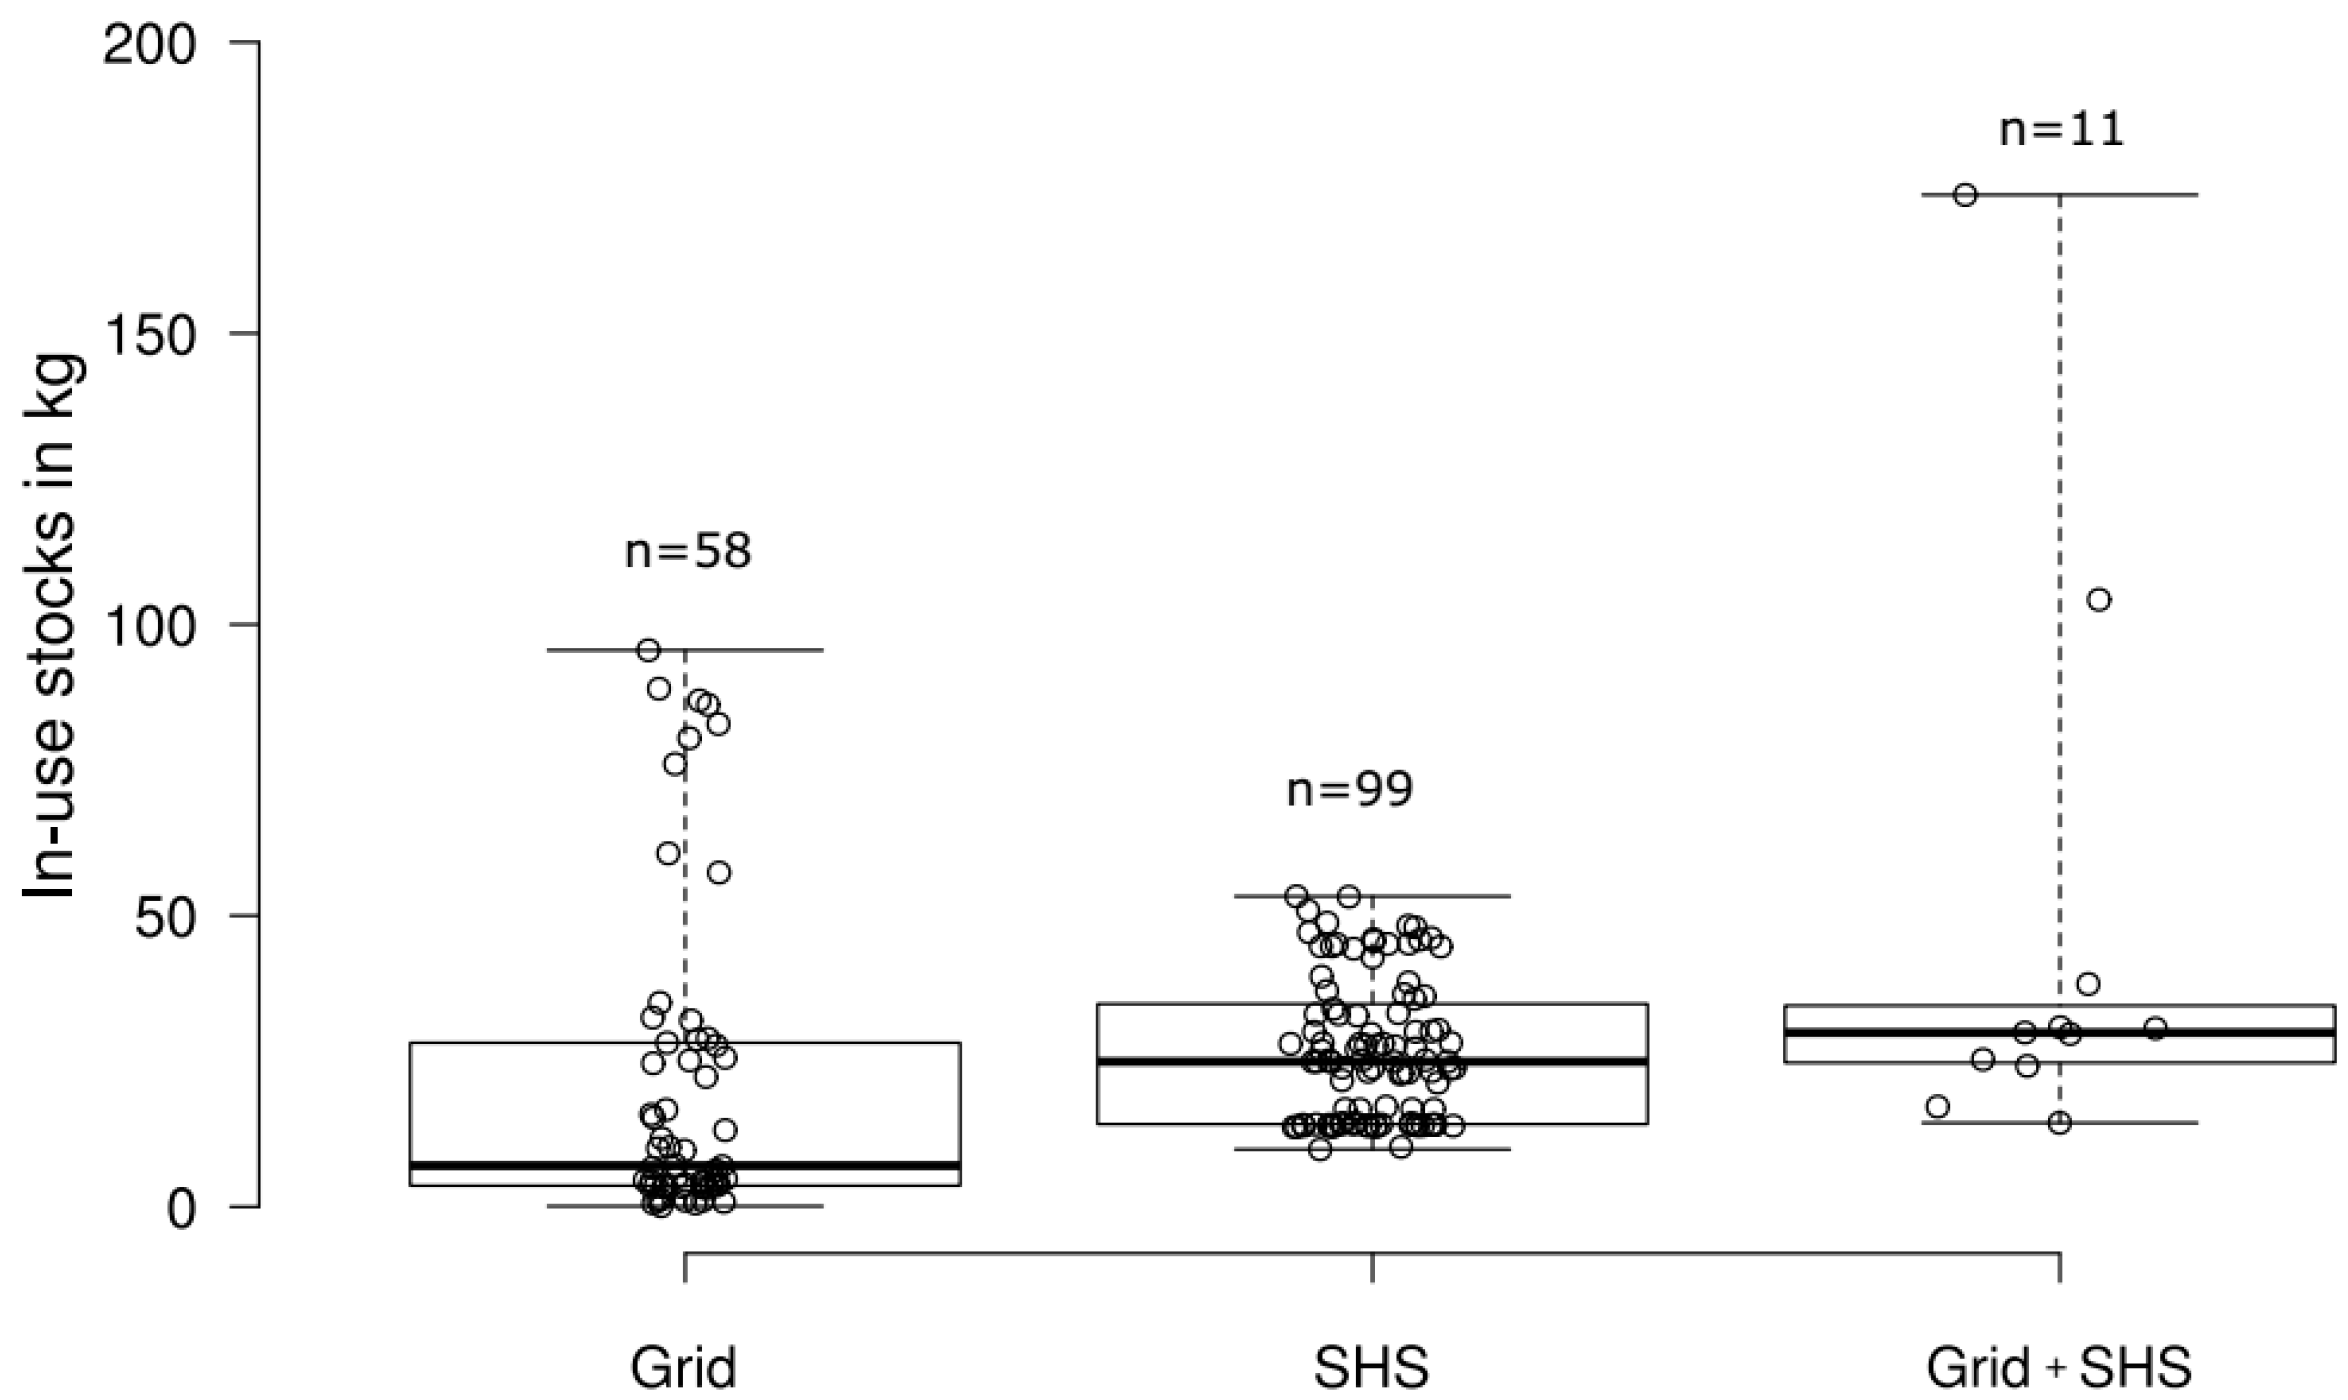
| HHSHS | 99 | 9.9 | 14.2 | 25.1 | 35.7 | 53.3 |
| HHg | 58 | 0.1 | 3.6 | 7.1 | 28.2 | 95.6 |
| HHSHS+g | 11 | 14.4 | 24.7 | 29.9 | 34.5 | 173.8 |
| Other (incl. Diesel) * | 10 | - | - | - | - | 182.1 (n = 1) |

| Type of Household | HHSHS | HHg | HH0 | All HH |
|---|---|---|---|---|
| Electricity-Using Products (EuPs) | EuPSHS | EuPg | EuP0 | EuP |
| Energy Access Products (EAPs) | EAP | - | - | - |
| All Products (EuPs + EAPs) | Off-Grid Solar Products | - | - | Electrical and Electronic Equipment (EEE) |
| Tier 0 | Tier 1 | Tier 2 | Tier 3 | Tier 4 | Tier 5 | |
|---|---|---|---|---|---|---|
| Power | - | Very Low Power Min. 3 W | Low Power Min. 50 W | Medium Power Min. 200 W | High Power Min. 800 W | Very High Power Min. 2 kW |
| AND Daily Capacity | Min. 12 Wh | Min. 200 Wh | Min. 1.0 kWh | Min. 2.4 kWh | Min. 8.2 kWh | |
| OR Services | Not applicable | Task lighting, phone charging | General lighting, TV, fan (if needed) | Tier 2 AND any medium-power appliances | Tier 3 AND any high-power appliances | Tier 4 AND any very high-power appliances |
| Indicator | Bangladesh | Germany |
|---|---|---|
| Population (million) | 160.9 | 81.4 |
| Urban Population (%) | 34 | 75 |
| Land Area (km2) | 130,170 | 348,540 |
| Population Density (people per km2) | 1237 | 234 |
| GDP (current Billion US$) | 195.1 | 3363.4 |
| GDP per Capita (current US$) | 1211 | 41,313 |
| Access to Electricity in 2014 rural/urban/total (in %) | 51/91/62 | Universal |
| Electric Power Consumption in 2013 (kWh per capita) | 293 | 7019 |
| Household Possession of EuPs (at Least One) | No-Electricity (n = 54) | SHS (Excl. SHS + Grid) (n = 99) | Grid (Excl. SHS + Grid) (n = 58) | SHS + Grid (n = 11) | Other (n = 10) | Normalized |
|---|---|---|---|---|---|---|
| Electrical Lighting | - | 100% | 100% | 100% | 50% | 66% |
| Mobile Phone | 100% | 100% | 100% | 100% | 100% | 100% |
| Phone Charger | - | 41% | 58% | 81% | 10% | 36% |
| Black and White TV | - | 11% | 2% | 9% | - | 4% |
| Color TV | - | 1% | 30% | 18% | 10% | 16% |
| Electric Fan | - | 41% | 78% | 81% | 30% | 46% |
| Computer | - | - | 5% | - | - | 3% |
| Refrigerator | - | - | 15% | - | - | 8% |
| Hair Dryer | - | - | 3% | - | - | 2% |
| Rice Cooker | - | - | 3% | - | - | 2% |
| Iron | - | - | 5% | - | - | 3% |
| Sound Box | - | - | 3% | - | - | 2% |
| Households Possessing EuPs (%) | Residence | Total | ||||||||||
|---|---|---|---|---|---|---|---|---|---|---|---|---|
| Urban | Rural | |||||||||||
| Year | 2004 | 2007 | 2011 | 2014 | 2004 | 2007 | 2011 | 2014 | 2004 | 2007 | 2011 | 2014 |
| Radio | 36.5 | 25.2 | 6.9 | 3.2 | 28.6 | 23.3 | 8.7 | 3.6 | 30.4 | 23.7 | 8.2 | 3.5 |
| TV | 49.1 | 59.3 | 70.2 | 70.6 | 15.5 | 21.9 | 29.8 | 33.0 | 22.9 | 30.0 | 39.9 | 43.5 |
| Mobile Telephone | 15.6 * | 54.7 | 89.2 | 93.4 | 1.8 * | 25.3 | 74.8 | 86.7 | 4.8 * | 31.7 | 78.4 | 88.5 |
| Non-Mobile Telephone | 7.0 | 7.6 | 4.2 | 0.2 | 0.3 | 0.5 | 1.7 | 2.1 | 1.6 | |||
| Refrigerator | - | 24.8 | 35.6 | 40.6 | - | 2.5 | 6.2 | 12.3 | - | 7.3 | 13.5 | 20.2 |
| Electric Fan | - | - | 85.9 | 85.9 | - | - | 41.2 | 48.5 | - | - | 52.4 | 59.0 |
| DVD/VCD Player | - | - | 23.8 | 12.1 | - | - | 8.1 | 4.8 | - | - | 12.1 | 6.8 |
| Electric Cooking Equipment | - | - | 0.5 | 1.2 | - | - | 0.0 | 0.1 | - | - | 0.1 | 0.4 |
| IPS/Generator | - | - | - | 7.1 | - | - | - | 1.0 | - | - | - | 2.7 |
| Air Conditioning | - | - | - | 1.3 | - | - | - | 0.1 | - | - | - | 0.4 |
| Computer/Laptop | - | - | - | 11.8 | - | - | - | 2.4 | - | - | - | 5.1 |
| Off-Grid Solar Products | Electrical and Electronic Equipment (EEE) and EuPs | ||||||
|---|---|---|---|---|---|---|---|
| Average Weight (kg) | Category (35) | UNU-Key (35) | Average Weight (kg) (35) | Average Weight (kg) (75) | Average Weight (kg) (34) | Average Weight (kg) (85) | |
| Lighting (bulb only) | 0.07 | Lamps | 0501, 0502, 0503, 0505 | 0.1 | - | - | - |
| Lighting (bulb + shadowing + cable) | 0.36 | Lamps | 0501, 0502, 0503, 0505 (?) | 0.1 (?) | - | - | - |
| Charge Controller | 0.25 | Small equipment | 0002 (?) | ? | - | - | - |
| Fan | 2.7 | Small equipment | 0201 (?) | 0.8 | - | - | - |
| TV CRT | 8 | Screens | 0407 | 28.4 | 30 | 31 | |
| TV LED/LCD | 3.2 | Screens | 0408 | 14.3 | 15 | - | 7.9 |
| Radio | 0.68 | Small equipment | 0403 | 3.4 | - | 2 | 3.4 |
| Solar Lantern (<10 Wp) | 1.9 | Small equipment | (?) | ? | - | - | - |
| Refrigerator (<50 l) | 20.0 * | Cooling and freezing | 0108 | 54.1 | 100 | 35 | 61 |
| Panel Small SHS (15 Wp) | 1.9 ** | Large equipment | 0002 | 20 | - | - | - |
| Panel Medium SHS (50 Wp) | 4.7 ** | Large equipment | 0002 | 20 | - | - | - |
| Panel Large SHS (110 Wp) | 9.5 ** | Large equipment | 0002 | 20 | - | - | - |
| Battery Small SHS (20 Ah) | 8.1 ** | - | - | - | - | - | - |
| Battery Medium SHS (60 Ah) | 19.3 ** | - | - | - | - | - | - |
| Battery Large SHS (140 Ah) | 41.7 ** | - | - | - | - | - | - |
| Type of Access to Electricity | EuPs and EAPs |
|---|---|
| Grid | Refrigerator, TV, Fan |
| SHS | Battery, Panel, Cables |
| SHS + Grid | Battery, TV, Fan, Panel |
| Normalized | Refrigerator, TV, Battery, Fan |
| Scenario | HHg | HHSHS | Normalized HH |
|---|---|---|---|
| Excluding the biggest factor HHg (refrigerator) | −39.5% | - | −28.7% |
| Excluding the biggest factor HHSHS (lead acid-battery) | - | −66.7% | −18.1% |
| +10% biggest factor | 3.9% | 6.7% | 2.9% |
| +50% biggest factor | 19.7% | 33.4% | 14.3% |
| 50% possession of refrigerators in HHg | 92.1% | - | 66.9% |
| 50% possession of TVs in HHSHS | - | 13.5% | 3.5% |
| Excluding the top 10% of HH | −41.5% | −8.2% | - |
| Excluding the top 25% of HH | −59.4% | −21.3% | - |
| Excluding the minimum 10% of HH | 10.9% | 5.1% | - |
| Excluding the minimum 25% of HH | 26.9% | 15.7% | - |
| Including (SHS + Grid) into HHg and HHSHS | 19.2% | 7.3% | 15.9% |
© 2018 by the authors. Licensee MDPI, Basel, Switzerland. This article is an open access article distributed under the terms and conditions of the Creative Commons Attribution (CC BY) license (http://creativecommons.org/licenses/by/4.0/).
Share and Cite
Batteiger, A.; Rotter, V.S. Material Implications of Rural Electrification—A Methodological Framework to Assess In-Use Stocks of Off-Grid Solar Products and EEE in Rural Households in Bangladesh. Recycling 2018, 3, 7. https://doi.org/10.3390/recycling3010007
Batteiger A, Rotter VS. Material Implications of Rural Electrification—A Methodological Framework to Assess In-Use Stocks of Off-Grid Solar Products and EEE in Rural Households in Bangladesh. Recycling. 2018; 3(1):7. https://doi.org/10.3390/recycling3010007
Chicago/Turabian StyleBatteiger, Alexander, and Vera Susanne Rotter. 2018. "Material Implications of Rural Electrification—A Methodological Framework to Assess In-Use Stocks of Off-Grid Solar Products and EEE in Rural Households in Bangladesh" Recycling 3, no. 1: 7. https://doi.org/10.3390/recycling3010007